the Creative Commons Attribution 4.0 License.
the Creative Commons Attribution 4.0 License.
 | 15 Jul 2025
A new method to retrieve relative humidity profiles from a synergy of Raman lidar, microwave radiometer, and satellite
Chengli Ji
Qiankai Jin
Feilong Li
Yuyang Liu
Zhicheng Wang
Jiajia Mao
Xiaoyu Ren
Yan Xiang
Wanlin Jian
Peitao Zhao
Precise continuous measurements of relative humidity (RH) vertical profiles in the troposphere have emerged as a considerable scientific issue. In recent years, a combination of diverse ground-based remote sensing devices has effectively facilitated RH vertical profiling. This work introduces a newly developed approach for obtaining continuous RH profiles by integrating data from a Raman lidar, a microwave radiometer (MWR), and satellite sources. RH profiles obtained using synergistic approaches are subsequently compared with radiosonde data throughout a 5-month observational study in China. Our suggested method for RH profiling demonstrates optimal concordance with the best correction coefficients R of 0.94 in Huhehaote (HHHT), 0.92 in Yibin (YB), and 0.93 in Qingyuan (QY). The mean value of RH decreased with height and presented seasonal characteristics in QY. Finally, the RH height–time evolution was used to distinguish hail and heavy precipitation. This study integrates satellite data into ground-based measurements to retrieve RH vertical profiles in China.
- Article
(8607 KB) - Full-text XML
- BibTeX
- EndNote


Relative humidity (RH) is a crucial parameter in characterizing aerosol–cloud interactions (Fan et al., 2007). It is also necessary as input for weather forecasting models (Petters and Kreidenweis, 2007; Wex et al., 2008; Mochida, 2014). The combination of these RH profiles with aerosol optical data allows us to obtain hygroscopic growth factors for different aerosol types (Zieger et al., 2013; Granados-Muñoz et al., 2015). However, the temporal resolution of routine observations performed by weather services is rather low, typically with one or two radiosonde launches per day (Schmetz, 2021), and significant mesoscale weather phenomena, including the frontal systems movement and the formation of convective boundary hygroscopic growth or clouds, transpire rapidly. Thus, it is more challenging to adequately monitor the evolution of atmospheric profiles (Kang et al., 2019; Long et al., 2023; Chen et al., 2024). Consequently, precise information with great temporal resolution is essential for examining these events.
The current Raman lidar technology enables concurrent measurements of temperature and water vapor mixing ratio profiles to derive RH profiles (Reichardt et al., 2012; Brocard et al., 2013), but it requires calibration by the use of collocated and simultaneous observations from a radiosonde or microwave radiometer (MWR) (Mattis et al., 2002; Madonna et al., 2011; Foth et al., 2015). In addition, the average error of Raman lidar is relatively small within the effective height range but limited in the higher height detection.
MWR is another way to provide atmospheric RH observations with high temporal resolution (Hogg et al., 1983; Ware et al., 2003; Zhang et al., 2024). MWR has a certain penetration ability for harsh weather conditions, such as clouds, but its vertical resolution and accuracy are not high, especially for RH, which varies greatly (Xu et al., 2015). Thus, it is challenging to deliver continuous high-resolution RH information with a single instrument. The synergy of information from both active and passive instruments can provide a more comprehensive understanding of atmospheric processes (Stankov et al., 1995; Furumoto et al., 2003; Delanoë and Hogan, 2008; Blumberg et al., 2015; Turner et al., 2021). For example, when both Raman lidar and MWR are measuring simultaneously, continuous temperature, water vapor profiles, and thus RH profiles can be obtained operationally (Navas-Guzmán et al., 2014; Barrera-Verdejo et al., 2016; Foth and Pospichal, 2017; Toporov and Löhnert, 2020). However, most of their algorithms primarily utilize statistical methods. They perform data fusion between different instruments based on long-term time series data from individual locations. These approaches are suitable for observations at single stations. Nonetheless, they lack universality when applied to scenarios requiring data integration from multiple sites or broader geographical coverage. Moreover, replacing instruments or equipment may also introduce additional inconsistencies.
For accurate RH profile retrieval at higher heights, satellites have global detection capabilities and are highly effective for oceanic skies and remote land areas (Zhang et al., 2022; Wang et al., 2023). For example, Wang et al. (2022) measured the subgrid-scale variability in critical relative humidity (RHc) to investigate the cloud parameterization from Cloud-Aerosol Lidar and Infrared Satellite Observation (CALIPSO) data. Some deal with the retrieval of the averaged relative humidity profiles of the atmospheric layer using data from the Microwave Humidity Sounder (MHS) on board the MetOp satellite (Gangwar et al., 2014). Geostationary Operational Environmental Satellite (GOES)-13 and Moderate Resolution Imaging Spectroradiometer (MODIS) data are also combined to estimate hourly relative humidity at the surface level (Ramírez-Beltrán et al., 2019). Another sounder, Sondeur Atmospherique du Profil d'Humidite Intertropical par Radiometrie (SAPHIR) on board the Megha-Tropiques (MT) satellite, sounds the atmospheric humidity. Brogniez et al. (2013) and Gohil et al. (2013) have shown the potential of SAPHIR in retrieving the atmospheric humidity profile.
However, the time resolution of polar orbit satellites is determined by the repeated coverage time of the satellite orbit (Skou, et al., 2022). A single satellite generally only achieves repeated observations twice a day, and the time resolution is also relatively low. Furthermore, few observations are available from China's satellite, Fengyun (FY). This study aims to introduce a novel technique that integrates Raman lidar, MWR, and satellite data (FY4B) using an optimum estimating methodology. It is given with a focus on two aspects: (i) evaluation of the proposed synergetic method and (ii) investigation of the RH characteristics at different heights and in different geographic regions. This paper is thus structured as follows. Descriptions of each type of equipment are presented in Sect. 2. Section 3 illustrates the process of the new synergetic algorithm combining the ground-based and satellite data. Section 4 presents the RH statistic results and their time–height evolution in two convective cases. Finally, conclusions are summarized in Sect. 5.
2.1 Raman lidar
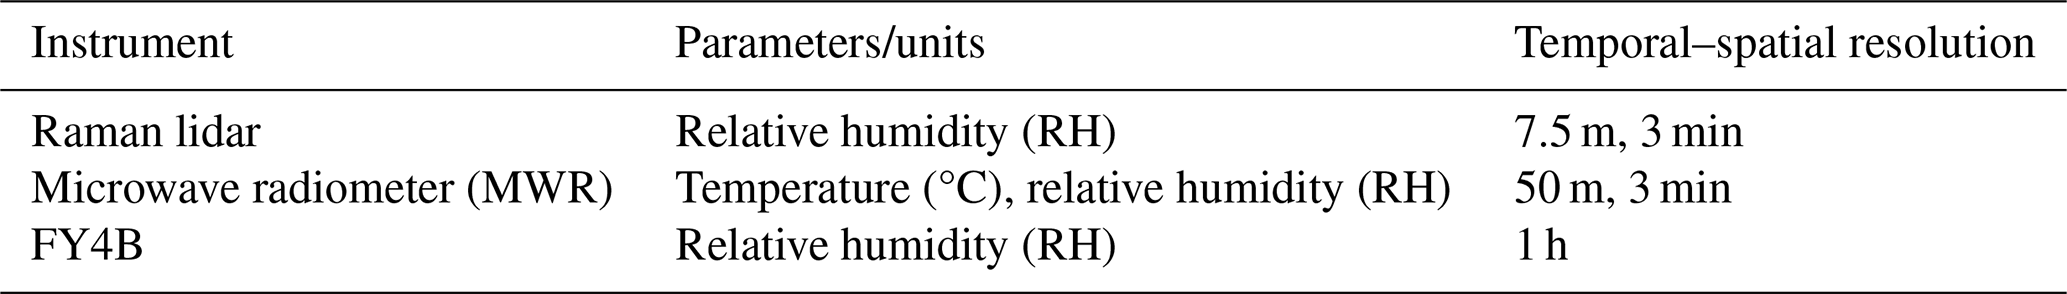
The Raman lidar method can assess the water vapor mixing ratio profiles through inelastic backscattering signals from nitrogen at 387 nm and from water vapor at 407 nm (Whiteman et al., 1992; Mattis et al., 2002; Adam et al., 2010). At the lowest height, the intersection of the laser beam with the receiver's field of view in the bistatic system is incomplete. Nevertheless, the overlap of both Raman channels is presumed to be equivalent; thus, the overlap effect could be minimal concerning water vapor measurements. The collected water vapor measurements, along with concurrent temperature profiles from a collocated MWR, allow us to obtain RH profiles. The vertical and temporal resolution of Raman lidar and other instruments are listed in Table 1.
2.2 Microwave radiometer (MWR)
The microwave radiometer (MWR) serves as a passive instrument designed to measure atmospheric emissions across two frequency bands within the microwave spectrum (Cimini et al., 2006; Crewell and Löhnert, 2007). There are seven channels set along the 22.235 GHz H2O absorption line. Humidity information can be extracted from these observations. The seven channels from 51–58 GHz within the O2 absorption complex encompass the vertical temperature profile data. Consequently, the fully automatic MWR enables the derivation of temperature and humidity profiles with a temporal resolution of up to 5 min. The method for inverting temperature and humidity profiles is the neural network method in this study. It uses statistical methods to optimize the long-term average radiosonde data and relies on previous radiosonde data (Yang et al., 2023).
2.3 Radiosonde data
We use radiosonde data from the China Meteorological Administration (CMA) station for reference analysis. The radiosonde is located in the same place as the Raman lidar and provides on-site measurements of atmospheric pressure, temperature, and RH. During the observing campaign, radiosondes were launched twice a day (08:00 and 20:00 Local Standard Time, LST). The height can be determined by the ascent time of the radiosonde balloon. The vertical resolution of the raw data is 3 m layer−1. To match other data, the vertical resolution of the raw data is interpolated to 30 m (0–3000 m) and 250 m (3000–10 000 m).
2.4 Satellite
In 2016 and 2021, China successfully deployed two second-generation geostationary meteorological satellites, Fengyun-4A (FY4A) and Fengyun-4B (FY4B). They are both equipped with the Geostationary Interferometric Infrared Sounder (GIIRS). The GIIRS therefore became the first geostationary orbiting meteorological satellite (Yang et al., 2023). This approach could achieve the detection of weather systems across China and its neighboring regions with high temporal and spatial resolution. Therefore, it enables a more comprehensive understanding of the atmospheric vertical structure, including the retrieval of atmospheric temperature profiles for 1000 m layers and moisture profiles for 2000 m layers (Yang et al., 2017). In comparison to FY4A, the GIIRS on FY4B exhibits a broader spectral range, improved spectral resolution in the long-wave IR band, and superior detection sensitivity. Specifically, the temporal resolution of GIIRS is enhanced from 2.5 h for FY4A to 2 h for FY4B. In the meantime, the spatial resolution has progressed from 16 000–12 000 m at nadir. The atmospheric humidity profiles utilized in this study, derived from GIIRS, are generated through the neural network algorithm created by the National Satellite Meteorological Centre (NSMC) (Bai et al., 2023). The data are available online: http://www.nsmc.org.cn/nsmc/cn/theme/FY4B.html (last access: 11 July 2025).
3.1 Lidar, MWR, and satellite synergetic algorithm
This study aims to obtain a continuous time series of RH profiles by integrating ground-based remote sensing techniques, including Raman lidar, MWR, and satellite data, in a straightforward manner to facilitate a wide range of applications. The retrieval process involves a systematic four-step algorithm that integrates the Raman lidar water mixing ratio profile and MWR brightness temperatures along with satellite data. The retrieval framework is shown in Fig. 1, and the retrieval process is detailed in the following paragraphs.
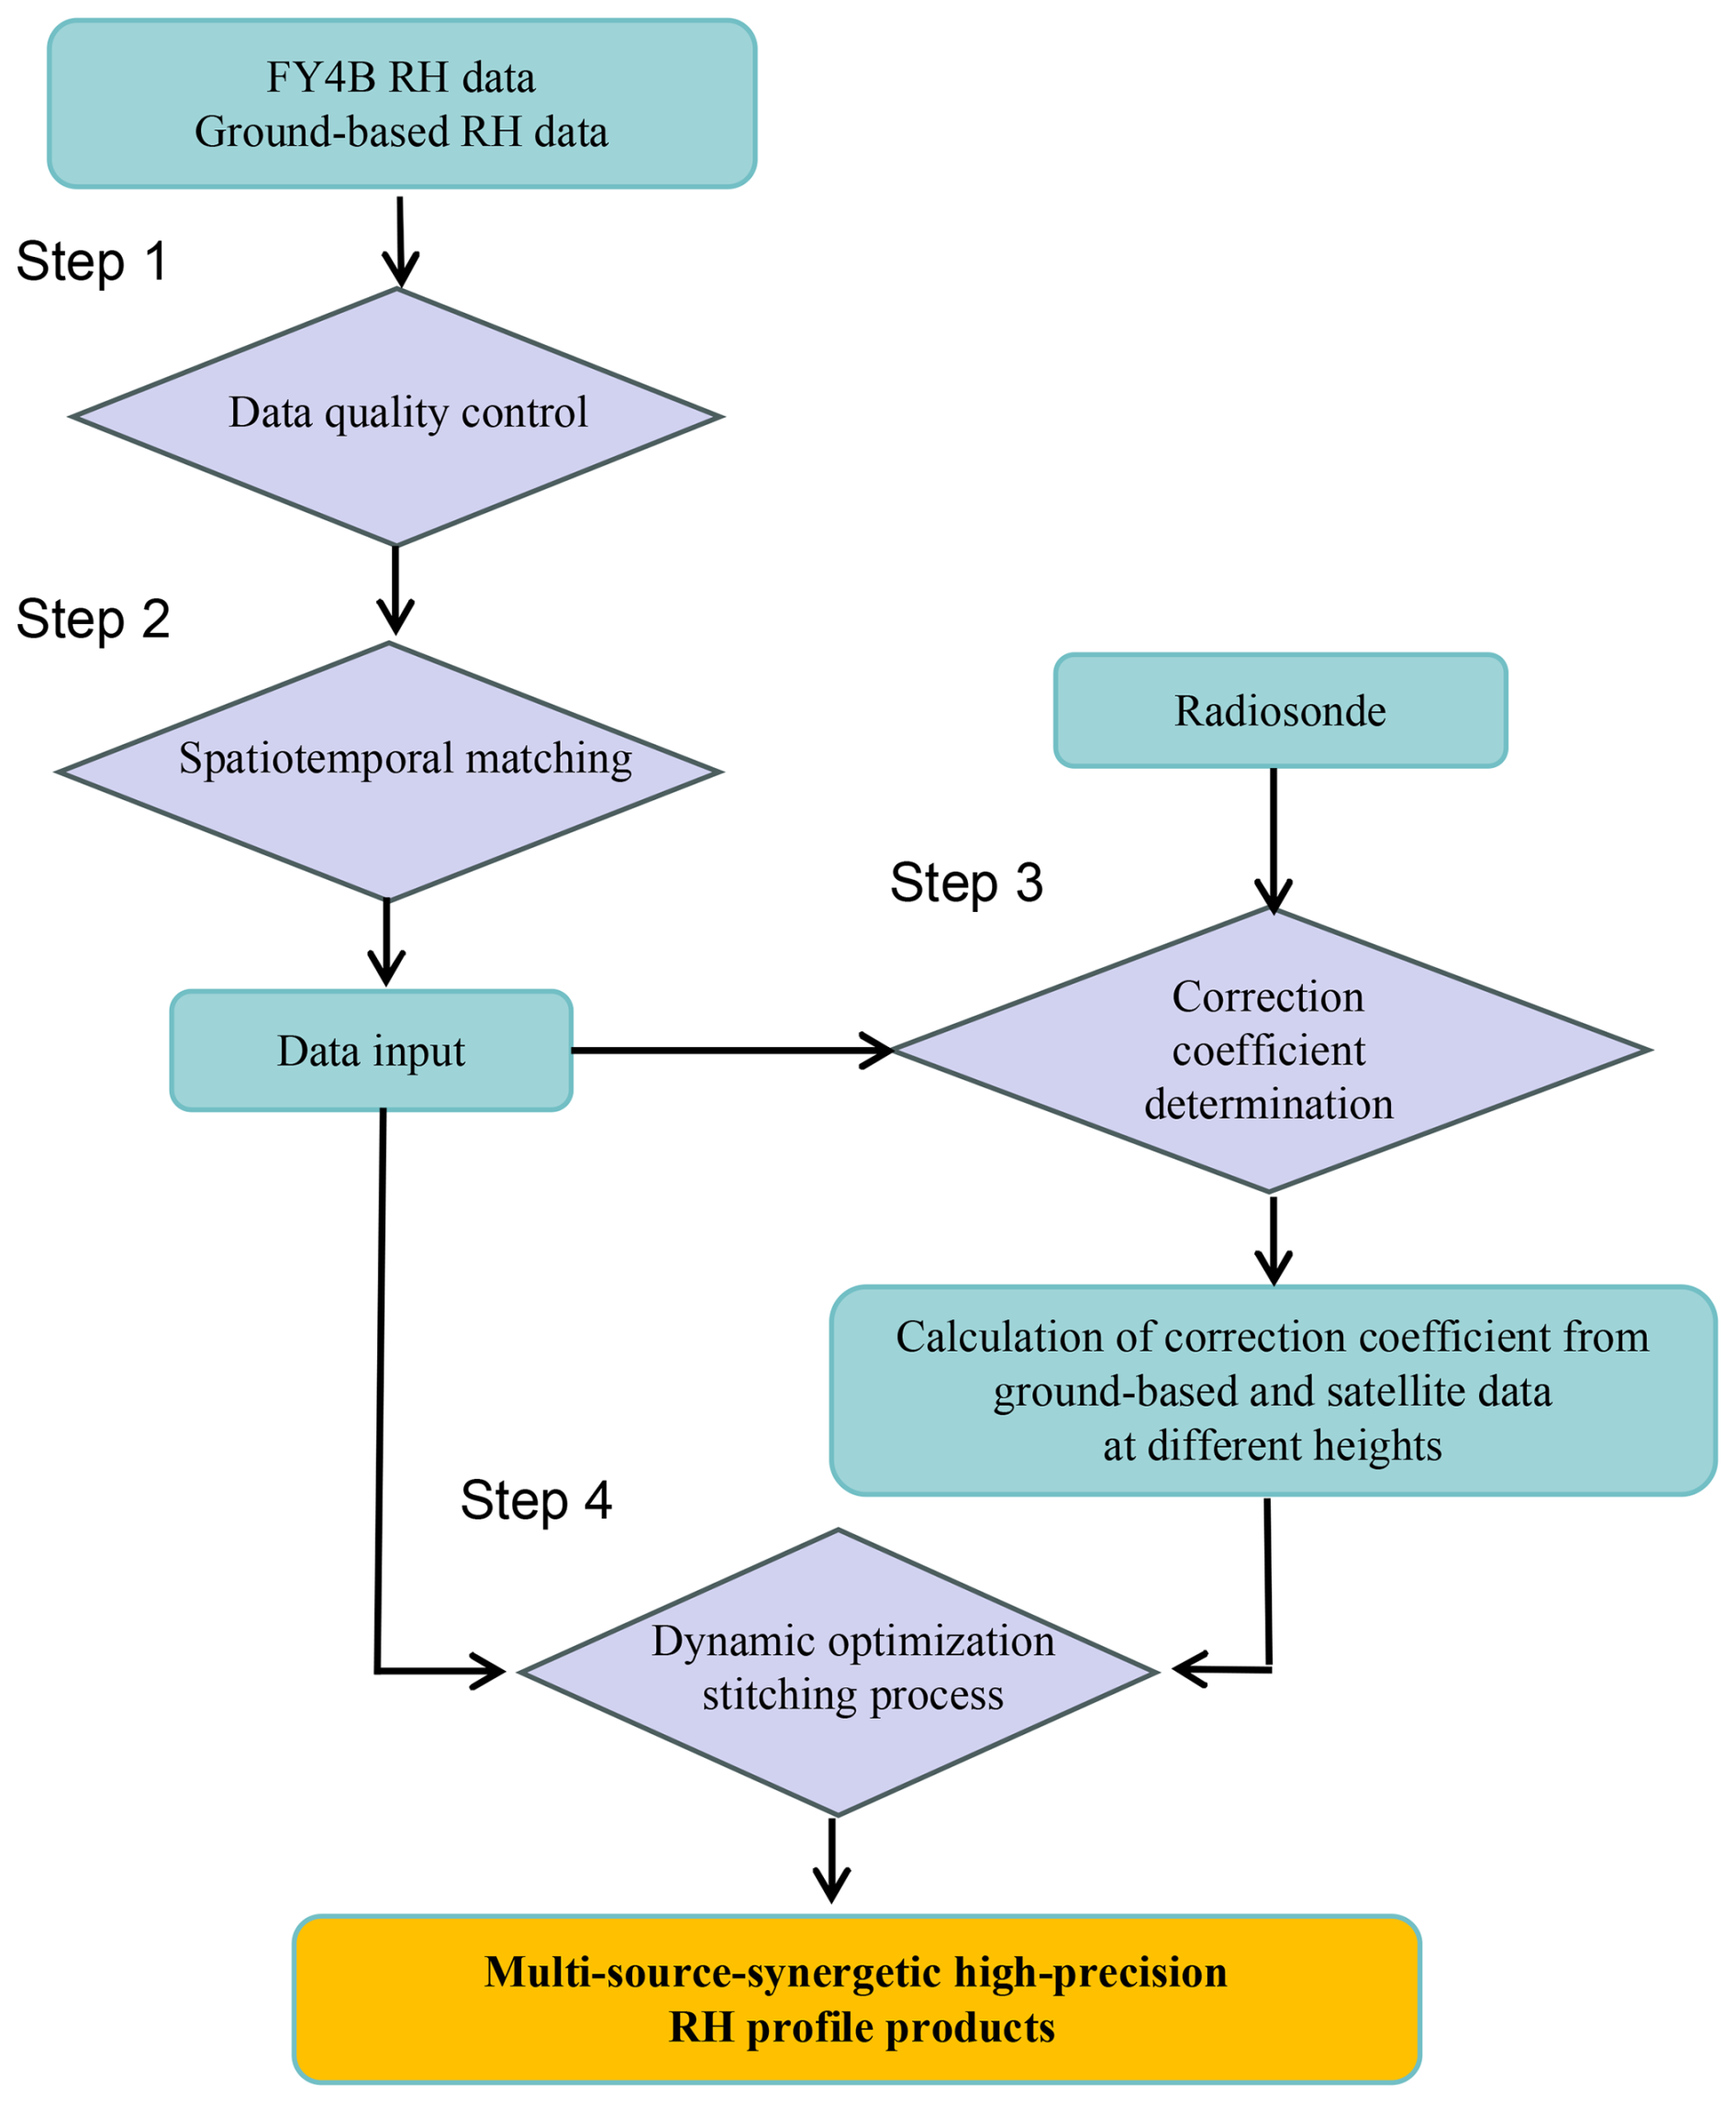
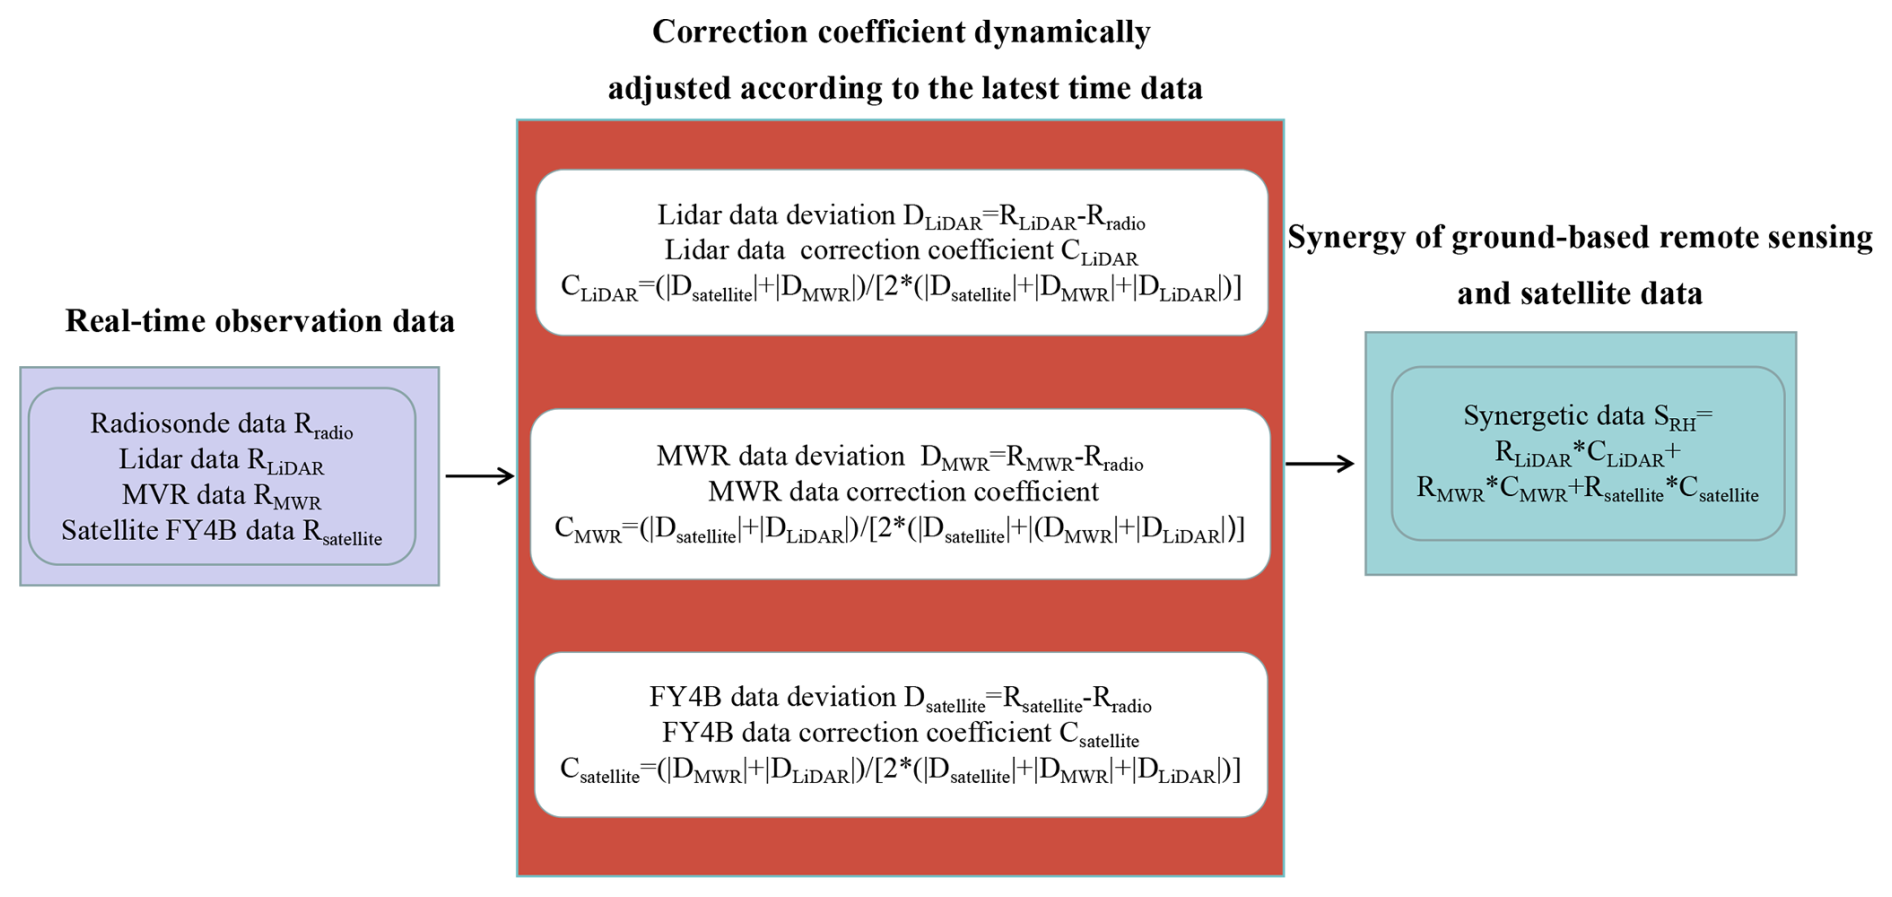
Step 1: data quality control. Data with quality control codes of 0 and 1 for FY4B and 0 for ground-based remote sensing data are selected. The lidar only retains data with a signal-to-noise ratio (SNR) greater than 3. The threshold value of the SNR is set as 3 based on our extensive comparisons with radiosonde data from CMA's long-term observations. The results indicate that selecting lidar signals with SNR>3 can significantly improve the consistency between retrieved RH profiles and radiosonde measurements. Therefore, in the data selection period, the Raman signal starts with the first SNR greater than 3 and ends with five consecutive SNRs less than 3. The real-time observing data are designated as Rradio, Rlidar, RMWR, and Rsatellite in Fig. 2.
Step 2: data spatial–temporal matching. This process aims to match the above quality-controlled data with the radiosonde data at a height of 0–10 000 m in time and space. For the time matching, temperature from MWR and water vapor data from Raman lidar are selected corresponding to the radiosonde data time (08:00 LST and 20:00 LST). In terms of spatial matching, the FY4B data are selected from the nearest grid point to the ground observing station for the horizontal scale. The data at vertical heights are interpolated to the resolution of 30 m (0–3000 m) and 250 m (3000–10 000 m).
Step 3: correction coefficient determination. The deviation between the temperature and humidity data of satellites and ground-based remote sensing data at each height is quantitatively calculated and analyzed to prepare for the optimal stitching process in the next step. Here, the deviations of lidar, MWR, and FY4B are designated as Dlidar, DMWR, and Dsatellite, respectively.
The correction coefficients Clidar, CMWR, and Csatellite are calculated as follows.
Step 4: synergetic algorithm iteration and evaluation. Based on the above spatial–temporal data matching and correction coefficient calculation at different heights, a dynamic optimal stitching algorithm (Fig. 2) is conducted. To ensure the independence between the tested sample and the true value, the temperature and humidity profiles of the current time are fused using the correction coefficient of the previous time and then compared with the radiosonde data at the same time for evaluation. The correlation coefficient (R), the root-mean-square error (RMSE), and the mean bias (MB) are used as inspection indexes. Finally, the retrieved RH information SRH could be obtained through the following equation.
From this process, we can see that, compared to these existing techniques, our new method not only incorporates satellite data but also dynamically determines optimal fusion coefficients. Because the fusion coefficients are dynamically determined by comparing the deviations from other measurements with the reference of radiosonde, they highlight that this new algorithm is real-time calibrated and that it can guarantee the device model independence and geographical adaptability. Thus, it eliminates constraints imposed by equipment specifications or observation locations, ensuring broad applicability across diverse scenarios.
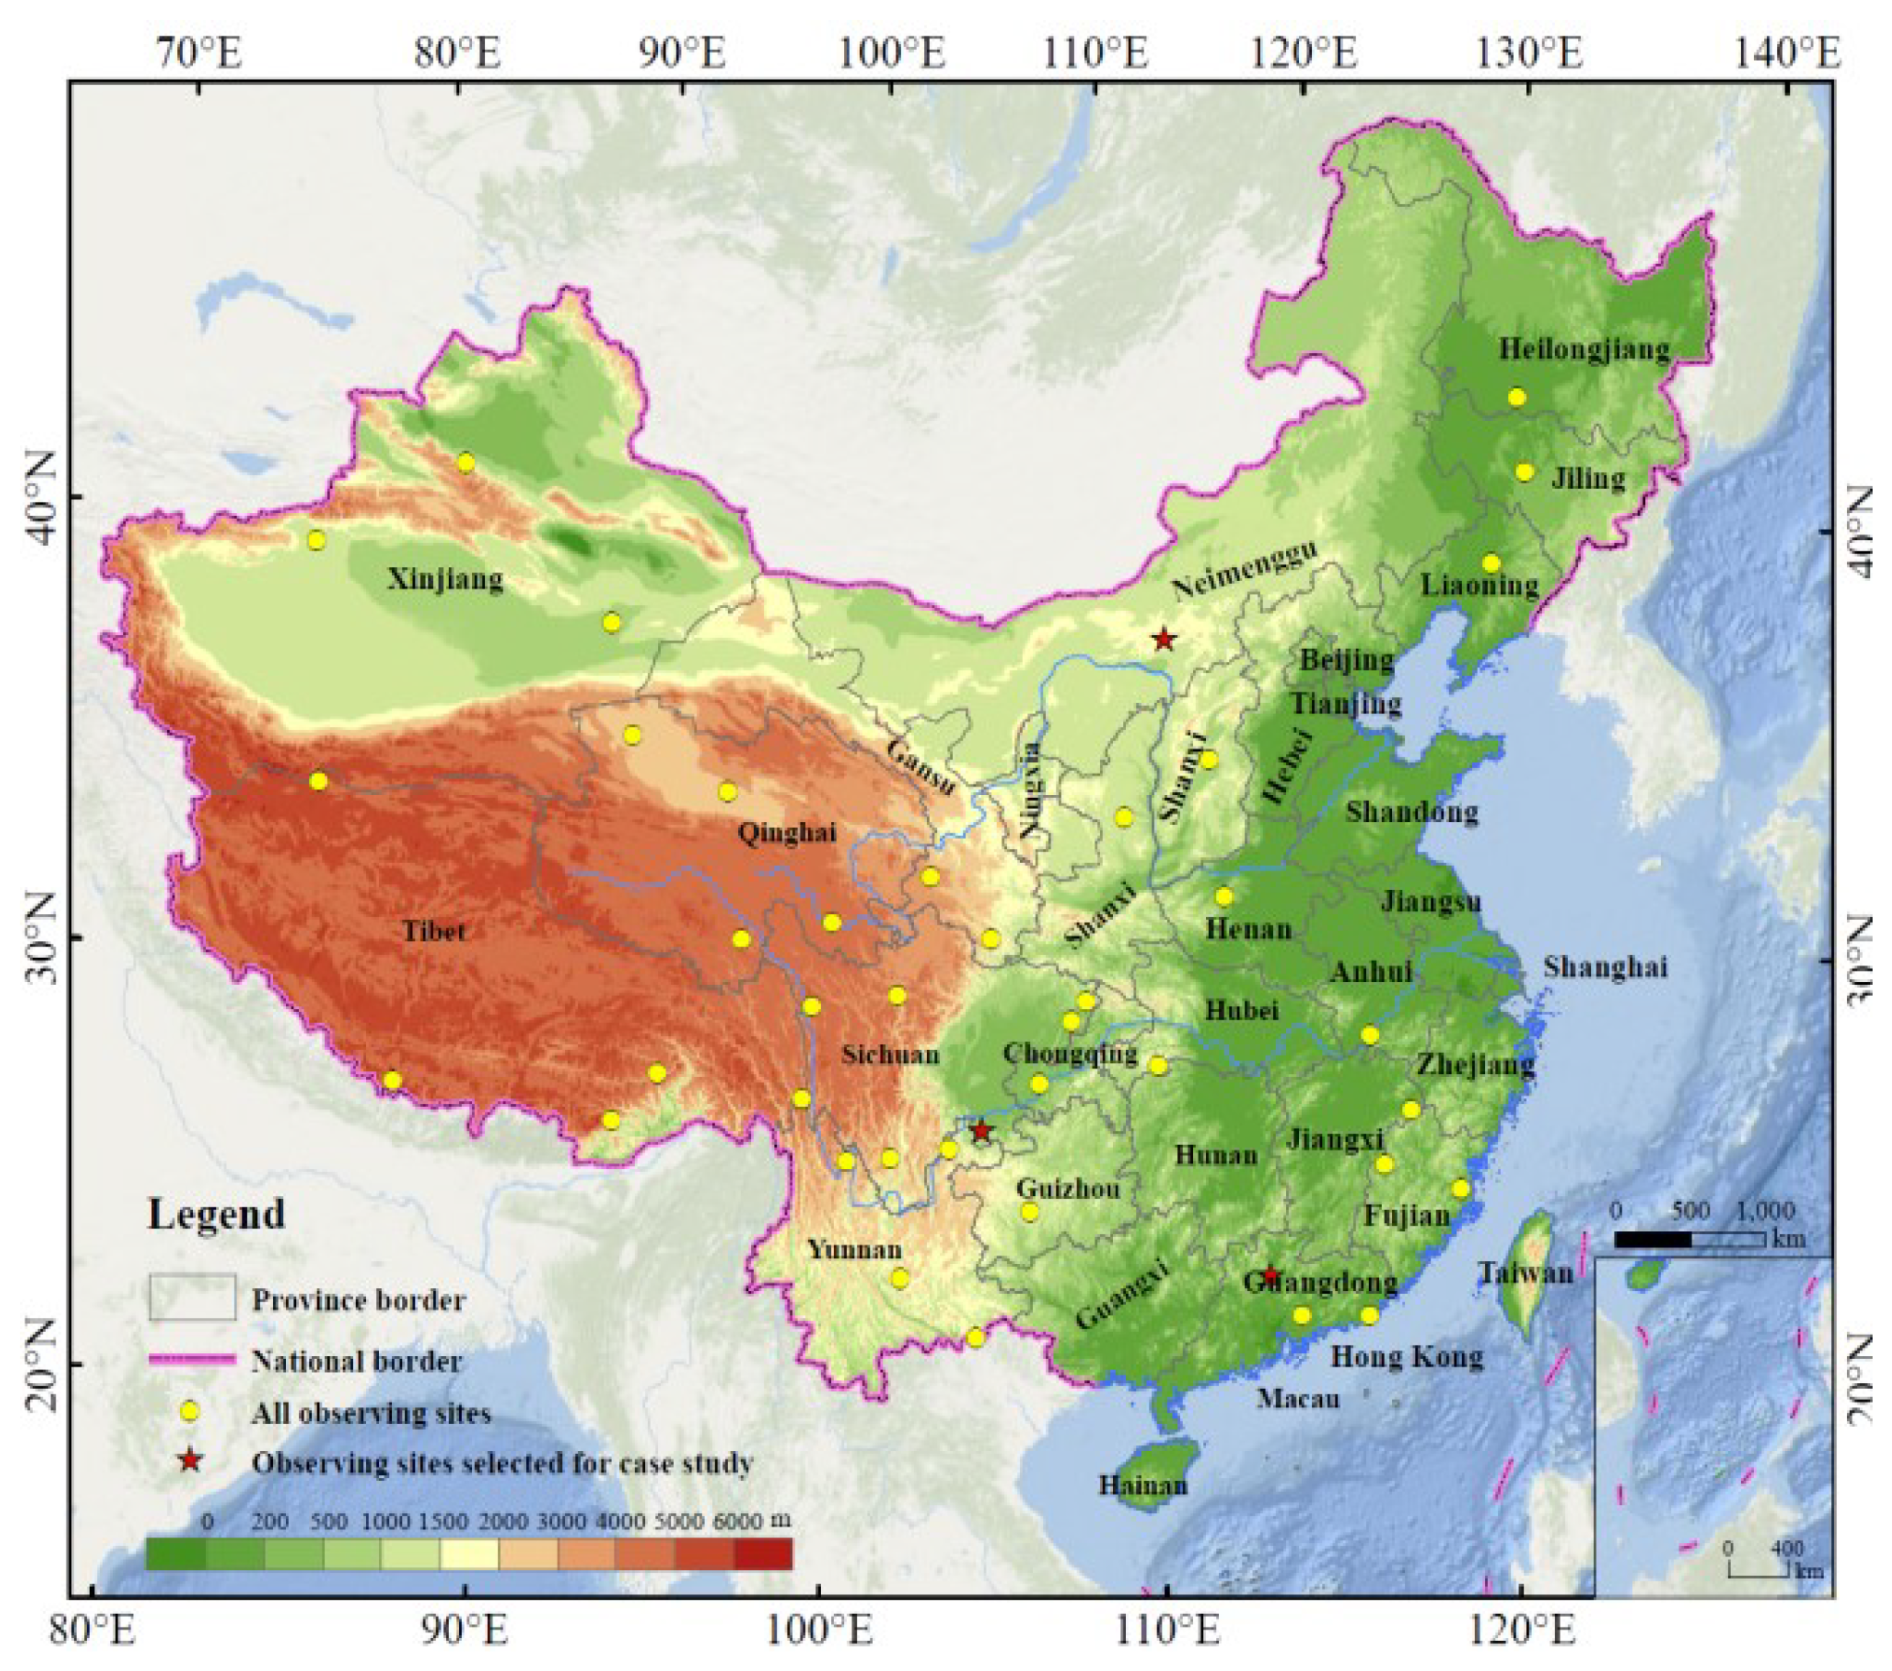
Figure 3The observation sites (yellow circles) and three selected sites (red stars) for statistics and case studies are marked in Fig 3.
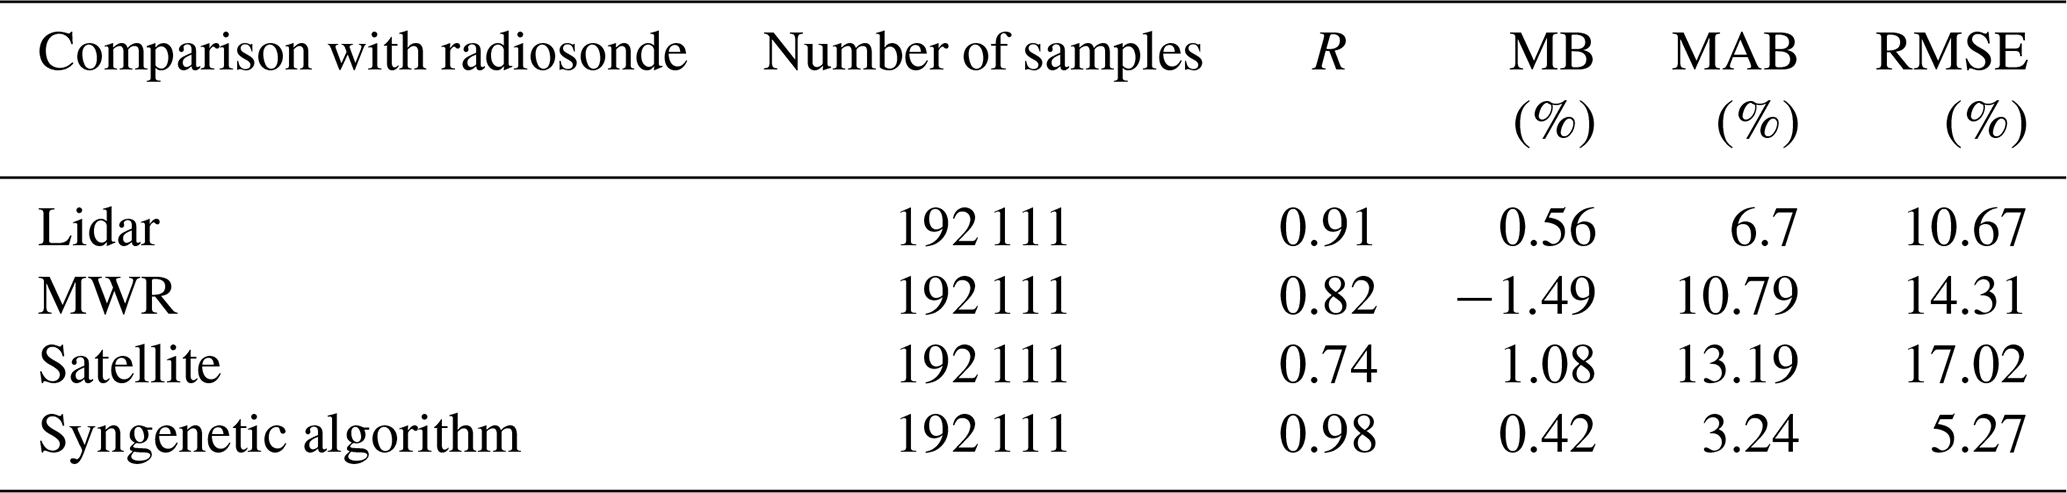
Table 2Assessment of the accuracy of four RH retrieval results (lidar, MWR, satellite, and synergetic algorithm) compared with radiosonde at 47 sites in China.
3.2 Error analysis
To evaluate the performance of the synergetic algorithm for RH profiles, a comparative analysis was conducted between retrieved values and actual radiosonde measurements. Let N represent the total number of samples. The measured value is designated as Oi, with i representing the sample label. The value obtained through the new synergetic algorithm is designated as Gi. The evaluation indicators consist of MB, mean absolute bias (MAB), and RMSE, defined by the following equations.
4.1 General statistic information
A 5-month data set has been chosen for a statistical analysis of RH profiles. The observation period spans 1 July–30 November 2024. The observation elements are RH data from 47 stations in China (yellow circles in Fig. 3) at the height of 0–10 000 m. To investigate RH retrieval accuracy, we provide the comparison results of four methods (lidar, MWR, satellite, and synergetic algorithm) utilizing the radiosonde data as the reference at 47 sites in Table 2. Then, Huhehaote (HHHT; northern China), Yibin (YB; middle China), and Qingyuan (QY; southern China) are selected as 3 representative sites (red stars in Fig. 3) for more detailed analysis, as shown in Fig. 4 and Table 3. The data samples for HHHT, YB, and QY are 3773, 7452, and 8110, respectively, after quality control and elimination of the precipitation data.
Table 3The same as Table 2 but at three representative sites in China.
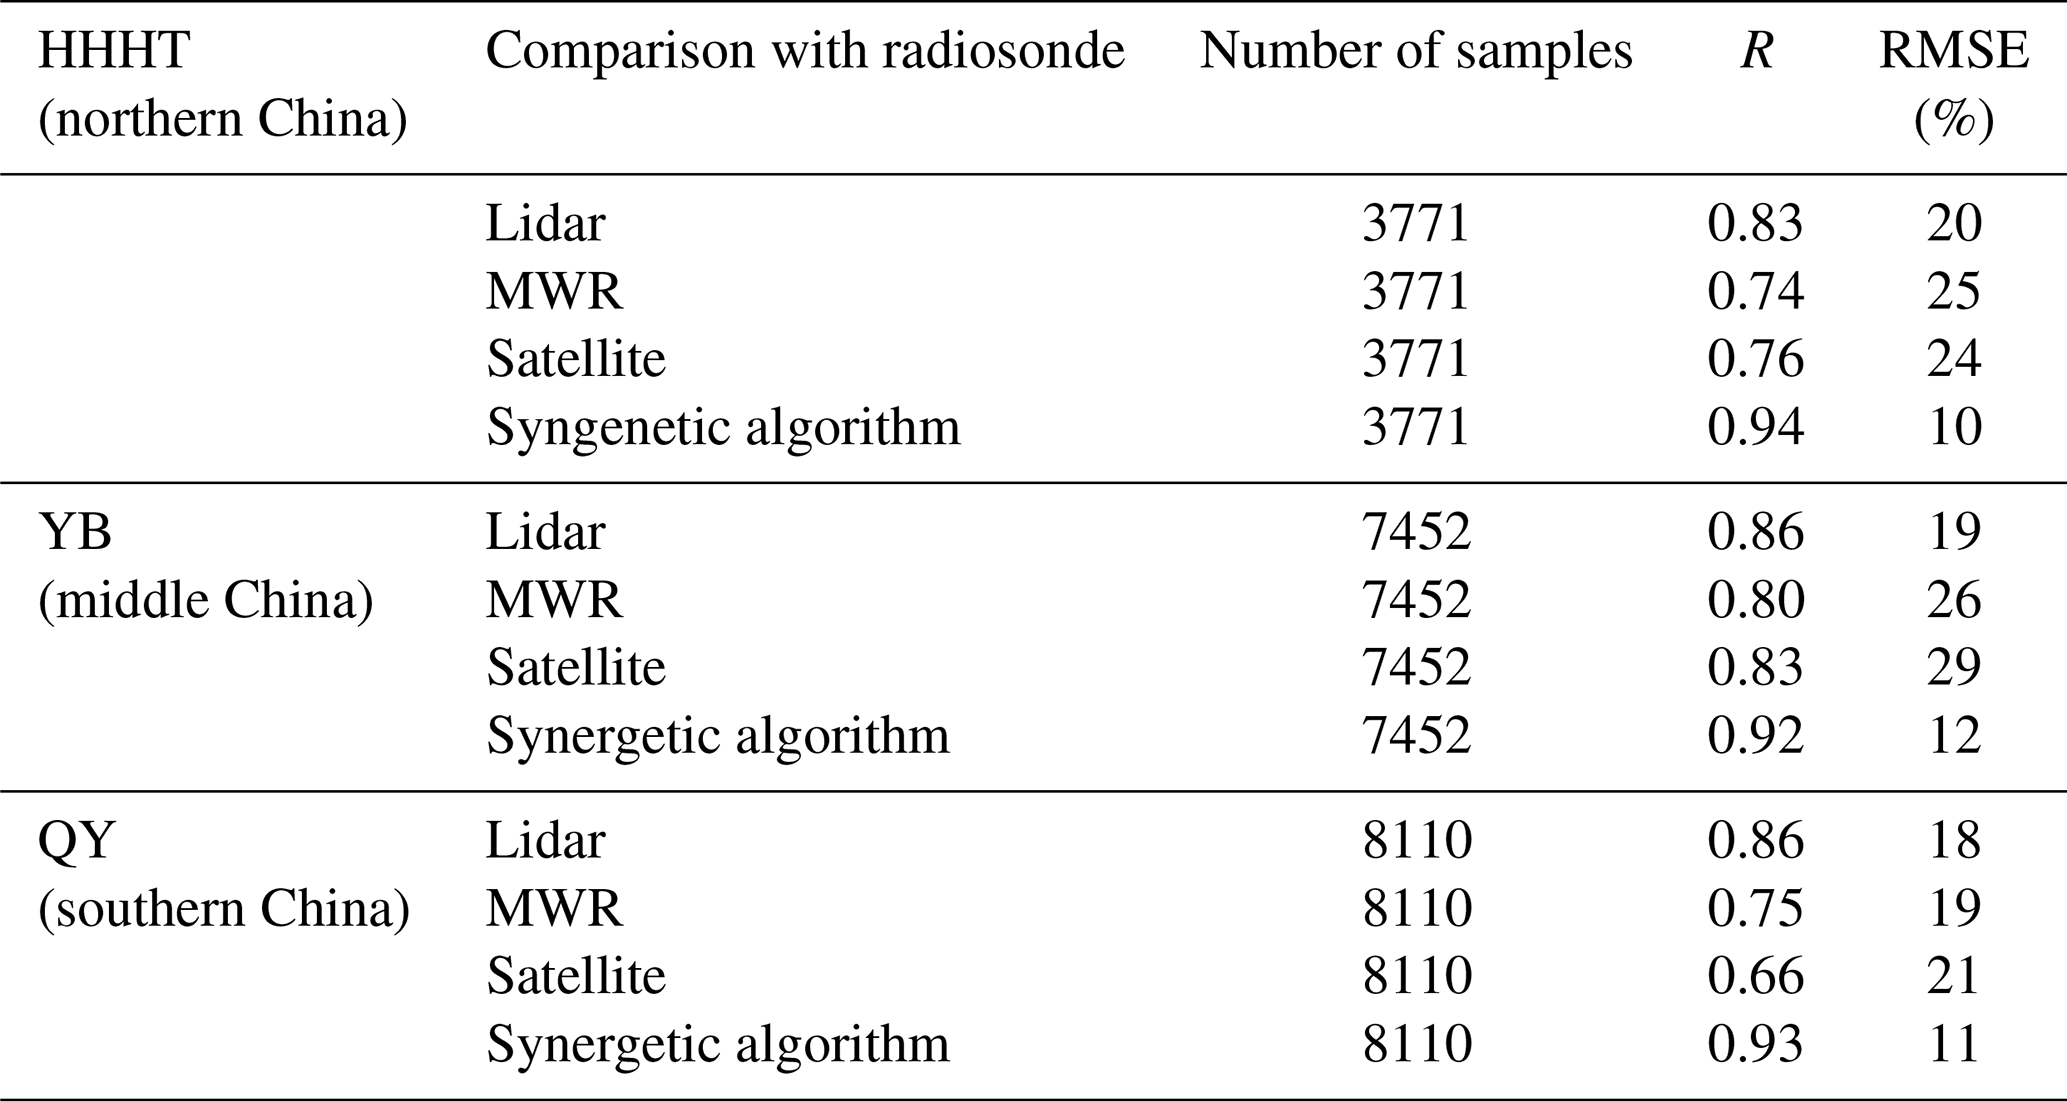
Generally, the synergetic algorithm at 47 sites presents the maximum correlation coefficient R value of 0.98 with the minimum RMSE of 5.27 % in Table 2. For three representative sites, the regression line from the synergetic algorithm at all heights similarly provides the best-fitting results, with the largest correlation coefficients R of 0.94, 0.92, and 0.93 in HHHT, YB, and QY, respectively (Table 3). The correlation coefficient R for lidar measurement follows with marginally higher values of 0.83 in HHHT, 0.86 in YB, and 0.86 in QY. It indicates its greater applicability compared to other single instruments. MWR presents the lowest R of 0.74 and 0.80 in HHHT and YB, performing better (R=0.75) than satellite (R=0.66) in QY. In terms of RMSE, the lidar-, MWR-, and satellite-derived RH all show values larger than 18 % at three sites. The synergistic use of a multi-source algorithm decreases the RMSE to the lowest value of 10 % in HHHT.
The regression line for lidar and MWR in HHHT, as illustrated in Fig. 4, exhibits a slope that is less than the one-to-one line. This implies that greater variations arise with increased RH in HHHT. Though the synergetic algorithm also presents similar trends, its RMSE decreased to 10 % in HHHT. The regression lines of lidar and MWR in YB and QY are larger than the one-to-one line, indicating the larger bias for less humidity.
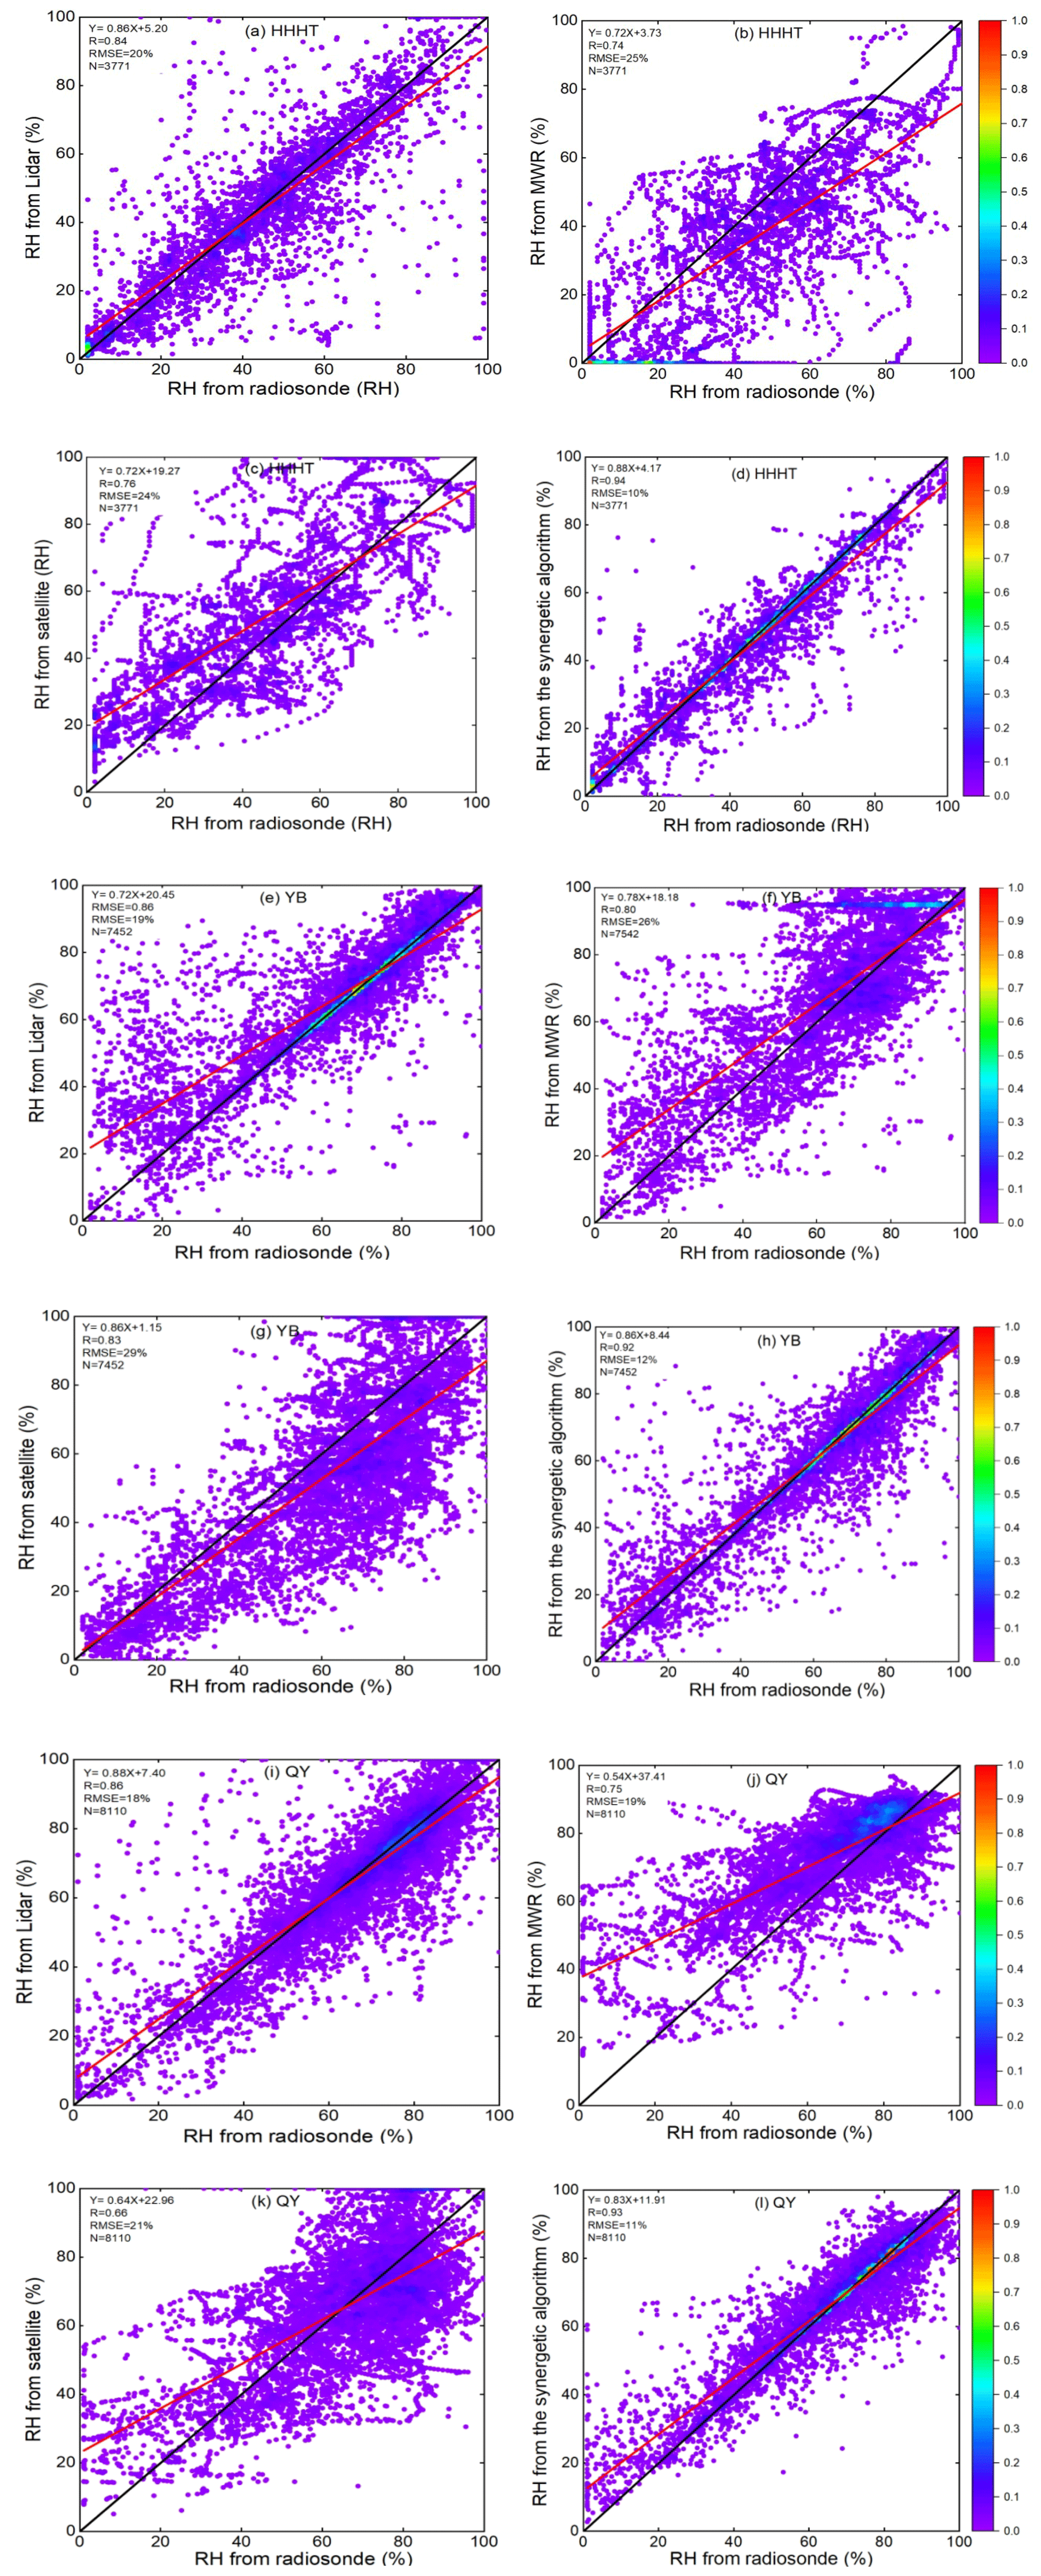
Figure 4RH results retrieved with four methods (lidar, MWR, satellite, and synergetic algorithm) compared with radiosonde at three sites in China from 1 July–31 November 2024. (a) Comparison between lidar and radiosonde in HHHT, (b) comparison between MWR and radiosonde in HHHT, (c) comparison between satellite and radiosonde in HHHT, (d) comparison between synergetic algorithm and radiosonde in HHHT. (e–h) The same as panels (a–d) but in YB. (i–l) The same as panels (a–d) but in QY. The red line shows the regression line. The black line is the one-to-one line.
As RH vertical profiles are height-dependent, Fig. 5 presents the MB profiles observed at different heights in terms of four methods. Generally, the MB in the RH of lidar in the lower troposphere (below 3000 m) outperforms the other two single methods (MWR and satellite) at three sites. No significant biases between radiosonde and lidar are noticeable. Specifically, the lowest MB values (4.93 % in HHHT, 2.63 % in YB, and 2.40 % in QY) in the comprehensive region of the tropospheric region are achieved when lidar data are incorporated into the synergetic algorithm. This is because lidar is an active remote sensing technology with more accuracy compared to MWR and satellite. The lidar data's efficacy is enhanced at heights below 3000 m when integrated with data from other sources within the boundary layer.
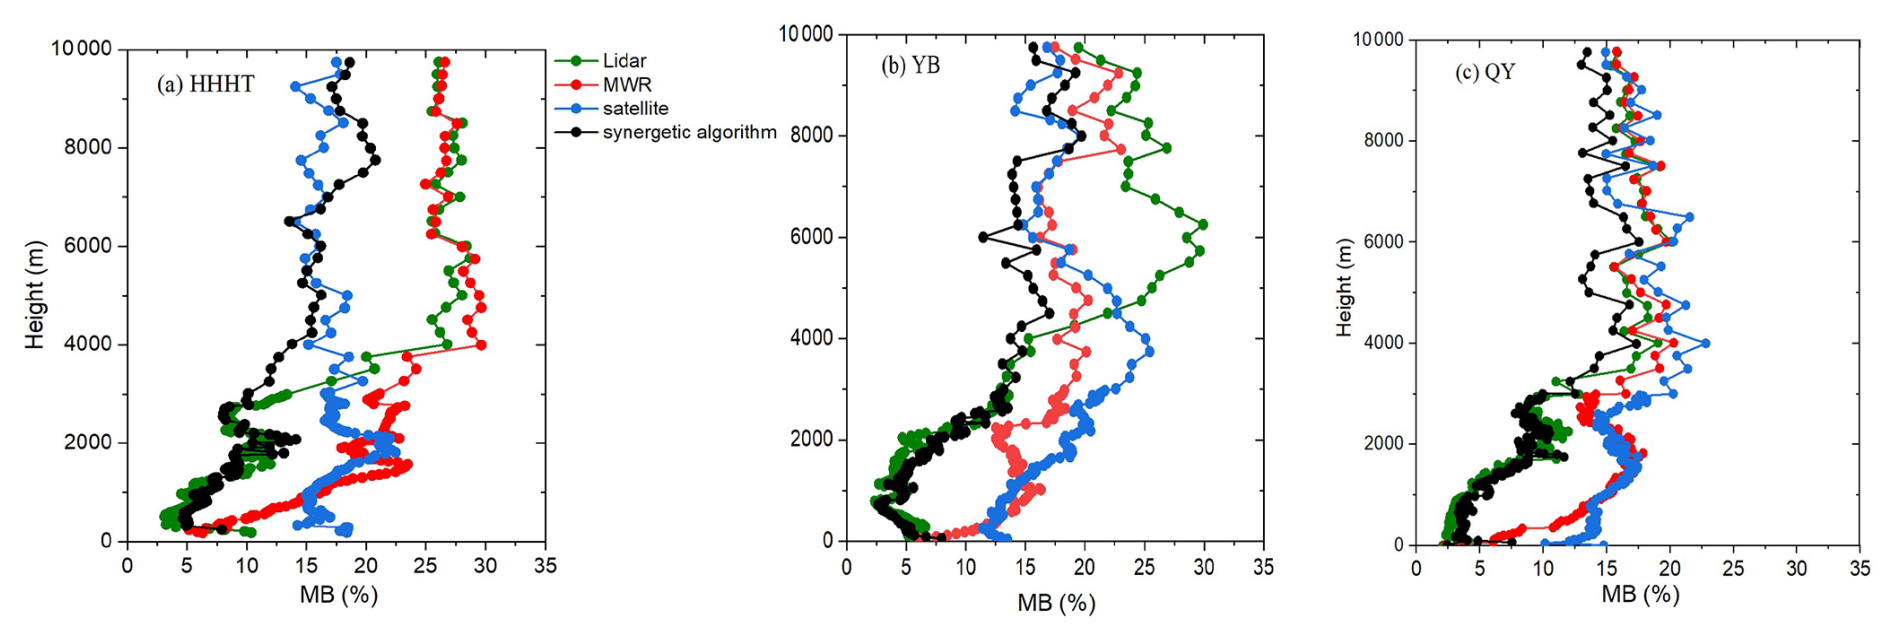
Figure 5RH vertical mean bias (MB) profiles retrieved from lidar, MWR, satellite, and synergetic algorithm compared to the radiosonde data in (a) HHHT, (b) YB, and (c) QY.
However, the MB from lidar increased drastically above this height, up to the highest value of 28.67 % in HHHT, 29.91 % in YB, and 20.09 % in QY. It is reasonable that the atmosphere changes so fast that radiosondes do not assess exactly the same air mass as lidar. In the meantime, lidar is increasingly constrained at elevated heights because of a decreased SNR; hence lidar is more trustworthy in the lower layer, i.e., below 3000 m.
In contrast, the MB from satellite (FY4B) over 3000 m varied steadily within the range of approximately 15 % at three sites. Therefore, the satellite data in the far height range would be more reliable and could be employed in the synergetic algorithm at higher layers. Compared to lidar and satellite, the MB from MWR gives the largest uncertainty in HHHT at all heights. This may result from the discrepancy between the temperature recorded by the radiosonde and that obtained from the MWR in HHHT. However, it yields relatively less variation than lidar and satellite in YB and QY. In any case, the synergetic method gives the best result over three observing sites at almost all heights, and accurate measurements of RH vertical profiles provided here are highly beneficial for analyzing the hygroscopic growth of local aerosols.
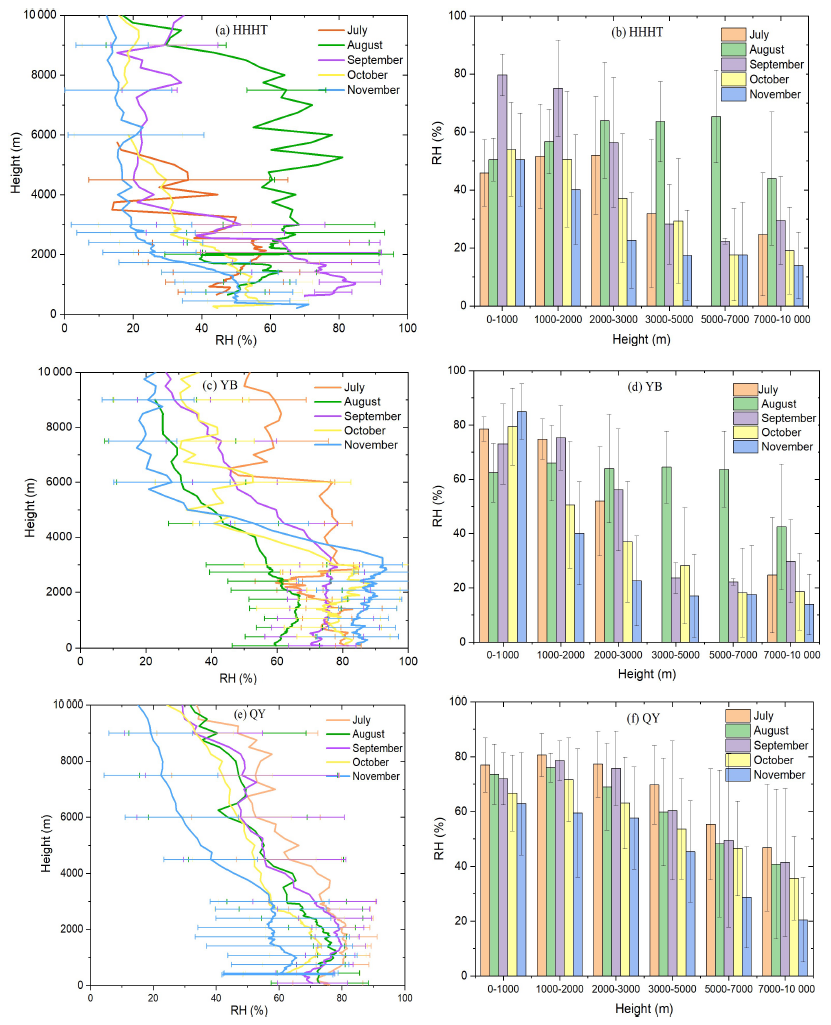
Figure 6RH monthly vertical profiles (left) and monthly mean values for different heights (right) in (a, b) HHHT, (c, d) YB, and (e, f) QY. The error bars indicate the standard deviation.
The sources of the discrepancy can stem from several aspects. Firstly, although all instruments are collocated in the ground, radiosondes deviate at higher heights. Signals can be disrupted if clouds are present. Secondly, satellites provide gridded data, requiring the selection of ground observation points closest to the grid's latitude and longitude, which introduces uncertainty. Finally, both MWR and satellite are passive remote sensing technologies, which are inherently less precise than active remote sensing technologies. Besides the inherent hardware difference, the errors during the retrieval process (e.g., neural networks for MWR) are also unavoidable.
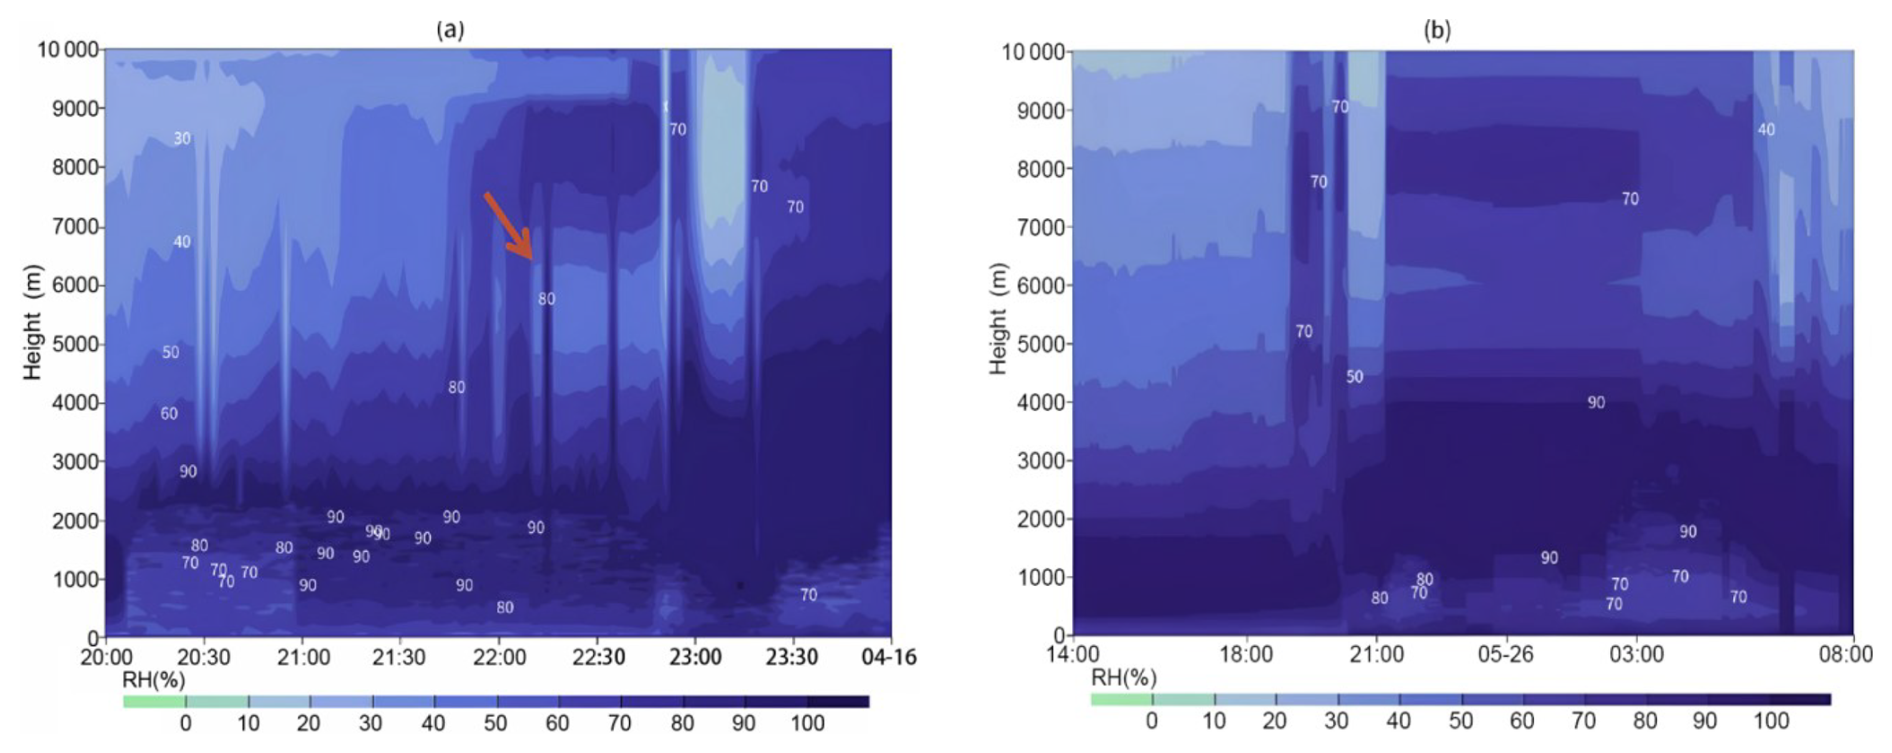
Figure 7Height–time display of RH from the synergetic retrieval during two convective cases (a) from 20:00 LST to 23:30 LST on 15 April and (b) from 14:00 LST on 25 May to 08:00 LST on 26 May 2024 in YB. The red arrow indicates the lower humidity in the layer when the hailfall occurred in the first convective case.
4.2 Mean monthly analysis
RH mean monthly vertical profiles have been derived from the synergistic method illustrated in Fig. 6 because RH profiles are retrieved from water ratio profiles and temperature profiles. For this property, the RH seasonal behavior may be more complicated. For example, no obvious seasonal behavior of RH profiles is found in HHHT or YB. However, QY still presents the most likely seasonal characteristic at most of the heights, with the highest mean values in summer at 1000–2000 m (80.65 % in July) and the lowest values at 7000–10 000 m in late autumn (20.50 % in November) in Fig. 6e and f. The elevated RH observed in QY's summer may be related to the sufficient water vapor and large transport volume, as QY is located in coastal areas. So the characteristic of QY would be more dependent on water vapor.
For comparison, HHHT and YB are relatively random. At over 3000 m in HHHT (Fig. 6a and b), RH in August shows predominantly high values, with the highest value of 65.37 % at 5000–7000 m. Unlike in HHHT and QY, the RH profiles of YB in November interestingly show the highest values (83.95 %) in the lower atmosphere (0–1000 m) in Fig. 6c and d. This suggests that the reduced temperatures observed in autumn of YB promote proximity to saturation conditions, resulting in elevated RH values in November. It is also worth noting that RH above 3000 m in November of YB decreases dramatically as height increases, with the minimum RH of 13.91 % at 7000–10 000 m. This could be explained by more rapid fluctuations in the water vapor density and temperature in YB in the higher layer under the control of the subtropical monsoon climate zone. In any case, this plot illustrates a clear decrease in the RH values with heights at three sites.
Though there is no obvious RH uncertainty caused by regional differences, we found that QY exhibits the predominant seasonal feature throughout most heights. In contrast, no discernible seasonal characteristics in RH profiles are observed in HHHT or YB. Thus, we believe diverse atmospheric circulation patterns and geographical environments could result in regional variations in RH values.
4.3 Case analysis
We selected two different severe convective events in YB (one hailfall from 20:00–23:30 LST on 15 April and one heavy precipitation from 14:00 LST on 25 May to 08:00 LST on 26 May) for comparison in Fig. 7. At 23:00 LST on 15 April, a thunderstorm with strong winds and hail occurred. The RH profile retrieved by the synergetic algorithm showed that, before 22:00 LST, the RH was high (around 90 %) at 3000 m height, low (20 %–50 %) between 3500 m and 8000 m, and above 80 % between 8000 m and 9000 m (Fig. 7a). This indicates that, before the severe convection, the upper and lower layers were relatively moist, while the middle layer (3500–8000 m) was dry (red arrow in Fig. 7a). Such conditions favor the evaporation and cooling of ice particles descending from the upper atmosphere, leading to refreezing and hail formation.
In contrast, the RH profile from 25–26 May showed that the entire troposphere (0–10 000 m) presented high RH values (>70 %) starting at 19:00 LST, which was conducive to heavy precipitation (Fig. 7b). According to ground station observations, YB recorded an hourly rainfall of 52 mm at 21:00 LST, along with gale-force winds of 23 m s−1 (9th grade). Most areas in YB experienced precipitation, with localized heavy thunderstorms. From the above two cases, we can see that the RH in the middle troposphere can be used to distinguish between hail and heavy precipitation during severe convective events.
This study presents relative humidity (RH) measurements with a developed synergetic algorithm with the combination of Raman lidar, MWR, and satellite at three sites (northern China, middle of China, and southern China) from 1 July–31 November 2024. The methodology for obtaining RH from the synergetic algorithm was introduced. The 5-month field campaign was performed, and linear regression between the lidar, MWR, satellite, synergetic algorithm, and radiosonde data at the range of 0–10 000 m was presented to testify the accuracy.
Strong correlations of RH values over 0.9 were observed between radiosonde measurements and profiles derived from the synergetic approach at three representative sites in China. The lowest MB values (4.93 % in HHHT, 2.63 % in YB, and 2.40 % in QY) are observed when lidar data are integrated into the synergetic algorithm, which highlights the accuracy of the lidar data below 3000 m. However, the MB from lidar increased drastically above this height, which suggests the greater applicability of satellite or MWR in the middle and higher layers. In terms of the seasonal characteristic, QY exhibits the predominant seasonal feature throughout most heights, with peak mean values of 80.65 % in July at 1000–2000 m and minimal values of 20.50 % in November at 7000–10 000 m. Finally, the RH evolution in two convective events in YB suggests that the RH in the middle troposphere can be taken as a good indicator to distinguish hail and heavy precipitation.
These results validate the capabilities of the newly developed method to deliver accurate measurements of RH information throughout the troposphere. They also explore the potential of satellite data integration for RH profile retrieval for the first time. However, there are still problems with individual data at certain times during the fusing process. For example, there are few effective data filtered by quality-control methods for FY4B data. Therefore, the matching accuracy and more high quality FY4B data will be improved in future development.
Raman lidar, MWR, satellite, radiosonde, and other auxiliary data used to generate the results of this paper are available from the authors upon request (email: zychen@btbu.edu.cn).
CJ and ZC conceived the study. JM, ZW, and XR conducted the field measurements. ZC, CJ, QJ, FL, YL, and WJ carried out the data analysis. PZ and YX offered academic help for this research. ZC and CJ wrote the paper with inputs from all co-authors.
The contact author has declared that none of the authors has any competing interests.
Publisher's note: Copernicus Publications remains neutral with regard to jurisdictional claims made in the text, published maps, institutional affiliations, or any other geographical representation in this paper. While Copernicus Publications makes every effort to include appropriate place names, the final responsibility lies with the authors.
This work was supported by the Innovation and Development Special Project of the China Meteorological Administration (grant nos. CXFZ2024J011 and CXFZ2024J057), the Innovation Team of the China Meteorological Administration (grant no. CMA2023QN11), the National Key Research and Development Program of China (grant no. 2024YFC3711700), and a project (Simulation of cloud lidar echo signal and study on cloud microphysics characteristics) of the Aerospace Information Innovation Research Institute at the Chinese Academy of Sciences. The authors thank the colleagues who participated in the operation of the lidar system at our site. We also acknowledge the CMA for the satellite (FY4B) data and radiosonde data (https://ladsweb.modaps.eosdis.nasa.gov, last access: 11 July 2025) and the European Centre for Medium-range Weather Forecasts (ECMWF) for the ERA5 reanalysis data (https://climate.copernicus.eu/climate-reanalysis, last access: 11 July 2025).
This research has been supported by the Innovation and Development Special Project of the China Meteorological Administration (grant nos. CXFZ2024J011 and CXFZ2024J057), the Innovation Team of the China Meteorological Administration (grant no. CMA2023QN11), the National Key Research and Development Program of China (grant no. 2024YFC3711700), and a project (Simulation of cloud lidar echo signal and study on cloud microphysics characteristics) of the Aerospace Information Innovation Research Institute at the Chinese Academy of Sciences.
This paper was edited by Yuanjian Yang and reviewed by two anonymous referees.
Adam, M., Demoz, B. B., Whiteman, D. N., Venable, D. D., Joseph, E., Gambacorta, A., Wei, J., Shephard, M. W., Milosevich, L. M., Barnet, C. D., Herman, R. L., Fitzgibbon, J., and Connell, R.: Water Vapor Measurements by Howard University Raman LiDAR during the WAVES 2006 Campaign, J. Atmos. Ocean. Tech., 27, 42–60, https://doi.org/10.1175/2009JTECHA1331.1, 2010.
Bai, W., Zhang, P., Liu, H., Zhang, W., Qi, C., Ma, G., and Li, G.: A fast piecewise-defined neural network method to retrieve temperature and humidity profile for the vertical atmospheric sounding system of FengYun-3E satellite, IEEE T. Geosci. Remote, 61, 4100910, https://doi.org/10.1109/tgrs.2023.3247776, 2023.
Barrera-Verdejo, M., Crewell, S., Löhnert, U., Orlandi, E., and Di Girolamo, P.: Ground-based lidar and microwave radiometry synergy for high vertical resolution absolute humidity profiling, Atmos. Meas. Tech., 9, 4013–4028, https://doi.org/10.5194/amt-9-4013-2016, 2016.
Blumberg, W. G., Turner, D. D., Löhnert, U., and Castleberry, S.: Ground based temperature and humidity profiling using spectral infrared and microwave observations, Part II: Actual retrieval performance in clear-sky and cloudy conditions, J. Appl. Meteorol., 54, 2305–2319, 2015.
Brocard, E., Jeannet, P., Begert, M., Levrat, G. Philipona, R., Romanens, G., and Scherrer, S. C.: Upper air temperature trends above Switzerland 1959–2011, J. Geophys. Res.-Atmos., 118, 4303–4317, https://doi.org/10.1002/jgrd.50438, 2013.
Brogniez, H., Kirstetter, P. E., and Eymard, L., Expected improvements in the atmospheric humidity profile retrieval using the Megha-Tropiques microwave payload, Q. J. Roy. Meteor. Soc., 139, 842–851, https://doi.org//10.1002/qj.1869, 2013.
Chen, Z. Y., Ji, C. L., Mao, J. J., Wang, Z. C., Jiao, Z. M., Gao, L. N., Xiang, Y., and Zhang, T. S.: Downdraft influences on the differences of PM2.5 concentration: insights from a mega haze evolution in the winter of northern China, Environ. Res. Lett., 19, 014042, https://doi.org/10.1088/1748-9326/ad1229, 2024.
Cimini, D., Hewison, T., Martin, L., Güldner, J., Gaffard, C., and Marzano, F.: Temperature and humidity profile retrievals from ground-based microwave radiometers during TUC, Meteorol. Z., 15, 45–56, https://doi.org/10.1127/0941-2948/2006/0099, 2006.
Crewell, S. and Löhnert, U. : Accuracy of boundary layer temperature profiles retrieved with multifrequency multiangle microwave radiometry, IEEE T. Geosci. Remote, 45, 2195–2201, https://doi.org/10.1109/TGRS.2006.888434, 2007.
Delanoë, J., and Hogan, R. J.: A variational scheme for retrieving ice cloud properties from combined radar, LiDAR, and infrared radiometer, J. Geophys. Res., 113, D07204, https://doi.org/10.1029/2007JD009000, 2008.
Fan, J., Zhang, R., Li, G., Tao, W. K., and Li, X.: Effects of aerosols and relative humidity on cumulus clouds, J. Geophys. Res., 112, D14204, https://doi.org/10.1029/2006JD008136, 2007.
Foth, A., Baars, H., Di Girolamo, P., and Pospichal, B.: Water vapour profiles from Raman lidar automatically calibrated by microwave radiometer data during HOPE, Atmos. Chem. Phys., 15, 7753–7763, https://doi.org/10.5194/acp-15-7753-2015, 2015.
Foth, A. and Pospichal, B.: Optimal estimation of water vapour profiles using a combination of Raman lidar and microwave radiometer, Atmos. Meas. Tech., 10, 3325–3344, https://doi.org/10.5194/amt-10-3325-2017, 2017.
Furumoto, J., Kurimoto, K., and Tsuda, T.: Continuous observations of humidity profiles with the Mu Radar-RASS combined with GPS and radiosonde measurements, J. Atmos. Ocean. Tech., 20, 23–41, 2003.
Gangwar, R. K., Gohil, B. S., and Mathur, A. K.: Retrieval of Layer Averaged Relative Humidity Profiles from MHS Observations over Tropical Region, J. Atmos. Sci., 2014, 645970, https://doi.org/10.1155/2014/645970, 2014.
Gohil, B. S., Gairola, R. M., Mathur, A. K., Varma, A. K., Mahesh, C., Gangwar, R. K., and Pal, P. K., Algorithms for retrieving geophysical parameters from the MADRAS and SAPHIR sensors of the Megha-Tropiques satellite: Indian scenario, Q. J. Roy. Meteor. Soc., 139, 954–963, https://doi.org/10.1002/qj.2041, 2013.
Granados-Muñoz, M. J., Navas-Guzmán, F., Bravo-Aranda, J. A., Guerrero-Rascado, J. L., Lyamani, H., Valenzuela, A., Titos, G., Fernández-Gálvez, J., and Alados-Arboledas, L.: Hygroscopic growth of atmospheric aerosol particles based on active remote sensing and radiosounding measurements: selected cases in southeastern Spain, Atmos. Meas. Tech., 8, 705–718, https://doi.org/10.5194/amt-8-705-2015, 2015.
Hogg, D., Decker, M., Guiraud, F., Earnshaw, K., Merritt, D., Moran, K., Sweezy, W., Strauch, R., Westwater, E., and Little, G.: An automatic profiler of the temperature, wind and humidity in the troposphere, J. Appl. Meteorol., 22, 807–831, 1983.
Long, L., He, L., Li, J. B., Zhang, W. L., and Zhang, Y. X.: Climatic characteristics of mesoscale convective systems in the warm season in North China, Meteorol. Atmos. Phys., 135, 21, https://doi.org/10.1007/s00703-023-00958-1, 2023.
Kang, Y. Z., Peng, X. D., Wang, S. G., Hu, Y. L., Shang, K. Z., and Lu, S.: Observational analyses of topographic effects on convective systems in an extreme rainfall event in Northern China, Atmos. Res., 229, 127–144, 2019.
Madonna, F., Amodeo, A., Boselli, A., Cornacchia, C., Cuomo, V., D'Amico, G., Giunta, A., Mona, L., and Pappalardo, G.: CIAO: the CNR-IMAA advanced observatory for atmospheric research, Atmos. Meas. Tech., 4, 1191–1208, https://doi.org/10.5194/amt-4-1191-2011, 2011.
Mattis, I., Ansmann, A., Althausen, D., Jaenisch, V., Wandinger, U., Müller, D., Arshinov, Y. F., Bobrovnikov, S. M., and Serikov, I. B.: Relative-humidity profiling in the troposphere with a Raman LiDAR, Appl. Optics, 41, 6451–6462, https://doi.org/10.1364/AO.41.006451, 2002.
Mochida, M.: Simultaneous measurements of hygroscopic property and cloud condensation nucleus activity of aerosol particles of marine biogenic origin, Western Pacific Air–Sea Interaction Study, American Geophysical Union, 71–81, https://doi.org/10.5047/w-pass.a01.008, 2014.
Navas-Guzmán, F., Fernández-Gálvez, J., Granados-Muñoz, M. J., Guerrero-Rascado, J. L., Bravo-Aranda, J. A., and Alados-Arboledas, L.: Tropospheric water vapour and relative humidity profiles from lidar and microwave radiometry, Atmos. Meas. Tech., 7, 1201–1211, https://doi.org/10.5194/amt-7-1201-2014, 2014.
Petters, M. D. and Kreidenweis, S. M.: A single parameter representation of hygroscopic growth and cloud condensation nucleus activity, Atmos. Chem. Phys., 7, 1961–1971, https://doi.org/10.5194/acp-7-1961-2007, 2007.
Ramírez-Beltrán, N. D., Salazar, C. M., Castro Sánchez, J. M., and González, J. E.: A satellite algorithm for estimating relative humidity, based on GOES and MODIS satellite data, Int. J. Remote Sens., 40, 9237–9259, https://doi.org/10.1080/01431161.2019.1629715, 2019.
Reichardt, J., Wandinger, U., Klein, V., Mattis, I., Hilber, B., and Begbie, R.: RAMSES: German meteorological service autonomous Raman LiDAR for water vapor, temperature, aerosol, and cloud measurements, Appl. Optics, 51, 8111–8131, https://doi.org/10.1364/AO.51.008111, 2012.
Schmetz, J.: Good things need time: Progress with the first hyperspectral sounder in geostationary orbit, Geophys. Res. Lett., 48, e2021GL096207, https://doi.org/10.1029/2021GL096207, 2021.
Stankov, B. B., Martner, B. E., and Politovich, M. K.: Moisture profiling of the cloudy winter atmosphere using combined remote sensors, J. Atmos. Ocean. Tech., 12 , 488–510, 1995.
Skou, N., Søbjærg, S. S., and Kristensen, S. S.: Future high-performance spaceborne microwave radiometer systems, IEEE Geosci. Remote S., 19, 1–5, https://doi.org/10.1109/LGRS.2021.3118082, 2022.
Wang, S. F., Lu, F., and Feng. Y. T.: An Investigation of the Fengyun-4A/B GIIRS performance on temperature and humidity retrievals, Atmos., 13, 1830, 2022.
Toporov, M., and Löhnert, U.: Synergy of satellite- and ground-based observations for continuous monitoring of atmospheric stability, liquid water path, and integrated water vapor: theoretical evaluations using reanalysis and neural networks, J. Appl. Meteorol. Clim., 59, 1153–1170, https://doi.org/10.1175/JAMC-D-19-0169.1, 2020.
Turner, D. D. and Löhnert, U.: Ground-based temperature and humidity profiling: combining active and passive remote sensors, Atmos. Meas. Tech., 14, 3033–3048, https://doi.org/10.5194/amt-14-3033-2021, 2021.
Wex, H., Stratmann, F., Hennig, T., Hartmann, S., Niedermeier, D., Nilsson, E., Ocskay, R., Rose, D., Salma, I., and Ziese, M.: Connecting hygroscopic growth at high humidities to cloud activation for different particle types, Environ. Res. Lett., 3, 035004, https://doi.org/10.1088/1748-9326/3/3/035004, 1–10, 2008.
Ware, R., Carpenter, R., Guldner, J., Liljegren, J., Nehrkorn, T., Solheim, F., and Vandenberghe, F. A.: Multi-channel radiometric profiles of temperature, humidity and cloud liquid, Radio Sci., 38, 8079–8032, 2003.
Wang, X., Miao, H., Liu, Y., Bao, Q., He, B., Li, J., and Zhao, Y.: The use of satellite data-based “critical relative humidity” in cloud parameterization and its role in modulating cloud feedback, J. Adv. Model. Earth Sy., 14, e2022MS003213, https://doi.org/10.1029/2022MS003213, 2022.
Wang, Z. Z., Wang, W. Y., Tong, X. L., Zhang, Z., Liu, J. Y., Lu, H. H., Ding, J., Wu, Y. T.: Progress in spaceborne passive microwave remote sensing technology and its application (in Chinese), Chin. J. Space Sci., 43, 986–1015, https://doi.org/10.11728/cjss2023.06.yg15, 2023.
Whiteman, D. N., Melfi, S. H., and Ferrare, R. A.: Raman LiDAR system for the measurement of water vapor and aerosols in the earth's atmosphere, Appl. Optics, 31, 3068–3082, https://doi.org/10.1364/AO.31.003068, 1992.
Xu, G. R., B. K., Zhang, W. G., Cui, C. G., Dong, X. Q., Liu, Y. Y., and Yan, G. P.: Comparison of atmospheric profiles between microwave radiometer retrievals and radiosonde soundings, J. Geophys. Res.-Atmos., 120, 313–323, https://doi.org/10.1002/2015JD023438, 2015.
Yang, J., Zhang, Z., Wei, C., Lu, F., and Guo, Q.: Introducing the new generation of Chinese geostationary weather satellites, Fengyun-4, B. Am. Meteorol. Soc., 98, 1637–1658, 2017.
Yang, W., Chen, Y., Bai, W., Sun, X., Zheng, H., and Qin, L.: Evaluation of temperature and humidity profiles retrieved from Fengyun-4B and implications for typhoon assimilation and forecasting, Remote Sens., 15, 5339, https://doi.org/10.3390/rs15225339, 2023.
Zhang, L., Liu, M., He, W., Xia, X. G.,Yu, H. N., Li, S., X., and Li, J.: Ground passive microwave remote sensing of atmospheric profiles using WRF simulations and machine learning techniques, J. Meteorol. Res.-PRC, 38, 680–692, https://doi.org/10.1007/s13351-024-4004-2, 2024.
Zhang, Z., Dong, X., and Zhu, D.: Optimal channel selection of spaceborne microwave radiometer for surface pressure retrieval over Oceans, J. Atmos. Ocean. Tech., 39, 1857–1868, https://doi.org/10.1175/JTECH-D-21-0121.1, 2022.
Zieger, P., Fierz-Schmidhauser, R., Weingartner, E., and Baltensperger, U.: Effects of relative humidity on aerosol light scattering: results from different European sites, Atmos. Chem. Phys., 13, 10609–10631, https://doi.org/10.5194/acp-13-10609-2013, 2013.