the Creative Commons Attribution 4.0 License.
the Creative Commons Attribution 4.0 License.
 | 07 Aug 2025
Seasonal effects in the application of the MOment MAtching (MOMA) remote calibration tool to outdoor PM2.5 air sensors
Lena Francesca Weissert
Geoff Stephen Henshaw
Andrea Lee Clements
Rachelle Monique Duvall
Carry Croghan
Air sensors are being used more frequently to measure hyper-local air quality. The PurpleAir sensor is among one of the most popular air sensors used worldwide to measure fine particulate matter (PM2.5). However, there is a need to understand PurpleAir data quality especially under different environmental conditions with varying particulate matter (PM) sources and size distributions. Several correction factors have been developed to make the PurpleAir sensor data more comparable to reference monitor data. The goal of this work was to determine the performance of a remote calibration tool called MOment MAtching (MOMA) for PM2.5 sensors monitoring near temporally varying pollution sources of PM2.5. MOMA performs calibrations using reference site data within 0–15 km from the sensor. Data are from 20 PurpleAir sensors deployed across a network in Phoenix, Arizona, from July 2019 to April 2021. Results showed that the MOMA calibration tool made the PurpleAir PM2.5 data more comparable to the co-located reference data (calibrated mean absolute error (MAE): 2.8–3.7 µg m−3; mean bias error (MBE): −1.8–0.1 µg m−3). The improvements were comparable to the Environmental Protection Agency (EPA) correction factor (MAE: 2.8–3.7 µg m−3; MBE: −0.9–0.4 µg m−3). However, MOMA provided a better estimate of daily average concentrations than the EPA correction factor when compared to the reference data under smoke conditions. Using the MOMA gain, representative of the sensor–proxy relationship, MOMA was able to distinguish between PM sources such as winter wood burning, wildfires, and dust events in the summer.
- Article
(4235 KB) - Full-text XML
- Companion paper
-
Supplement
(557 KB) - BibTeX
- EndNote


Exposure to fine particulate matter (PM2.5, particles 2.5 µm in diameter and smaller) is linked to adverse health effects. This is particularly well-documented for PM2.5, with causal relationships established between both short- and long-term exposure and respiratory, cardiovascular, and total mortality (U.S. EPA, 2019). Evidence also suggests that PM2.5 poses a significant health risk even at low concentrations with no “safe” threshold (Elliott and Copes, 2011; Fann et al., 2012; U.S. EPA, 2019). Thus, there is a need to measure air pollution at a high spatial and temporal resolution to understand localized air quality in areas where people live, work, commute, and play (English et al., 2017). Data from lower-cost air sensors have great potential to provide such insights, helping communities to minimize exposure to unhealthy air pollution (Ardon-Dryer et al., 2019; Castell et al., 2017; Snyder et al., 2013; Stavroulas et al., 2020).
The Plantower PMS 5003 (PMS, Plantower Technology, China) sensor, used in the PurpleAir sensor, is amongst the most popular lower-cost sensor used to measure particulate matter (PM) concentrations. There are thousands of PurpleAir sensors deployed globally providing publicly available data in real time (https://map.purpleair.com/, last access: 24 July 2025). The PMS sensor reports particle counts between 0.3 and 10 µm across six size bins and provides mass concentration estimates for PM1 (particles < 1 µm in diameter), PM2.5, and PM10 (particles < 10 µm in diameter). Numerous studies have investigated the performance of PurpleAir sensors in the field across the United States (US; Ardon-Dryer et al., 2019; Barkjohn et al., 2021; Feenstra et al., 2019; Jaffe et al., 2023; Malings et al., 2020; Ouimette et al., 2022; Sayahi et al., 2019; Tryner et al., 2020b) and other parts of the world (e.g., Greece, Kosmopoulos et al., 2022; Stavroulas et al., 2020; Australia, Robinson, 2020) as well as in the laboratory (Kuula et al., 2020; Tryner et al., 2020b). While these studies showed that the PurpleAir sensors are precise and linearly related to PM2.5 reference data up to approximately 250 µg m−3, they are not always accurate (Barkjohn et al., 2022). The measurement range of PurpleAir sensors is notated to be from 0.3–10 µm; however, results suggest that the PurpleAir sensor is most responsive to particles between 0.4 and 1 µm (Ouimette et al., 2024, 2022). Thus, concerns about the data quality in particular under different environmental conditions with varying PM sources and size distributions remain (Barkjohn et al., 2021; Jaffe et al., 2023; Ouimette et al., 2022; Williams, 2019).
As a result, recent work has focused on developing correction algorithms for PurpleAir sensors (Ardon-Dryer et al., 2019; Barkjohn et al., 2021; Holder et al., 2020; Magi et al., 2020; Wallace et al., 2021, 2022). A US-wide correction algorithm developed by the U.S. Environmental Protection Agency (EPA) showed significant improvements in accuracy across several regions and conditions (Barkjohn et al., 2021). The algorithm was further developed (Barkjohn et al., 2022) and is now implemented in the AirNow Fire and Smoke map (https://fire.airnow.gov/, last access: 24 July 2025). Despite the extensive dataset used in this study the authors mention that further analysis may be required to test the performance of their correction long-term as well as for extreme events and regions that were under-sampled but are characterized by different PM2.5 sources (i.e., southern parts of the US, northern Rockies, Ohio Valley). A recent study evaluating the performance of the correction for dust, wildfire, and urban pollution suggested that the accuracy of the PMS using the Environmental Protection Agency (EPA) correction varies for different pollution types (Jaffe et al., 2023). Additionally, the study found that the correction was not able to account for missed particles associated with dust events and underestimated the reference PM2.5 by a factor of 5–6. Wallace et al. (2022) developed a method to calculate PM2.5 estimates from the particle count data and then established calibration factors using reference sites within 500 m of the PurpleAir sensor for comparison. However, lower-cost sensors are often deployed in areas lacking monitoring data, and consequently reference monitors are further away.
In the following work, we use a remote calibration tool, called MOment MAtching (MOMA), to calibrate PurpleAir sensors deployed in Phoenix, Arizona. MOMA uses data from distant reference sites (within 0–15 km), referred to as “proxies”, to determine if a sensor has drifted and to calculate the calibration gain and offset, referred to as MOMA gain and offset. MOMA is based on the assumption that data from the reference site show statistical similarity to those of the sensor site for a period of time representative of the regional pollutant variation (Miskell et al., 2018, 2019; Weissert et al., 2020). MOMA has been tested extensively in the southern California region for ozone (O3), nitrogen dioxide (NO2), PM2.5, and PM10 concentrations from Aeroqual sensors (AQY, v1.0, Aeroqual Ltd, Auckland, New Zealand) (Miskell et al., 2019; Weissert et al., 2020, 2023). Southern California is characterized by a Mediterranean climate with hot, mostly dry summers and mild winters. While Phoenix, Arizona, also experiences hot and dry summers, winter nighttime temperatures can go below freezing and smoke related to wood burning is a common source of PM pollution, worsened by Phoenix's surrounding mountains which limit vertical mixing of air pollutants (Grineski et al., 2007). In addition, Phoenix typically experiences 2–4 dust storms during its monsoon season (June–September). The most intense dust storms, known as haboobs, move over Phoenix as a wall of dust and may decrease the visibility to less than 1 km (Eagar et al., 2017).
The primary aim of this paper was to determine the performance of MOMA for PM2.5 air sensors monitoring near temporally varying pollution sources. Originally, MOMA was developed to correct sensor data associated with instrumental drift, which was defined as drift lasting for several days. However, previous research suggested that the MOMA calibration gain reflected changes in PM composition associated with different PM sources which can vary temporally from a few hours to days (Weissert et al., 2023). Therefore, we are specifically interested in determining (a) if MOMA can give insights into PM sources and (b) if MOMA is able to detect sensor drift associated with different PM sources. The MOMA results are compared to the EPA correction (Barkjohn et al., 2022).
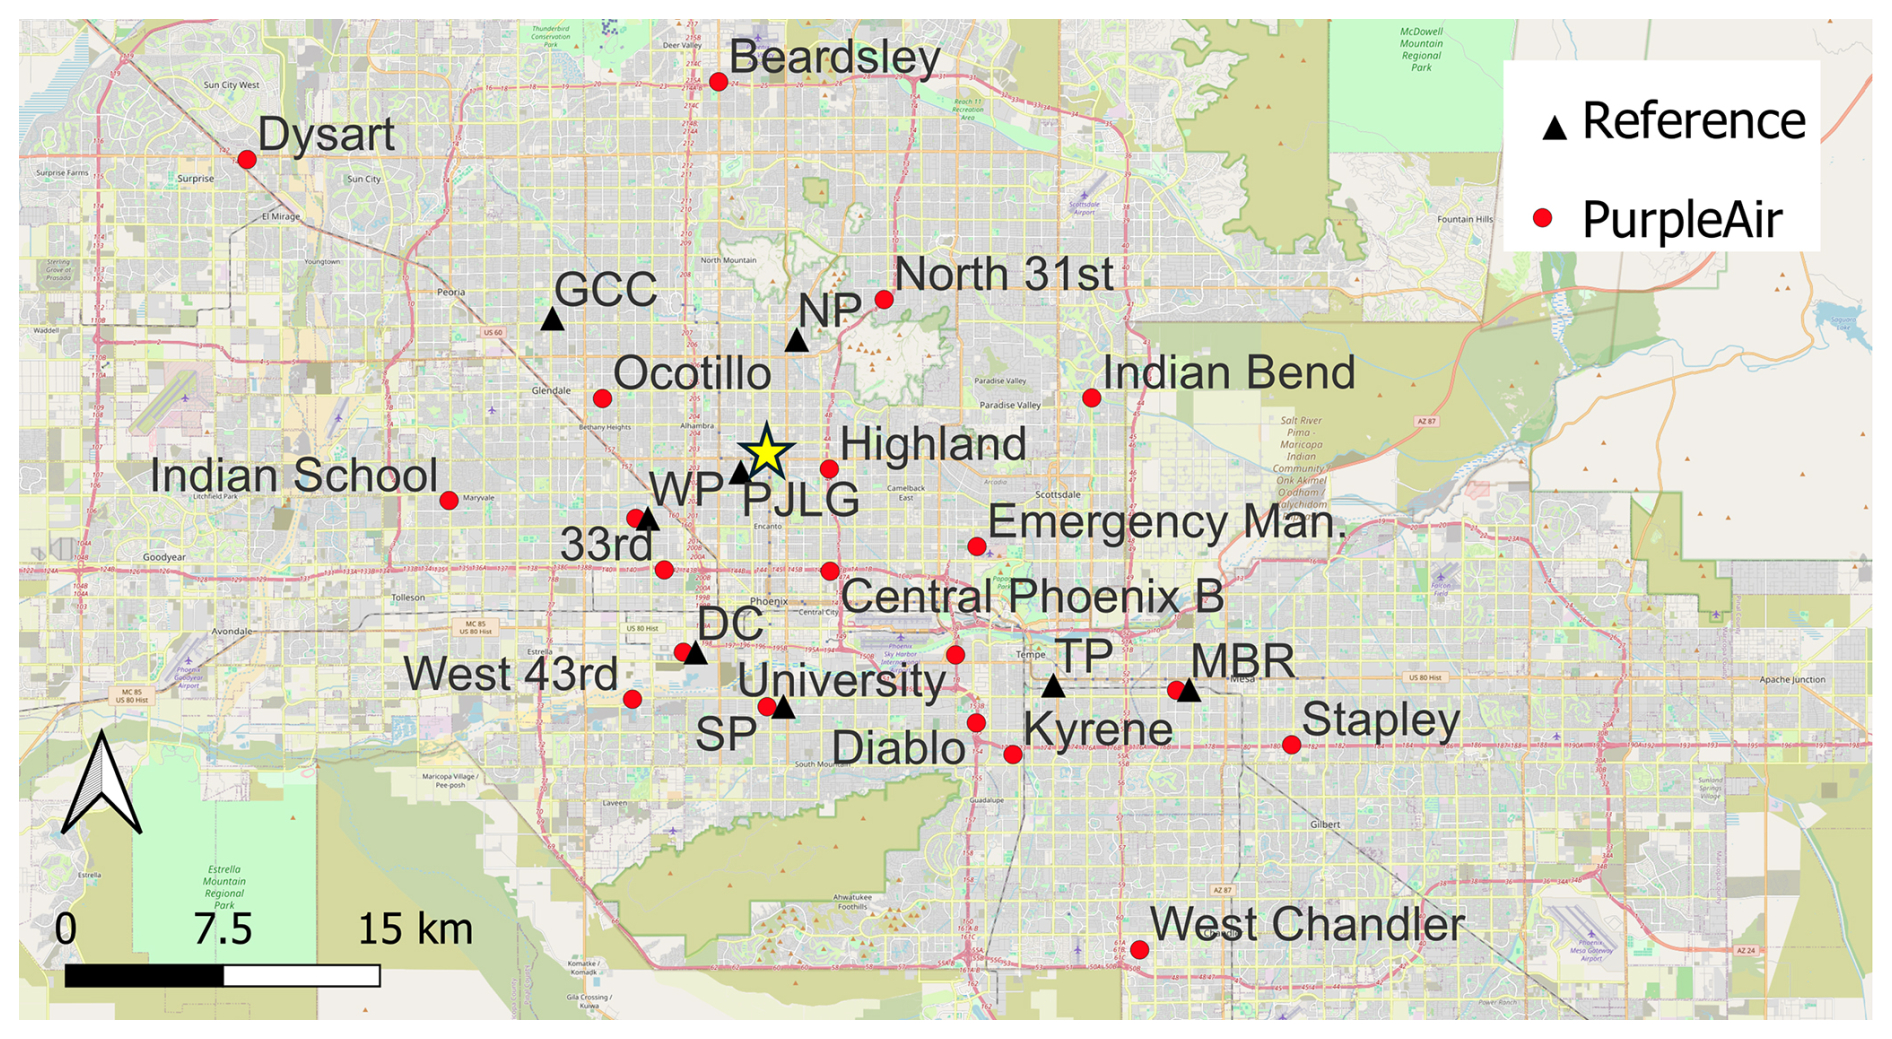
Figure 1Map of PurpleAir sites and reference sites in Phoenix. The speciation data were collected at PJLG, highlighted by the yellow star. The full names of the reference sites are shown in Table 1. The map was created using the free and open-source QGIS.
2.1 Datasets
2.1.1 PM2.5 data
To better understand local air pollution associated with wood burning, Maricopa County and the U.S. EPA deployed a network of PurpleAir PA-II sensors across the Phoenix, Arizona, region between 2019–2021. From this network, we used data from 4 sites co-located with reference monitors (Mesa–Brooks Reservoir, Durango Complex, South Phoenix, West Phoenix) and 16 other sites with non-co-located PurpleAir sensors deployed across Phoenix (Fig. 1). The network data are available from July 2019–April 2021 (Clements et al., 2025).
The PurpleAir PA-II contains two PMS sensors, referred to as “Channel A” and “Channel B”. The PMS sensor mass concentrations are reported as either cf_1 or cf_atm (“atmosphere”). For this analysis we use cf_atm data. PurpleAir raw data were reported at 2 min intervals and averaged to hourly values when data completeness for each hour was > 75 %. Hourly data from Channel A and Channel B were compared, and data were removed when the hourly percentage difference between Channels A and B was > 70 % and > 5 µg m−3 (Barkjohn et al., 2021; Collier-Oxandale et al., 2022). The average PM2.5 concentration from Channel A and Channel B was used for this analysis.
Hourly PM2.5 reference data were accessed via AirNow (https://gispub.epa.gov/airnow/, last access: 24 July 2025) (Fig. 1). The reference network consisted of one beta attenuation monitor (BAM) (BAM 1020, Met One Instruments, Inc., Grants Pass, Oregon, US) at the PJLG Supersite and seven dichotomous taper element oscillating microbalance (TEOM) monitors (TEOM 1405-DF, Thermo Scientific, Waltham, MA, US). PurpleAir data were calibrated against the BAM and TEOM reference monitors. In addition, we used hourly PM2.5 reference data from a reference-grade optical instrument, T640x (Teledyne API, San Diego, US), which was deployed at West Phoenix from November 2018 until April 2021 (the T640x data are not reflective of the April 2023 firmware update that implemented an alignment factor). The T640x data were used to assess whether the relationships observed between PurpleAir sensors and BAM and TEOM reference monitors across different PM sources also apply when using an optical reference instrument; they were not used to calibrate the sensor data at West Phoenix.
2.2 Supporting data
To determine if we can relate detected PM events to different PM sources, we used speciation data collected every third day at the PJLG Supersite (PJLG, Fig. 1) and accessed via the RAQSAPI package (McCrowey et al., 2023), which allows downloading monitoring data from the U.S. EPA Air Quality System (AQS) service. We focused on parameters representing crustal material (iron, Fe; magnesium, Mg; silicon, Si; potassium, K), trace ions (potassium ion, K+; sodium ion, Na+; chloride, Cl−), secondary ions (ammonium, ; nitrate, ; sulfate, ) elemental carbon (EC), and organic carbon (OC) following the PM source classification described in Weissert et al. (2023). Surface meteorological data from the Phoenix Sky Harbor International Airport were downloaded from the National Oceanic and Atmospheric Administration (NOAA) Integrated Surface Database (ISD) via the worldmet package in R (Carslaw and Davison, 2025).
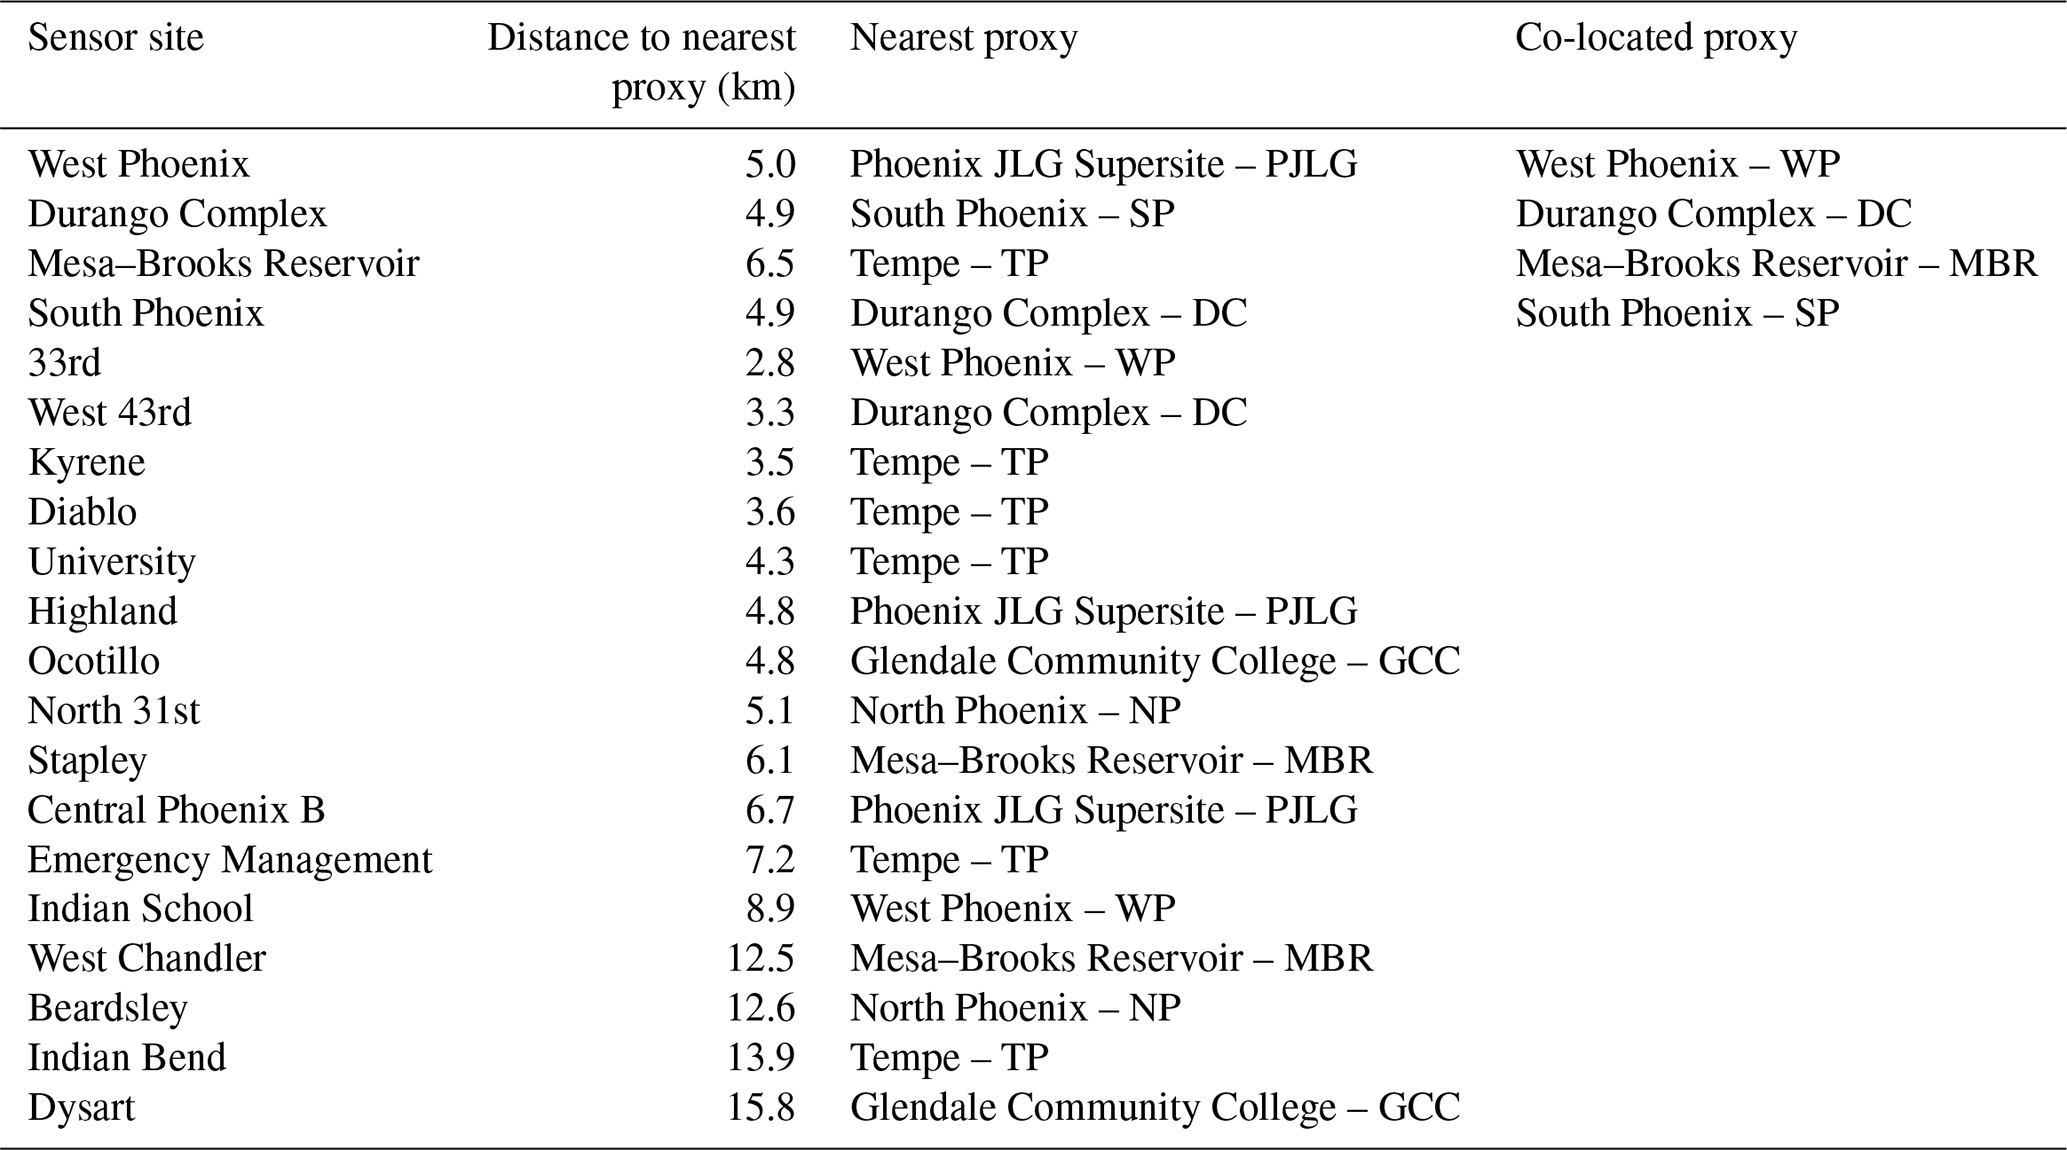
Table 1Sensor site and the nearest proxy as well as the distance to the nearest proxy.
2.3 Proxy selection
We selected proxies based on results from Weissert et al. (2023), which suggested that the nearest proxy (0–15 km) is generally a suitable choice for PM2.5 (Table 1). The nearest proxy for the co-located sensor sites was between 5–6.5 km away from the sensor site and therefore representative of the sensor–proxy distance of most sites.
2.4 MOMA
PurpleAir data were corrected using our previously published MOMA calibration tool to detect sensor drift and apply a correction (Miskell et al., 2018, 2019; Weissert et al., 2020; Weissert et al., 2023). In brief, MOMA uses a two-sample Kolmogorov–Smirnov (K-S) test and the mean E and variance var (mean–variance, M-V), moment-matching MOMA gain , and the intercept to determine if sensor data Y at location i have drifted in relation to the proxy data Z at location k over the time interval .
We used the following thresholds to determine sensor drift: K-S test p value < 0.05; 0.75 > > 1.25; −5 µg m−3 > > 5 µg m−3. We used a 3 d rolling average to calculate the statistics, and a correction, as shown in Eq. (3), was triggered when any of the three statistics exceeded the threshold for a period of 4 consecutive days. The correction was applied retroactively to the start of this 4 d period.
Subsequent corrections are only applied if the corrected PM2.5, , data have drifted in comparison to the proxy data. Given that we test the performance of MOMA for PM sources that may vary at shorter or longer timescales, we compare the MOMA-corrected results from the 4 d threshold to those obtained using a 3 d threshold and 5 d threshold.
The performance of the MOMA calibration tool was tested using PurpleAir data from South Phoenix, West Phoenix, Durango Complex, and Mesa–Brooks Reservoir calibrated against the nearest proxy reference to represent the impact of calibrating against a distant proxy reference. The calibrated data were then compared against the co-located reference.
2.5 US-wide PurpleAir correction
To compare the results from MOMA we also applied the piecewise regression used for the AirNow Fire and Smoke Map to the PurpleAir data (Barkjohn et al., 2022).
Here x is cf_atm (µg m−3) and RH is relative humidity (%) measured by the PurpleAir sensors.
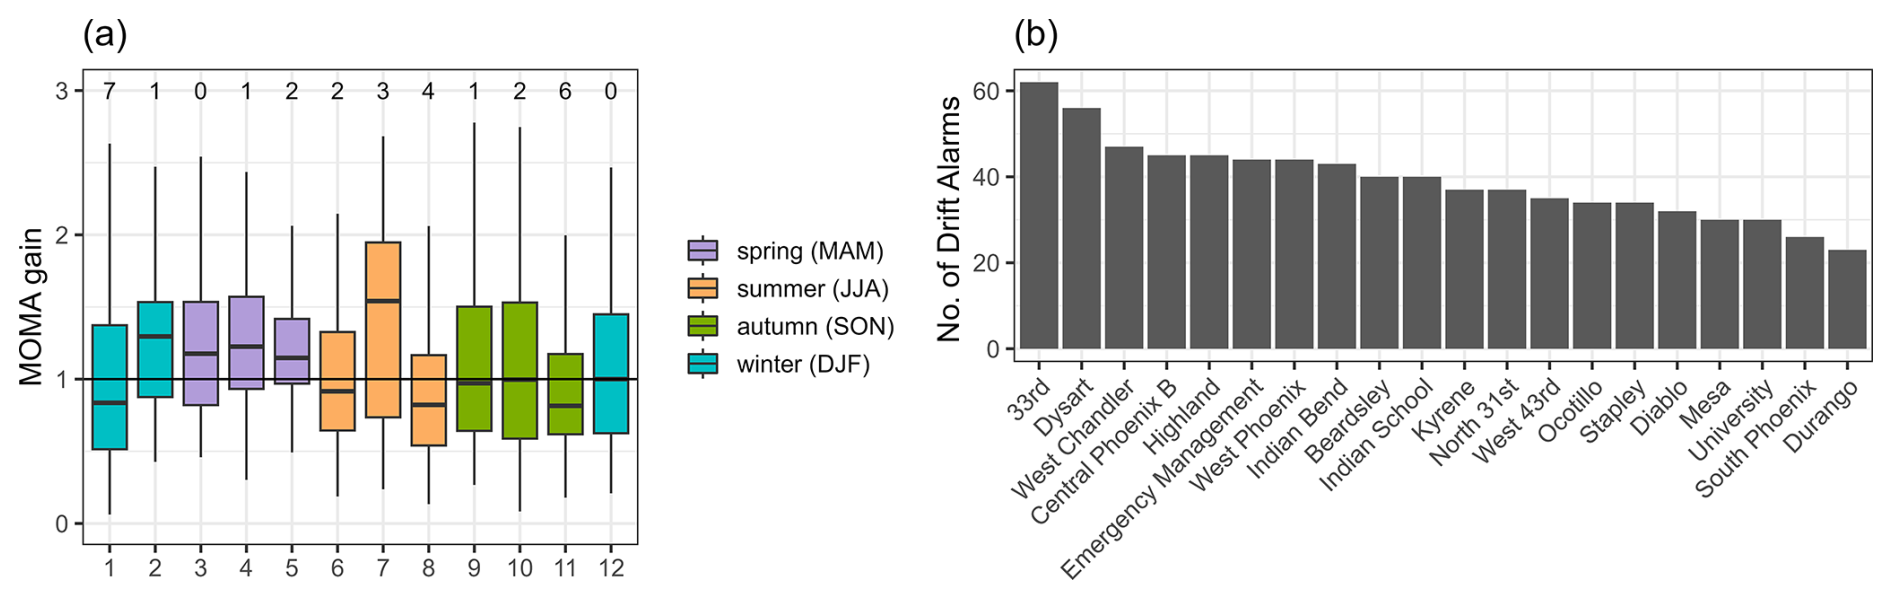
Figure 2(a) Boxplot showing the monthly variations in the MOMA gain from the drift detection framework used to correct the PurpleAir sensor data across the whole network colored by season. The numbers at the top indicate the number of outliers observed for different months. (b) Bar chart showing the number of drift alarms and calibrations triggered at each site.
2.6 PM2.5 source identification
Previous research suggested that the sensor–proxy relationship changes are associated with differences in PM sources and composition (Tryner et al., 2020b; Jaffe et al., 2023; Ouimette et al., 2022; Weissert et al., 2023). Thus, we use the temporal variation in the MOMA gain, (Eq. 1), calculated over a 3 d rolling window (td) to identify conditions when PurpleAir sensors tend to over- or underestimate PM2.5 concentrations compared to the reference data. This MOMA gain is representative of the proxy relationship relative to the uncorrected PurpleAir data and independent of sensor drift alarms. The proxies outlined in Table 1 were also used to calculate the 3 d rolling MOMA gain.
We assume that differences in the MOMA gain are, to some extent, related to the presence of different PM sources characterized by a different size distribution, chemical properties, or optical properties. In particular, we focused on distinguishing between smoke, dust, and general urban traffic PM sources. These sources are common in Phoenix and are associated with different particle sizes and composition (Jaffe et al., 2023). We averaged the MOMA gain for each day to identify days dominated by smoke, dust, and typical urban PM sources. We then tested the performance of MOMA and the EPA correction under these different conditions.
3.1 Seasonal effects and PM source identification
Figure 2 shows the monthly variations in the MOMA gain used to correct the PurpleAir sensor data across the whole dataset and the number of drift alarms raised at each site. Figure 2a indicates that the MOMA calibration gain represents monthly variations that are more consistent with changes in PM sources rather than with instrumental drift. Unlike most other sites, the drift detection test triggered frequent alarms at 33rd across the whole study period despite being close to the proxy site (2.8 km). Mean uncorrected PM2.5 concentrations across the whole study period at 33rd were 4 µg m−3, less than half of those recorded at West Phoenix (10 µg m−3). Low concentrations at 33rd were surprising given the site is located next to a busy motorway, indicating a potential sensor or siting issue for a PM2.5 measurement at this site (Fig. S1 in the Supplement). Alternatively, frequent alarms could signify an unsuitable proxy match due to different particle sources. The 33rd site is influenced predominantly by vehicle traffic, and the West Phoenix site is influenced by the residential community surrounding the site with particle sources like lower-speed road dust, cooking emissions, and residential smoke (e.g., domestic heating, backyard fire pits). Similarly, Dysart resulted in frequent calibrations, which is likely a result of an unsuitable proxy given the site is located north of Phoenix the furthest away from any reference site (> 15 km) and selected as a background site.
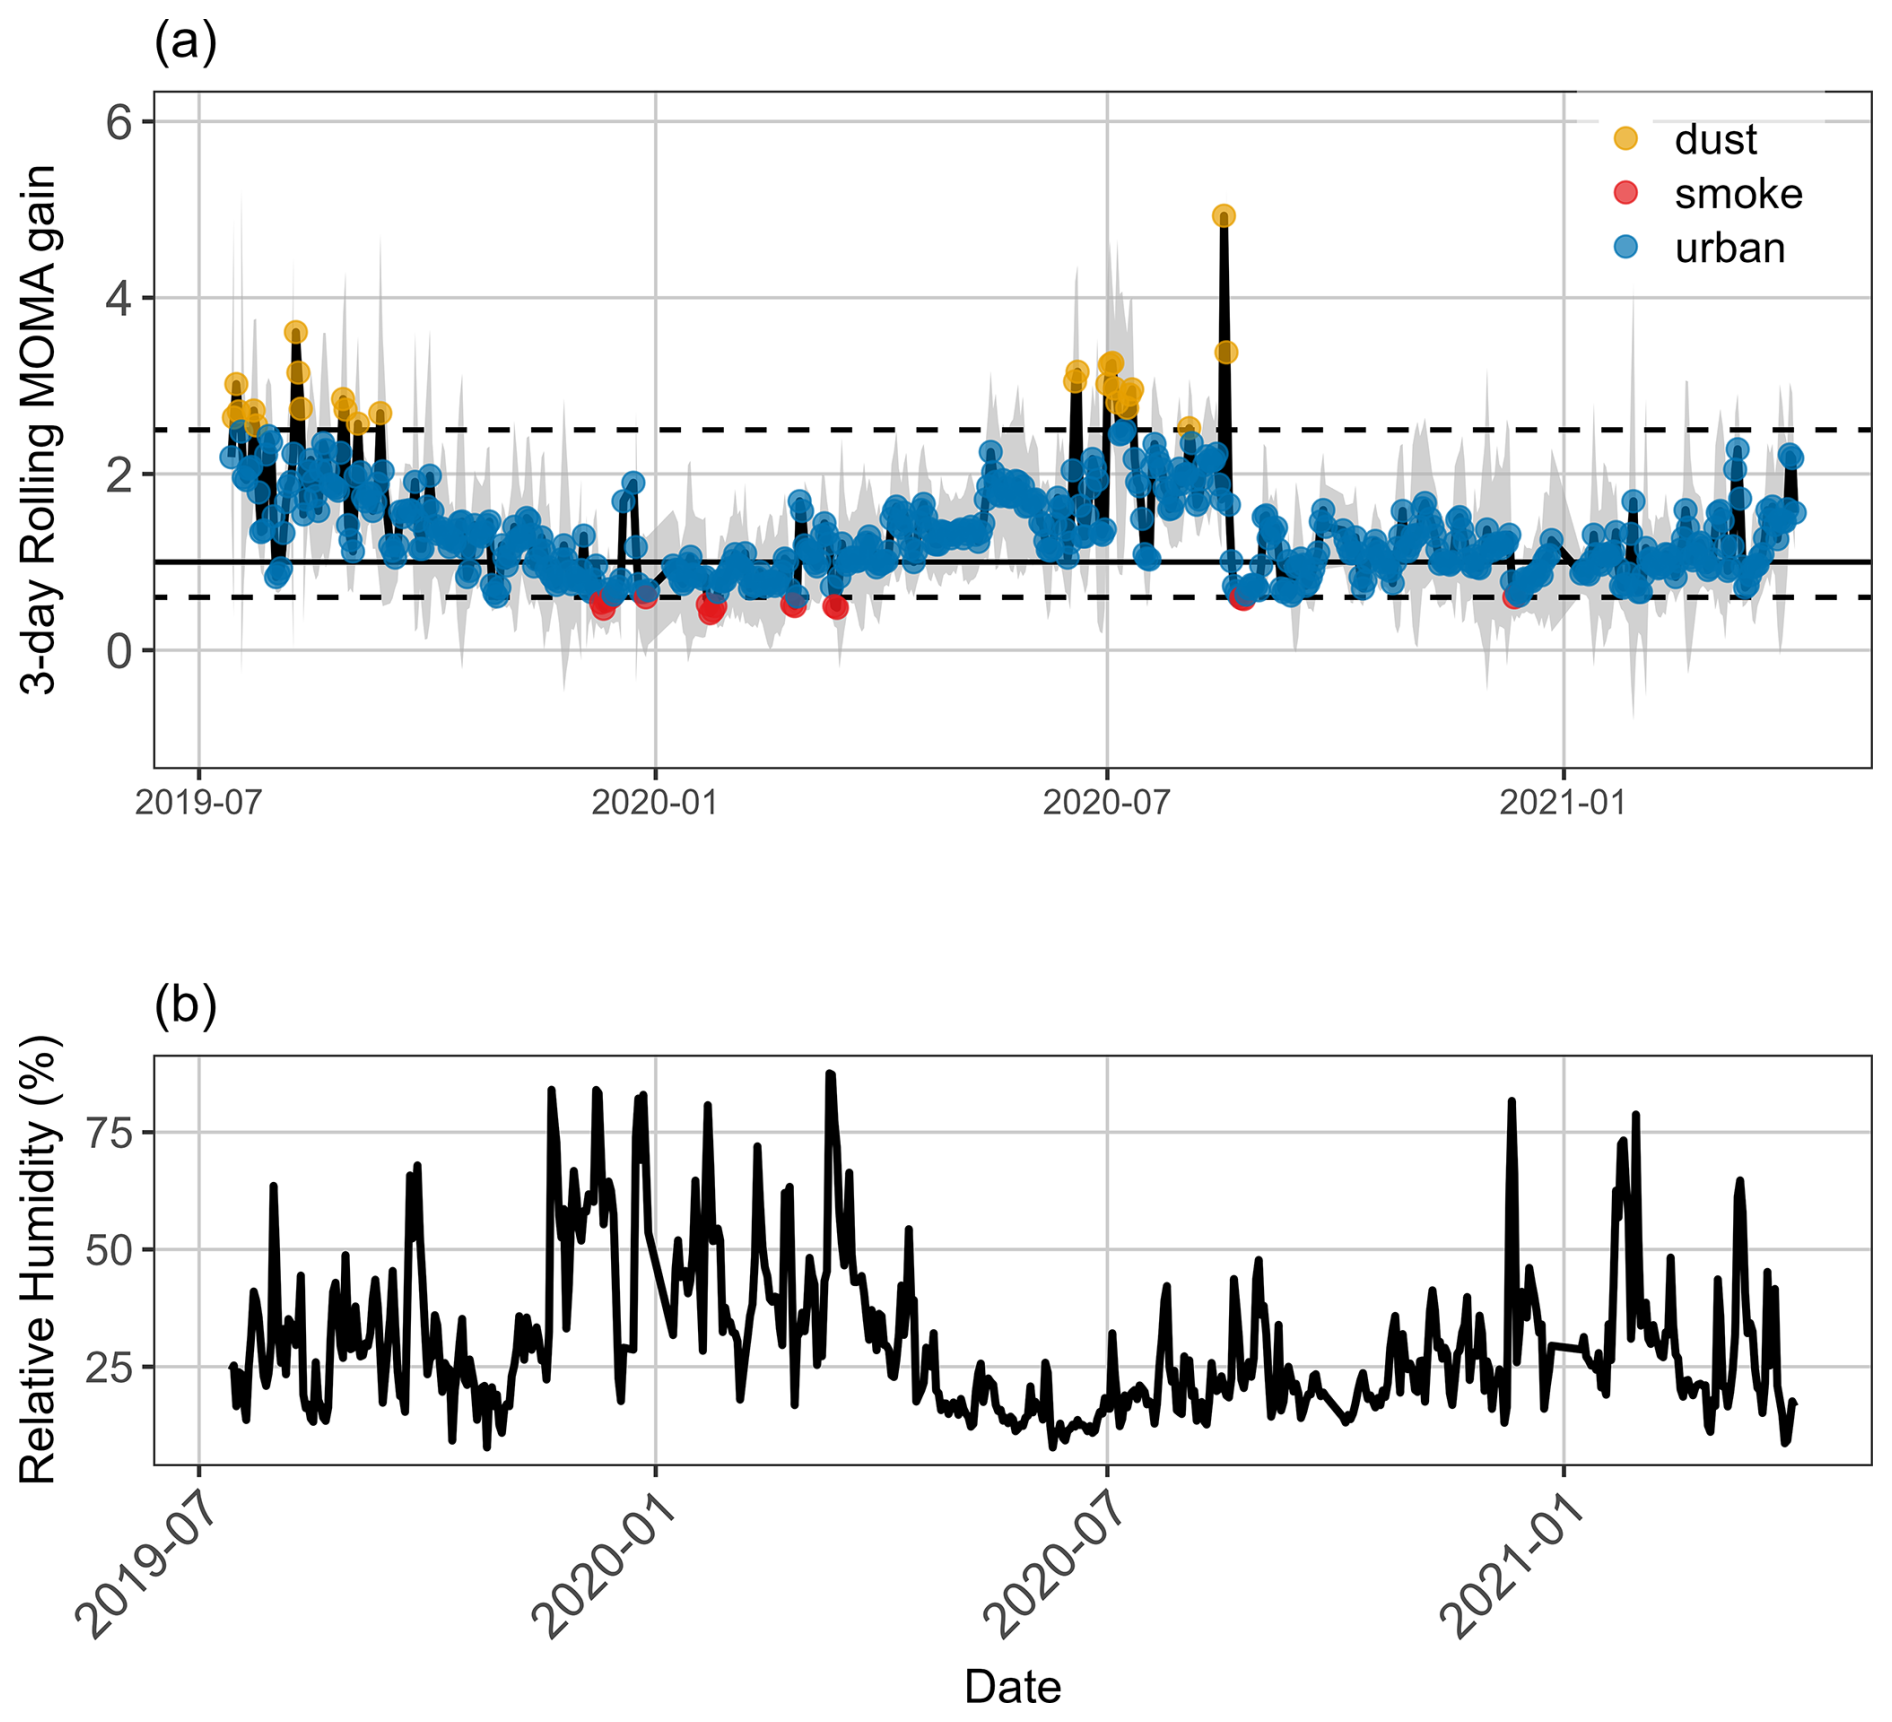
Figure 3(a) Daily averaged MOMA gain across the entire sensor network from July 2019–April 2021. The daily values represent the mean of a 3 d rolling average applied to the hourly dataset, and the shaded area is the standard deviation. (b) Relative humidity measured at the Phoenix Sky Harbor International Airport.
MOMA only triggers a calibration when a sensor shows a statistical difference for a continuous period of 4 d. While this is suitable for long-lasting pollution events or instrumental sensor drift, it risks missing short-term events such as dust storms or PM sources that show diurnal variations such as wood smoke related to domestic heating. Additionally, the MOMA gain produced by the calibration tool and shown in Fig. 2a is calculated relative to the previously applied MOMA gain and offset, meaning it reflects changes in the sensor–proxy relationship based on prior corrections rather than an absolute comparison to the proxy reference. Thus, the 3 d rolling MOMA gain from July 2019–April 2021, shown in Fig. 3a, provides more detailed insights into the temporal variability in PM sources independent of the drift detection framework and representative of the relationship between the uncorrected PurpleAir data and the proxy reference data. Figure 3a clearly shows the observed MOMA gain to be < 1 for PurpleAir sensors during the winter and occasionally during the summer (e.g., August/September 2020), suggesting PurpleAir sensors overestimate PM2.5 compared to the proxy reference under these conditions. Two factors may contribute to the PurpleAir sensors overestimating concentrations in winter, particularly at night and in the early morning hours (8 pm–7 am, Fig. S2 in the Supplement). First, RH is higher at night as well as during winter (Fig. 3b), which can lead to hygroscopic growth of particles impacting the light scattering (Badura et al., 2018; Morawska et al., 2018). Second, other research (e.g., Jaffe et al., 2023; Barkjohn et al., 2021a; Holder et al., 2020; Tryner et al., 2020a) found that PurpleAir sensors overestimated concentrations in the presence of smoke particles and typical secondary urban aerosols. The difference between the PurpleAir sensor and the reference data varies diurnally over winter, with the largest differences observed at night and in the early morning (Fig. S2). Wood burning is more popular during winter evening recreation. It is therefore possible that wood smoke, a dominant PM2.5 source in winter in Phoenix (Ramadan et al., 2000), accumulates at night and that colder nighttime temperatures and overnight winter inversions can lower the mixing height thereby trapping emissions and elevating PM2.5 concentrations, contributing to a lower MOMA gain in winter. In contrast, there are periods (most frequently in July and August) when the PurpleAir sensors underestimate concentrations compared to the proxy reference (MOMA gain > 2.5) (Fig. 3). These periods were generally short and easily seen as PM2.5 spikes in the reference data as well as a reduction in visibility measured at the airport. According to White et al. (2023) a major dust storm was recorded in the NOAA Storm Event Database on 16 August 2020 in Maricopa, agreeing with the spike from the reference data (White et al., 2023). However, this was not observed in the sensor concentrations (e.g., 16–17 August 2020), consistent with previous findings that PurpleAir sensors underestimate PM2.5 concentrations during dust events due to the narrower particle size range detected (Ouimette et al., 2022; Stavroulas et al., 2020). Shortly after the dust event the 3 d rolling MOMA gain was < 1 in September 2020 and likely reflects the presence of wildfire smoke from one of California's worst wildfire seasons (Keeley and Syphard, 2021).
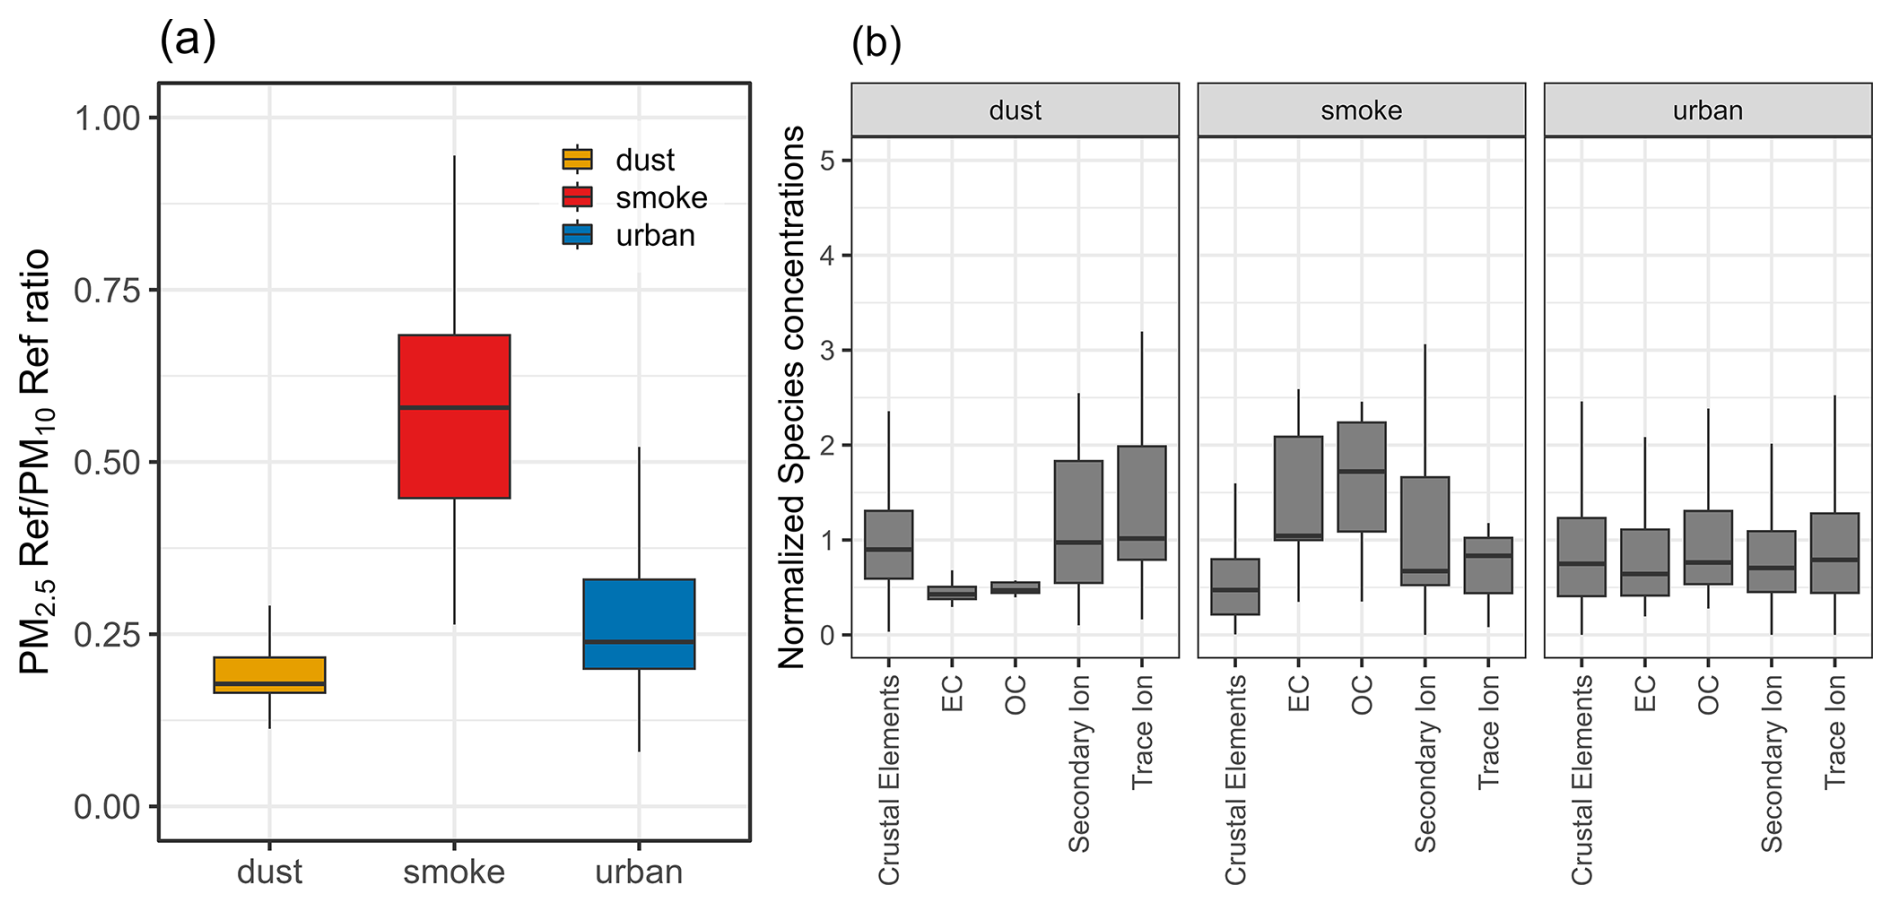
Figure 4(a) Daily averaged reference ratio measured across the AirNow reference network grouped by the three MOMA source categories. (b) Species concentrations, normalized to the mean category (crustal elements, EC, OC, secondary ion, trace ion) values, measured at PJLG for the three different MOMA source categories.
Given our findings, we separated our dataset into MOMA source categories representing smoke (MOMA gain ≤ 0.6) and dust conditions (MOMA gain > 2.5), with the remaining data considered to be typical urban PM2.5 (traffic, industrial). This resulted in 25 dust days (all in summer) and 16 smoke days (winter: 12; spring: 2; summer: 2) and 555 d dominated by typical urban conditions between July 2019 and April 2021. Figure 4 shows the mean reference ratio for each MOMA source category. As expected, smoke days were associated with a higher reference ratio (mean = 0.6) and with higher concentrations of elemental carbon (EC) and organic carbon (OC) compared to the other two categories which is also observed by Tong et al. (2012). Dust days, on the other hand, were dominated by larger particles (PM10 = 13.7–126.4 µg m−3, PM2.5 = 3.7–18.4 µg m−3) and higher concentrations of crustal elements compared to EC and OC concentrations. As a result, the ratio (mean = 0.2) was considerably lower compared to the smoke days. It is important to note that speciation data were only collected every third day and only 9 out of the 25 sampling days contained a full complement of data. Other sampling days were missing some speciation data. The urban category showed a more uniform distribution of species concentrations. Some urban days may coincide with short-lived dust and smoke events, and applying the daily averaged MOMA gain across the entire network – along with the choice and representativeness of proxies and thresholds – introduces classification uncertainties. The light grey shaded area in Fig. 3a represents the standard deviation of the daily MOMA gain, suggesting that the gain varies across sensors and hours within each day. This variability likely reflects differences in environmental conditions and the sensor–reference relationship across the network. Nevertheless, the ratios are in agreement with ratios (0.15–0.26) used by the U.S. EPA for fugitive dust particles (Midwest Research Institute (MRI), 2005) and other studies (Tong et al., 2012: < 0.35 for dust in western US; Sandhu et al., 2024: 0.23 for dust days in the greater Phoenix area).
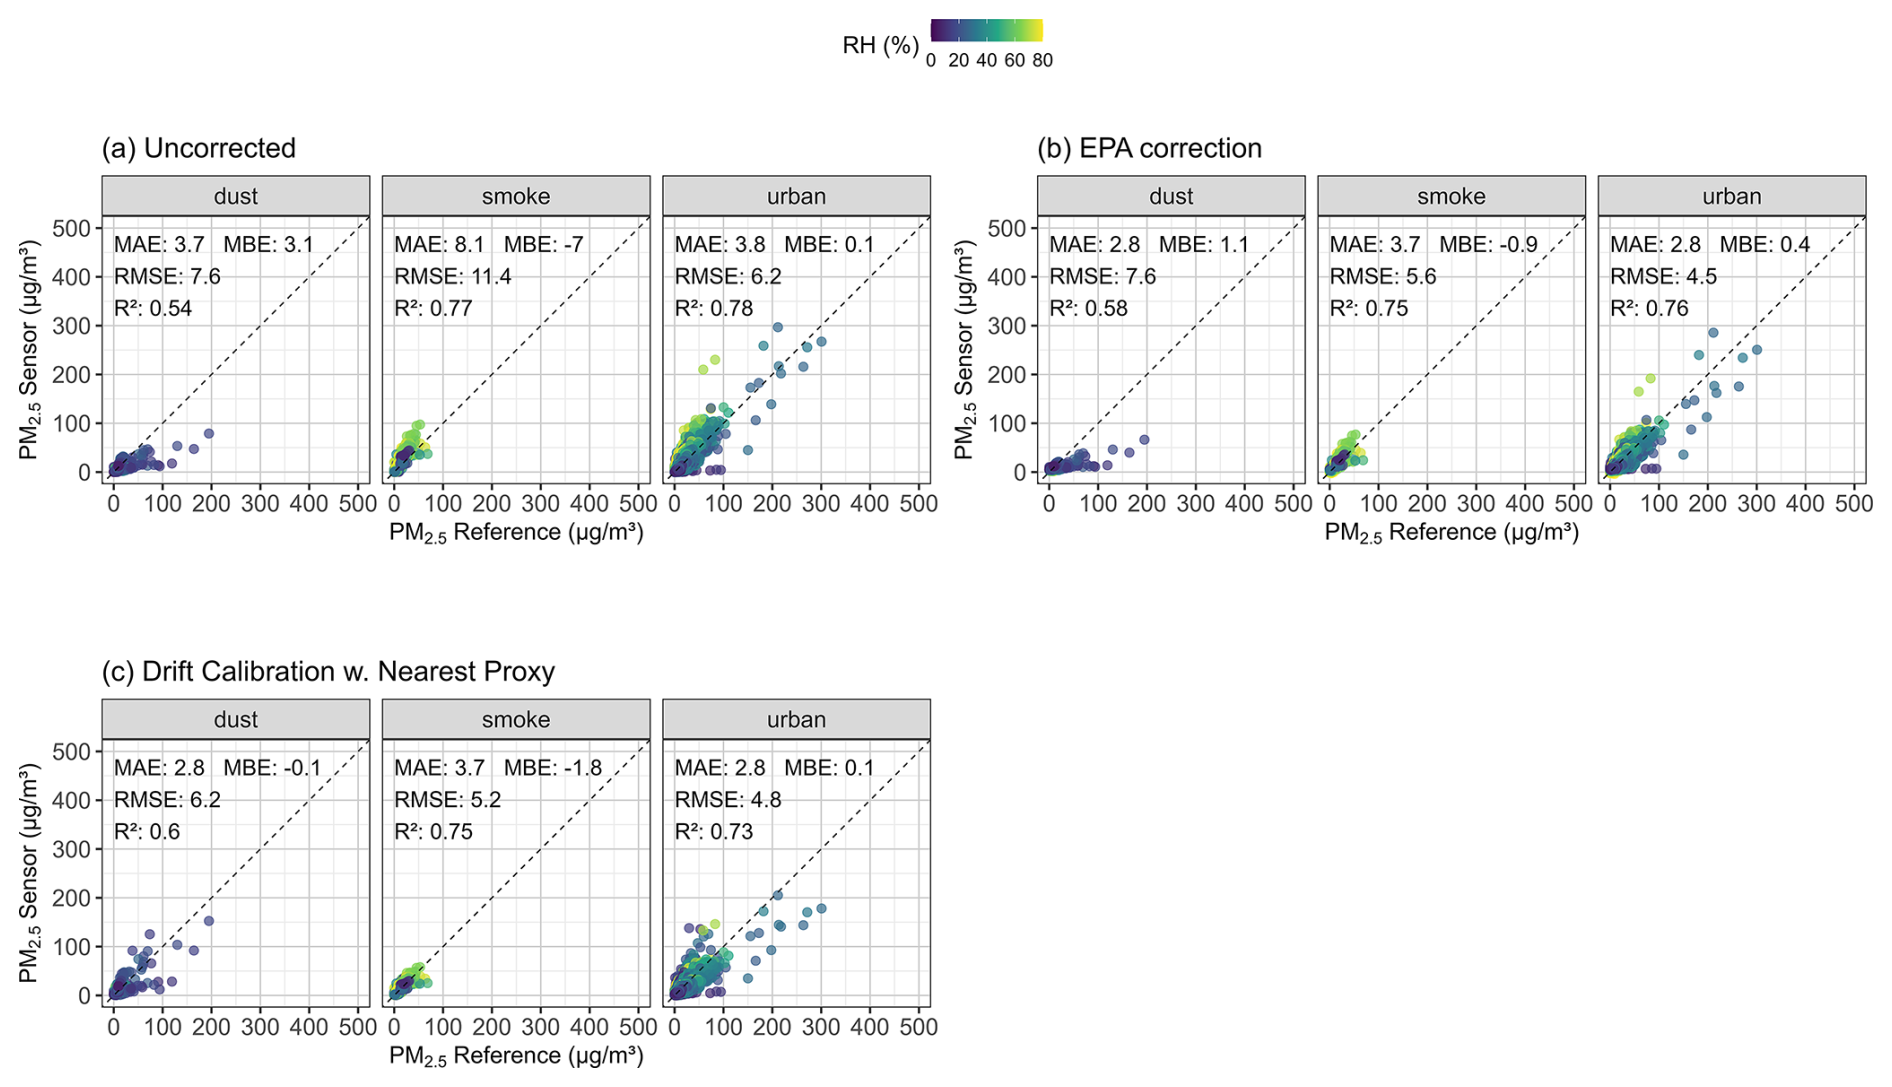
Figure 5Hourly sensor measurements compared to reference data at the four co-location sites for (a) uncorrected (“PM2.5_atm”) PM2.5 sensor data, (b) corrected sensor data using the EPA correction, and (c) MOMA-calibrated sensor data using the nearest proxy reference across the MOMA source categories (dust: 1992 h; smoke: 1251 h; urban: 44 601 h). Points are colored by RH (%).
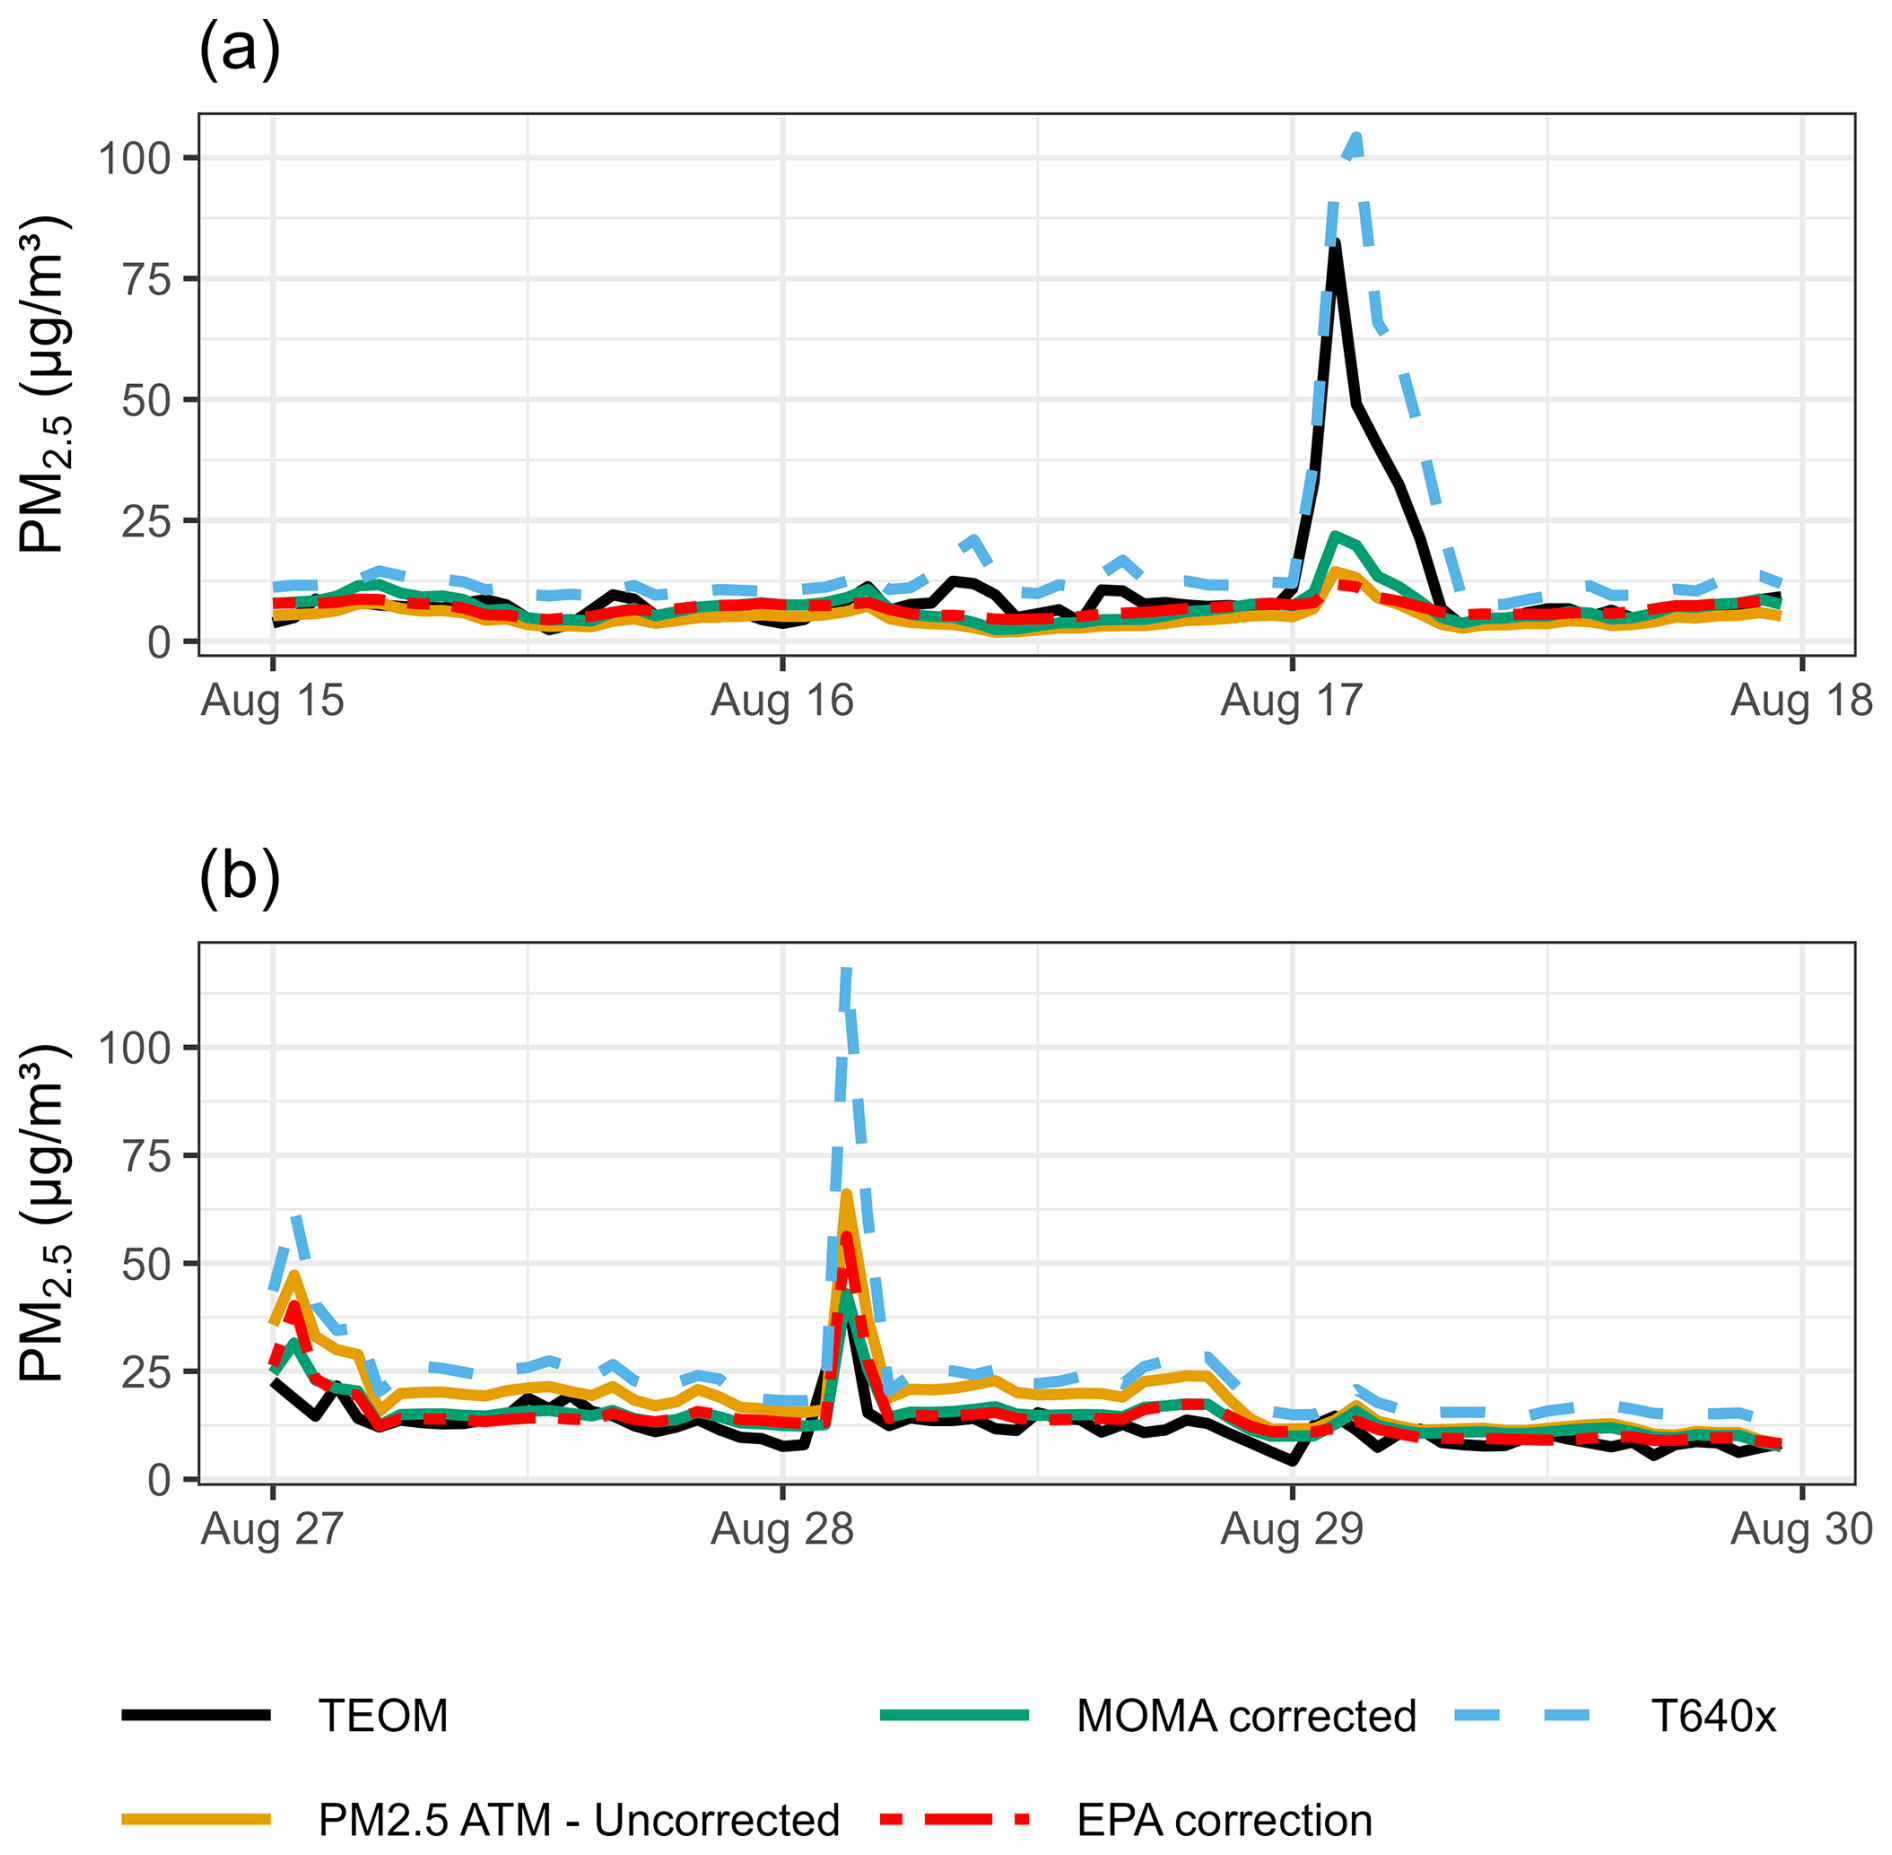
Figure 6PM2.5 concentrations measured at West Phoenix by the co-located TEOM and T640x reference and the PurpleAir sensor (PM2.5 ATM – Uncorrected), with the EPA correction and MOMA applied during the (a) dust event and (b) the wildfire smoke conditions.
3.2 Performance of MOMA under different conditions
Figure 5 shows the co-located reference data against the PurpleAir data without any correction (Fig. 5a), with the EPA correction (Fig. 5b) and the MOMA calibration against the nearest proxy reference (Fig. 5c) for data from the four co-location sites (Durango Complex, West Phoenix, South Phoenix, Mesa–Brooks Reservoir). As previously observed (Barkjohn et al., 2021; Holder et al., 2020; Jaffe et al., 2023), uncorrected PurpleAir sensor data correlated well with the co-located reference data as indicated by the high R2 (> 0.7) for winter smoke and typical urban conditions but overestimated PM2.5 at higher concentrations when smoke particles are present and RH is high (mean bias error (MBE) = −7 µg m−3). As expected, the relationship between the PurpleAir sensors and the co-located reference is poorer during dust conditions (R2 = 0.53) and the PurpleAir sensors underestimated PM2.5 (MBE = 3.1 µg m−3). Both the EPA correction and the MOMA calibration resulted in improved accuracy for all source categories as indicated by a reduction in the mean absolute error (MAE) and the MBE. Overall, MOMA performed comparably to the EPA correction in terms of MAE (2.8–3.7 µg m−3 for both) and root mean square error (RMSE) (4.8–6.2 µg m−3 versus 4.5–7.6 µg m−3, respectively) (Fig. 5). MOMA performed slightly better correcting for dust conditions, but neither the EPA correction nor the drift calibration framework was able to fully correct for the missed dust particles at high concentrations and the RMSE remained high. This was also observed in Fig. 6 which shows uncorrected, MOMA-calibrated and EPA-corrected data from August 2020 when a dust event (Fig. 6a) moved over Phoenix followed by wildfire smoke (Fig. 6b). Both the MOMA-calibrated data and the EPA-corrected data missed the dust spike but performed well during the wildfire event. In contrast, the T640x detected the dust event, indicating it is sensitive to the larger dust particles. This highlights the limitations of the design of the lower-cost PM sensor in the PurpleAir sensor which is insensitive to crustal dust (Jaffe et al., 2023; He et al., 2020; Ouimette et al., 2022; Kuula et al., 2020). This may be due to poor transport of larger particles into the sensor during high wind or into its optical cavity and/or poor light-scattering design (Kuula et al., 2020; Ouimette et al., 2024). In fact, mean wind speeds were higher during dust days (mean = 3.5 m s−1) compared to the other two MOMA source categories (< 3 m s−1), supporting findings by Ouimette et al. (2024), who reported a decline in sampling efficiency for larger particles at wind speeds greater than 3 m s−1. In contrast, during the wildfire episode (Fig. 6b) both the T640x and the PurpleAir sensors showed a positive bias versus the TEOM. This is well known for PurpleAir sensors (Barkjohn et al., 2021; Jaffe et al., 2023) and has also been observed for the T640x (Barkjohn et al., 2022; Long et al., 2023).
Table 2 shows the number of days that concentrations detected by the reference instrument were above the National Ambient Air Quality Standard (NAAQS) primary 24 h PM2.5 standard (35 µg m−3) as measured by the uncorrected sensor data, the MOMA-corrected data against the nearest proxy, and the EPA-corrected data. The reference instruments did not report concentrations above this threshold under smoke or dust conditions but did so on 7 d under typical urban conditions. Both the MOMA and EPA corrections improved accuracy near this concentration threshold but still slightly overestimated concentrations under urban conditions, with MOMA performing slightly better than the EPA correction.
Table 2Number of times the daily average concentration went above the EPA primary 24 h PM2.5 standard (> 35 µg m−3) detected by the co-located PurpleAir sensors when using uncorrected, MOMA-calibrated data against the nearest proxy and the EPA-corrected data across different MOMA source categories.
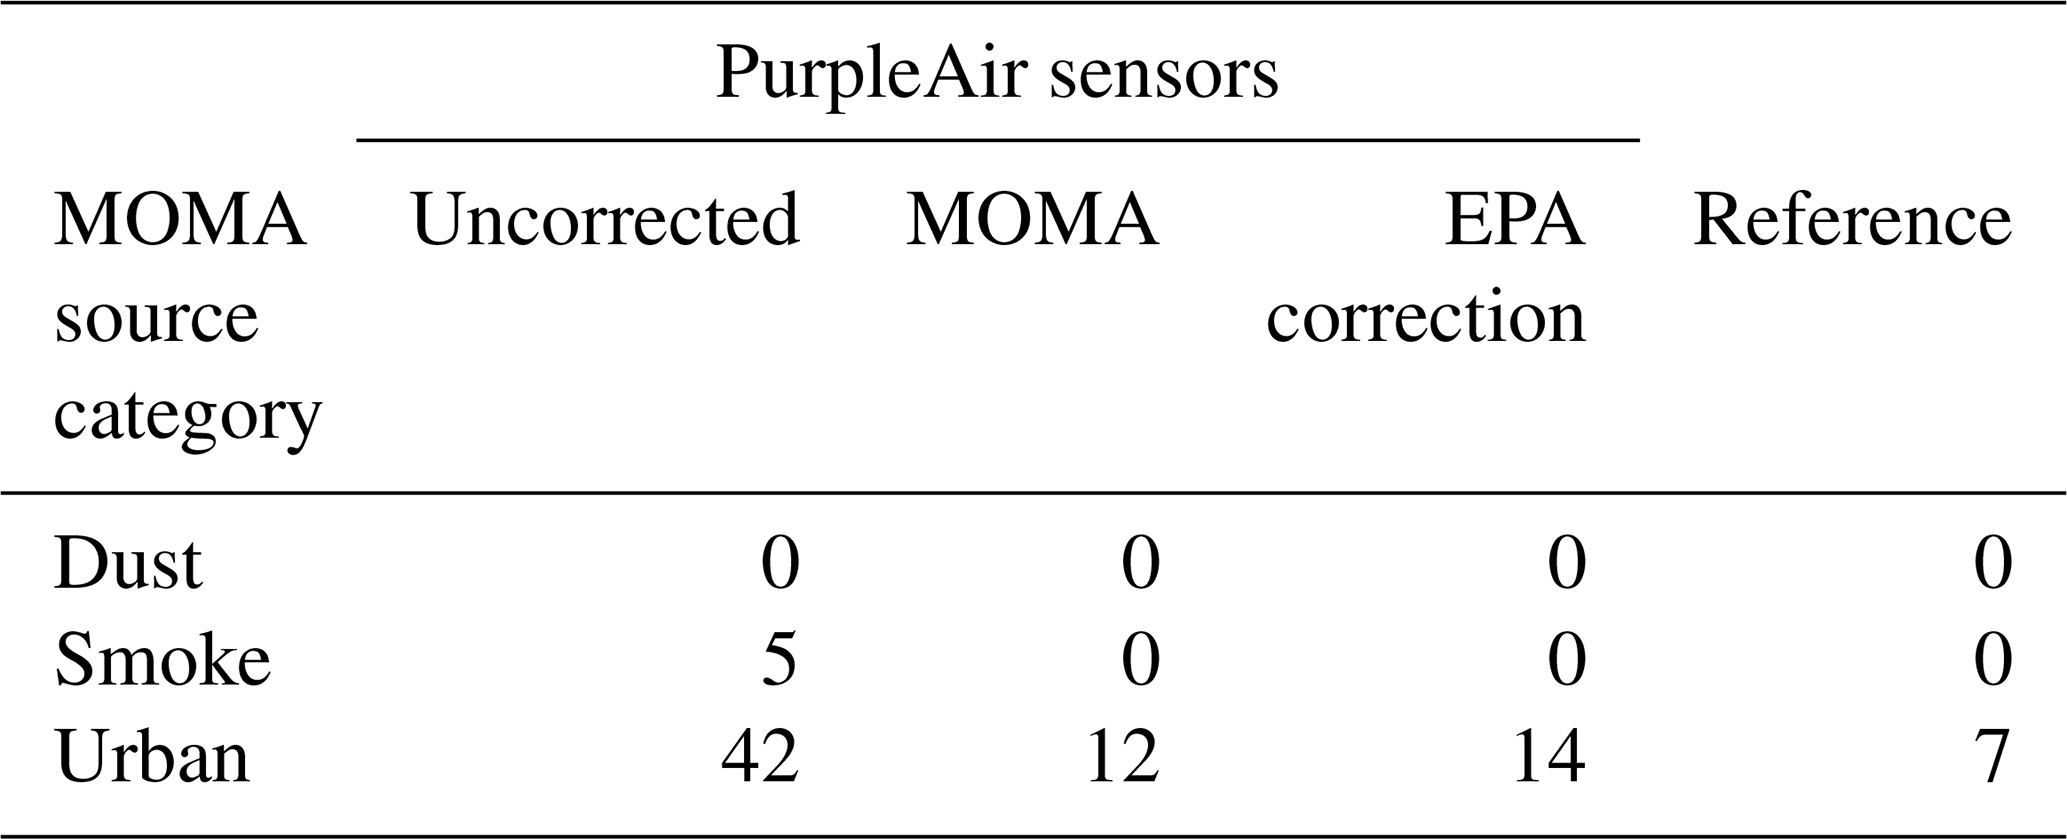
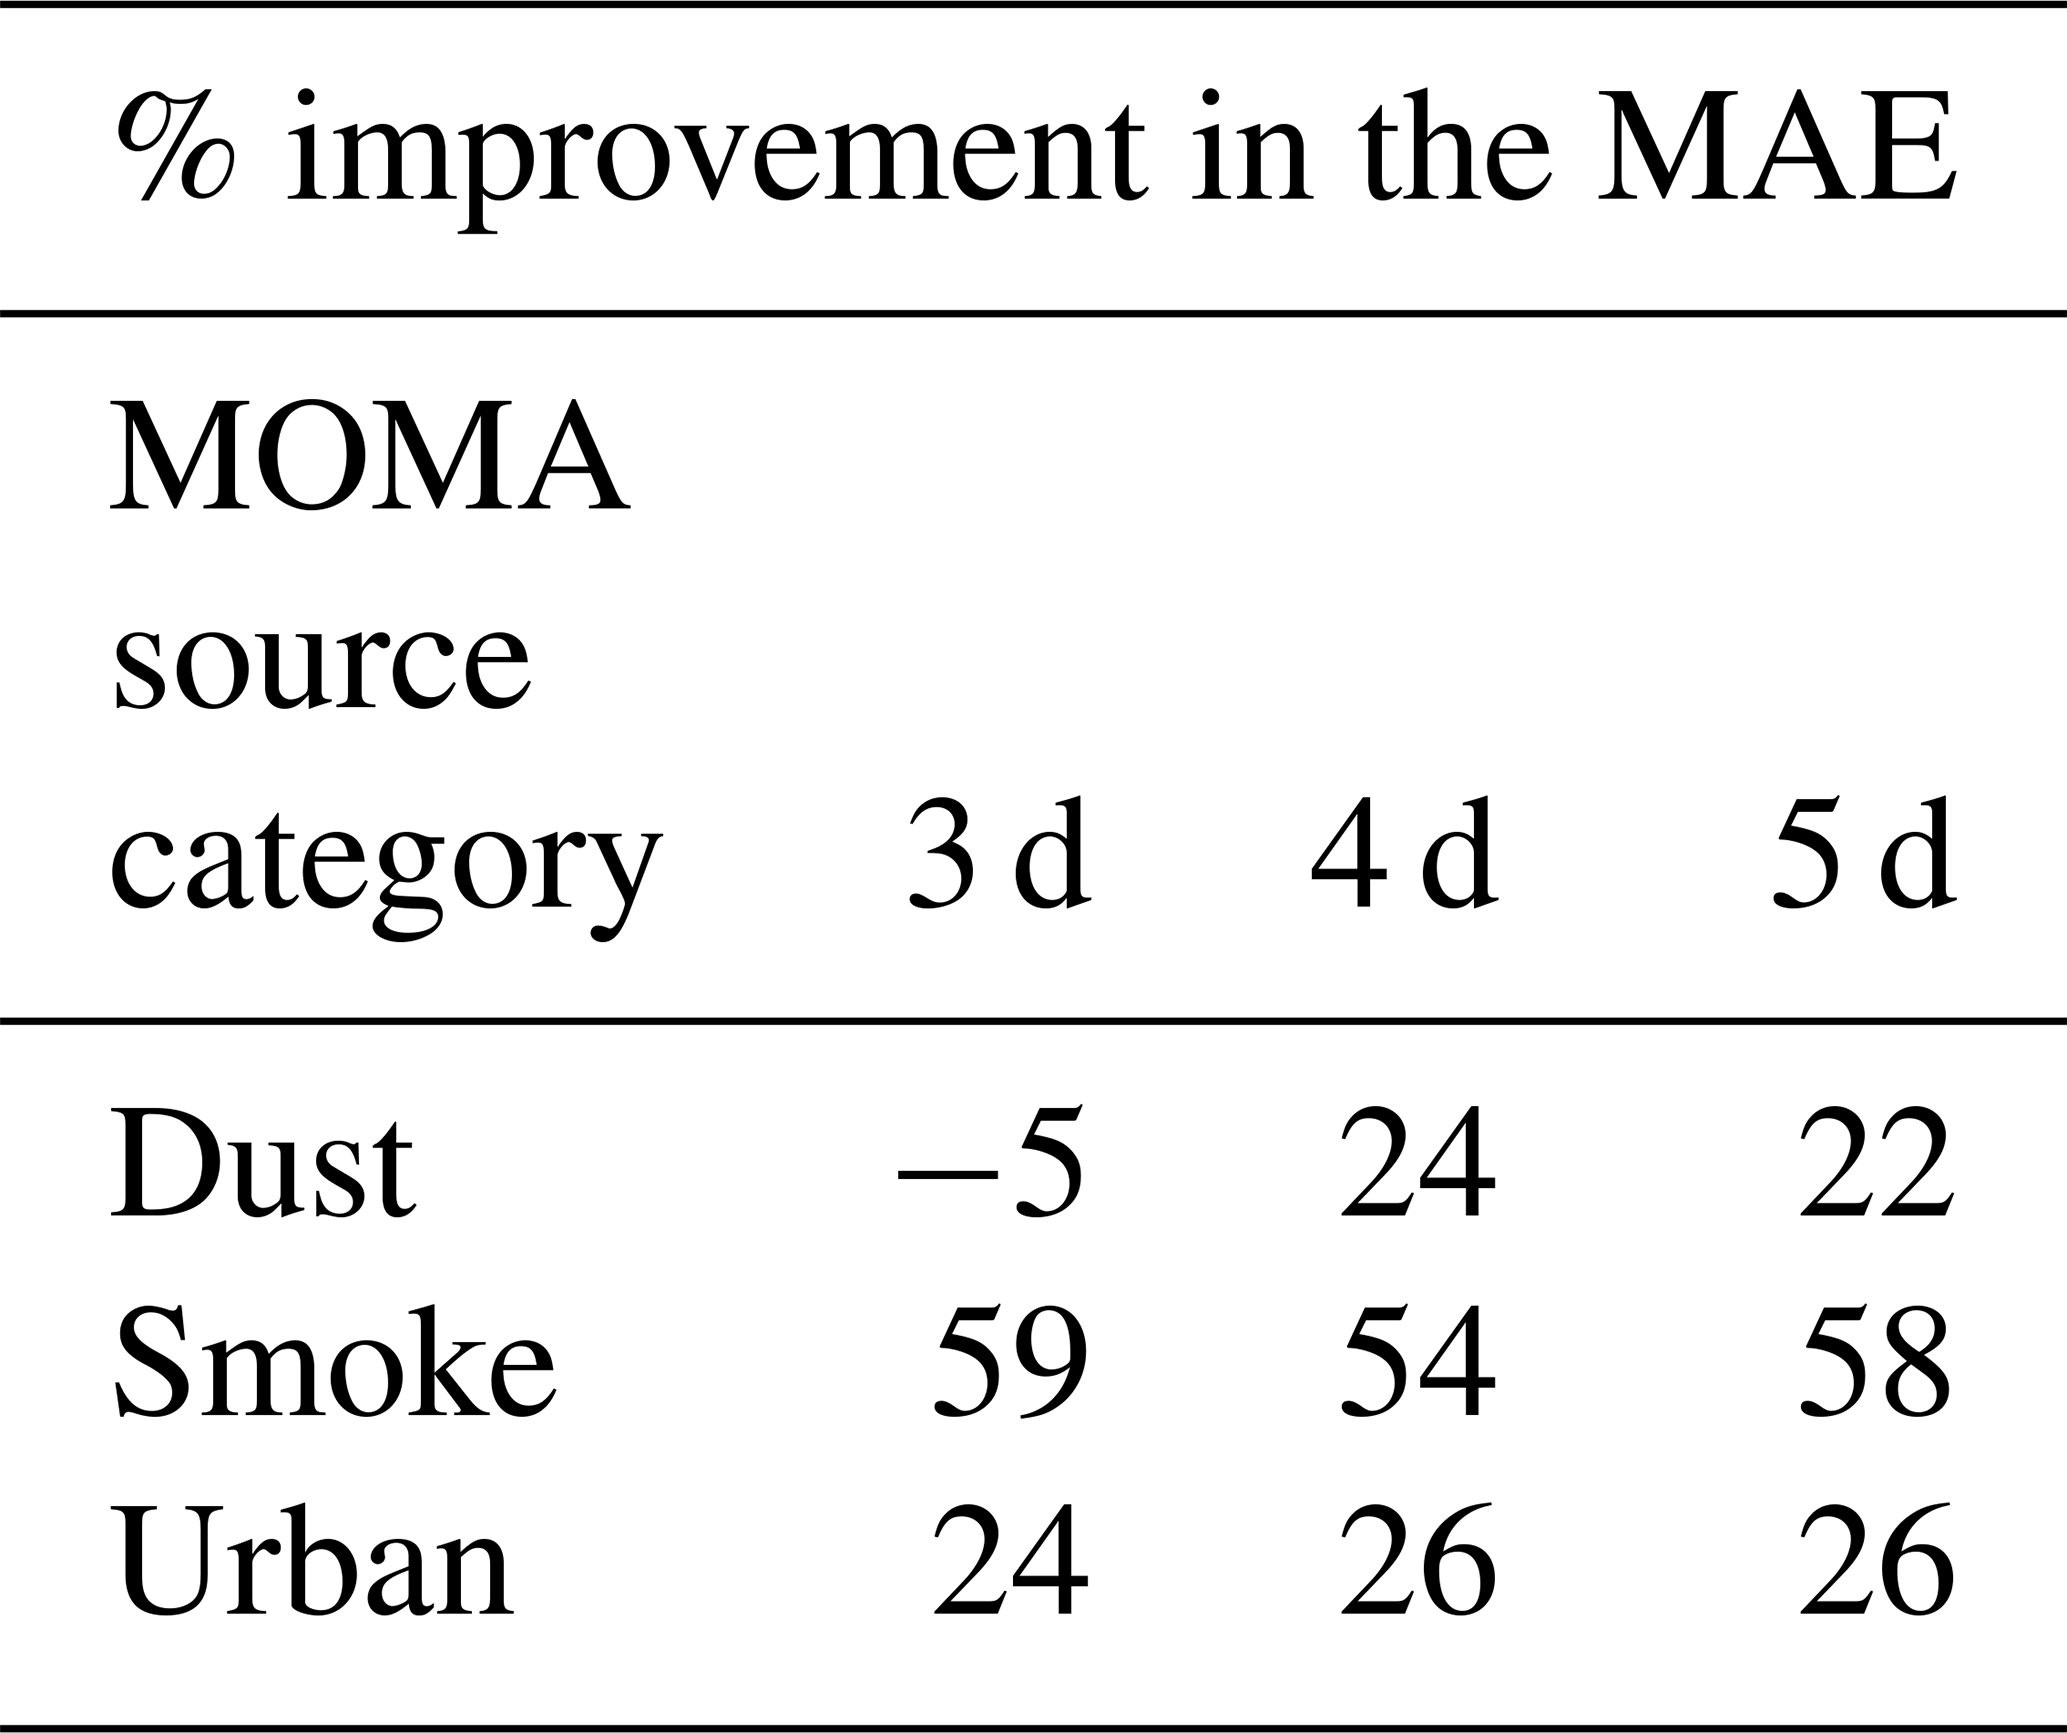
Table 3 shows a comparison of the MAE for MOMA with a 4 d (used throughout this paper), 3 d, and 5 d threshold to raise a drift alarm for each MOMA source category at the co-location sites. The length of the window used to trigger a calibration is a trade-off between over-correction and removal of local effects (shorter window), particularly when calibrating against a distant proxy, and minimizing the response time if a sensor is drifting (longer window). This is reflected in Table 3, which shows best improvements with a 4 d threshold and a decrease in the improvement of the MAE using a shorter or longer window to trigger a calibration, although there is some variation depending on the MOMA source category. This was observed across all sites; however the improvement was slightly better at West Phoenix and Mesa–Brooks Reservoir. The sensor–proxy pair South Phoenix–Durango Complex does not appear to be a suitable match. Durango Complex is located next to the City of Phoenix Transfer Station, a garbage collection site, and the pollutant sources and temporal variations may therefore be different from those observed at South Phoenix, which is representative of a residential area. However, overall differences are small, and the length of the window to trigger an alarm may also depend on the MOMA source category and its spatial variability.
Table 3Average percent improvement in the MAE before (PM2.5 ATM) and after the MOMA calibration for different drift detection thresholds measured for PurpleAir sensors at the co-location sites West Phoenix, South Phoenix, Durango Complex, and Mesa–Brooks Reservoir. Data were calibrated against the nearest proxy reference site and results compared to the co-located reference. These thresholds determine when a drift alarm is raised (i.e., the number of consecutive days a warning needs to be exceeded for before a correction is triggered).
This paper provided insights into the performance of the MOMA remote calibration tool and EPA correction for PurpleAir sensors and highlighted challenges related to calibrating PM sensors for seasonally and diurnally varying PM sources. MOMA improved the accuracy of the PurpleAir data, resulting in a similar hourly MAE, MBE, and RMSE as the EPA correction. The MOMA gain also provided a simple method of distinguishing between different MOMA source categories such as wood burning in winter and wildfires and dust events in summer. This may help identify PM sources based on sensor–reference relationships. However, further analysis is required to test the application of this classification across other climate regions in the US or worldwide and to refine thresholds used to classify dust and smoke events and to distinguish these efficiently from typical urban conditions.
We have highlighted the challenges in the calibration of PurpleAir sensors for Phoenix conditions in which the magnitude and sources of PM2.5 vary. The EPA correction is independent from reference sites and works well for smoke-dominated conditions but poorly for dust events. MOMA, being a dynamic method, is better at accommodating PM source variations, but rapid, short-term changes such as dust events and diurnally varying wood smoke patterns can also be challenging. In addition, MOMA is dependent on reliable proxy reference sites within 15 km of the sensor site representative of average pollution sources present at the sensor site, and the drift detection framework as applied here relies on several days of data to determine if a sensor has drifted.
The PurpleAir data from the Phoenix network are archived on Zenodo at https://doi.org/10.5281/zenodo.15174476 (Clements et al., 2025). The dataset used to explore seasonal effects in the application of the MOMA remote calibration tool is accessible via https://doi.org/10.23719/1532147 (Clements, 2025). The code is not publicly accessible due to intellectual property.
The supplement related to this article is available online at https://doi.org/10.5194/amt-18-3635-2025-supplement.
GSH, RMD, and ALC formulated the overarching research goals and aims; ALC planned and implemented the field study; LFW and GSH developed the methodology for this analysis; CC organized and quality assured the dataset used for this analysis; LFW developed the software and performed the data analysis; LFW prepared the manuscripts with contributions from all co-authors; RMD, ALC, and GSH supervised the project.
The authors declare the following financial interests/personal relationships which may be considered as potential competing interests: Lena Francesca Weissert and Geoff Steven Henshaw are employees of Aeroqual Ltd, a sensor manufacturer. Geoff Steven Henshaw is a founder and shareholder in Aeroqual Ltd.
Publisher's note: Copernicus Publications remains neutral with regard to jurisdictional claims made in the text, published maps, institutional affiliations, or any other geographical representation in this paper. While Copernicus Publications makes every effort to include appropriate place names, the final responsibility lies with the authors.
The authors acknowledge Sue Kimbrough (EPA retired), Ben Davis, Ron Pope, and Ira Domsky (Maricopa County Air Quality) for field study planning and implementation; Tim MacArthur, Alex Korff, Jacob Cansler, and Parik Deshmukh (Jacobs) for designing and building the P-TAQS pods; field data collection support by Robert Dyer (Maricopa County); data tracking and transfer by Nikki Petterson, Ceresa Steward, Hirna Patel (Maricopa County), and Brittany Thomas (Jacobs); and data quality assurance and preliminary data analysis by Ian VonWald (former ORISE postdoc to EPA).
The measurement campaign was funded internally by the U.S. Environmental Protection Agency's Office of Research and Development. In-kind field support was offered by Maricopa County Air Quality Department. In-kind analysis support was offered by Aeroqual Ltd.
This paper was edited by Albert Presto and reviewed by two anonymous referees.
Ardon-Dryer, K., Dryer, Y., Williams, J. N., and Moghimi, N.: Measurements of PM2.5 with PurpleAir under atmospheric conditions, Atmos. Meas. Tech., 13, 5441–5458, https://doi.org/10.5194/amt-13-5441-2020, 2020.
Badura, M., Batog, P., Drzeniecka-Osiadacz, A., and Modzel, P.: Evaluation of Low-Cost Sensors for Ambient PM2.5 Monitoring, J. Sensors, 2018, 1–16, https://doi.org/10.1155/2018/5096540, 2018.
Barkjohn, K. K., Gantt, B., and Clements, A. L.: Development and application of a United States-wide correction for PM2.5 data collected with the PurpleAir sensor, Atmos. Meas. Tech., 14, 4617–4637, https://doi.org/10.5194/amt-14-4617-2021, 2021.
Barkjohn, K. K., Holder, A. L., Frederick, S. G., and Clements, A. L.: Correction and Accuracy of PurpleAir PM2.5 Measurements for Extreme Wildfire Smoke, Sensors, 22, 9669, https://doi.org/10.3390/s22249669, 2022.
Carslaw, D. and Davison, J. Worldmet: Import Surface Meteorological Data from NOAA Integrated Surface Database (ISD), R package version 0.9.9.9000, GitHub, https://github.com/openair-project/worldmet (last access: 25 July 2025), 2025.
Castell, N., Dauge, F. R., Schneider, P., Vogt, M., Lerner, U., Fishbain, B., Broday, D., and Bartonova, A.: Can commercial low-cost sensor platforms contribute to air quality monitoring and exposure estimates?, Environ. Int., 99, 293–302, https://doi.org/10.1016/j.envint.2016.12.007, 2017.
Clements, A.: Phoenix-as-a-Testbed for Air Quality Sensors (P-TAQS) Dataset used in exploring the Seasonal Effects in the Application of the MOMA Remote Calibration Tool to Outdoor PM2.5 Air Sensors, U. S. EPA Office of Research and Development (ORD) [data set], https://doi.org/10.23719/1532147, 2025.
Clements, A., Kimbrough, E. S., VonWald, I., Croghan, C., Deshmukh, P., Davis, B., Pope, R., Domsky, I., and Dyer, R.: Phoenix-as-a-Testbed for Air Quality Sensors (P-TAQS) Dataset (v1), Zenodo [data set], https://doi.org/10.5281/zenodo.15174476, 2025.
Collier-Oxandale, A., Feenstra, B., Papapostolou, V., and Polidori, A.: AirSensor v1.0: Enhancements to the open-source R package to enable deep understanding of the long-term performance and reliability of PurpleAir sensors, Environ. Model. Softw., 148, 105256, https://doi.org/10.1016/j.envsoft.2021.105256, 2022.
Eagar, J. D., Herckes, P., and Hartnett, H. E.: The characterization of haboobs and the deposition of dust in Tempe, AZ from 2005 to 2014, Aeolian Res., 24, 81–91, https://doi.org/10.1016/j.aeolia.2016.11.004, 2017.
Elliott, C. T. and Copes, R.: Burden of mortality due to ambient fine particulate air pollution (PM2.5) in interior and Northern BC, Can. J. Public Health, 102, 390–393, https://doi.org/10.1007/BF03404182, 2011.
English, P. B., Olmedo, L., Bejarano, E., Lugo, H., Murillo, E., Seto, E., Wong, M., King, G., Wilkie, A., Meltzer, D., Carvlin, G., Jerrett, M., and Northcross, A.: The Imperial County Community Air Monitoring Network: A Model for Community-based Environmental Monitoring for Public Health Action, Environ. Health Persp., 125, 074501, https://doi.org/10.1289/EHP1772, 2017.
Fann, N., Lamson, A. D., Anenberg, S. C., Wesson, K., Risley, D., and Hubbell, B. J.: Estimating the national public health burden associated with exposure to ambient PM2.5 and ozone., Risk Anal., 32, 81–95, https://doi.org/10.1111/j.1539-6924.2011.01630.x, 2012.
Feenstra, B., Papapostolou, V., Hasheminassab, S., Zhang, H., Boghossian, B. D., Cocker, D., and Polidori, A.: Performance evaluation of twelve low-cost PM2.5 sensors at an ambient air monitoring site, Atmos. Environ., 216, 116946, https://doi.org/10.1016/j.atmosenv.2019.116946, 2019.
Grineski, S., Bolin, B., and Boone, C: Criteria Air Pollution and Marginalized Populations: Environmental Inequity in Metropolitan Phoenix, Arizona, Soc. Sci. Quart., 88, 535–554, https://doi.org/10.1111/j.1540-6237.2007.00470.x, 2007.
He, M., Kuerbanjiang, N., and Dhaniyala, S.: Performance characteristics of the low-cost Plantower PMS optical sensor, Aerosol Sci. Tech., 54, 232–241, https://doi.org/10.1080/02786826.2019.1696015, 2020.
Holder, A. L., Mebust, A. K., Maghran, L. A., McGown, M. R., Stewart, K. E., Vallano, D. M., Elleman, R. A., and Baker, K. R.: Field Evaluation of Low-Cost Particulate Matter Sensors for Measuring Wildfire Smoke, Sensors, 20, 4796, https://doi.org/10.3390/s20174796, 2020.
Jaffe, D. A., Miller, C., Thompson, K., Finley, B., Nelson, M., Ouimette, J., and Andrews, E.: An evaluation of the U.S. EPA's correction equation for PurpleAir sensor data in smoke, dust, and wintertime urban pollution events, Atmos. Meas. Tech., 16, 1311–1322, https://doi.org/10.5194/amt-16-1311-2023, 2023.
Keeley, J. E. and Syphard, A. D.: Large California wildfires: 2020 fires in historical context, Fire Ecol., 17, 22, https://doi.org/10.1186/s42408-021-00110-7, 2021.
Kosmopoulos, G., Salamalikis, V., Matrali, A., Pandis, S. N., and Kazantzidis, A.: Insights about the Sources of PM2.5 in an Urban Area from Measurements of a Low-Cost Sensor Network, Atmosphere, 13, 440, https://doi.org/10.3390/atmos13030440, 2022.
Kuula, J., Mäkelä, T., Aurela, M., Teinilä, K., Varjonen, S., González, Ó., and Timonen, H.: Laboratory evaluation of particle-size selectivity of optical low-cost particulate matter sensors, Atmos. Meas. Tech., 13, 2413–2423, https://doi.org/10.5194/amt-13-2413-2020, 2020.
Long, R. W., Urbanski, S. P., Lincoln, E., Colón, M., Kaushik, S., Krug, J. D., Vanderpool, R. W., and Landis, M. S.: Summary of PM2.5 measurement artifacts associated with the Teledyne T640 PM Mass Monitor under controlled chamber experimental conditions using polydisperse ammonium sulfate aerosols and biomass smoke, J. Air Waste Manage., 73, 295–312, https://doi.org/10.1080/10962247.2023.2171156, 2023.
Magi, B. I., Cupini, C., Francis, J., Green, M., and Hauser, C.: Evaluation of PM2.5 measured in an urban setting using a low-cost optical particle counter and a Federal Equivalent Method Beta Attenuation Monitor, Aerosol Sci. Tech., 54, 147–159, https://doi.org/10.1080/02786826.2019.1619915, 2020.
Malings, C., Tanzer, R., Hauryliuk, A., Saha, P. K., Robinson, A. L., Presto, A. A., and Subramanian, R.: Fine particle mass monitoring with low-cost sensors: Corrections and long-term performance evaluation, Aerosol Sci. Tech., 54, 160–174, https://doi.org/10.1080/02786826.2019.1623863, 2020.
McCrowey, C., Sharac, T., Mangus, N., Jager, D., Brown, R., Garver, D., Wells, B., and Brittingham, H.: A R Interface to the US EPA Air Quality System Data Mart API, https://cran.r-project.org/package=RAQSAPI (last access: 25 July 2025), 2023.
Midwest Research Institute (MRI): Analysis of the Fine Fraction of Particulate Matter in Fugitive Dust – Final Report, Western Governors' Association Western Regional Air Partnership (WRAP), MRI Project No. 110397, Denver, Colorado, 2005.
Miskell, G., Salmond, J. A., and Williams, D. E.: Solution to the Problem of Calibration of Low-Cost Air Quality Measurement Sensors in Networks, ACS Sens., 3, 832–843, https://doi.org/10.1021/acssensors.8b00074, 2018.
Miskell, G., Alberti, K., Feenstra, B., Henshaw, G. S., Papapostolou, V., Patel, H., Polidori, A., Salmond, J. A., Weissert, L., and Williams, D. E.: Reliable data from low cost ozone sensors in a hierarchical network, Atmos. Environ., 214, 116870, https://doi.org/10.1016/j.atmosenv.2019.116870, 2019.
Morawska, L., Thai, P. K., Liu, X., Asumadu-Sakyi, A., Ayoko, G., Bartonova, A., Bedini, A., Chai, F., Christensen, B., Dunbabin, M., Gao, J., Hagler, G. S. W., Jayaratne, R., Kumar, P., Lau, A. K. H., Louie, P. K. K., Mazaheri, M., Ning, Z., Motta, N., Mullins, B., Rahman, M. M., Ristovski, Z., Shafiei, M., Tjondronegoro, D., Westerdahl, D., and Williams, R.: Applications of low-cost sensing technologies for air quality monitoring and exposure assessment: How far have they gone?, Environ. Int., 116, 286–299, https://doi.org/10.1016/j.envint.2018.04.018, 2018.
Ouimette, J., Arnott, W. P., Laven, P., Whitwell, R., Radhakrishnan, N., Dhaniyala, S., Sandink, M., Tryner, J., and Volckens, J.: Fundamentals of low-cost aerosol sensor design and operation, Aerosol Sci. Tech., 58, 1–15, https://doi.org/10.1080/02786826.2023.2285935, 2024.
Ouimette, J. R., Malm, W. C., Schichtel, B. A., Sheridan, P. J., Andrews, E., Ogren, J. A., and Arnott, W. P.: Evaluating the PurpleAir monitor as an aerosol light scattering instrument, Atmos. Meas. Tech., 15, 655–676, https://doi.org/10.5194/amt-15-655-2022, 2022.
Ramadan, Z., Song, X.-H., and Hopke, P. K.: Identification of Sources of Phoenix Aerosol by Positive Matrix Factorization, J. Air Waste Manage., 50, 1308–1320, https://doi.org/10.1080/10473289.2000.10464173, 2000.
Robinson, D. L.: Accurate, Low Cost PM2.5 Measurements Demonstrate the Large Spatial Variation in Wood Smoke Pollution in Regional Australia and Improve Modeling and Estimates of Health Costs, Atmosphere, 11, 856, https://doi.org/10.3390/atmos11080856, 2020.
Sandhu, T., Robinson, M. C., Rawlins, E., and Ardon-Dryer, K.: Identification of dust events in the greater Phoenix area, Atmos. Pollut. Res., 15, 102275, https://doi.org/10.1016/j.apr.2024.102275, 2024.
Sayahi, T., Butterfield, A., and Kelly, K. E.: Long-term field evaluation of the Plantower PMS low-cost particulate matter sensors, Environ. Pollut., 245, 932–940, https://doi.org/10.1016/j.envpol.2018.11.065, 2019.
Snyder, E. G., Watkins, T. H., Solomon, P. A., Thoma, E. D., Williams, R. W., Hagler, G. S. W., Shelow, D., Hindin, D. A., Kilaru, V. J., and Preuss, P. W.: The Changing Paradigm of Air Pollution Monitoring, Environ. Sci. Technol., 47, 11369–11377, https://doi.org/10.1021/es4022602, 2013.
Stavroulas, I., Grivas, G., Michalopoulos, P., Liakakou, E., Bougiatioti, A., Kalkavouras, P., Fameli, K., Hatzianastassiou, N., Mihalopoulos, N., and Gerasopoulos, E.: Field Evaluation of Low-Cost PM Sensors (Purple Air PA-II) Under Variable Urban Air Quality Conditions, in Greece, Atmosphere, 11, 926, https://doi.org/10.3390/atmos11090926, 2020.
Tong, D. Q., Dan, M., Wang, T., and Lee, P.: Long-term dust climatology in the western United States reconstructed from routine aerosol ground monitoring, Atmos. Chem. Phys., 12, 5189–5205, https://doi.org/10.5194/acp-12-5189-2012, 2012.
Tryner, J., Mehaffy, J., Miller-Lionberg, D., and Volckens, J.: Effects of aerosol type and simulated aging on performance of low-cost PM sensors, J. Aerosol Sci., 150, 105654, https://doi.org/10.1016/j.jaerosci.2020.105654, 2020a.
Tryner, J., L'Orange, C., Mehaffy, J., Miller-Lionberg, D., Hofstetter, J. C., Wilson, A., and Volckens, J.: Laboratory evaluation of low-cost PurpleAir PM monitors and in-field correction using co-located portable filter samplers, Atmos. Environ., 220, 117067, https://doi.org/10.1016/j.atmosenv.2019.117067, 2020b.
U.S. EPA: Integrated Science Assessment for Particulate Matter (December 2019), U. S. Environmental Protection Agency, Washington, DC, 2019.
Wallace, L., Bi, J., Ott, W. R., Sarnat, J., and Liu, Y.: Calibration of low-cost PurpleAir outdoor monitors using an improved method of calculating PM2.5, Atmos. Environ., 256, 118432, https://doi.org/10.1016/j.atmosenv.2021.118432, 2021.
Wallace, L., Zhao, T., and Klepeis, N. E.: Calibration of PurpleAir PA-I and PA-II Monitors Using Daily Mean PM2.5 Concentrations Measured in California, Washington, and Oregon from 2017 to 2021, Sensors, 22, 4741, https://doi.org/10.3390/s22134741, 2022.
Weissert, L., Miles, E., Miskell, G., Alberti, K., Feenstra, B., Henshaw, G. S., Papapostolou, V., Patel, H., Polidori, A., Salmond, J. A., and Williams, D. E.: Hierarchical network design for nitrogen dioxide measurement in urban environments, Atmos. Environ., 228, 117428, https://doi.org/10.1016/j.atmosenv.2020.117428, 2020.
Weissert, L. F., Henshaw, G. S., Williams, D. E., Feenstra, B., Lam, R., Collier-Oxandale, A., Papapostolou, V., and Polidori, A.: Performance evaluation of MOMA (MOment MAtching) – a remote network calibration technique for PM2.5 and PM10 sensors, Atmos. Meas. Tech., 16, 4709–4722, https://doi.org/10.5194/amt-16-4709-2023, 2023.
White, J. R., Balling, R. C., and Cerveny, R. S.: Trajectory analysis of central Sonoran Desert dust storms, J. Arid Environ., 219, 105077, https://doi.org/10.1016/j.jaridenv.2023.105077, 2023.
Williams, D. E.: Low Cost Sensor Networks: How Do We Know the Data Are Reliable?, ACS Sens., 4, 2558–2565, https://doi.org/10.1021/acssensors.9b01455, 2019.