the Creative Commons Attribution 4.0 License.
the Creative Commons Attribution 4.0 License.
 | 16 Feb 2026
Correction of PM2.5 underestimation in low-cost sensors under elevated dust loading using only sensor measurements
Kamaljeet Kaur
Tristalee Mangin
Kerry E. Kelly
The Plantower PMS5003/6003 sensor is widely used for low-cost monitoring of particulate matter (PM), but it substantially underestimates PM2.5 and PM10 during periods of elevated dust loading, when the particle size distribution is dominated by particles > 1 µm in diameter. This limitation is especially critical in the arid regions, such as the western United States, where windblown dust frequently degrades air quality, visibility, and public health. Accurate estimation of PM2.5 and PM10 concentrations during periods dominated by dust typically relies on federal reference or equivalent methods (FRM/FEM), but these resources have limited spatial resolution. This study investigates whether PMS5003/6003 measurements alone can be used to detect and to bias correct for these dust-dominant PM conditions. We analyzed measurements from 109 PMS sensors collocated or near 75 U.S. EPA monitoring sites with hourly FEM PM2.5 and/or PM10 between January 2017 to May 2025. Two cutoff thresholds (threshold1 and threshold2) were developed using relative humidity and the sensor-reported ratio of coarse (2.5–10 µm) to submicron (0.3–1 µm) mass concentration to identify potential periods dominated by dust when the PMS sensor underestimated PM2.5 concentration. The thresholds can be used in real time, relying on the preceding 336 hourly measurements (consistent with PurpleAir's public archive display). To improve PM2.5 estimates from the PMS sensor (pm2.5_alt, a common correction for Plantower PMS measurements reported by PurpleAir), this study used pm2.5_alt measurements identified as potential dust-dominated periods to develop a correction factor through non-linear regression. This correction reduced the mean bias error between PMS PM2.5 estimates (pm2.5_alt) and FEM PM2.5 by approximately 50 % for 97 sensors, and reduced the root mean square error by approximately 30 % for 84 sensors. This framework enhances the utility of PMS5003/6003 measurements during periods of elevated dust loading, extending monitoring capabilities in regions where regulatory coverage is limited.
- Article
(3278 KB) - Full-text XML
-
Supplement
(9528 KB) - BibTeX
- EndNote


Plantower particulate matter sensors (PMS) are among the most widely used low-cost sensors for measuring particulate matter (PM) in ambient and indoor air (Barkjohn et al., 2021; Jaffe et al., 2023; Kim et al., 2025; Searle et al., 2023; Wallace et al., 2022). The PurpleAir (PA) network uses PMS sensors, and as of 12 August 2025, it had deployed 26 055 nodes worldwide (PurpleAir, 2025). Additionally, other sensor networks use PMS sensors (Air Quality Egg, 2025; AirGradient, 2025; Airly, 2025; Clarity, 2025; QuantAQ, 2025; TELLUS, 2025). The PMS5003 found in the PA-II is one of the most commonly used PM2.5 sensors; this sensor reports particle number concentrations in six size bins, along with PM1 (PM with aerodynamic diameter less than 1 µm), PM2.5 (PM with aerodynamic diameter less than 2.5 µm), PM10 (PM with aerodynamic diameter less than 10 µm), temperature (T), and relative humidity (RH) measurements (Barkjohn et al., 2021; Kaur and Kelly, 2023a; Sayahi et al., 2019; Searle et al., 2023). The PA-II typically contains two sensors per node, which provides an indication of measurement consistency (Barkjohn et al., 2021).
The PMS5003 sensor has been extensively studied, and numerous correction factors have been developed to improve its PM2.5 measurement accuracy under varying environmental conditions (Ardon-Dryer et al., 2020; Barkjohn et al., 2021, 2022; Cowell et al., 2022; Hong et al., 2021; Hua et al., 2021; Jaffe et al., 2023; Kaur and Kelly, 2023b; Magi et al., 2020; Mai et al., 2025; Malings et al., 2020; Mathieu-Campbell et al., 2024; Nilson et al., 2022; Patel et al., 2024; Raheja et al., 2023; Si et al., 2020; Tryner et al., 2020b; Wallace, 2023; Wallace et al., 2022; Weissert et al., 2025). Some of the most commonly used correction algorithms, such as pm2.5_alt and Barkjohn's U.S. universal correction, can be integrated into PurpleAir's real-time maps (Barkjohn et al., 2021; Wallace, 2023). However, a persistent limitation of the PMS sensors is their inability to accurately detect larger particles (roughly > 1 µm in diameter) (Gautam et al., 2025; He et al., 2020; Kaur and Kelly, 2023a; Kosmopoulos et al., 2023; Kuula et al., 2020; Ouimette et al., 2022; Tryner et al., 2020a), which leads to a significant underestimation of sensor-reported PM2.5 and PM10 concentrations during periods dominated by large particles, such as dust (Gautam et al., 2025; Jaffe et al., 2023; Kaur and Kelly, 2023b; Masic et al., 2020; Vogt et al., 2021; Weissert et al., 2025). This significant underestimation of PM levels during dust-dominant periods can be misleading. For example, looking at a map of PM2.5 concentrations from a source that utilizes Plantower PMS sensors during a dust-dominant PM episode will likely show inaccurately low PM concentrations, which can lead individuals and decision makers to significantly underestimate the associated health risks. Over the long term, this can lead to distrust in these low-cost sensor networks. Prior studies (Kuula et al., 2020; Ouimette et al., 2024, 2022) have demonstrated that this underestimation of coarse PM is due to scattering truncation error. This occurs because the photodiode in the sensor is poorly positioned to detect forward-scattered light, which is dominant for large particles, meaning the sensor often fails to register them effectively.
Identifying periods dominated by dust typically relies on FEM PM2.5 and PM10 measurements to obtain an estimate of coarse PM, which can be supplemented by satellite imagery, visibility reports, and high wind speed indicators (Hand et al., 2017; Jaffe et al., 2023; Kaur and Kelly, 2023b; Robinson and Ardon-Dryer, 2024; Sandhu et al., 2024; Tong et al., 2012). However, the availability of FEM, FRM, and other high-quality measurements is limited. For example, the continental United States has 2141 PM2.5 and 672 PM10 monitoring sites, respectively, with only 502 locations operating both PM2.5 and PM10 monitors (AirNowTech, 2025). In addition, satellite products are typically available after a time delay; for example, MODIS data is usually available 60 to 125 min after the satellite observation (NASA Earthdata, 2025). Thus, relying on FEM/FRM measurements or satellite products is impractical for large-scale or real-time applications (Brahney et al., 2024). To address these limitations, some studies have used nearby FEM sites to estimate correction factors for PMS sensors (Weissert et al., 2025). These methods often rely on rolling 3 or 4 d correlations or FEM-to-PMS concentration ratios, but such strategies have limitations, including limited spatial representativeness and time lags. Dust-dominated PM conditions typically last a few hours, as they are associated with short-term elevated wind speeds and larger particles settle quickly (Brahney et al., 2024). Common strategies for correcting low-cost PM sensor measurements, such as a rolling 3 or 4 d average, cannot be implemented in real time and may fail to capture periods dominated by larger particles because the averaging window can include both dust-dominated periods and periods dominated by other sources.
Recognizing periods dominated by dust is important in western regions of the United States, where such episodes can occur frequently due to arid landscapes, land disturbance, sparse vegetation, and high wind activity. These regions, including parts of California, Arizona, Utah, New Mexico, and Texas, experience elevated levels of windblown dust, which can significantly impact air quality, visibility, and public health (Ardon-Dryer et al., 2023a, b; Goudie, 2014; Hahnenberger and Nicoll, 2012; Kaur et al., 2025; Lei et al., 2016; Lewis et al., 2011; Robinson and Ardon-Dryer, 2024). Accurate detection and correction of dust-related pollution are therefore essential for both regulatory monitoring and public exposure assessments (Ardon-Dryer et al., 2023a).
This manuscript examines whether PMS measurements alone can be used to identify and bias-correct their measurements during periods dominated by larger particles (e.g., dust), without reliance on external data such as FEM monitors, satellite imagery, or meteorological information. This question is inspired by findings from Ouimette et al. (2024), who noted that although the PMS sensor is often described as a nephelometer, it actually counts individual particles. In the PMS sensor, the probability of detection increases with particle size, meaning larger particles are more likely to be counted. However, the PMS does not effectively size the large particles (> 1 µm) to the correct bin, due to scattering truncation errors. Correctly sizing these larger particles depends on their passage through the sensor's focal point, where sufficient light scattering occurs to be detected by the photodiode. Ouimette et al. (2024) estimated that the probability of a 10 µm particle being correctly sized in a PMS sensor to produce a detectable signal is less than 2 %. Consequently, on days with relatively low PM levels, counts in the coarse particle bin (2.5–10 µm) are expected to be negligible due to both the scarcity of coarse particles and the low probability of correct bin assignment. Even with the low probability of correct classification, during dust-dominated periods, the coarse bin registers higher counts compared to clean days, reflecting the increased presence of coarse particles and providing a potential pathway for identifying periods dominated by dust using the sensor alone. Building on this rationale, Jaffe et al. (2023) proposed using the ratio of 0.3 to 5 µm PMS bin counts as a dust indicator, suggesting a cutoff value of 190, below which measurements were likely associated with dust events, and suggested a correction method using the measurements from one site, Keeler, California. Their method improved corrected PMS PM2.5 measurements during dust events at this single controlled site (operated by the air quality agency), but it did not provide a useful correction for most of the 50 other sensors, collocated at monitoring stations (Jaffe et al., 2023).
Building on these previous studies (Jaffe et al., 2023; Ouimette et al., 2024), this study developed sensor-specific parameters for identifying potential periods dominated by dust, when PMS sensors severely underestimate PM2.5, derived solely from PMS sensor measurements, without relying on external data sources. By analyzing internal metrics, such as particle count distributions and RH, it provides a framework that can be applied to any PMS5003 sensor, regardless of location, to identify potential periods dominated by dust and to bias correct the sensor measurements of PM2.5 concentration. This approach expands the usability of the vast network of publicly available sensors during periods dominated by dust, even in areas where regulatory monitoring is lacking.
This section describes the PMS sensor, the data sources, and the time periods used in this study. It also describes the PMS sensor data cleaning procedures, the sensor parameters of interest, the post-processing and real-time approaches for identifying potential periods dominated by dust and for bias correcting the sensors' underestimates of PM2.5, as well as the statistical tools used for data analysis. This study focuses on identifying conditions that are specifically associated with PMS underestimation. It does not attempt to identify “dust events” in part because there is no well-defined dust event classification method based solely on FEM PM10 and PM2.5 measurements. Moreover, the PMS sensor's performance depends strongly on the underlying particle size distribution (Kaur and Kelly, 2023a; Kuula et al., 2020; Ouimette et al., 2024). Although the PMS sensors are inefficient at measuring particles with diameters > 1 µm (Kaur and Kelly, 2023a; Kuula et al., 2020; Ouimette et al., 2024), the PMS sensor can still provide reasonable estimates of PM2.5 concentrations when concentrations of particles > 1 µm in diameter are elevated, as well as particles ≤ 1 µm in diameter.
2.1 Plantower PMS5003 and PMS6003 sensors
Several studies have described the Plantower PMS5003 sensors and their laboratory and field performance (Barkjohn et al., 2021, 2022; Ouimette et al., 2024; Ouimette et al., 2022; Sayahi et al., 2019). PMS5003 uses a fan to create flow (∼ 1.67 mL s−1), a red laser (∼ 680 ± 10 nm), a scattering angle of 90°, and a photo-diode detector to measure total scattering from a plume of particles (Kaur and Kelly, 2023a; Ouimette et al., 2022). The sensor converts the total light scattering into several different air quality parameters, including particle counts in six bins (> 0.3, > 0.5, > 1, > 2.5, > 5, and > 10 µm), and PM1, PM2.5, and PM10 using an embedded algorithm. The flow path involves more than one 90° turn before particles reach the photodiode. Several other models of the Plantower PMS sensor exist (i.e., PMS1003, 3003, 6003, 7003, 9003, A003, T003, X003). Kaur and Kelly (2023a) evaluated PMS6003 and found that PMS5003 and PMS6003 exhibited similar performance to coarse PM. Many of the PMS models have similar configurations and likely exhibit similar challenges with accurately measuring coarse PM, although this has not been systematically evaluated.
This study used the PurpleAir network PMS sensors, i.e., PA-II. This study period began in 2017 and spanned several years, during which time the PA-II nodes came in different configurations (PA-II, PA-II-SD, and PA-II-FLEX), employed two different Plantower PMS sensors (PA-II and PA-II-SD: 5003 and PA-II-FLEX: 6003), and used different firmware versions (6.06b, 7.02, and 7.04). Due to the lack of detailed documentation on how different firmware versions affected sensor performance, no firmware-based exclusions were made. The PA-II-SD model is a PA-II sensor variant that includes an SD card for data storage; both of these variations were included in the study. The PMS6003, used in PA-II-FLEX, differs from PMS5003, primarily in the number of lasers used (as described in Kaur and Kelly, 2023a), but its flow design, performance, and overall configuration are similar to the PMS5003 (Kaur and Kelly, 2023a). Accordingly, PA-II-FLEX data were not treated differently in this analysis. The ratio of > 0.5 to > 0.3 µm (ratio greater than 0.4) was used to identify and exclude these alternate PMS5003, i.e., a PMS5003 version appeared in June 2021 for a limited period of time and exhibited PM2.5 concentrations that were biased low (Searle et al., 2023). For the remaining part of the manuscript, the sensors will be referred to as PMS sensors.
2.2 Sensor selection, data access, and cleaning
This study evaluated 109 PMS sensors at 75 different US EPA monitoring sites with hourly FEM measurements of PM2.5 and/or PM10. The US EPA provided measurements from 28 of these 109 collocated sensors, which were previously used by Barkjohn et al. (2021). These 28 sensors are a subset of the 50 sensors originally used in the Barkjohn paper because: 5 sensors were collocated with 24-hour averaged FRM measurements; 6 had less than 3 months of collocated measurements; 5 had poor correlation (R2 less than 0.5, after removing the coarse-rich days using FEM based coarse fraction and PM10 concentrations); 2 were situated at beach; and 4 were already downloaded as part of the 77 publicly available sensors (discussed below). The two sensors located at the beach were excluded due to the high humidity and high sea salt concentrations. Of the remaining 81 sensors, 77 were publicly available sensors, and raw data was downloaded (2 min frequency) using PurpleAir's Data Download Tool (v1.3.5), and 4 additional PMS5003s were available from the authors' group at the University of Utah. The publicly available sensors were considered collocated if the sensor had the same GPS coordinates (latitude and longitude) as the EPA monitoring site; if the sensor did not have the same coordinates but was within 0.8 km, the sensor was treated as a “nearby” sensor. Thirteen of the 77 sensors were “nearby” sensors, which increased spatial diversity by adding 13 additional monitoring sites. This study spanned from January 2017 to May 2025; however, data availability varied by sensor, depending on its deployment dates. The Supplement includes sensor IDs, the corresponding collocated EPA monitoring site IDs, and each sensor's data availability (Tables S1, S2, S3 in the Supplement) and a map with the 75 EPA monitoring sites used in this study (Fig. S1).
The downloaded measurements included particle counts in the six size bins, RH, and pm2.5_alt. All the sensors used in this study had a minimum of three months of reasonably continuous data. The PMS measurements were cleaned, partially following guidelines by Barkjohn et al. (2022). Specifically, the 2 min averages were converted to hourly measurements if 27 or more 2 min stamps existed in an hour (> 90 % completion). Otherwise, the measurement was considered incomplete and not further analyzed. Next, the hourly measurements of dual nodes were considered valid if (a) the difference between the pm2.5_alt values for A and B nodes of PA was less than 5 µg m−3, or (b) the relative percentage difference was less than 61 %. Barkjohn et al. (2022) used pm2.5_cf_1 (PM2.5 mass concentration reported by PMS sensor using a correction factor = 1), while this study used the pm2.5_alt to clean the PM measurements. We selected pm2.5_alt because pm2.5_cf_1 can exhibit random elevated values (order of 1000s) (Barkjohn et al., 2021), even when the number counts in the six bins are in a reasonable range. The pm2.5_alt is calculated directly from the bin counts (Wallace, 2023) and is less susceptible to random spikes. This study also used the PMS sensor's reported RH (using BME280, Bosch Sensortec, Germany) measurements. Therefore, PM measurements with missing RH were excluded from the study. This resulted in the removal of < 5 % of the measurement for 94 sensors, between 5 %–10 % for 7 sensors, between 10 %–22 % for 6 sensors, and 34.7 % and 64.9 % for the CA15 and CO3 sensors.
2.3 FEM measurements
FEM measurements of PM2.5 and PM10 were accessed from the AQS site (U.S. EPA, 2025b) for the period between January 2017–July 2024 (this data was unavailable after July 2024). For the remaining period, i.e., between July 2024–May 2025, the data was accessed through the AirNow API (AirNow, 2025).
Most sites employed the beta attenuation and broadband spectroscopy method (i.e., Teledyne T640 and T640x) for Federal Equivalent Method (FEM) hourly PM2.5 and PM10 measurements. A few sites also used FDMS (filter dynamic measurement system) in conjunction with a TEOM (tapered element oscillating microbalance) and laser light scattering (GRIMM) for hourly PM measurements. Tables S1, S2, and S3 detail the methods used for PM2.5 and PM10 measurement at each site.
Some sites had multiple parameter occurrence codes (POCs), either from different measurement methods or from multiple instruments using the same method operating concurrently. For sites with two different methods active simultaneously, measurements from the method with the greater number of measurements was used. For sites equipped with the Teledyne T640X and Teledyne T640, this study used the POC corresponding to the EPA-corrected measurements (U.S. EPA, 2025a).
The FEM measurements were used in two ways in this study. First, they were used to calculate the coarse fraction (CF), which was subsequently used to assess the effectiveness of the proposed method (Sect. 2.5) in identifying periods with a high proportion of coarse particles. Dust-dominated conditions are typically characterized by high CF values (> 0.7)(Sugimoto et al., 2016). Second, they were used to evaluate the performance of the derived corrections.
When both FEM PM2.5 and PM10 measurements were available, the coarse fraction (CF) was calculated as:
Where PM10 and PM2.5 were concentrations in µg m−3. Of the 109 sensors evaluated in this study, 30 sensors did not have CF data for their evaluation period, and 36 sensors had CF data for 90 % of their evaluation period. A total of 35 sensors had CF data for 40 %–90 % of their evaluation period, and the remaining 8 sensors had CF data for less than 30 % of their evaluation period.
2.4 Parameters
This study used the following parameters developed from the PMS sensors to identify potential PM measurements dominated by dust:
-
Ratio of mass in the coarse fraction to submicron fraction (C_to_SM): This ratio was defined as:
Where Mi–j represents the mass concentration (µg m−3) provided by the PMS sensor in the bin with size bin i–j µm. The is the average of valid Mi–j measurements from node A and node B of the PMS sensors. The Mi–j, used here and previously by Wallace (2023), was calculated as:
The Ni–j represents the number counts of particles (# dL−1) in the size bin i–j µm. The density was assumed to be 1 g cm−3, although density cancels out in the C_to_SM calculation. The 10−2 accounts for the unit conversions in the equation (µm3 to m3; g cm−3 to µg m−3; and 1 dL−1 to 1 m−3).
Because the particle counts in the 2.5–5 and 5–10 µm size bins are much lower than in smaller bins, mass concentrations were used instead of number concentrations to obtain more stable and interpretable ratios. The C_to_SM parameter was used to identify potential PM measurements dominated by dust. This approach builds on the rationale presented in Ouimette et al. (2024) and discussed in the Introduction. Briefly, although coarse PM has a low probability of correct classification, the coarse bin will register elevated counts during dust-dominated PM measurements. Consequently, the C_to_SM ratio becomes elevated during dust events.
-
RH: PMS sensor RH measurements are biased low by approximately 10 %–20 % (Mathieu-Campbell et al., 2024). This bias tended to increase at higher RH, although the PA's RH measurements generally show good correlation with regulatory RH measurements (R2 > 0.9) (Mathieu-Campbell et al., 2024). Dust events are typically associated with low RHs (< 40 %–60 %) (Csavina et al., 2014), as higher humidity tends to inhibit dust suspension and promotes faster resettling of particles. We used an RH of 50 %, as measured by the PMS sensor, as a threshold for detecting dust. It should be noted that an RH of 50 % reported by the PMS sensor corresponds to an actual RH of ∼ 70 %. The cutoff of 50 % is supported by Fig. S2, which illustrates that elevated C_to_SM with high CF was predominantly associated with RH less than 50 %. This study also explored dust-dominated PM measurements identified without the use of RH, and the results are discussed in Sect. S1 in the Supplement.
2.5 Methods for identifying potential dust-dominated PM measurements
Our method included two approaches. The first focuses on post-processing the sensor measurements to identify potential dust-dominated PM measurements and to develop appropriate corrections for subsequent applications. The second approach emphasizes real-time identification of potential dust-dominated PM measurements. Both approaches use the parameters C_to_SM and RH. The post-processing approach establishes the framework for real-time detection, as it provides a clearer way to illustrate the methodology. However, the same real-time approach could also be applied to post-processing the sensor data.
2.5.1 Post-processing approach
To identify potential dust-dominated PM measurements, two sensor-specific C_to_SM based thresholds (threshold1 and threshold2) were defined using the full dataset for each sensor.
-
Threshold1 was calculated as the sum of the median of C_to_SM and a factor (F of 2.5) times the median absolute deviation (MAD) of the C_to_SM.
-
Threshold2 was defined as the maximum of:
- i.
Three times the slope (with the intercept fixed at zero) from a linear regression of C_to_SM (y-axis) against pm2.5_alt (x-axis), or
- ii.
A value of 0.584, i.e., three times the median slope of the slopes from all the sensors evaluated in this study.
- i.
Figure 1 displays Threshold1 and Threshold2 for a subset of representative sensors (for selected sensors with a history of windblown dust impacts). Threshold1 was primarily used to differentiate clean days from those with elevated coarse particle concentrations. Because dust-dominated PM typically occurs under specific meteorological conditions (e.g., during dust events or wildfires), most measurements were expected to reflect low coarse PM concentrations. Consequently, most C_to_SM values represent these low-coarse concentration conditions, and the overall median serves as a baseline C_to_SM for such conditions. The outliers in the C_to_SM would represent high coarse concentration measurements. To identify these outliers, we excluded the measurements near the baseline by setting a threshold, i.e., 2.5 times the MAD of the median. Previous studies have reported that F values of 3, 2.5, or 2 are effective for detecting outliers (Leys et al., 2013), with F = 3 considered conservative and F = 2.5 moderately conservative.
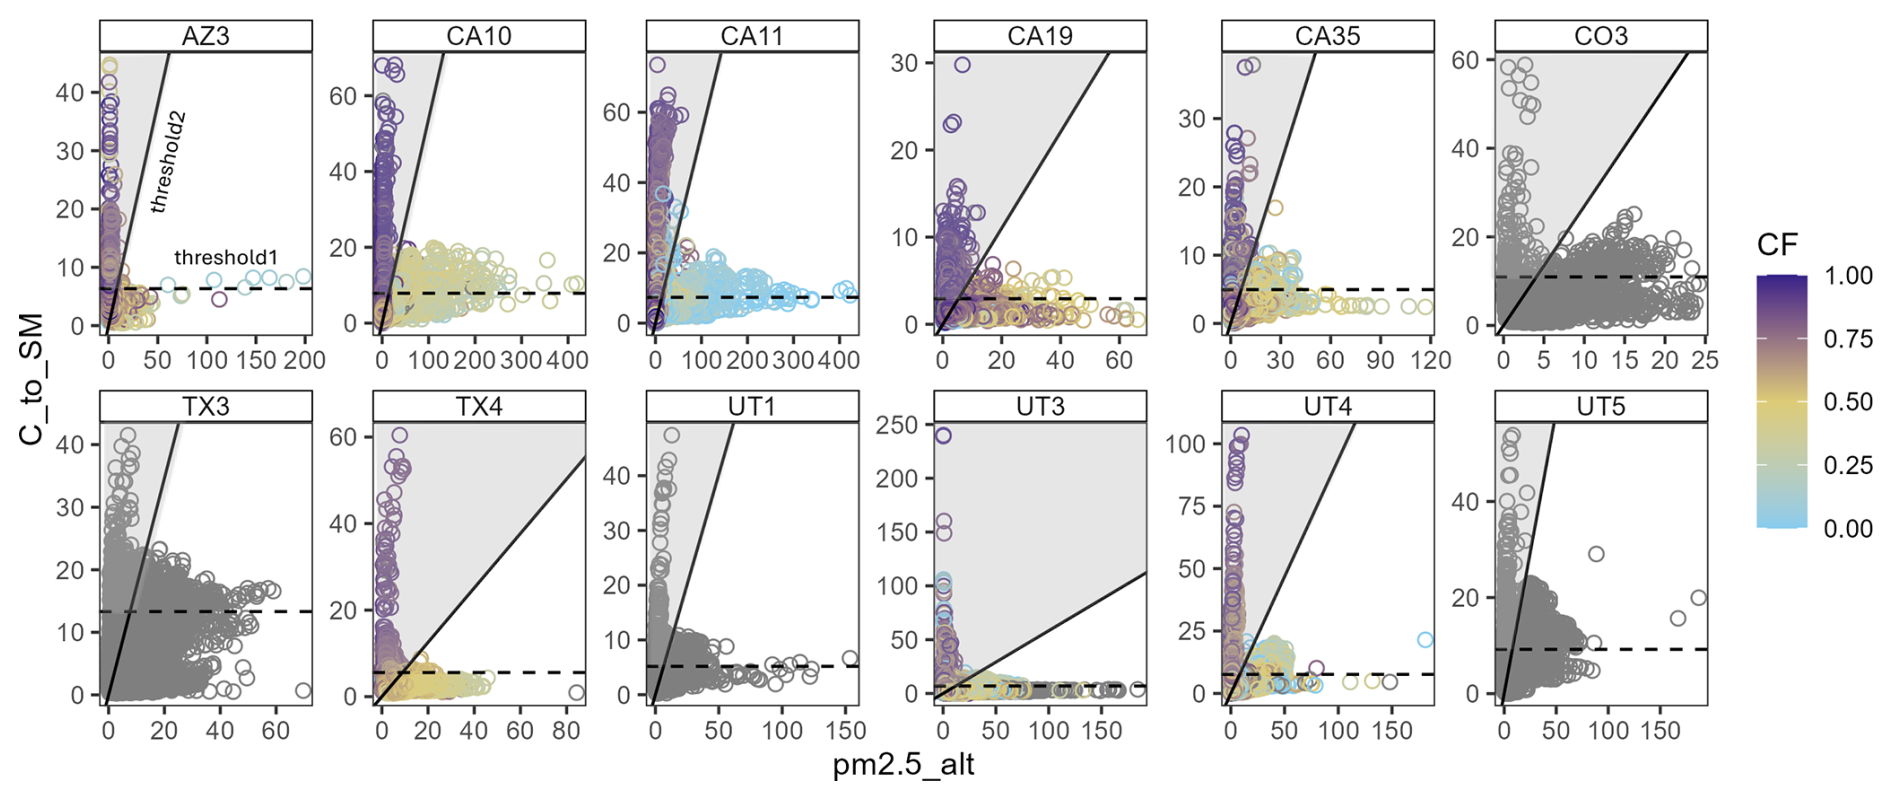
Figure 1pm2.5_alt vs. C_to_SM. Each point represents an hourly averaged sensor measurement, colored by the FEM-calculated CF. The black dashed line represents threshold1, and the black solid line represents threshold2. The shaded grey region indicates measurements identified as potential dust-dominated PM measurements. Grey circles represent times when either PM2.5 or PM10 was unavailable, preventing the calculation of CF. The comparison of pm2.5_alt vs. C_to_SM for the remaining sensors is shown in Fig. S3.
Threshold2 helped differentiate between potential dust-dominated PM from other sources that may also increase C_to_SM. For example, during wildfires, both PM10 and PM2.5 levels are typically elevated, which could lead to high C_to_SM values, but also high pm2.5_alt concentrations. Threshold2, defined by the slope between pm2.5_alt and C_to_SM (Fig. 1), serves as a threshold to filter out high C_to_SM values that are not associated with dust-dominated PM, specifically when both C_to_SM and pm2.5_alt are high.
Threshold1 and threshold2 were calculated using all available measurements, irrespective of the availability of FEM PM2.5 concentrations. A measurement was labeled as a potential dust-dominated PM measurement if:
-
C_to_SM exceeded threshold1, and
-
C_to_SM/pm2.5_alt exceeded threshold2, and
-
RH from the PA measured less than 50 %
2.5.2 Real-time detection of the dust-dominated PM measurements
For real-time potential dust-dominated PM measurements detection, threshold1 was defined as the median of C_to_SM plus 2.5 times its MAD, calculated from the preceding 336 hourly measurements (14 d). Thus, threshold1 was dynamic. This 14 d window was selected to match the temporal coverage of the PA real-time map, which provides the most recent 14 d of hourly measurements.
Threshold2 was set at a fixed value of 0.584, from the measurements discussed in the post-processing approach (Sect. 2.5.1). This fixed threshold of 0.584 was selected to avoid using a slope calculated from just 336 points, which can be highly sensitive to outliers, as a few extreme values can distort the slope.
2.5.3 Evaluating the effectiveness of the two approaches in selecting dust-dominant PM conditions
Figures 1 and S3 show that high C_to_SM tended to occur at low pm2.5_alt values, and measurements identified as potentially dust-dominant using threshold1 and threshold2 generally corresponded to elevated CF values. We evaluated the effectiveness of our two approaches by examining how the potential dust-dominant measurements corresponded to various bins of FEM CF values (0–0.25, 0.25–0.5, 0.5–0.7, and > 0.7). High CF values can occur under low PM10 conditions, when small PM concentrations lead to increased variability in the ratio and do not necessarily indicate dust-dominant conditions. We established criteria for “true dust-dominant PM”, defined when CF > 0.7 and FEM PM10 concentrations > 100 µg m−3 and compared how PMS-derived PM2.5 (pm2.5_alt) compares with FEM PM2.5 concentrations under true dust-dominant conditions. Note that a universally accepted definition of dust-dominant conditions does not yet exist.
Even during periods classified as true dust-dominant, PMS sensors can estimate PM2.5 reasonably well, as shown in Fig. S4, which compares PMS-derived PM2.5 (pm2.5_alt) with FEM PM2.5 concentrations. Agreement between PMS and FEM measurements under these conditions likely reflects the presence of mixed aerosol conditions, in which coarse dust particles coexist with submicron aerosols that contribute to PM2.5 and are detectable by the PMS sensor. The primary objective of the thresholds defined here is to identify conditions under which the PMS sensor underestimates PM2.5. Accordingly, PM2.5 underestimation was defined as measurements for which pm2.5_alt was less than 0.25 times the corresponding FEM PM2.5 concentration. For the true dust-dominant periods (CF > 0.7 and PM10 > 100 µg m−3), the analysis quantified the fraction of measurements exhibiting PM2.5 underestimation that were correctly identified by the thresholds. Of the 109 sensors evaluated, 79 sensors had sufficient data to calculate CF and were included in this analysis.
2.5.4 Correction of measurements identified as dust-dominated PM measurements
The pm2.5_alt concentration was corrected (referred to as adj_pm2.5_alt) using a non-linear regression model in R (4.4.0) that incorporated pm2.5_alt, C_to_SM, threshold1, and a scaling factor A. Measurements identified as potential dust-dominated PM measurements based on threshold1, threshold2, and RH thresholds were combined across all sensors for the post-processing approach and real-time approach. These pooled measurements were then used to estimate factor A for each approach through non-linear regression, as follows:
Threshold2 was not included in the correction equation because its sole purpose was to exclude measurements with a low CF that produced elevated C_to_SM values. In contrast, threshold1 was applied to normalize C_to_SM values, enabling measurements from all sensors to be pooled together. This normalization ensured that the correction was not disproportionately influenced by sensors with high C_to_SM values. By normalizing with threshold1, data from all sensors could be combined to derive a single factor (A).
2.6 Analysis
Data analysis was performed using R (4.4.0). The primary focus of the analysis was to compare pm2.5_alt with FEM PM2.5 concentrations, with an emphasis on potential dust-dominated PM measurements, and to evaluate the effectiveness of the applied correction approach. No additional corrections (i.e., adjustments for RH or FEM instrument calibration) were applied to pm2.5_alt. This study focused solely on the comparison between pm2.5_alt and FEM PM2.5, and adj_pm2.5_alt and FEM PM2.5. The performance of our correction approach was evaluated using the difference in the mean bias error (MBE, µg m−3) and root mean square error (RMSE, µg m−3; normalized RMSE represented as nRMSE) before and after correction of pm2.5_alt.
MBE, MBE_adj, RMSE, RMSE_adj, nRMSE, nRMSE_adj, and ΔRMSE were calculated only for those measurements identified as potential dust-dominated PM measurements; the remaining measurements were not corrected and not included in the calculation. Measurements identified using the real-time approach were corrected using three different values of A: (1) A derived from a non-linear regression (Eq. 6) using all measurements identified by the real-time approach; (2) A derived from a non-linear regression (Eq. 6) using measurements identified by the post-processing approach; and (3) sensor-specific A values, derived from sensor-specific non-linear regressions (Eq. 6) using real-time measurements for each sensor.
In the main manuscript, we present results for 12 representative sensors that have collocated measurements and are affected by windblown dust, including sensors in Utah, Arizona, Texas, Colorado, and California. The results for the remaining locations are discussed in the Supplement.
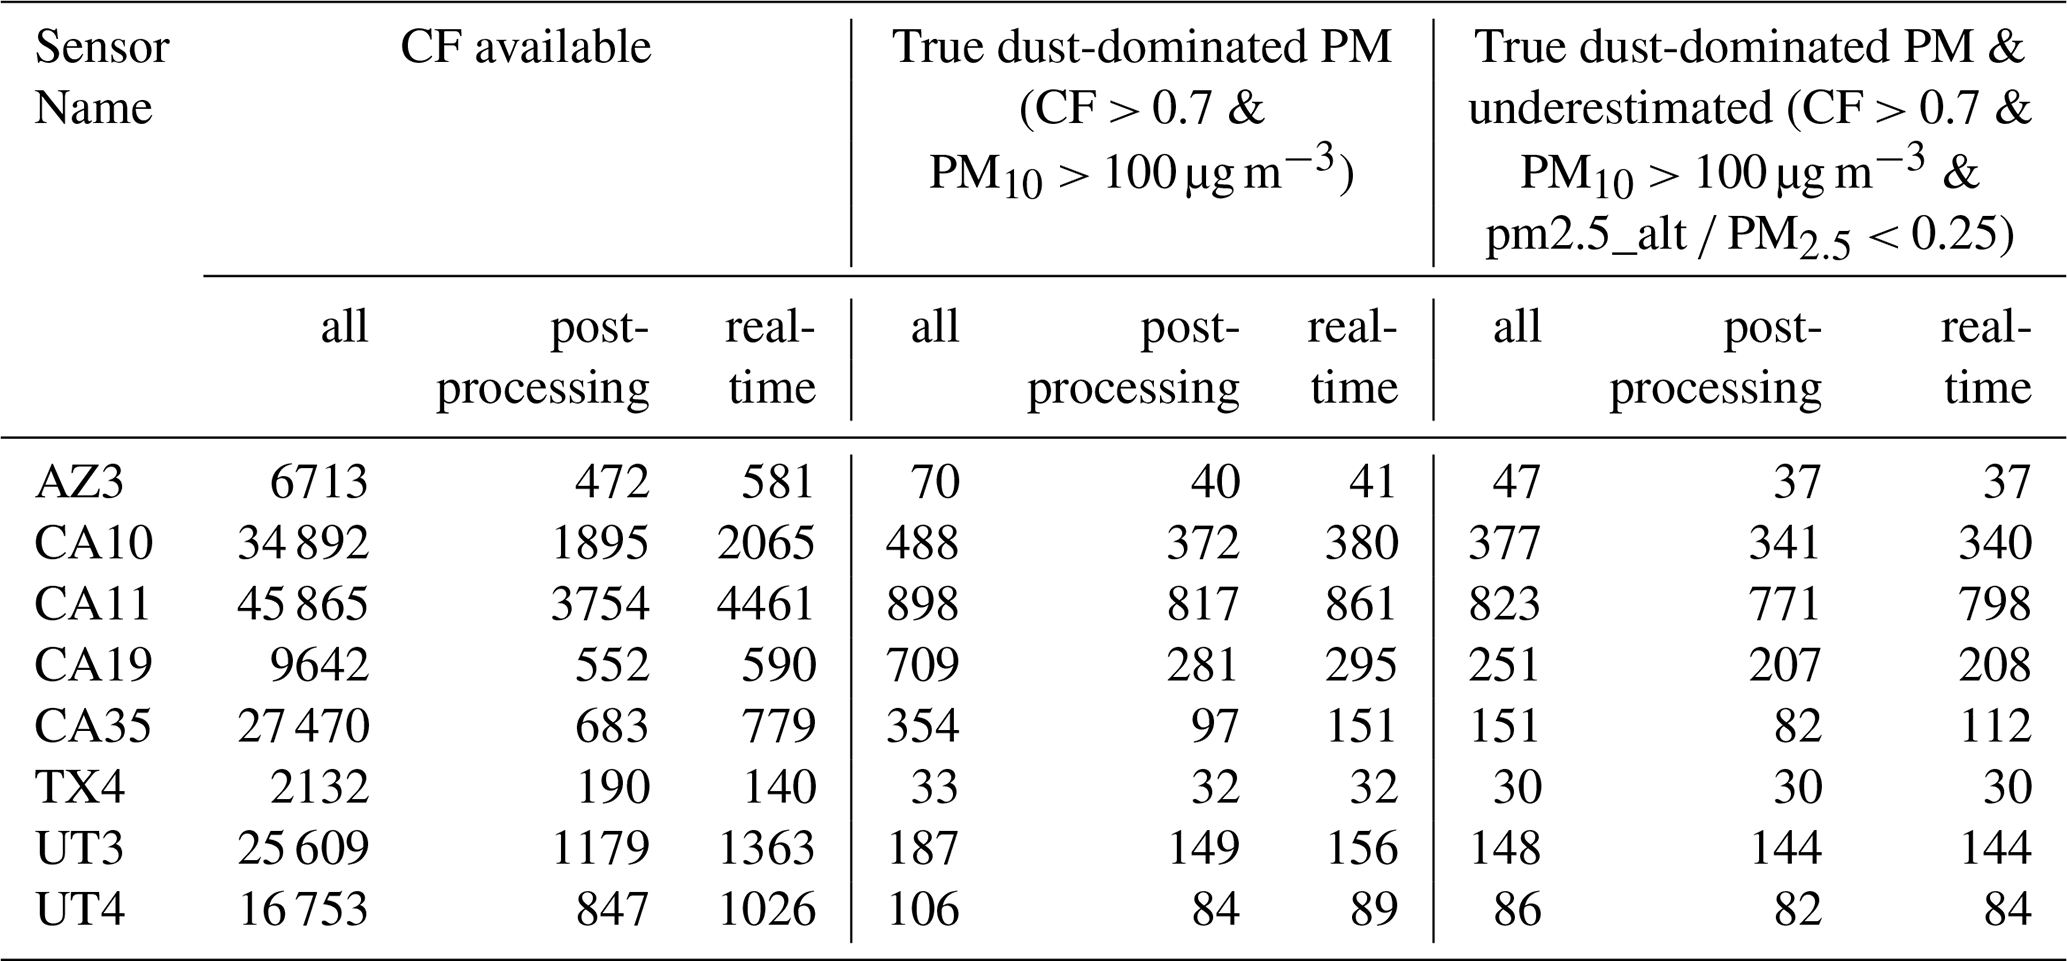
Table 1Counts of measurements with available CF; true dust-dominant measurements (CF > 0.7 and PM10 > 100 µg m−3); and true dust-dominated PM measurements with underestimated PMS PM2.5 concentration (pm2.5_alt PM2.5 < 0.25). Counts are reported for all measurements, for measurements identified using the post-processing approach, and for measurements identified using the real-time processing approach. Four of the 12 representative sensors did not have the appropriate measurements to calculate CF. Table S5 summarizes the counts for the remaining sensors.
3.1 Measurements identified as a potential dust-dominated PM using the thresholds
Table S4 summarizes the counts of the threshold-based identified measurements, which identified 0–3785 (post-processing approach: 0 %–9.00 % of the sensor's total hourly measurements) and 0–4513 (real-time approach: 0 %–9.62 % of the sensor's total hourly measurements) hourly measurements as potential dust-dominated PM measurements. These counts did not consider the availability of FEM PM2.5 measurements. The real-time approach generally identified more measurements than the post-processing approach (Fig. S5, Table S4). This outcome was expected because the real-time method used a dynamic threshold1, whereas the post-processing method used a constant threshold1. A dynamic threshold1 accommodated shifts in the C_to_SM baseline (defined in Sect. 2.5.1), which can occur when a sensor operates for extended periods (example in Fig. S6) or when a PMS sensor is replaced within a node (example in Fig. S6), resulting in C_to_SM baseline shifts due to differences in sensor-specific performance characteristics.
Seasonal variability in C_to_SM further complicated the use of a constant threshold1 (example in Fig. S6). When most measurements originated from seasons with elevated PM concentrations, the overall threshold1 was biased upward, leading to the rejection of high-coarse concentration measurements during seasons with lower C_to_SM values. The reverse was held when measurements were dominated by low-concentration seasons. In contrast, the dynamic threshold1 adjusted for these seasonal shifts, thereby improving the ability to identify dust-dominated PM measurements (Fig. S6).
Figure S7 compares the number of PMS measurements identified as potential dust-dominated PM measurements to the CF, grouped by CF bins (0–0.25, 0.25–0.5, 0.5–0.7, and > 0.7). The majority of potential dust-dominated measurements were associated with the CF > 0.7 bin (67.1 ± 23.4 % for the post-processing approach and 70.2 ± 20.8 % for the real-time approach), followed by the bin between 0.5 and 0.7 (18.9 ± 17.1 % and 19.2 ± 15.9 %, respectively). Fewer than 8.50 % of measurements fell within the 0.25–0.5 bin, and fewer than 5.50 % fell within the 0–0.25 bin. This distribution of potential dust-dominated PM measurements, with most measurements in CF > 0.7, supported the use of the thresholds derived in this study. The CF between 0.5 and 0.7 could have represented dust mixed with other sources.
Tables 1 and S5 summarize counts of true dust-dominant PM measurements and measurements with PMS PM2.5 underestimation across all sensors. For the 12 representative sensors (CF available for 8 sensors, Table 1), approximately 20 % of measurements identified using our thresholds were true dust-dominant PM measurements, and roughly 16 % were underestimated (pm2.5_alt PM2.5 < 0.25). The post-processing and real-time approaches captured 68.4 ± 24.7 % and 72.6 ± 22.2 %, respectively, of all measurements corresponding to true dust-dominated PM measurements. When restricted to underestimated PMS PM2.5 measurements meeting the same criteria, 86.5 ± 14.9 % (post-processing) and 89.7 ± 9.9 % (real-time) were captured. Across the remaining 71 sensors (Table S5), 11 %–12 % of measurements identified using our thresholds were true dust-dominant PM measurements, and 7 %–10 % exhibited PMS PM2.5 underestimation. Although these remaining 71 sensors had a smaller fraction of true dust-dominant PM, they accounted for 60.6 ± 30 % and 66.7 ± 25.6 % of the underestimated PMS PM2.5 measurements, in the post-processing and real-time approaches, respectively.

Figure 2Post-processing approach: Hourly averaged pm2.5_alt compared with FEM PM2.5 measurements (top). Black open circles indicate measurements identified as dust-dominated PM measurements. Hourly averaged adj_pm2.5_alt compared with FEM PM2.5 measurements (bottom). The color of the solid circles corresponds to the CF. The grey solid circles represent times when either PM2.5 or PM10 was unavailable, preventing the calculation of CF. n denotes the number of measurements identified as potential dust-dominated PM measurements, for a subset of data when FEM PM2.5 data were available. Table S4 shows the total number of potential dust-dominated PM measurements, regardless of FEM PM2.5 availability. Comparisons of pm2.5_alt and FEM PM2.5 for the remaining sensors were presented in Figs. S8 and S9.
3.2 PM2.5 vs. pm2.5_alt: post-processing approach
Figure 2 (top) compares the pm2.5_alt with FEM PM2.5 concentrations, with measurements identified as potential dust-dominated PM marked as black circles, for the 12 representative sensors. The identified measurements corresponded predominantly to cases in which pm2.5_alt underestimated FEM PM2.5, typically associated with CF > 0.7. The potential dust-dominant measurements identified from all sensors were pooled, and using Eq. (6), factor A was estimated at 0.702. The corrections were applied to measurements identified as potentially dust-dominated PM, while all other observations remained unchanged. Figure 2 (bottom) illustrates the measurements after correction. The coefficient of determination (R2, using just the identified measurements) increased from 0.290 for pm2.5_alt versus FEM PM2.5 to 0.653 for adj_pm2.5_alt versus FEM PM2.5. Sensor-specific changes in R2 are presented in Table S6. Comparisons of pm2.5_alt and FEM PM2.5 for the remaining sensors were presented in Figs. S8 and S9.
Figure 3 presents MBE, MBE_adj, and ΔRMSE. MBE value closer to zero indicates better sensor performance, meaning that the sensor-estimated PM2.5 concentrations are more consistent with the FEM PM2.5 measurements. For the 12 representative sensors shown in the main manuscript, MBE decreased by 52.4 ± 16.9 % on average, with MBE ranging between −20.8 and −4.71 µg m−3 and MBE_ adj ranging between −16.7 and −2.07 µg m−3. These results indicate that although the sensor's PM2.5 estimation improved it remained less than FEM PM2.5 after correction. For these 12 sensors, RMSE also decreased by 42.3 ± 15.9 %, with ΔRMSE ranging between −18.0 and −1.3 µg m−3, indicating a reduction in error following correction. The corresponding nRMSE shows the same trends as those for RMSE, and these values can be found in Table S7.
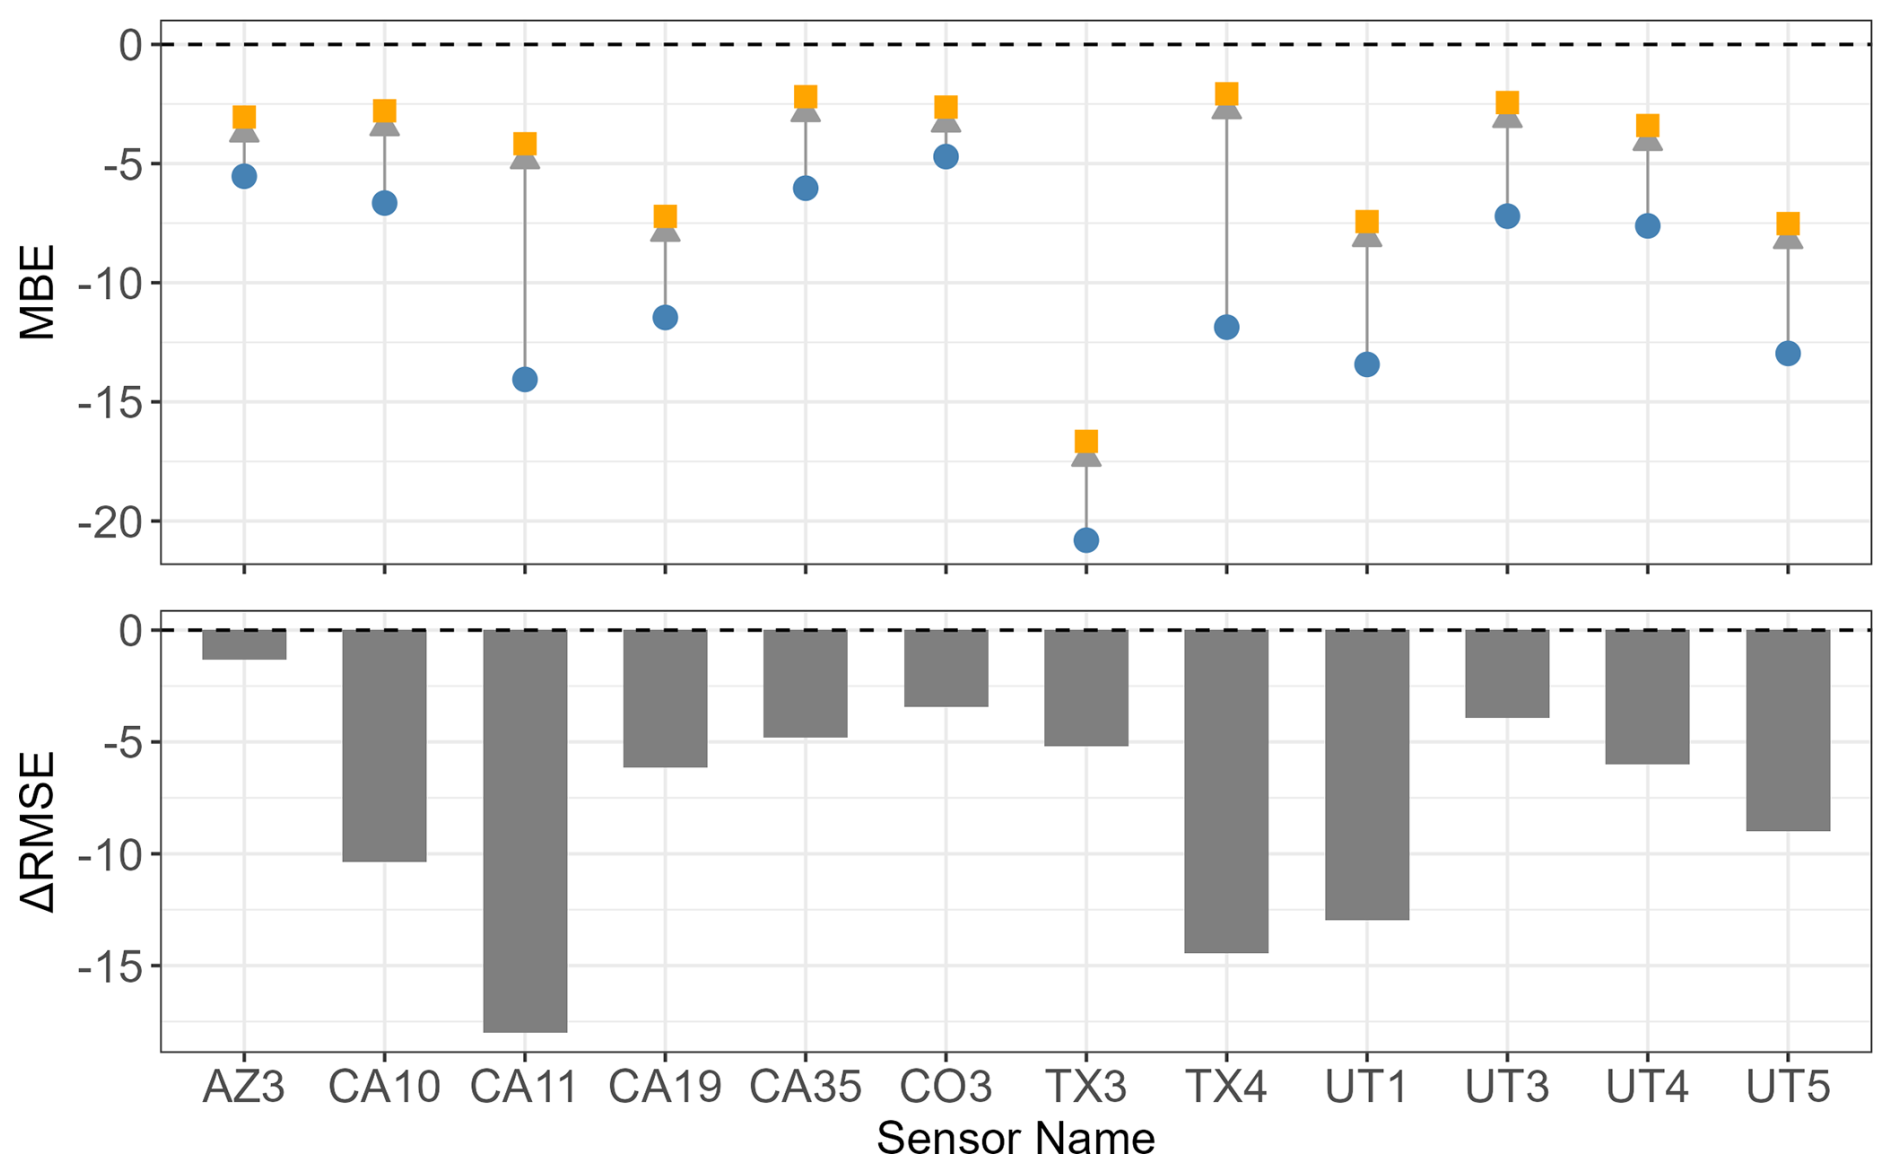
Figure 3Post-processing approach: MBE (µg m−3) with respect to FEM PM2.5 before and after correcting pm2.5_alt (top). The blue dot represents the MBE before correction, while the orange square represents the MBE after correction (MBE_adj). The grey arrow highlights the direction of the MBE shift after correction. Change in RMSE (ΔRMSE, µg m−3) (bottom). Comparisons of MBE and RMSE for the remaining sensors are presented in Fig. S10 and Tables S4 and S7. Table S7 also reports ΔnRMSE for all the sensors.
For the remaining sensors (Fig. S10, Tables S4 and S7), 82 sensors showed decreases in MBE, with MBE ranging between −14.6 and −1.54 µg m−3 to MBE_adj between −7.60 and 0.76 µg m−3, i.e., a bias error reduction of 49.6 ± 22.9 %. The RMSE decreased by 27.2 ± 14.3 % for 72 sensors (ΔRMSE ranging between −15.8 and −0.0965 µg m−3) and increased for 23 sensors (ΔRMSE ranging between 0.127 and 15.9 µg m−3). Five sensors (Fig. S10) showed a decrease in MBE (with MBE_adj ranging from −3.52 to −0.818 µg m−3), but an increase in ΔRMSE (from 11.2 to 17.5 µg m−3). Extreme overcorrection of a few measurements for these five sensors was likely responsible for this behavior.
Thirteen sensors exhibited MBE_adj greater than 1 µg m−3 and positive ΔRMSEs (Fig. S10 and Table S7), indicating the correction led to an overestimation of the PMS PM2.5 concentrations. Among the sensors with positive MBE_adj (Fig. S10), 7 had fewer than 60 potential dust-dominated PM measurements (< 0.6 %, Table S4), and these 7 belonged to locations in Alaska, Iowa, Oregon, Washington, and Vermont that are infrequently affected by dust. Even for sensors with positive MBE_adj, the corrected pm2.5_alt concentration remained within the sensor's expected range (Fig. S9). For two sensors, no measurements were identified as potential dust-dominated PM.
It is important to note that the locations of most sensors were identified based on the PA public map, and no physical verification of collocation was available, except for 4 sensors maintained by the authors' group and the sensor list provided by the EPA. Given this uncertainty, some variability in MBE and RMSE outcomes were expected.
3.3 Real-time processing: pm2.5_alt vs. FEM PM2.5
Figure 4 (top) compares the pm2.5_alt with FEM PM2.5 concentrations, with measurements identified as potential dust-dominated PM marked as black circles, for the 12 representative sensors, using the real-time approach. The potential dust-dominant measurements identified from all sensors were pooled, and using Eq. (6), factor A was estimated at 0.998. The corrections were applied to measurements identified as potentially dust-dominated PM, while all other observations remained unchanged. The real-time approach identified measurements were also corrected using an A of 0.702 (derived using the post-processing approach) and sensor-specific As. Fig. 4 (bottom) illustrates the measurements after correction using an A of 0.702. The coefficient of determination (R2, using just the identified measurements), irrespective of the A values, increased from 0.262 for pm2.5_alt versus FEM PM2.5 to 0.513 for adj_pm2.5_alt versus FEM PM2.5. Sensor-specific changes in R2 are presented in Table S6.
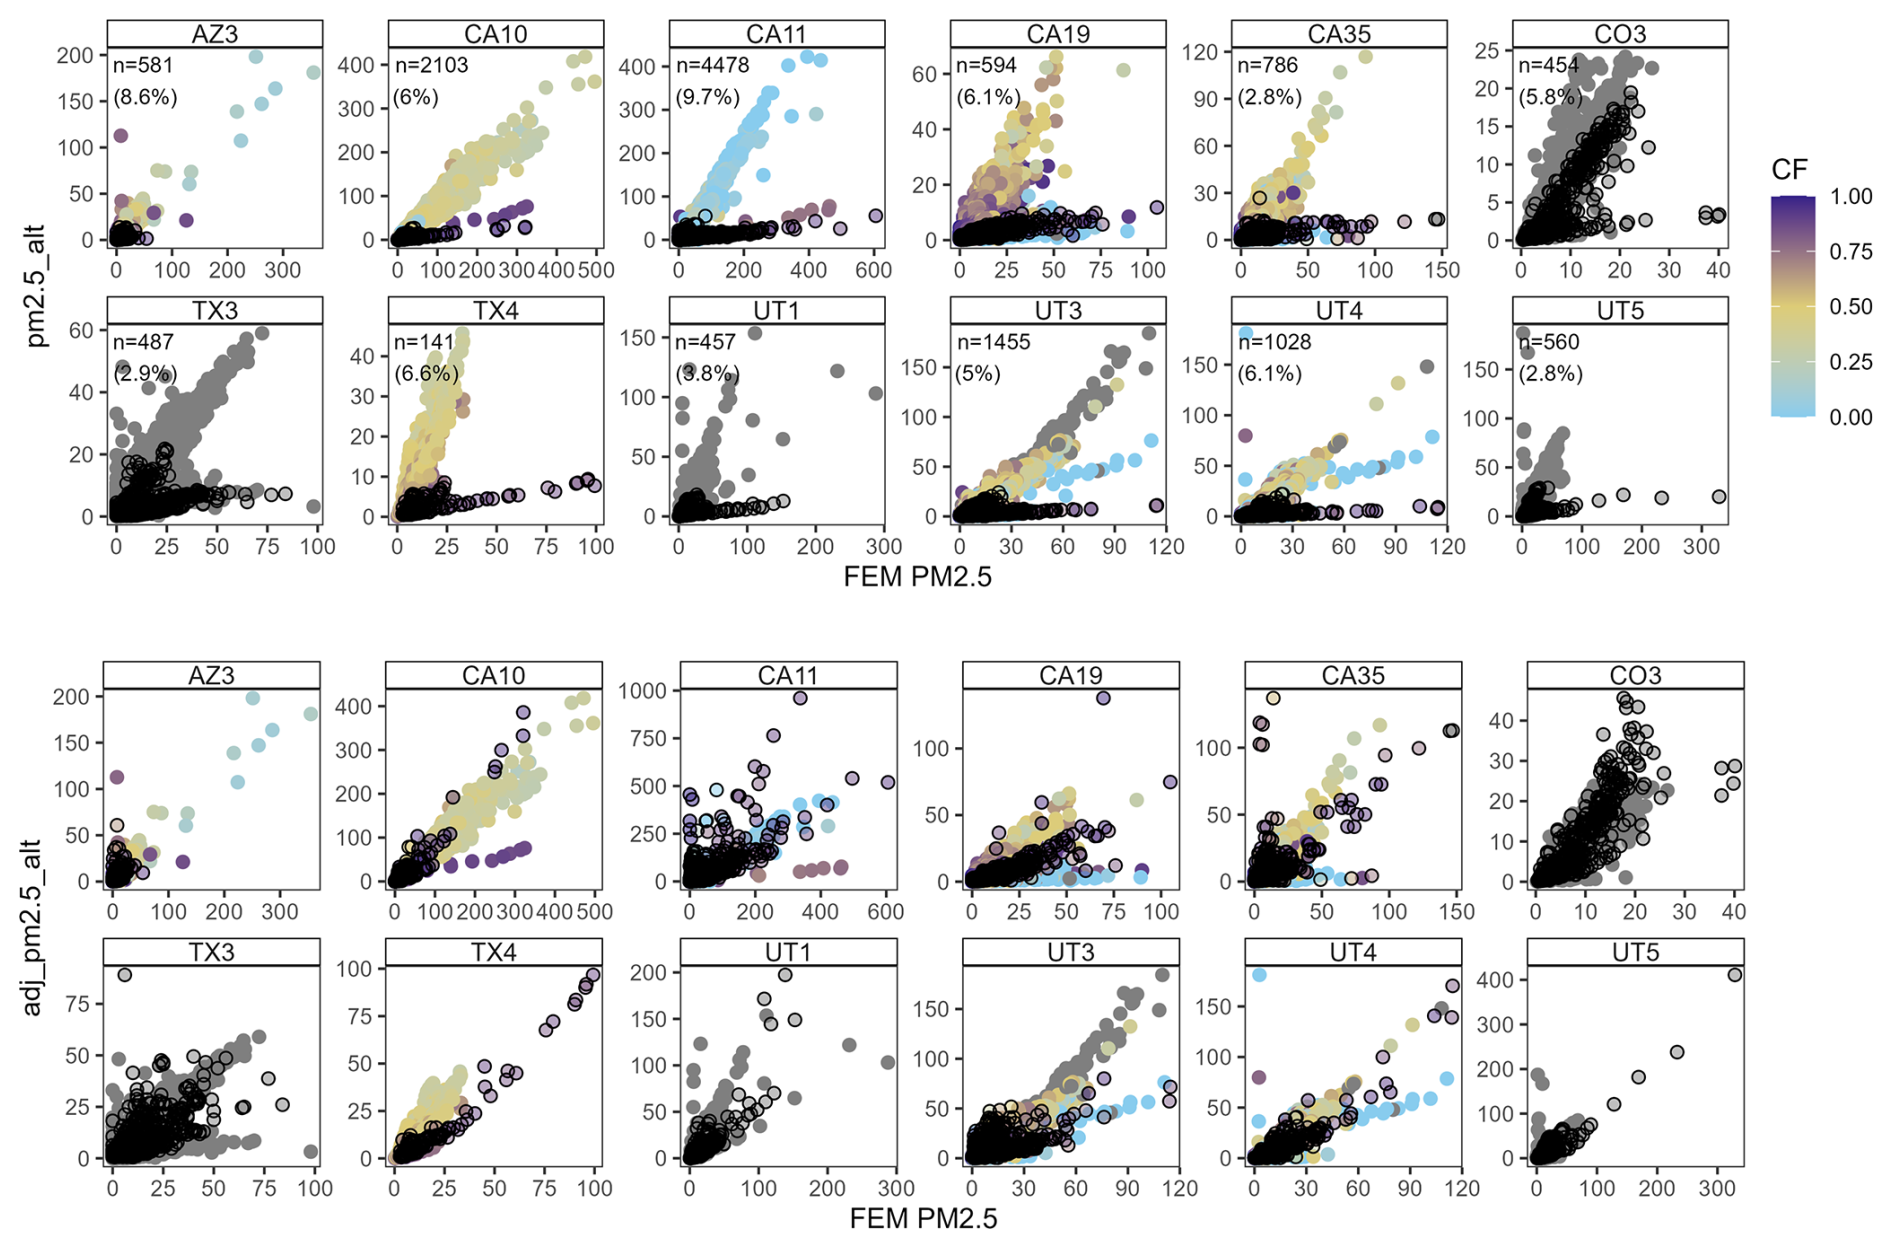
Figure 4Real-time approach: Hourly averaged pm2.5_alt values compared to FEM PM2.5 measurements (top). Hourly averaged adj_pm2.5_alt, corrected using an A of 0.702, compared with FEM PM2.5 measurements (bottom). The color of the solid circles corresponds to the CF. The grey solid circles represent times when either PM2.5 or PM10 was unavailable, preventing the calculation of CF. Black open circles represent measurements identified as potential dust-dominated PM measurements. n denotes the number of measurements identified as potential dust-dominated PM measurements, for a subset of data when FEM PM2.5 data were available. Table S4 shows the total number of potential dust-dominated PM measurements, regardless of FEM PM2.5 availability. Figure S11 shows comparisons of pm2.5_alt and FEM PM2.5 for the remaining sensors. Figures S12 and S13 compare the adj_pm2.5_alt with FEM PM2.5, for A of 0.998 and sensor-specific As, respectively.
Figure 5 compares the MBE and RMSE before and after correction using different values of A for the 12 representative sensors. The results indicate that the corrected PMS PM2.5 concentrations agreed better with the FEM PM2.5 concentrations during periods potentially dominated by dust, regardless of the A value. The sensor-specific A and A value of 0.998 led to decreases in MBE and RMSE and did not cause overestimates of the PM2.5 concentration compared to the FEM PM2.5 concentration. Using an A of 0.702 caused one sensor (CO3) to slightly overestimate PM2.5 concentration compared to the FEM, with an increase in MBE from −3.52 to 1.44 µg m−3.

Figure 5Real-time approach: MBE with respect to FEM PM2.5 before and after correcting pm2.5_alt using an A of 0.998, 0.702, and sensor-specific A (top). The blue dot represents the MBE before correction, while the orange square, purple cross, and green diamond represent the MBE after correction (MBE_adj) using an A of 0.998, 0.702, and sensor-specific A, respectively. Change in RMSE (ΔRMSE) with respect to FEM PM2.5 before and after correcting pm2.5_alt using an A of 0.998, 0.702, and sensor-specific A (bottom). The orange square, purple cross, and green diamond represent the ΔRMSE after correction using an A of 0.998, 0.702, and sensor-specific A, respectively. Figure S14 and Tables S4 and S7 show comparisons of MBE and MBE_adj, and ΔRMSE for the remaining sensors. Table S7 also reports ΔnRMSE for all the sensors.
Figure S14 and Tables S4 and S7 presents changes in MBE and RMSE for the remaining 95 sensors (no measurements identified with the thresholds for 2 sensors) using different values for A. Applying a correction factor with A = 0.998 reduced MBE for 91 sensors by 24.7 ± 12.7 % on average and RMSE for 80 sensors by 14.5 ± 9.96 % with ΔRMSE between −8.53 and −0.026 µg m−3. This correction (A = 0.998) caused an increase in MBE for four sensors (MBE_adj between 0.318 and 4.06 µg m−3) and RMSE for 12 sensors (ΔRMSE between 0.025 and 11.0 µg m−3), suggesting inconsistent performance across sensors. Application of a correction factor with A = 0.702 resulted in MBE decreases for 83 sensors by 55.4 ± 19.9 % (with MBE_adj varying between −7.58 and −0.0035 µg m−3) and RMSE decreases for 71 sensors by 24.8 ± 14.5 % (with ΔRMSE in −13.3 to −0.0422 µg m−3). This correction caused increases in MBE at 13 sensors (with MBE_adj between 0.313 and 8.76 µg m−3). For 11 of these 13 sensors, RMSE also increased (MBE_adj between 0.13 and 6.78 µg m−3, and ΔRMSE between 0.11 and 17.96 µg m−3, respectively), with 6 sensors belonging to locations in Alaska, Oregon, Washington, and Vermont that are infrequently affected by dust. For a few sensors (NV3, CA14, CA21, CO1, and CO2), a decrease in MBE was accompanied by an increase in RMSE (positive ΔRMSE), indicating sensitivity to a small number of overcorrected observations.
The sensor-specific A correction produced the greatest improvement in performance, yielding the largest reduction in MBE across sensors (mean reduction of 58.9 ± 23.9 % across 85 sensors) and a decrease in RMSE of 28.9 ± 19.4 % for 82 sensors (Fig. S14; Table S7). Although seven sensors exhibited increases in both MBE (24.9 ± 17.1 %) and RMSE (ΔRMSE = 0.32–2.61 µg m−3) following correction, and six additional sensors showed reduced bias but increased RMSE (ΔRMSE = 0.28–0.63 µg m−3), these cases reflect a trade-off between improved mean agreement and increased variability. Importantly, for sensors with increased RMSE, the magnitude of ΔRMSE using the sensor-specific correction was substantially smaller (0.28–2.61 µg m−3) than that observed under the uniform-A correction (0.024–10.9 µg m−3 for A = 0.998 and 0.111–17.9 µg m−3 for A = 0.702), indicating greater robustness of the sensor-specific approach.
Overall, these results highlight that while uniform correction factors can reduce bias for many sensors, they may introduce overcorrection and increased error at others. The sensor-specific correction provided a more balanced adjustment across the network, with reduced sensitivity to overcorrection and smaller increases in absolute error where performance degrades. However, implementing sensor-specific A requires calibration against a reference instrument before deployment, ideally under a range of PM concentrations and compositions representative of the target environment. This requirement limits scalability and may not be feasible for geographically diverse networks. Thus, there is a trade-off: a fixed A offers simplicity and consistency for a broad distribution of sensors, while a sensor-specific A improves accuracy but reduces generality.
This study has several limitations, primarily related to the use of PMS sensors and the assumptions made in selecting and interpreting the data. First, most PMS sensors used in this analysis were identified from the publicly available PA map, and their physical locations and deployment conditions could not be independently confirmed. It is possible that some of the sensors selected were not truly collocated with the FEM instruments. Second, PA nodes are user-deployed and can be moved or reconfigured at any time. A user might relocate the entire sensor, swap sensor nodes, or even replace hardware without any indication in the metadata. Such changes can alter sensor performance or the environmental context of the measurements (e.g., from outdoor to indoor), potentially affecting C_to_SM values and the thresholds used for dust-dominated PM measurement detection. These untracked changes may lead to inconsistencies in the correction approach, either causing genuine dust-dominated PM measurements to be missed or non-dust days to be mistakenly corrected due to a sudden shift in sensor behavior. Additionally, the correction method depends on long-term consistency in sensor performance. Any drift in sensor response (deSouza et al., 2023), contamination of the sensor inlet, changes in the PMS production process (i.e., Searle et al., 2023), or firmware updates may also influence measurement characteristics and correction effectiveness. A potential limitation of this approach is that it may be less effective under consistently high-dust conditions, as the baseline correction assumes that the environment is relatively clean most of the time. Finally, this study evaluated PMS5003/6003s, and the proposed methods would need to be evaluated for other PMS models. Despite these limitations, the general trends and methodology proposed in this manuscript can provide a useful framework for real-time and retrospective identification of possible dust-dominated PM measurement using PMS sensors. However, future work should aim to validate sensor-reference collocation and investigate the impact of node-level changes on the robustness of corrections.
Some potentially problematic measurements were not explicitly excluded in this study. These included: (i) periods with all zero counts in bins > 0.5 µm throughout the sampling duration; (ii) spurious temperature readings (e.g., ∼ −129 °F (∼ −89 °C)) persisting over the study period; and (iii) inconsistent particle count assignments, such as higher counts in the > 0.5 µm bin compared to the > 0.3 µm bin, or in the > 2.5 µm bin compared to the > 5 µm bin, which sometimes resulted in negative pm2.5_alt concentrations. While the thresholds developed in this study may have excluded many of these problematic data points, they may also have inadvertently excluded valid dust-dominated PM measurements.
Our approach for identifying elevated coarse particle concentrations could be extended to improve PM10 estimation from low-cost sensors. Furthermore, in conjunction with back-trajectory models, meteorological data, or satellite imagery, this method could help identify the sources of PM10 plumes, such as dust sources, construction activity, or agricultural emissions. In addition, if A could be defined for each sensor based on laboratory calibration under controlled conditions, it could significantly enhance the accuracy of real-time dust-dominated PM measurement detection and correction, although a strategy for addressing sensor performance changes over time would still be needed. This could enhance both the scalability and robustness of using low-cost sensors, such as the PMS, for dust-dominated PM monitoring in diverse environmental settings.
This study demonstrates that PMS5003/6003 sensors, despite their well-known limitations in detecting coarse particles, can be used to identify and provide estimates of PM2.5 concentration during dust-dominated periods using only the sensor's reported outputs. By leveraging particle counts in the coarser and submicron bins and RH, we developed real-time thresholds (threshold1 and threshold2) that can identify potential dust-dominated PM measurements without reliance on external datasets. Between 0 and 3785 hourly averaged PM2.5 measurements (0 %–9.00 %) from each sensor were identified as potential dust-dominated PM measurements with the post-processing approach, and 0–4513 measurements (0 %–9.62 %) with the real-time approach. The real-time method consistently identified more dust-dominated PM measurements, owing to its dynamic threshold1, which better accounted for seasonal and sensor-specific variability. Most potential dust-dominated PM measurements were associated with coarse fraction values > 0.7 (67 %–70 %) as measured by FEMs, confirming that the thresholds targeted conditions when PMS sensors most strongly underestimated FEM PM2.5. The correction of PMS PM2.5 estimates (pm2.5_alt) using the post-processing approach reduced MBE by approximately 50 % (52.4 ± 16.9 % for the 12 representative sensors and 49.6 ± 22.9 % for the remaining 85 sensors) and decreased RMSE for 84 sensors (−18.0 to −0.0965 µg m−3). A small subset of sensors (≤ 13) exhibited increases in MBE and RMSE, likely due to overcorrection or limited dust-influenced observations; however, corrected concentrations remained within the expected sensor response range. For the real-time correction approach, the magnitude of adjustment depended on the value of A, with uniform corrections using A = 0.998 and A = 0.702 reducing MBE and RMSE for most sensors (e.g., A = 0.998 reduced MBE by 24.7 ± 12.7 % for 91 sensors, and A = 0.702 reduced MBE by 55.4 ± 19.9 % for 83 sensors), although overcorrection occurred for a limited number of sensors, resulting in increases in MBE (up to 8.76 µg m−3) and RMSE (up to 17.96 µg m−3). The sensor-specific correction yielded the greatest overall improvement, reducing MBE by 58.9 ± 23.9 % across 85 sensors and RMSE by 28.9 ± 19.4 % for 82 sensors, suggesting the most robust agreement with FEM PM2.5 during dust-influenced periods. Overall, the framework developed here improves PMS5003 performance under elevated dust loading, reduces PM2.5 underestimation, and enhances the utility of low-cost sensors for dust monitoring in regions with limited FRM/FEM coverage.
The analyses and figures in this study were performed using R. The code is not publicly available; however, all data sources and data processing steps are fully described in the paper. The authors can make the code available upon request.
Most of the raw data used in this study are publicly available, except for data from four low-cost sensors maintained by the authors' research group. Raw low-cost sensor data can be accessed via the Purple Air Data Download Tool (https://community.purpleair.com/t/purpleair-data-download-tool/3787, last access: 2 February 2026) using the sensor indices provided in Tables S1, S2, and S3. Read-only access keys for the four private sensors can be provided by the authors upon request. FEM PM2.5 and PM10 data are publicly available from the U.S. Environmental Protection Agency (EPA) database (https://aqs.epa.gov/aqsweb/airdata/download_files.html, last access: 2 February 2026). The dataset for the 28 sites with collocated sensors, previously used in Barkjohn et al. (2021), was provided by the EPA and can be requested directly from the corresponding author of Barkjohn et al. (2021) (https://doi.org/10.5194/amt-14-4617-2021). The final processed dataset is available from the authors upon request.
The supplement related to this article is available online at https://doi.org/10.5194/amt-19-1077-2026-supplement.
KK and TM gathered data. KK conceptualized the research and analyzed the data. KK developed the original draft, and TM and KEK reviewed and edited the original draft. KEK provided supervision and acquired funding.
Kerry E. Kelly has a financial interest in the company Tellus Networked Solutions, LCC, which commercializes solutions for environmental monitoring. Their technology was not used as part of this work.
Publisher's note: Copernicus Publications remains neutral with regard to jurisdictional claims made in the text, published maps, institutional affiliations, or any other geographical representation in this paper. The authors bear the ultimate responsibility for providing appropriate place names. Views expressed in the text are those of the authors and do not necessarily reflect the views of the publisher.
The authors wish to thank Dr. Karoline Barkjohn (US EPA) for the valuable feedback on the manuscript and for providing a collocation dataset of PA sensors and regulatory monitors. This EPA collocation dataset would not have been possible without the partnership of many air monitoring agencies and other partners, including the State of Alaska, Citizens for Clean Air (Alaska), Maricopa County Air Quality Department, San Luis Obispo County Air Pollution Control District, Mojave Desert Air Quality Management District, California Air Resources Board, Santa Barbara County Air Pollution Control District, Ventura County Air Pollution Control District, South Coast Air Quality Management District and its Air Quality Sensor Performance Evaluation Center (AQ-SPEC), Colorado Department of Public Health and Environment, Delaware Division of Air Quality, Sarasota County Government, Georgia Environmental Protection Division, Iowa Department of Natural Resources, Kansas Department of Health and Environment, Missoula County, Montana Department of Environmental Quality, Forsyth County Office of Environmental Assistance and Protection, Clean Air Carolina, Quapaw Nation, Oklahoma Department of Environmental Quality, Virginia Department of Environmental Quality, State of Vermont, Puget Sound Clean Air Agency, and Wisconsin Department of Natural Resources. Thanks to PurpleAir for allowing access to their data at no cost. AI-assisted tools were used to edit the original drafts of the manuscript to enhance the clarity and readability of the text.
Research reported in this publication is based upon work supported by the National Science Foundation under grant no. 2012091 (Collaborative Research Network Cluster: Dust in the Critical Zone) and under grant no. 2322009 (CIVIC-Stage2: TRACK A: Community Resilience through Engaging, Actionable, Timely, High-Resolution Air Quality Information – CREATE-AQI).
This paper was edited by Francis Pope and reviewed by Carl Malings and Dimitrios Bousiotis.
AirGradient: https://www.airgradient.com/outdoor/, last access: 7 September 2025.
Airly: https://airly.org/en/, last access: 7 September 2025.
AirNow: https://docs.airnowapi.org/, last access: 16 September 2025.
AirNowTech: https://www.airnowtech.org/, last access: 7 September 2025.
Air Quality Egg: https://airqualityegg.com/home, last access: 7 September 2025.
Ardon-Dryer, K., Dryer, Y., Williams, J. N., and Moghimi, N.: Measurements of PM2.5 with PurpleAir under atmospheric conditions, Atmos. Meas. Tech., 13, 5441–5458, https://doi.org/10.5194/amt-13-5441-2020, 2020.
Ardon-Dryer, K., Clifford, K. R., and Hand, J. L.: Dust Under the Radar: Rethinking How to Evaluate the Impacts of Dust Events on Air Quality in the United States, Geohealth, 7, e2023GH000953, https://doi.org/10.1029/2023GH000953, 2023a.
Ardon-Dryer, K., Gill, T. E., and Tong, D. Q.: When a Dust Storm Is Not a Dust Storm: Reliability of Dust Records From the Storm Events Database and Implications for Geohealth Applications, Geohealth, 7, https://doi.org/10.1029/2022GH000699, 2023b.
Barkjohn, K. K., Gantt, B., and Clements, A. L.: Development and application of a United States-wide correction for PM2.5 data collected with the PurpleAir sensor, Atmos. Meas. Tech., 14, 4617–4637, https://doi.org/10.5194/amt-14-4617-2021, 2021.
Barkjohn, K. K., Holder, A. L., Frederick, S. G., and Clements, A. L.: Correction and Accuracy of PurpleAir PM2.5 Measurements for Extreme Wildfire Smoke, Sensors, 22, 9669, https://doi.org/10.3390/s22249669, 2022.
Brahney, J., Heindel, R. C., Gill, T. E., Carling, G., González-Olalla, J. M., Hand, J., Mallia, D. V., Munroe, J. S., Perry, K., Putman, A. L., Skiles, S. M., Adams, B. R., Aanderud, Z., Aarons, S., Aguirre, D., Ardon-Dryer, K., Blakowski, M. B., Creamean, J. M., Fernandez, D., Foroutan, H., Gaston, C., Hahnenberger, M., Hoch, S., Jones, D. K., Kelly, K. E., Lang, O. I., LeMonte, J., Reynolds, R., Singh, R. P., Sweeney, M., and Merrill, T.: Dust in the Critical Zone: North American case studies, Earth. Sci. Rev., 258, 104942, https://doi.org/10.1016/J.EARSCIREV.2024.104942, 2024.
Clarity: https://www.clarity.io/, last access: 7 September 2025.
Cowell, N., Chapman, L., Bloss, W., and Pope, F.: Field Calibration and Evaluation of an Internet-of-Things-Based Particulate Matter Sensor, Front. Environ. Sci., 9, 798485, https://doi.org/10.3389/fenvs.2021.798485, 2022.
Csavina, J., Field, J., Félix, O., Corral-Avitia, A. Y., Sáez, A. E., and Betterton, E. A.: Effect of wind speed and relative humidity on atmospheric dust concentrations in semi-arid climates, Science of The Total Environment, 487, 82–90, https://doi.org/10.1016/J.SCITOTENV.2014.03.138, 2014.
deSouza, P., Barkjohn, K., Clements, A., Lee, J., Kahn, R., Crawford, B., and Kinney, P.: An analysis of degradation in low-cost particulate matter sensors, Environmental Science: Atmospheres, 3, 521–536, https://doi.org/10.1039/D2EA00142J, 2023.
Gautam, P., Ramirez, A., Bair, S., Arnott, W. P., Chow, J. C., Watson, J. G., Moosmüller, H., and Wang, X.: Sizing Accuracy of Low-Cost Optical Particle Sensors Under Controlled Laboratory Conditions, Atmosphere, 16, 502, https://doi.org/10.3390/atmos16050502, 2025.
Goudie, A. S.: Desert dust and human health disorders, Environ. Int., 63, 101–113, https://doi.org/10.1016/J.ENVINT.2013.10.011, 2014.
Hahnenberger, M. and Nicoll, K.: Meteorological characteristics of dust storm events in the eastern Great Basin of Utah, U.S.A., Atmos. Environ., 60, 601–612, https://doi.org/10.1016/J.ATMOSENV.2012.06.029, 2012.
Hand, J. L., Gill, T. E., and Schichtel, B. A.: Spatial and seasonal variability in fine mineral dust and coarse aerosol mass at remote sites across the United States, Journal of Geophysical Research: Atmospheres, 122, 3080–3097, https://doi.org/10.1002/2016JD026290, 2017.
He, M., Kuerbanjiang, N., and Dhaniyala, S.: Performance characteristics of the low-cost Plantower PMS optical sensor, Aerosol Science and Technology, 54, 232–241, https://doi.org/10.1080/02786826.2019.1696015, 2020.
Hong, G. H., Le, T. C., Tu, J. W., Wang, C., Chang, S. C., Yu, J. Y., Lin, G. Y., Aggarwal, S. G., and Tsai, C. J.: Long-term evaluation and calibration of three types of low-cost PM2.5 sensors at different air quality monitoring stations, J. Aerosol Sci., 157, 105829, https://doi.org/10.1016/J.JAEROSCI.2021.105829, 2021.
Hua, J., Zhang, Y., de Foy, B., Mei, X., Shang, J., Zhang, Y., Sulaymon, I. D., and Zhou, D.: Improved PM2.5 concentration estimates from low-cost sensors using calibration models categorized by relative humidity, Aerosol Science and Technology, 55, 600–613, https://doi.org/10.1080/02786826.2021.1873911, 2021.
Jaffe, D. A., Miller, C., Thompson, K., Finley, B., Nelson, M., Ouimette, J., and Andrews, E.: An evaluation of the U.S. EPA's correction equation for PurpleAir sensor data in smoke, dust, and wintertime urban pollution events, Atmos. Meas. Tech., 16, 1311–1322, https://doi.org/10.5194/amt-16-1311-2023, 2023.
Kaur, K. and Kelly, K. E.: Laboratory evaluation of the Alphasense OPC-N3, and the Plantower PMS5003 and PMS6003 sensors, J. Aerosol Sci., 171, 106181, https://doi.org/10.1016/J.JAEROSCI.2023.106181, 2023a.
Kaur, K. and Kelly, K. E.: Performance evaluation of the Alphasense OPC-N3 and Plantower PMS5003 sensor in measuring dust events in the Salt Lake Valley, Utah, Atmos. Meas. Tech., 16, 2455–2470, https://doi.org/10.5194/amt-16-2455-2023, 2023b.
Kaur, K., Krall, J. R., Ivey, C., Holmes, H., and Kelly, K. E.: Long-term PM2.5 source apportionment at 12 sites in the western United States from 2000 to 2020, Atmos. Pollut. Res., 102779, https://doi.org/10.1016/j.apr.2025.102779, 2025.
Kim, K. T., Kim, H., Jeong, S., Lee, Y. S., Zhao, X., and Kim, J. Y.: Coincidence effect of a low-cost particulate matter sensor: Observations from environmental chamber tests at diverse particle concentrations, Atmos. Pollut. Res., 16, 102581, https://doi.org/10.1016/j.apr.2025.102581, 2025.
Kosmopoulos, G., Salamalikis, V., Wilbert, S., Zarzalejo, L. F., Hanrieder, N., Karatzas, S., and Kazantzidis, A.: Investigating the Sensitivity of Low-Cost Sensors in Measuring Particle Number Concentrations across Diverse Atmospheric Conditions in Greece and Spain, Sensors, 23, 6541, https://doi.org/10.3390/s23146541, 2023.
Kuula, J., Mäkelä, T., Aurela, M., Teinilä, K., Varjonen, S., González, Ó., and Timonen, H.: Laboratory evaluation of particle-size selectivity of optical low-cost particulate matter sensors, Atmos. Meas. Tech., 13, 2413–2423, https://doi.org/10.5194/amt-13-2413-2020, 2020.
Lei, H., Wang, J. X. L., Tong, D. Q., and Lee, P.: Merged dust climatology in Phoenix, Arizona based on satellite and station data, Clim. Dyn., 47, 2785–2799, https://doi.org/10.1007/s00382-016-2997-7, 2016.
Lewis, J. M., Kaplan, M. L., Vellore, R., Rabin, R. M., Hallett, J., and Cohn, S. A.: Dust storm over the Black Rock Desert: Larger-scale dynamic signatures, J. Geophys. Res., 116, D06113, https://doi.org/10.1029/2010JD014784, 2011.
Leys, C., Ley, C., Klein, O., Bernard, P., and Licata, L.: Detecting outliers: Do not use standard deviation around the mean, use absolute deviation around the median, J. Exp. Soc. Psychol., 49, 764–766, https://doi.org/10.1016/J.JESP.2013.03.013, 2013.
Magi, B. I., Cupini, C., Francis, J., Green, M., and Hauser, C.: Evaluation of PM2.5 measured in an urban setting using a low-cost optical particle counter and a Federal Equivalent Method Beta Attenuation Monitor, Aerosol Science and Technology, 54, 147–159, https://doi.org/10.1080/02786826.2019.1619915, 2020.
Mai, C., Wang, Z., Chen, L., Huang, Y., Li, M., Shirazi, A., Altaee, A., and Zhou, J. L.: Field-based calibration and operation of low-cost sensors for particulate matter by linear and nonlinear methods, Atmos. Pollut. Res., 16, 102676, https://doi.org/10.1016/J.APR.2025.102676, 2025.
Malings, C., Tanzer, R., Hauryliuk, A., Saha, P. K., Robinson, A. L., Presto, A. A., and Subramanian, R.: Fine particle mass monitoring with low-cost sensors: Corrections and long-term performance evaluation, Aerosol Science and Technology, 54, 160–174, https://doi.org/10.1080/02786826.2019.1623863, 2020.
Masic, A., Bibic, D., Pikula, B., Blazevic, A., Huremovic, J., and Zero, S.: Evaluation of optical particulate matter sensors under realistic conditions of strong and mild urban pollution, Atmos. Meas. Tech., 13, 6427–6443, https://doi.org/10.5194/amt-13-6427-2020, 2020.
Mathieu-Campbell, M. E., Guo, C., Grieshop, A. P., and Richmond-Bryant, J.: Calibration of PurpleAir low-cost particulate matter sensors: model development for air quality under high relative humidity conditions, Atmos. Meas. Tech., 17, 6735–6749, https://doi.org/10.5194/amt-17-6735-2024, 2024.
NASA Earthdata: https://www.earthdata.nasa.gov/data/instruments/modis/near-real-time-data, last access: 7 September 2025.
Nilson, B., Jackson, P. L., Schiller, C. L., and Parsons, M. T.: Development and evaluation of correction models for a low-cost fine particulate matter monitor, Atmos. Meas. Tech., 15, 3315–3328, https://doi.org/10.5194/amt-15-3315-2022, 2022.
Ouimette, J., Arnott, W. P., Laven, P., Whitwell, R., Radhakrishnan, N., Dhaniyala, S., Sandink, M., Tryner, J., and Volckens, J.: Fundamentals of low-cost aerosol sensor design and operation, Aerosol Science and Technology, 58, 1–15, https://doi.org/10.1080/02786826.2023.2285935, 2024.
Ouimette, J. R., Malm, W. C., Schichtel, B. A., Sheridan, P. J., Andrews, E., Ogren, J. A., and Arnott, W. P.: Evaluating the PurpleAir monitor as an aerosol light scattering instrument, Atmos. Meas. Tech., 15, 655–676, https://doi.org/10.5194/amt-15-655-2022, 2022.
Patel, M. Y., Vannucci, P. F., Kim, J., Berelson, W. M., and Cohen, R. C.: Towards a hygroscopic growth calibration for low-cost PM2.5 sensors, Atmos. Meas. Tech., 17, 1051–1060, https://doi.org/10.5194/amt-17-1051-2024, 2024.
PurpleAir: https://location.purpleair.com/countries?layers=us_epa_aqi%2Caire_y_salud%2Caustralian_aqi%2Cbrazilian_pm25%2Caqhi_plus%2Cchinese_aqi%2Ceuropean_aqi%2Cindia_naqi%2Cindonesia_ispu%2Cnew_south_wales_pm_2_5%2Ctasmania_pm_2_5%2Cuk_daily_aqi%2Cc, last access: 7 September 2025.
QuantAQ: https://quant-aq.com/, last access: 7 September 2025.
Raheja, G., Nimo, J., Appoh, E. K.-E., Essien, B., Sunu, M., Nyante, J., Amegah, M., Quansah, R., Arku, R. E., Penn, S. L., Giordano, M. R., Zheng, Z., Jack, D., Chillrud, S., Amegah, K., Subramanian, R., Pinder, R., Appah-Sampong, E., Tetteh, E. N., Borketey, M. A., Hughes, A. F., and Westervelt, D. M.: Low-Cost Sensor Performance Intercomparison, Correction Factor Development, and 2+ Years of Ambient PM2.5 Monitoring in Accra, Ghana, Environ. Sci. Technol., 57, 10708–10720, https://doi.org/10.1021/acs.est.2c09264, 2023.
Robinson, M. C. and Ardon-Dryer, K.: Characterization of 21 years of dust events across four West Texas regions, Aeolian Res., 67–69, 100930, https://doi.org/10.1016/J.AEOLIA.2024.100930, 2024.
Sandhu, T., Robinson, M. C., Rawlins, E., and Ardon-Dryer, K.: Identification of dust events in the greater Phoenix area, Atmos. Pollut. Res., 15, 102275, https://doi.org/10.1016/J.APR.2024.102275, 2024.
Sayahi, T., Butterfield, A., and Kelly, K. E.: Long-term field evaluation of the Plantower PMS low-cost particulate matter sensors, Environmental Pollution, 245, 932–940, https://doi.org/10.1016/J.ENVPOL.2018.11.065, 2019.
Searle, N., Kaur, K., and Kelly, K.: Technical note: Identifying a performance change in the Plantower PMS 5003 particulate matter sensor, J. Aerosol Sci., 174, 106256, https://doi.org/10.1016/J.JAEROSCI.2023.106256, 2023.
Si, M., Xiong, Y., Du, S., and Du, K.: Evaluation and calibration of a low-cost particle sensor in ambient conditions using machine-learning methods, Atmos. Meas. Tech., 13, 1693–1707, https://doi.org/10.5194/amt-13-1693-2020, 2020.
Sugimoto, N., Shimizu, A., Matsui, I., and Nishikawa, M.: A method for estimating the fraction of mineral dust in particulate matter using PM2.5-to-PM10 ratios, Particuology, 28, 114–120, https://doi.org/10.1016/J.PARTIC.2015.09.005, 2016.
TELLUS: https://www.tellusensors.com/, last access: 7 September 2025.
Tong, D. Q., Dan, M., Wang, T., and Lee, P.: Long-term dust climatology in the western United States reconstructed from routine aerosol ground monitoring, Atmos. Chem. Phys., 12, 5189–5205, https://doi.org/10.5194/acp-12-5189-2012, 2012.
Tryner, J., Mehaffy, J., Miller-Lionberg, D., and Volckens, J.: Effects of aerosol type and simulated aging on performance of low-cost PM sensors, J. Aerosol Sci., 150, 105654, https://doi.org/10.1016/J.JAEROSCI.2020.105654, 2020a.
Tryner, J., L'Orange, C., Mehaffy, J., Miller-Lionberg, D., Hofstetter, J. C., Wilson, A., and Volckens, J.: Laboratory evaluation of low-cost PurpleAir PM monitors and in-field correction using co-located portable filter samplers, Atmos. Environ., 220, 117067, https://doi.org/10.1016/J.ATMOSENV.2019.117067, 2020b.
U.S. EPA: https://www.regulations.gov/document/EPA-HQ-OAR-2023-0642-0031, last access: 9 September 2025a.
U.S. EPA: https://aqs.epa.gov/aqsweb/airdata/download_files.html, last access: 7 September 2025b.
Vogt, M., Schneider, P., Castell, N., and Hamer, P.: Assessment of Low-Cost Particulate Matter Sensor Systems against Optical and Gravimetric Methods in a Field Co-Location in Norway, Atmosphere, 12, 961, https://doi.org/10.3390/ATMOS12080961, 2021.
Wallace, L.: Cracking the code – Matching a proprietary algorithm for a low-cost sensor measuring PM1 and PM2.5, Science of The Total Environment, 893, 164874, https://doi.org/10.1016/J.SCITOTENV.2023.164874, 2023.
Wallace, L., Zhao, T., and Klepeis, N. E.: Calibration of PurpleAir PA-I and PA-II Monitors Using Daily Mean PM2.5 Concentrations Measured in California, Washington, and Oregon from 2017 to 2021, Sensors, 22, 4741, https://doi.org/10.3390/s22134741, 2022.
Weissert, L. F., Henshaw, G. S., Clements, A. L., Duvall, R. M., and Croghan, C.: Seasonal effects in the application of the MOment MAtching (MOMA) remote calibration tool to outdoor PM2.5 air sensors, Atmos. Meas. Tech., 18, 3635–3645, https://doi.org/10.5194/amt-18-3635-2025, 2025.