the Creative Commons Attribution 4.0 License.
the Creative Commons Attribution 4.0 License.
 | 20 Apr 2026
Study on the life cycle of an ice cloud system over the Taklamakan desert using multi-source data
Chunsong Lu
Jinlong Yuan
Kenan Wu
Tianwen Wei
Xiaofei Wang
Qing He
Mohamed Elshora
Xi Luo
Xinyang Li
Using a coherent Doppler wind lidar, the whole process of formation and decomposition of an ice cloud event was recorded in Minfeng (37.06° N, 82.69° E) on the southern edge of the Taklamakan Desert (TD) from 5 to 6 February 2022. Combined with ERA5 and MERRA-2 reanalysis data, FY-4A and Himawari-8 meteorological satellite data, local meteorological data, and HYSPLIT model, the evolution process of ice clouds affected by the wind profile, dust aerosol, turbulence, temperature, humidity, and terrain was analyzed. The results show that the uniquely relatively enclosed basin topography of the TD, coupled with the feeble turbulence and robust downdrafts at night, constrains the upward supply of water vapor and dust aerosols. As a result, the base height of the ice clouds is maintained at approximately 3 km. Dust aerosols can act as effective ice nuclei, which catalyze the formation of ice clouds and inhibit the occurrence of liquid precipitation. The continuous evolution of ice clouds was well studied with multiple meteorological data, which improves the understanding of dust-cloud-atmosphere interactions in the desert hydrological cycle.
- Article
(5387 KB) - Full-text XML
-
Supplement
(1261 KB) - BibTeX
- EndNote


Atmospheric ice nuclei (IN) refer to aerosol particles suspended in the atmosphere, which can condense water vapor or freeze supercooled droplets to form ice crystals (Vali, 1985). IN can have a huge impact on physical processes such as radiative transfer, precipitation, and cloud electrification (Heymsfield, 2005), thus they have significance in studying the precipitation process of natural cold clouds (Morris et al., 2004), artificial weather modification (DeMott et al., 1983), the interaction between clouds and aerosols, and even global climate change (Ramanathan et al., 2001; Zeng et al., 2009).
The huge global emission of mineral aerosol dust is one of the important sources of IN (Kanji et al., 2017), which plays an important role in the dust-aerosol-cloud-precipitation interaction (DACPI). There is a significant correlation between IN and mineral aerosol dust (Klein et al., 2010). Under certain conditions, dust can not only inhibit rainfall but also enhance rainfall (Huang et al., 2014). Rosenfeld et al. (2001) found that when the Sahara Desert dust acts as effective cloud condensation nuclei (CCN) or IN, the increase of dust concentration leads to the decrease of cloud droplet size, which can reduce the efficiency of cloud droplet coalescence and inhibit the occurrence of precipitation. At the same time, the reduction in precipitation will lead to further drying of the soil, which may increase the dust content in the desert and provide a possible feedback loop to further reduce precipitation (Rosenfeld et al., 2001). When desert dust acts as an effective IN, it can make the top of the convective cloud have the ability to freeze, so as to promote the occurrence of ice precipitation, rather than inhibit the occurrence of warm rain (Rosenfeld et al., 2011).
It is difficult to grasp the regional and local changes of ice clouds by using only one kind of data, whereas the combination of multi-source data can fully discover the trend of cloud change. Coherent Doppler wind lidar (CDWL) has the characteristics of high temporal and radial spatial resolution (Zhang et al., 2021), small detection blind area, high detection accuracy and real-time acquisition of three-dimensional motion information of the atmosphere. Based on these characteristics, the CDWL can obtain the wind field information (Liu et al., 2020) in the cloud and distinguish the vertical distribution of clouds and aerosols, which makes it possible to capture the evolution process of clouds. Therefore, CDWL has been utilized to study DACPI caused by dust transported from the desert (Chouza et al., 2016; Westbrook et al., 2010; Westbrook and Illingworth, 2013; Ansmann et al., 2009; Seifert et al., 2010). The large-scale observation of meteorological satellites can obtain various cloud products from satellite-based data, and other valuable meteorological products can be obtained through atmospheric reanalysis techniques. The combination of these large amounts of product data makes it possible to analyze the large-scale changes of clouds, so as to capture the overall regional change process of clouds (Yoshida et al., 2010; Alexander and Protat, 2018). At present, there are many studies on the changes of local clouds and weather caused by the transport of dust aerosols in the study sites far away from the desert (Seifert et al., 2010; Ansmann et al., 2005). However, due to the factors such as equipment performance, harsh environmental climate, lack of infrastructure and personnel in the desert, it is not sufficient to study the influence of dust aerosols on local cloud and weather changes in the desert where dust transport originates.
In order to study the desert meteorology, such as wind conditions and DACPI, a long-term and stable continuous observation experiment was carried out in Minfeng County by using the CDWL, and a complete process of an ice cloud evolution was observed from 5 to 6 February 2022. The effects of wind, dust aerosol, turbulence, temperature, humidity, terrain and other factors on the evolution of ice clouds were analyzed by multi-source data. This paper is organized as follows: the study site and datasets are described in Sect. 2. The observations of various data are presented and analyzed in Sect. 3. Finally, a conclusion is drawn in Sect. 4.
2.1 Study site
The Taklamakan Desert (TD), located in the Tarim Basin, is the world's second largest shifting sand desert and the largest desert in China. The terrain corresponds to high elevation in the north, with an average elevation of more than 1 km, as shown in Fig. 1. The TD is surrounded by three mountains, and the near-surface wind regimes are characterized by the prevailing northeast wind (Sun and Liu, 2006), the special terrain makes it very easy to form dust storms. The observation experiment was carried out in Minfeng County (37.06° N, 82.69° E), which is located in the southern edge of the TD and the northern foot of the Kunlun Mountains. The climate of Minfeng belongs to a typical temperate arid climate with sufficient sunshine and scarce precipitation. When the cold air of different intensity invades, due to the blocking effect of the Tibet Plateau, the study site Minfeng is located in the convergence and ascending range of the east and west airflow (Liu et al., 2019). As a result, the wind-sand activity in this area is extremely strong, making it one of the regions with a high frequency of sandstorm weather in China (Yang et al., 2016). A digital elevation map of the study site is also added in Fig. S1 in the Supplement.
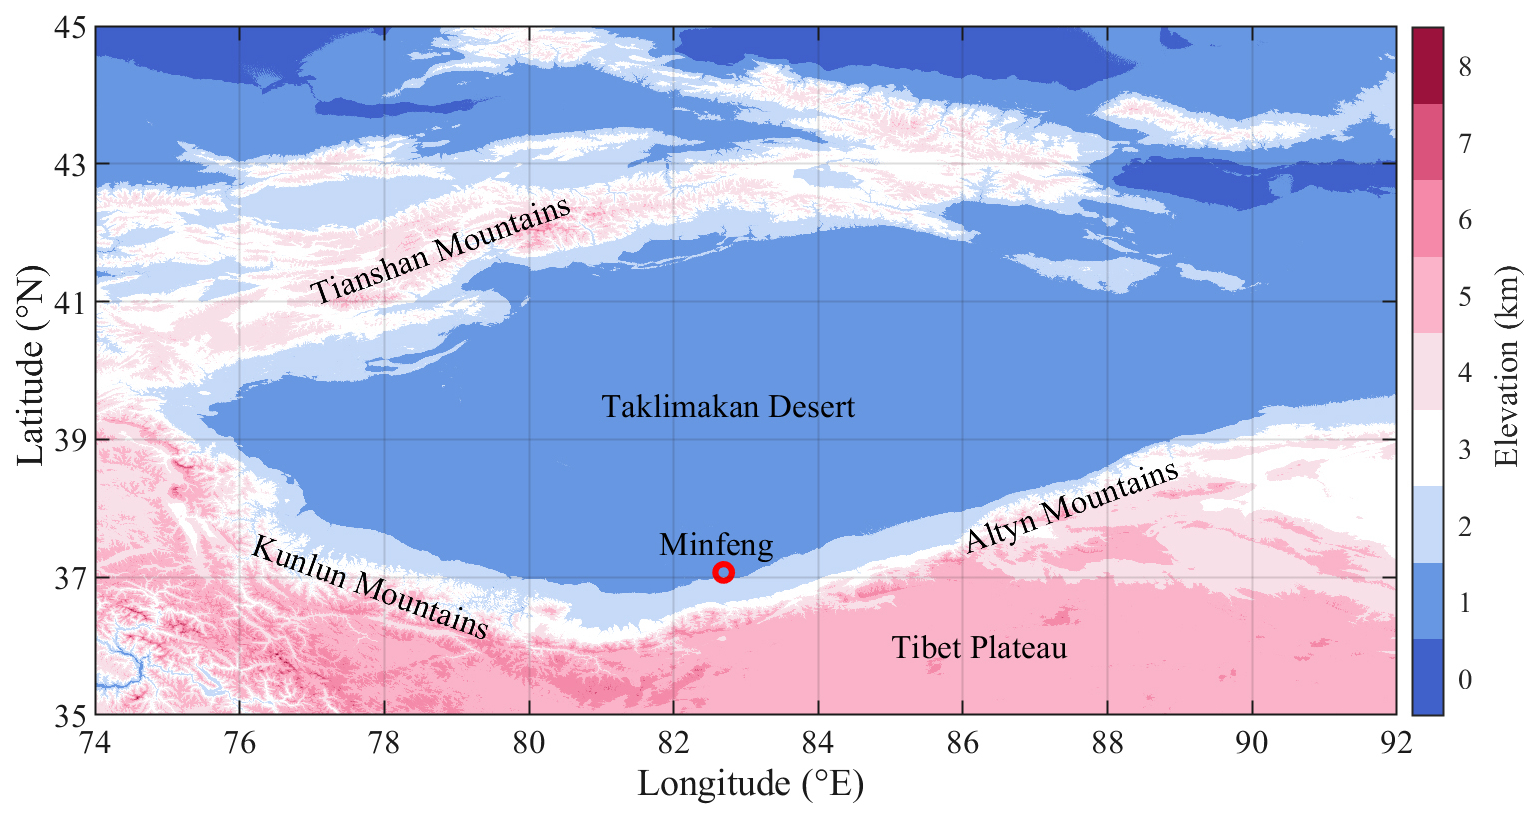
Figure 1The elevation map of Taklamakan Desert. The red circle represents the study site, Minfeng.
2.2 CDWL measurements
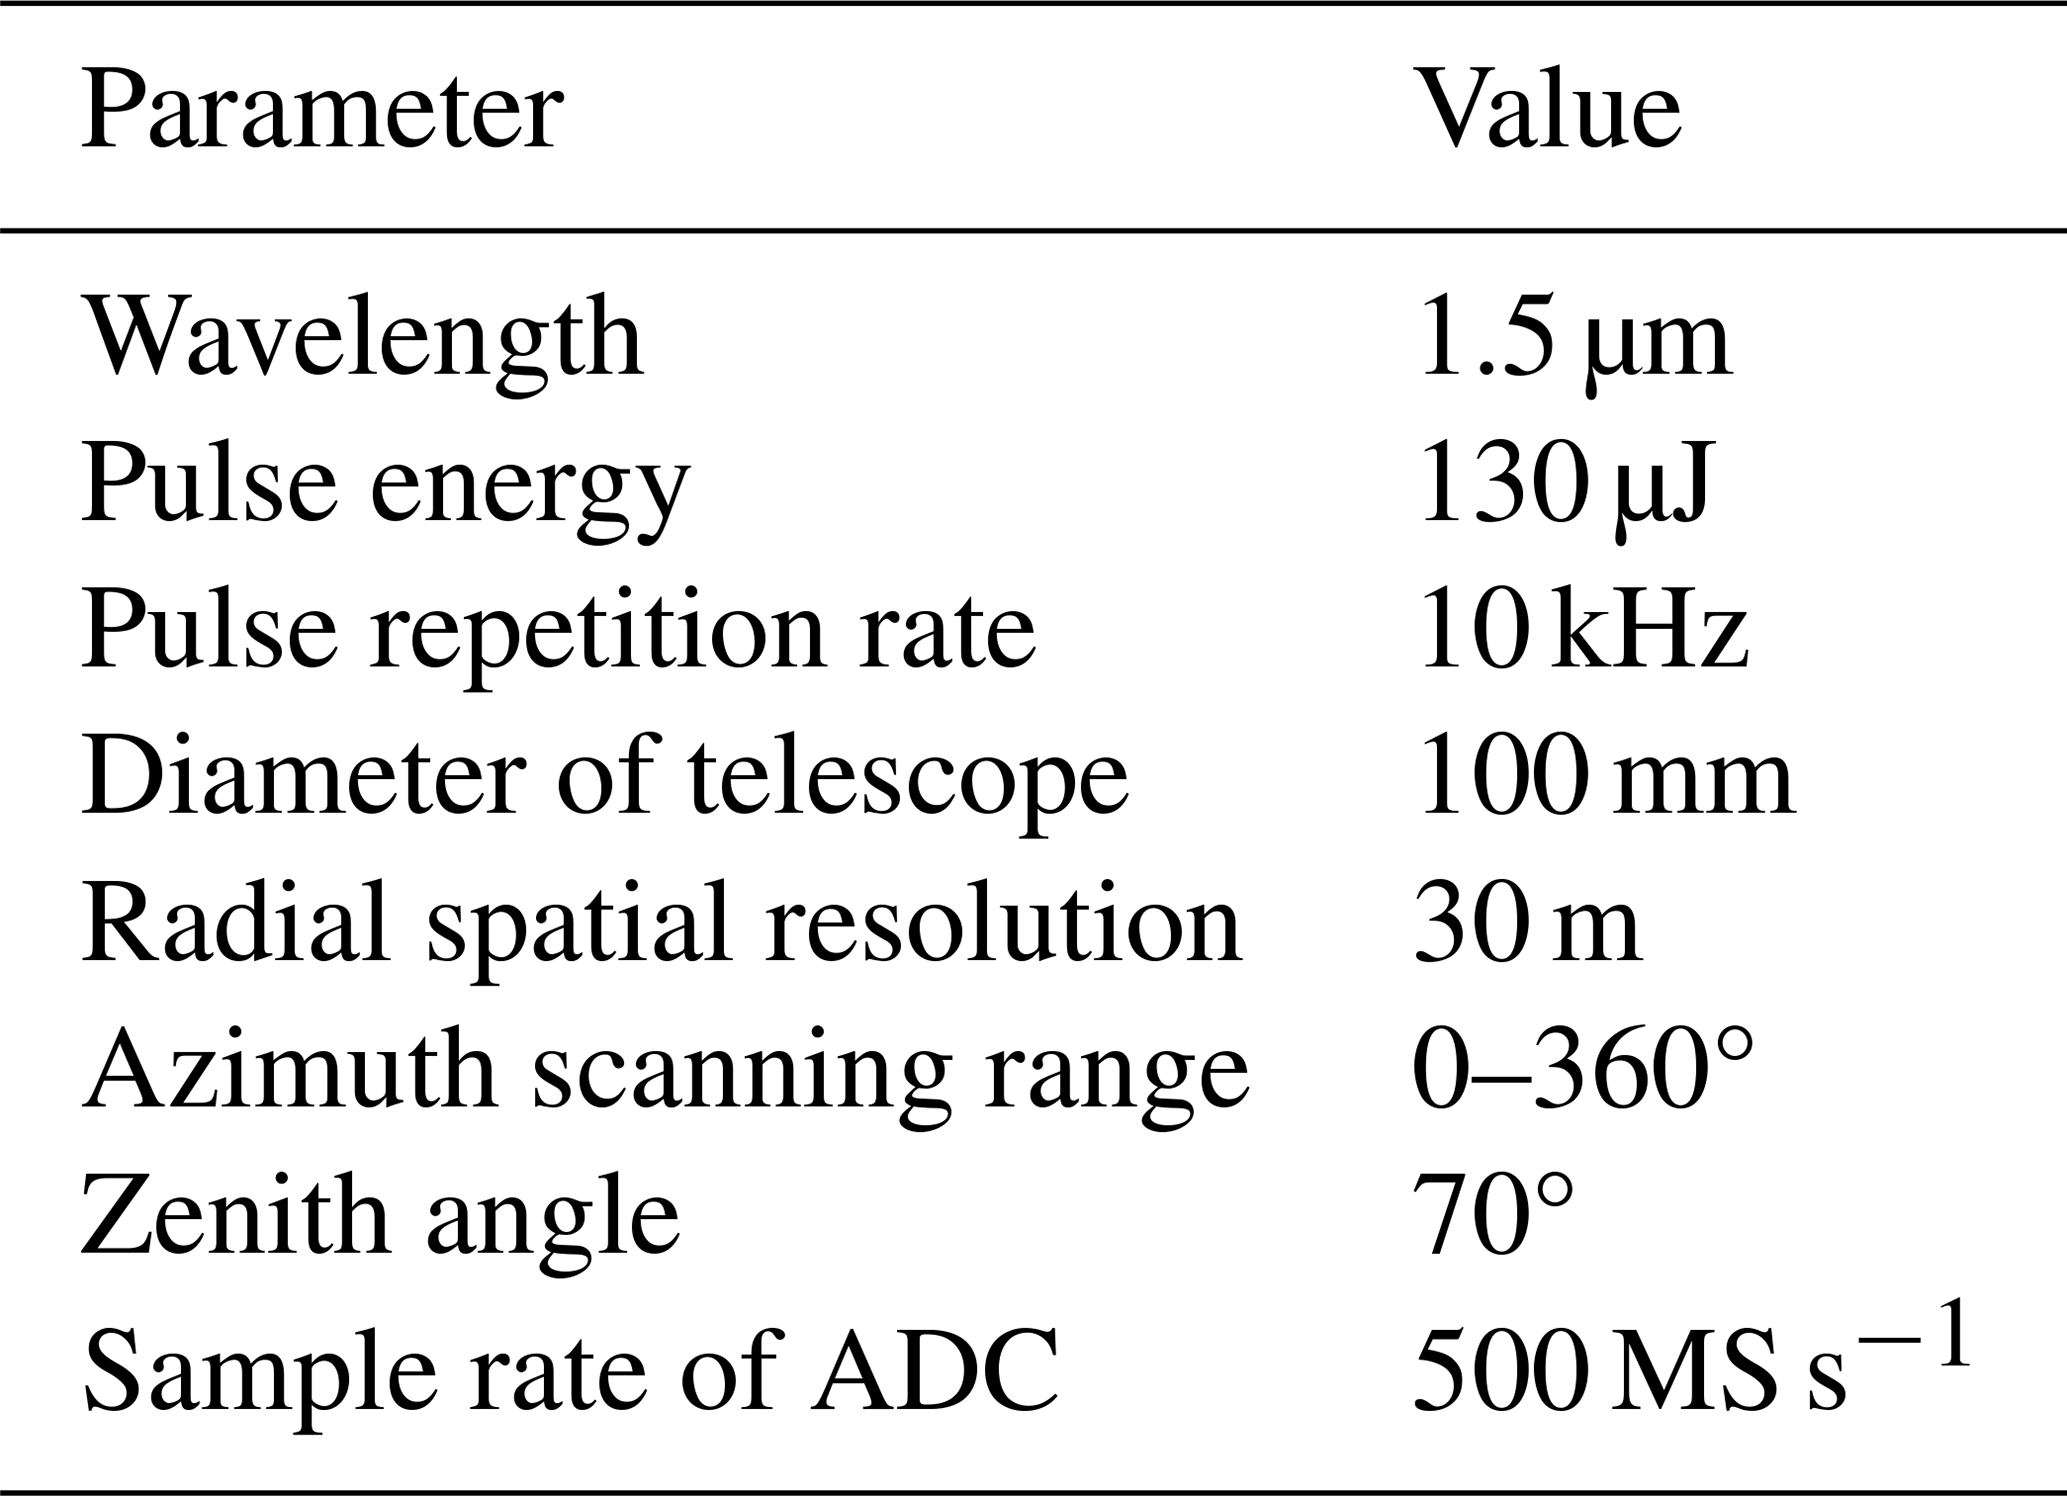
A CDWL conducted long-term stable detection experiments on the Taklamakan Desert, the formation process of an ice cloud was observed from 5 to 6 February 2022. It is operated at an eye-safe wavelength of 1.5 µm. The pulse energy of the laser is 130 µJ. The radial spatial resolution of the CDWL is 30 m. The sampling rate of the analog-to-digital converter (ADC) is 500 MS s−1. The key parameters are listed in Table 1. During the experiment, the lidar operates in a velocity azimuth display (VAD) scanning mode with a period of 1 min. The elevation angle is fixed at 70°. The azimuth angle changes from 0 to 300° with a step of 12°. The carrier-to-noise ratio (CNR) directly reflects the data quality of CDWL (Yuan et al., 2020). To ensure the reliability of the data, the CDWL data with a CNR less than −17 dB were filtered out. Banakh et al. (2017) described the calculation method and error analysis of turbulent kinetic energy dissipation rate (TKEDR) (Banakh et al., 2017). Li et al. (2023) introduced the inversion of backscattering coefficient (BSC) in detail (Li et al., 2023). Wei et al. (2019) analyzed the error of wind speed and wind direction (Wei et al., 2019). The planetary boundary layer height (PBLH) is calculated by using the TKEDR method (Wang et al., 2021). Su et al. (2024a) provided a detailed explanation of the parameter inversion method.
In a cloud system with a scale of hundreds of kilometers, the evolution process of each part of the cloud system is synchronized as a whole. As the development of the cloud system is accompanied by the advection, when the cloud system passes over the CDWL site, the CDWL can sample different parts of the cloud system at different times, which means that the obtained data is corresponding to the different development stages of the cloud system. Therefore, the CDWL detection method as a fixed-space Euler method can be used to study the evolution of cloud systems. In the previous studies, this type of lidar has been used in the research of atmospheric turbulence (Jiang et al., 2021), bioaerosol (Tang et al., 2022), planetary boundary layer height (Wang et al., 2022; Su et al., 2024a, b), simultaneous detection of wind and rain (Wei et al., 2019), thundercloud structure (Wu et al., 2023), wind shear (Yuan et al., 2022a, 2020) and so on.
2.3 Other data
ERA5 is the fifth-generation global climate reanalysis dataset from the European Centre for Medium-Range Weather Forecasts (Hersbach et al., 2020). In this paper, u-v wind vector, specific cloud ice water content (CIWC), temperature and relative humidity in ERA5 are used to study the cloud movement trend over the entire TD region. The dataset used has a spatial resolution of 0.25° × 0.25° and a temporal resolution of 1 h. It should be noted that according to the ECMWF formulation, standard ERA5 relative humidity is calculated with respect to water above 0 °C, ice below −23 °C, and uses mixed-phase interpolation in between.
MERRA-2 (Modern-Era Retrospective Analysis for Research and Applications, Version 2)is the atmospheric reanalysis of the modern satellite era produced by NASA's Global Modeling and Assimilation Office (Gelaro et al., 2017). The aerosol assimilation reanalysis datasets in MERRA-2, including dust dry and wet deposition, dust sedimentation, dust emission, and dust convection scavenging, were used to analyze the spatio-temporal variations of dust aerosols over the TD. The spatial resolution and temporal resolution of the data set used were 0.5° × 0.625° and 1 h, respectively.
Fengyun-4A (FY-4A) is a new generation geostationary meteorological satellite in China (Yang et al., 2017), equipped with an advanced geostationary radiation imager (AGRI) that can offer a variety of cloud products in the study area. In this paper, the cloud top temperature product (CTT) and cloud phase product (CLP) with a horizontal spatial resolution of 4 km and temporal resolution of 15 min are used to analyze the change of cloud top temperature and cloud phase, respectively. The 470, 650 and 830 nm three-band data in the FY-4A L1 dataset with a horizontal spatial resolution of 1 km are used to synthesize pseudo-color images. The cloud phase product of FY-4A is reasonably consistent with MODIS and Himawari-8 (Lai et al., 2019).
Himawari-8 satellite (Bessho et al., 2016), launched by the Japan Meteorological Agency, is equipped with an Advanced Himawari Imager (AHI) that employs a sophisticated cloud classification algorithm to discern various cloud types. The spatial and temporal resolutions of the Himawari-8 satellite data are 5 km and 10 min, respectively.
To identify aerosol sources and spatial transport paths, the HYbrid Single-Particle Lagrangian Integrated Trajectory (HYSPLIT) (Stein et al., 2015) model was used. The HYSPLIT model was configured to perform 24 h back trajectory calculations at an altitude of 3 km above the study site, utilizing meteorological data from the Global Data Assimilation System (GDAS) with a spatial resolution of 1°.
The meteorological data provided by the Minfeng County Meteorological Bureau is used to analyze near-surface meteorological changes, including temperature, relative humidity, horizontal visibility, horizontal wind speed, and horizontal wind direction.
It is worth noting that the study site is located at the extreme western edge of the Himawari-8 detection range (80° E), and its cloud phase product relies on visible and near-infrared bands, resulting in sparse valid daytime data for the target ice cloud. Therefore, rather than absolute pixel-to-pixel validation, this study utilizes the temporal evolution trends and neighborhood spatial consensus from these multi-source datasets to comprehensively complement the CDWL point observations and define the ice cloud life cycle.
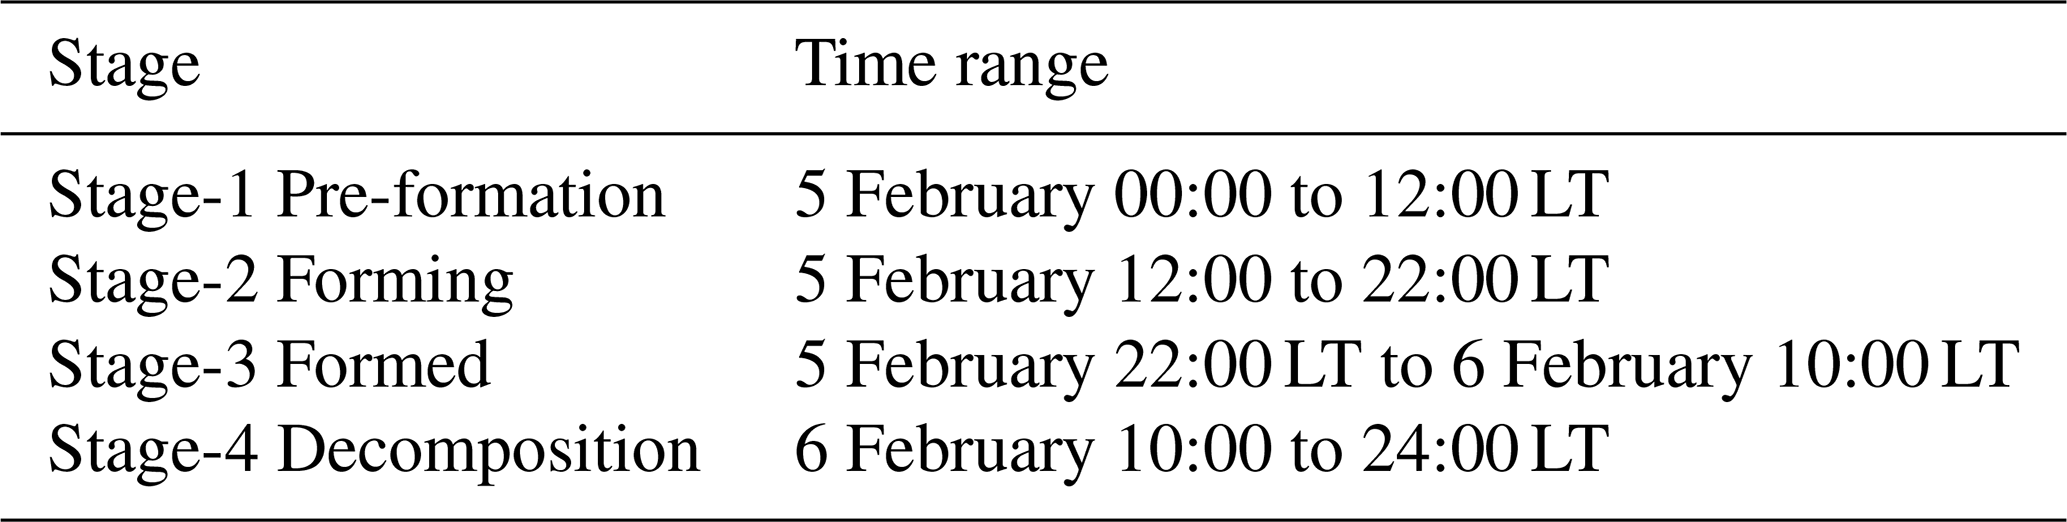
In order to analyze the formation process of ice clouds more directly, and combined with the dust transport process caused by atmospheric turbulence movement, this paper divides the life cycle of ice clouds into four-time stages (Field, 1999; Sullivan et al., 2022): pre-formation, forming, formed, decomposition. The time stages are divided as shown in Table 2.
3.1 Phenomena observed by the FY-4A satellite and Himawari-8 satellite
In this section, firstly, a cloud transit was observed by using the synthetic image of FY-4A. Subsequently, the temperature and phase changes of the cloud were analyzed by using FY-4A's CTT and CLP data. Finally, himawari-8 cloud classification data were employed to cross-verify FY-4A's observational results.
3.1.1 Cloud distribution
As shown in Fig. 2, the pseudo-color images synthesized by three bands in the FY-4A L1 dataset show the partial distribution of clouds over the TD on 6 February 2022. Taking into account the sunrise and sunset time of the day, the starting time of the displayed image is at 11:30 LT. As can be seen from Fig. 2a, a cloud system with a scale of hundreds of kilometers is distributed near the study site, and part of the surface state can be seen through the cloud system. Before 13:30 LT, the study site was covered by clouds. After 14:30 LT, the clouds in the study site dissipated gradually.
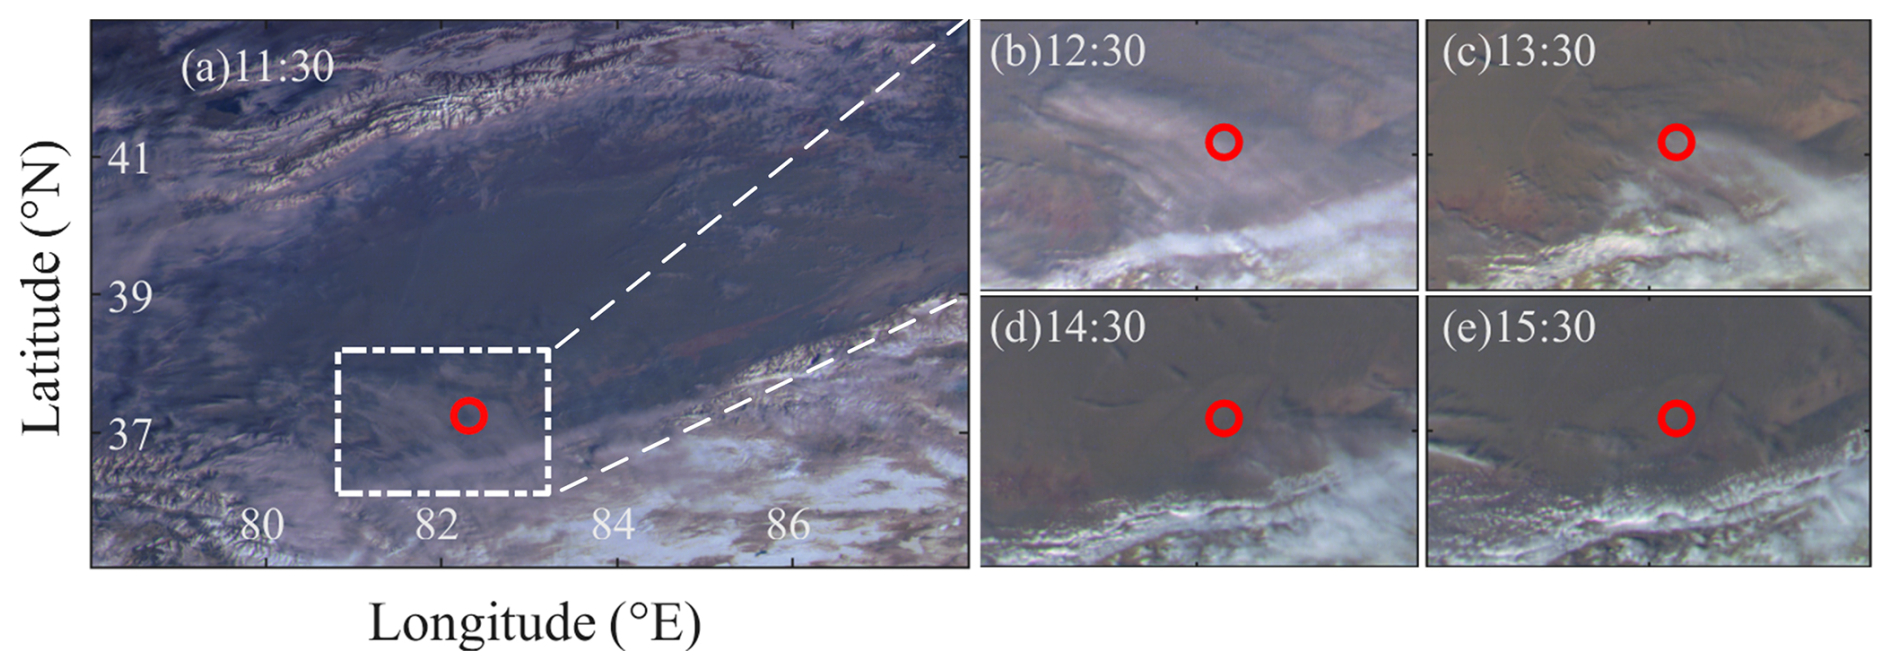
Figure 2Cloud distribution of FY-4A over the Taklamakan Desert from 11:30 to 18:00 LT (UTC+8) on 6 February 2022. The red circle symbol represents the study site Minfeng. The white box represents the drawing area of the subgraph.
3.1.2 Cloud top temperature and cloud phase
The formation of ice clouds can affect the temperature of cloud tops (Li et al., 2017). Figure 3 shows the statistical probability distribution of these pre-classified cloud phase pixels and cloud top temperature at the study site over the whole observation time. It can be seen from the figure that within the −10 to −17.5 °C, individual pixels of supercooled, mixed, and ice phases all occur statistically, indicating that the ice cloud is formed under relatively warm temperature conditions, and dust aerosols can form IN under such temperature conditions (Crawford et al., 2012; Murray et al., 2012). When the temperature is lower than −27.5 °C, the cloud phase changes from a mixed phase to an ice phase gradually. When the temperature is lower than −37.5 °C, the cloud only has an ice phase.
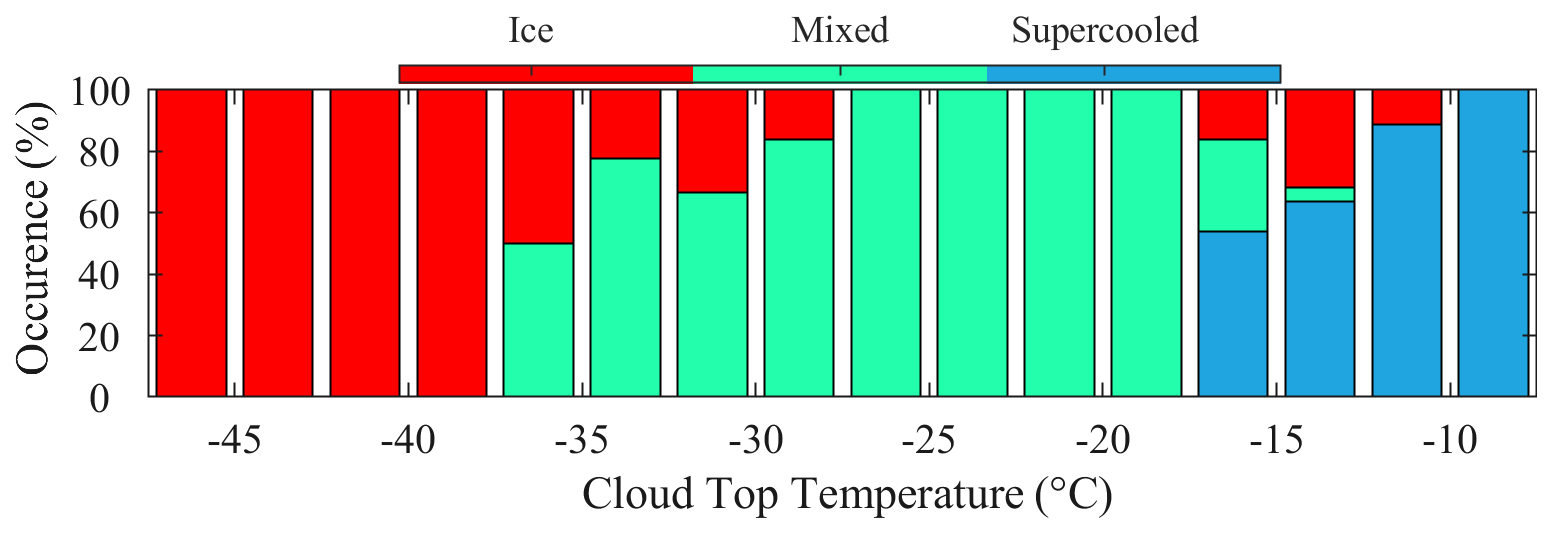
Figure 3The occurrence probability of cloud phase types at different cloud top temperatures of FY-4A in the study site of Minfeng from 5 to 6 February 2022 (UTC+8).
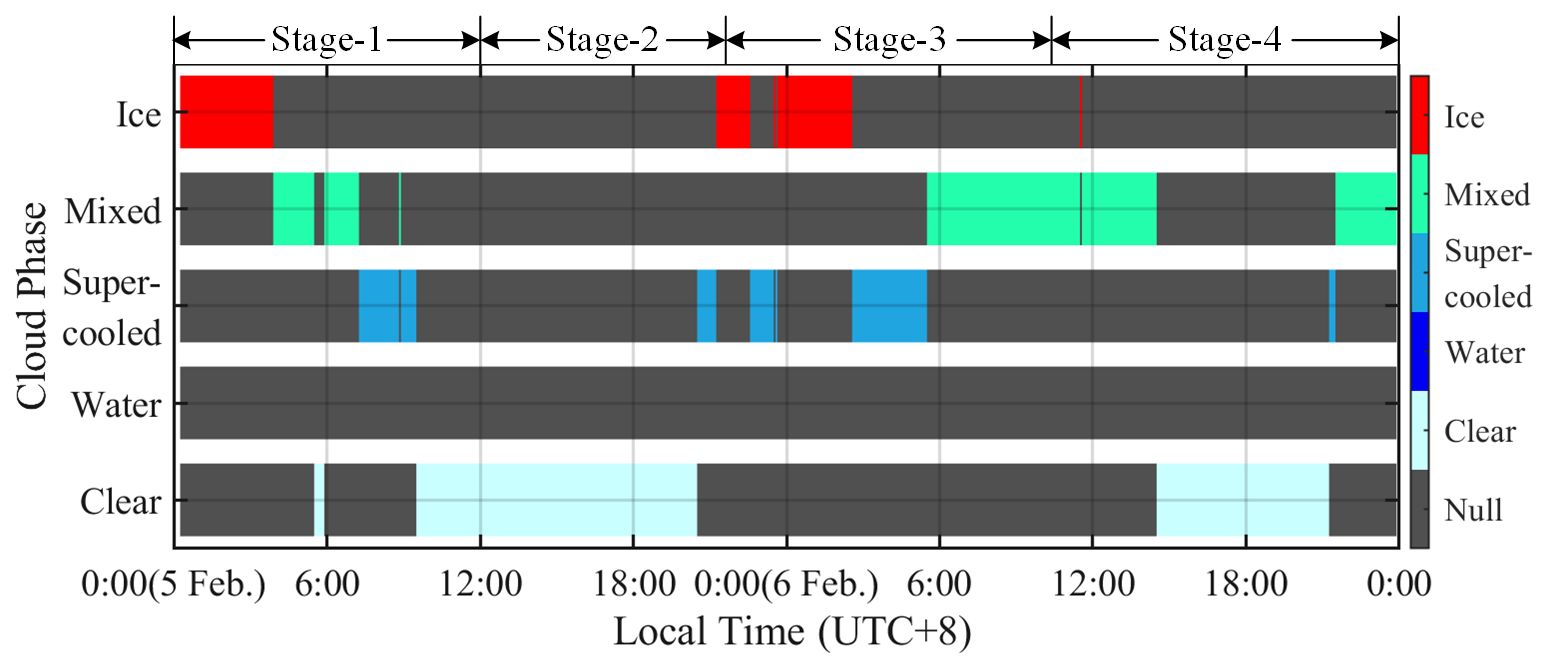
Figure 4Cloud phase distribution of FY-4A at the study site Minfeng from 5 to 6 February 2022 (UTC+8). The value of Null and Clear represent the background color and cloudless, respectively. The cloud phase types include ice (red), mixed (aquamarine), supercooled water (sky blue) and water (blue).
Figure 4 shows the change process of cloud phase in the study site from 5 to 6 February 2022. During Stage-1, it can be seen that a cloud system passed by the study site and completely dissipated. During Stage-2, the study site was in a cloud-free state before 20:00 LT, However, from 20:00 to 22:00 LT, the study site began to be covered by clouds and under relatively warm temperature conditions (in Fig. 3), the cloud phase transitioned from supercooled water phase to ice phase. Therefore, this phenomenon indicates that dust aerosols can act as IN and participate in the formation of ice clouds, as observed in previous studies (Murray et al., 2012; Moore and Molinero, 2011). During Stage-3, the study site was nearly continuously covered in clouds. The phase state of the cloud is dominated by mixed phase and ice phase, which indicates that this cloud system is composed of ice clouds and constitutes a complete advection cloud system. It is worth noting that the AGRI may identify some ice clouds as mixed-phase clouds (Lai et al., 2019), while current Himawari-8 observations predominantly show cirrus cloud (in Fig. 6), which coincidentally cross-validates the FY-4A's observational results. During Stage-4, the mixed phase cloud completely dissipated after 14:30 LT with the cloud advection movement.
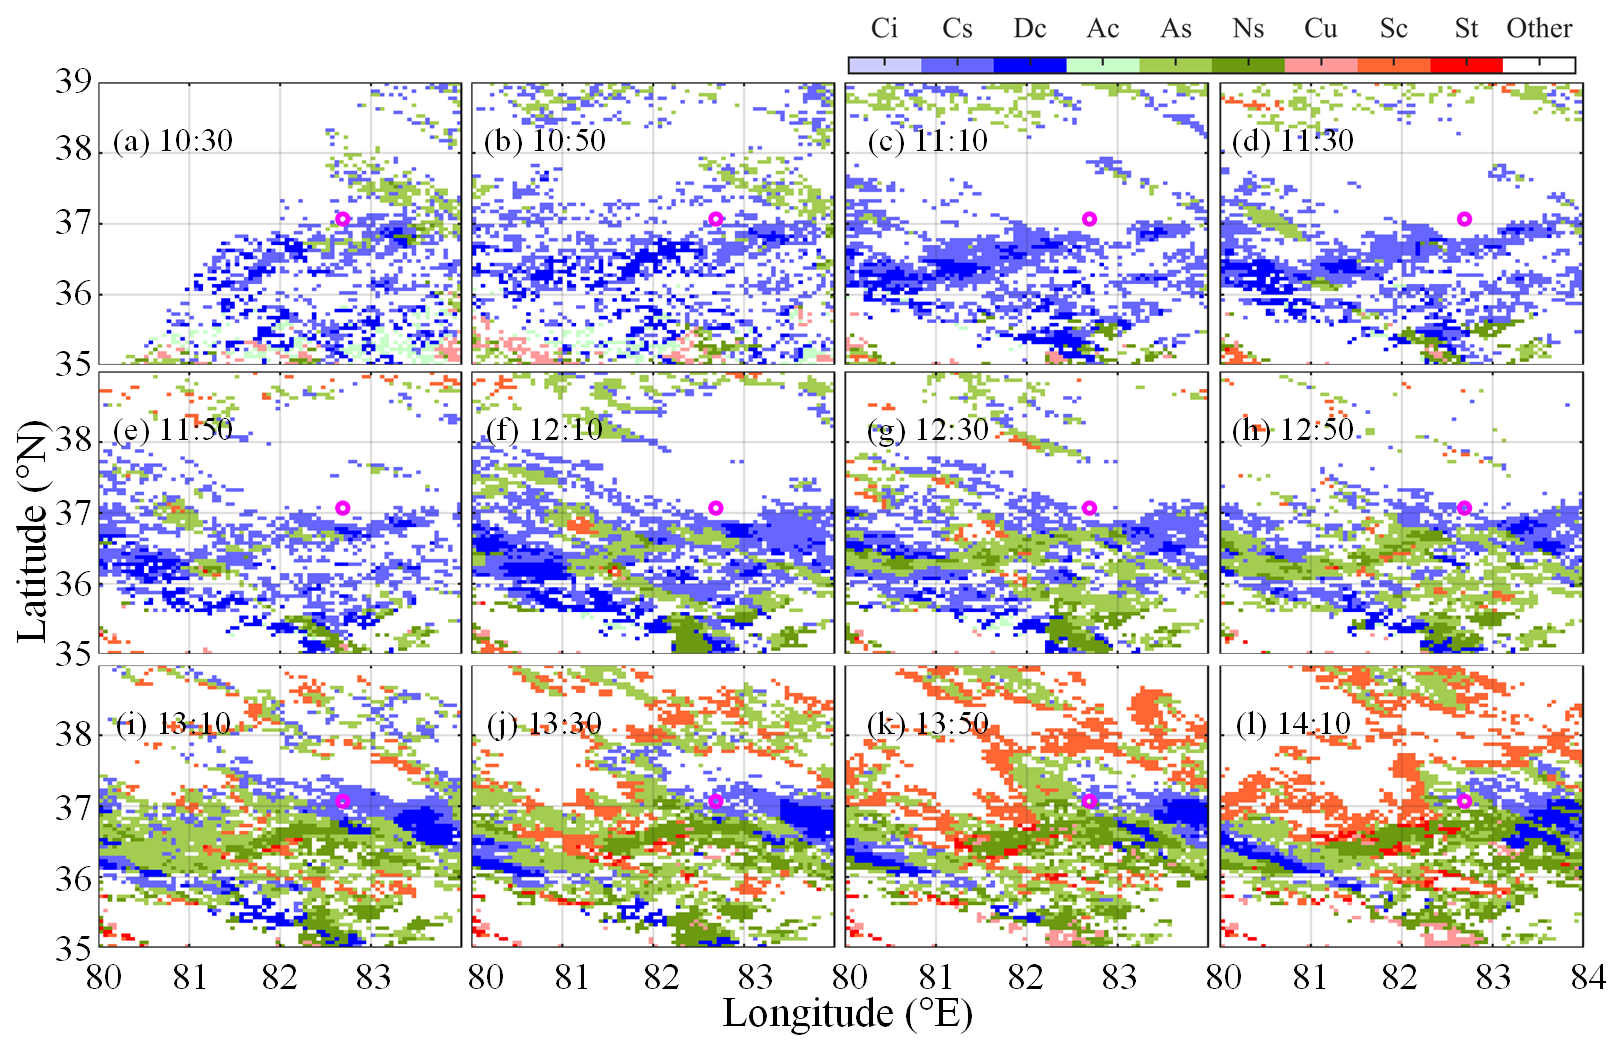
Figure 5The Himawari-8 satellite observed changes in cloud type at the study site every 20 min from 10:30 to 14:10 LT (UTC+8) on 6 February 2022. The purple circle symbol represents the study site Minfeng. Cloud types are distinguished by different colors. The cloud type of Ci, Cs, Dc, Ac, As, Ns, Cu, Sc, St represent cirrus, cirrostratus, deep convection, altocumulus, altostratus, nimbostratus, cumulus, stratocumulus, stratus, respectively.
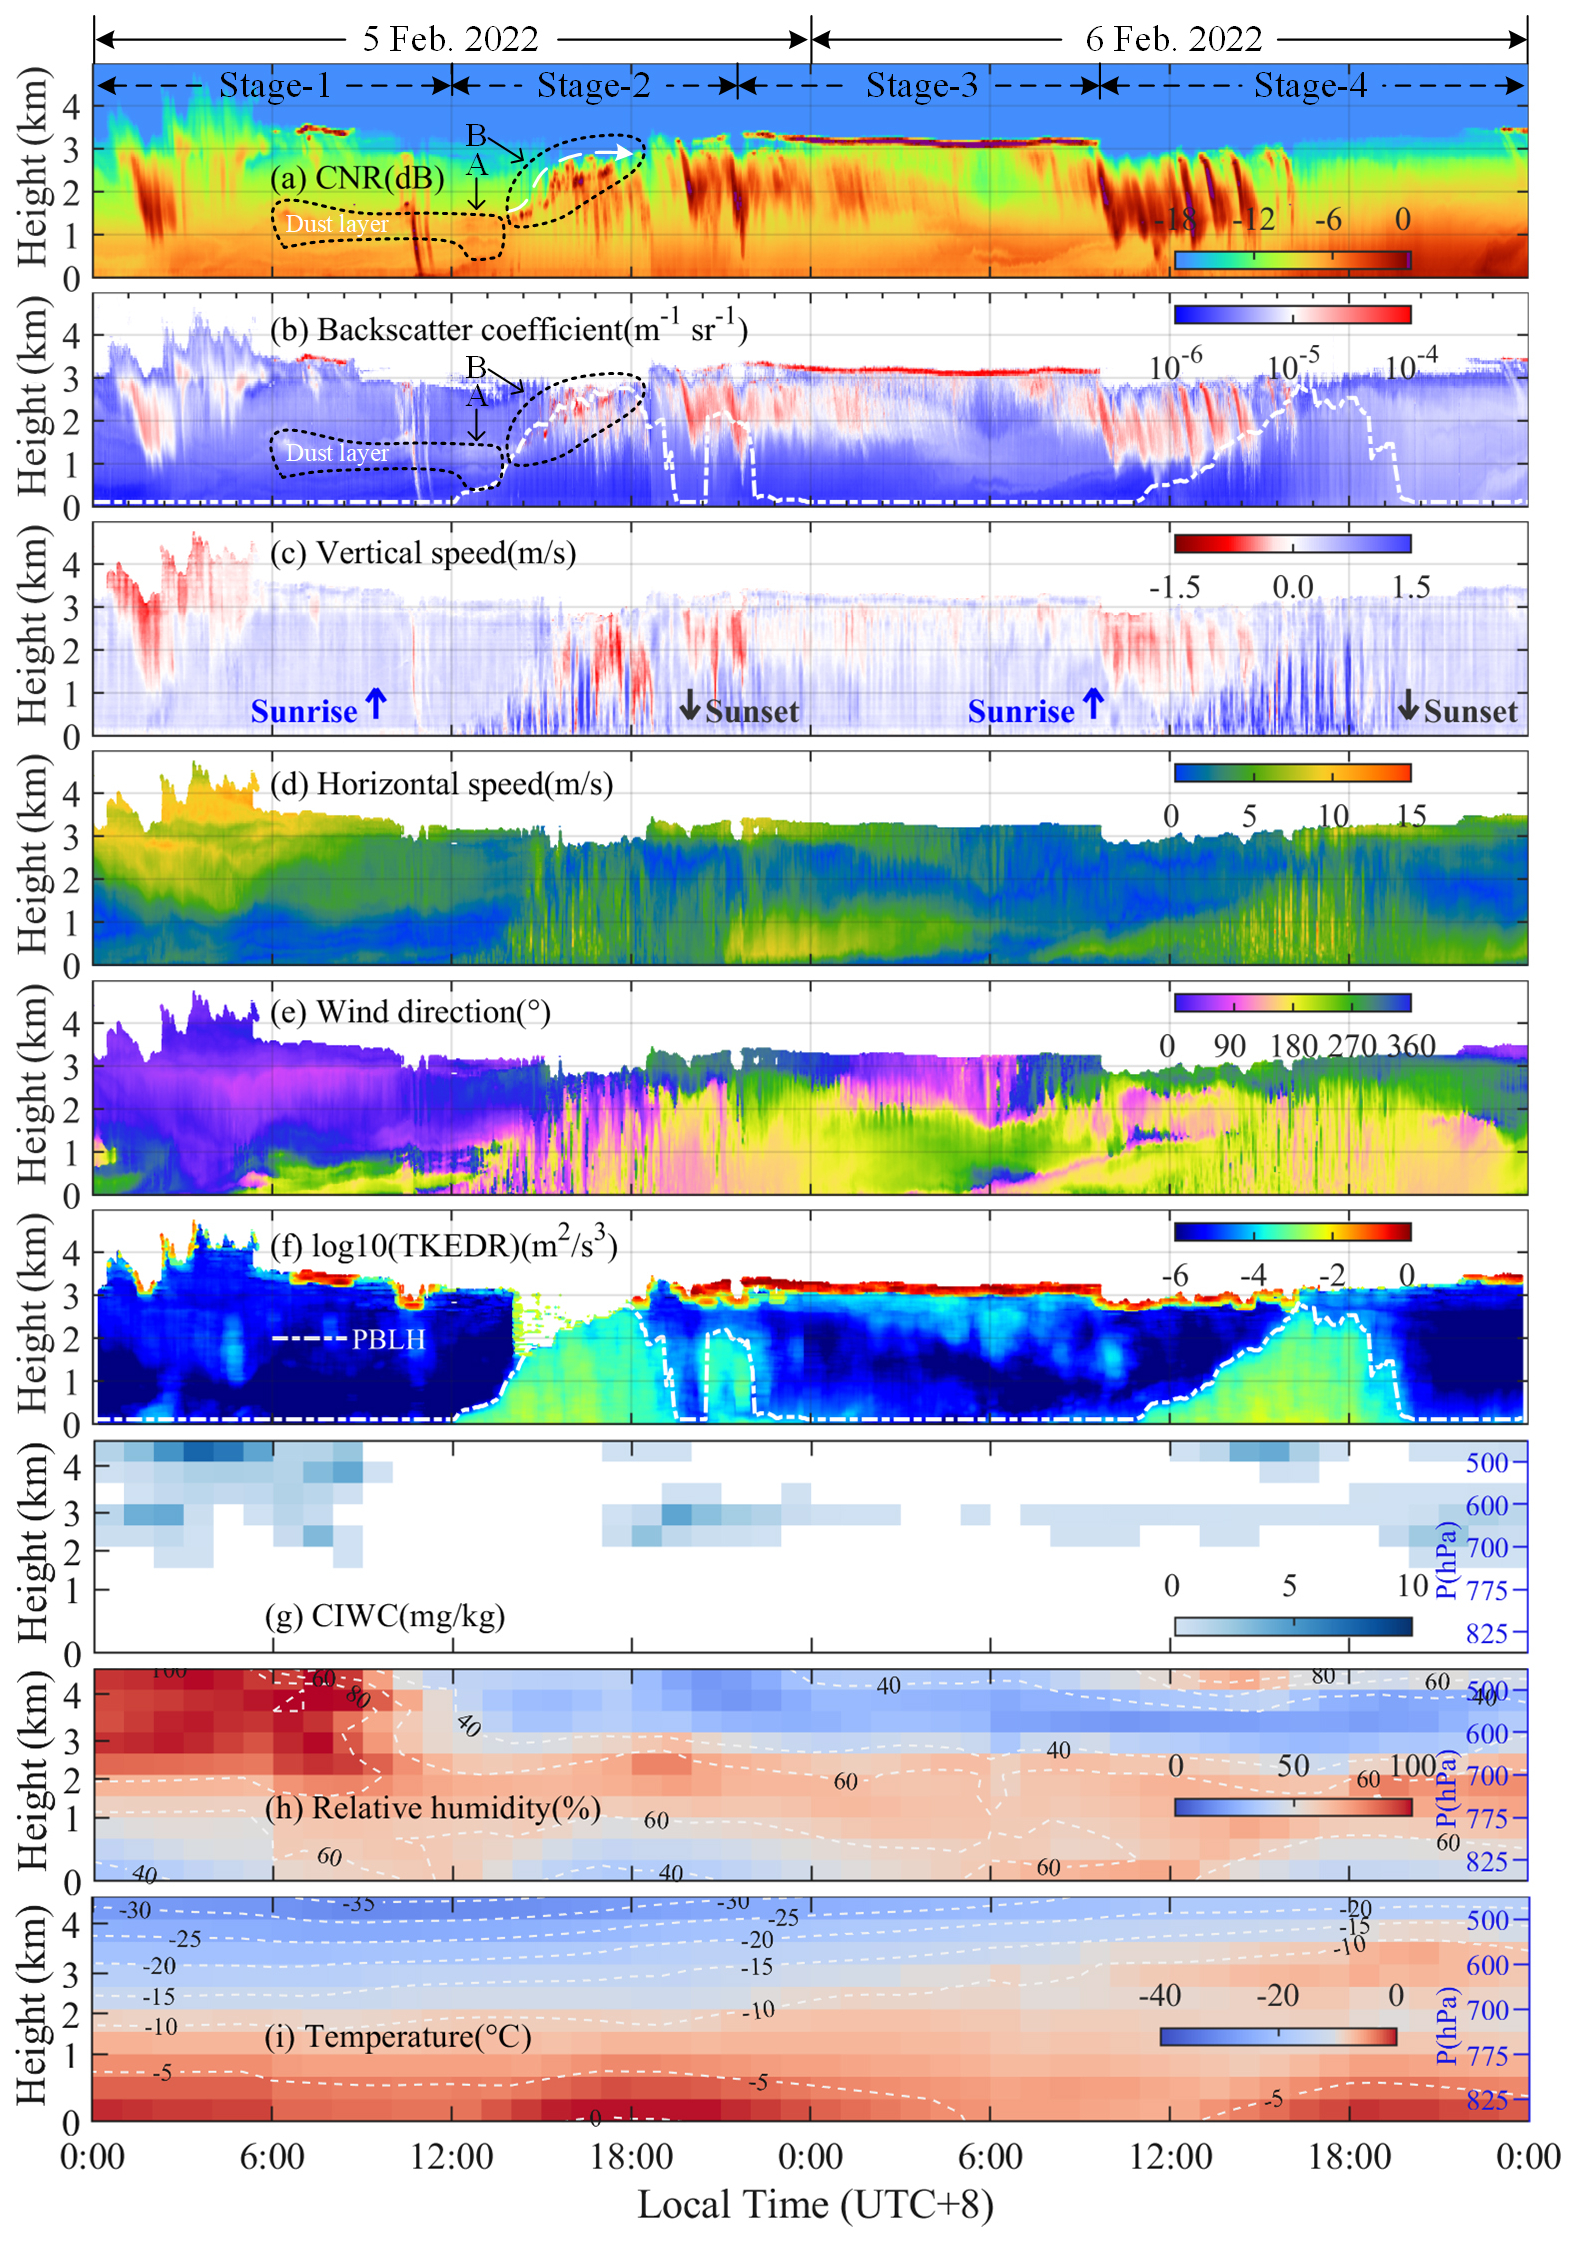
Figure 6The ice cloud episode was detected based on muti-source data, such as CDWL, ERA5 and FY-4A, from 5 to 6 February 2022 (UTC+8). (a) CNR, (b) backscatter coefficient, (c) vertical wind speed, (d) horizontal wind speed, (e) horizontal wind direction, (f) log10(TKEDR), (g) specific cloud ice water content, (h) relative humidity, (i) temperature. The height represents the height above the ground of the lidar site. The four stages of the ice cloud life cycle are labelled in panel (a). In panels (a) and (b), the dotted boxes A and B represent the existing dust layer and the upward transport process of dust aerosol, respectively. The positive vertical wind speed in panel (c) represents the rising speed, and vice versa; cloud top heights below 5 km are marked with black lines in panel (c). The time of sunrise and sunset is also marked with arrow symbols in panel (c). In panel (e), 0° represents the wind blows to the north. The PBLH is denoted by white dashed lines in panels (b) and (f), respectively. The temperature and relative humidity contours in panels (h) and (i) are denoted by light gray dashed lines.
3.2 Lidar results and comprehensive analysis
In this section, multi-source data are used to comprehensively analyze the life cycle and influencing factors of the ice clouds. Figure 6 shows the continuous observation results of CDWL, ERA5 and FY-4A from 5 to 6 February 2022. The u-v wind vector in ERA5 was used to analyze the boosting effect of the special terrain factors (Lloyd et al., 2015; Rogers and Vali, 1987) on the formation of ice clouds. Figure 7 shows the 24 h HYSPLIT backward trajectory results of dust transport. Each stage of the ice cloud life cycle is analyzed as follows.
-
Stage-1: Pre-formation. The wind created horizontal transport conditions for dust aerosols. Near the surface (below 1 km), firstly, a lower stable nocturnal boundary layer is formed due to the weak turbulent motion (Fig. 6f), which limits the transmission of near-surface dust aerosols to the upper atmosphere. Secondly, in Fig. 6d, the horizontal wind speed near-surface is high from 00:00 to 05:00 LT, but then the wind speed decreases to a calm state, which can lead to the suspension of dust aerosols (as shown in Fig. 6a and b of dust layer). Then, in terms of wind direction, the westerly wind prevails in the upper atmosphere from 05:00 to 12:00 LT, and the easterly wind prevails near the ground. The opposite wind direction can further separate the high-altitude water vapor from the near-surface dust aerosol. Additionally, the CNR or backscattering coefficient can be used as an indicator of aerosol concentration (Peña et al., 2013; Heese et al., 2010), and the BSC in regions of the TD with relatively strong dust intensity is distributed from 2 × 10⁻⁶ to 10−5 m−1 sr−1 (Shuoqiu and Xiaoyan, 2020). Therefore, from 06:00 to 12:00 LT, as depicted in the Fig. 6a, the CNR value in box A (below 1.5 km) is greater than the above value, correspondingly, the BSC value (from 2 × 10⁻⁶ to 4 × 10⁻⁶ m−1 sr−1) of Fig. 6b within this temporal and spatial interval falls within the BSC range for dust aerosols, which supports that there is a dust layer here. Specifically, as depicted in Fig. S3a, a horizontal convergence airflow was formed in the TD. On 5 February at 10:00 LT, the local visibility reached the minimum value of 6 km and the situation at that time belonged to the dust weather, as indicated in Fig. S2.
-
Stage-2: Forming. The turbulence and wind can provide an opportunity for dust aerosols to contact supercooled water, thereby promoting the formation of ice clouds. Physically, desert dust aerosols trigger glaciation via deposition or immersion freezing at −10 to −17.5 °C. The upward transport of these IN is strongly influenced by the PBLH (Holtslag and Boville, 1993). Within this layer, turbulent kinetic energy lifts the dust and generates micro-scale eddies, which accelerate the phase transition by enhancing dust-droplet collisions and local supersaturation. After sunrise, with the increase of solar radiation (Fig. 6i), the turbulent activity gradually becomes active and a convective mixed boundary layer with a maximum height of 3 km is formed (Fig. 6f). At the same time, the near-surface horizontal wind speed increases gradually, and the horizontal wind direction at low altitude turns from southwest to north (Figs. 6e and S3e). Firstly, it can be found in Figs. S3g and S1 that the change of wind direction can create the conditions for the transport of dust aerosols along the Kunlun Mountains to the upper atmosphere. Secondly, the values of PBLH, BSC and CNR have an uplift process, the 24 h HYSPLIT backward trajectory results shown in Fig. 7 clearly show the climbing process of dust aerosols. The dust emission in Fig. S4k–l is also greater than 0.5 µg m−2 s−1, and there is basically no dry and wet deposition of dust here (Fig. S4a–e). Additionally, the relative humidity in Fig. 6h decreased rapidly near the height of 3 km. Then, in Fig. 6i and g, the temperature slowly rises to −15 °C and the weight of ice in the cloud increases significantly at 600 hPa (form 0.12 to 4.29 mg kg−1). Meanwhile, in Fig. 6c, the cloud top height rose from around 2.37 km to over 3 km after 20:30 LT. Finally, combined with the CLP and CTT data of FY-4A in Fig. 4, it can be seen that dust aerosols can act as effective IN and participate in the formation of ice clouds.
-
Stage-3: Formed. In this stage, the ice cloud has been stably formed and transported to a wide horizontal range, and most cloud types are cirrus (Fig. 5). When the lidar beam hits the ice cloud, the distribution of the crystal base surface makes the laser energy decay rapidly, thus forming a very strong backscattering signal (He et al., 2021; Westbrook et al., 2010). Clouds can be detected from the BSC values by selecting a threshold of 10−5 m−1 sr−1 (Manninen et al., 2018; Harvey et al., 2013). In the experiment, judging from the thin layers of the CNR (> −5 dB), BSC (≥ 10−4 m−1 sr−1) and CIWC (≥ 0.12 mg kg−1) at about 3 km, the laser beam does not penetrate the ice cloud (Wu and Yi, 2017; Cheng and Yi, 2020). In terms of turbulence in Fig. 6f, during the night and morning, there is a stable nocturnal boundary layer with low temperature and weak turbulence. The updraft air at low altitude (Fig. 6c) against downdraft air at high altitude balances the gravity of the ice cloud, supporting the continuous growth of the ice cloud. In terms of relative humidity, water vapor competition can be more intense due to the generation of a large number of ice crystals, making it more difficult to increase the size of ice crystals, thus maintaining the existence of ice clouds (Li et al., 2011; Tao et al., 2012). Therefore, it can be found from Fig. 6h that the relative humidity of the atmosphere above 3 km is always maintained below 40 % during this stage. In addition, since the underlying surface of the atmosphere is a dry desert and the terrain is a relatively enclosed basin terrain surrounded by mountains on three sides, the turbulent activity at night is weak, and a significant downdraft is sustained throughout the stage. This situation results in the attenuation of the upward transport of water vapor and dust aerosols. As a result, the cloud base height of the ice cloud consistently stays at a relatively low height of around 3 km (Wu and Yi, 2017; He et al., 2023; Seifert et al., 2010). It is worth noting that in Fig. 6c, the gradual thickening of the cloud layer provides a favorable environment for rapid crystal growth via vapor deposition, and simultaneously increases the probability of collision and aggregation of ice crystals, thus creating conditions for ice phase precipitation in Stage-4.
-
Stage-4: Decomposition. With the rise of the sun, the temperature gradually increases to form a mixed boundary layer dominated by downward airflow, and the ice cloud begins to transform into a mixed phase cloud and sink downward. The ice virga layer refers to the ice crystal precipitation layer formed by vaporization or liquefaction before falling to the ground (Westbrook and Illingworth, 2013; Gultepe et al., 2017). By analyzing the CNR and BSC values from 10:00 to 16:00 LT, it is obvious that the large-grained ice crystals, primarily grown by rapid vapor deposition and subsequent aggregation, rush down from 3 to 1 km under the function of gravity conditions, forming an ice virga. The aggregation process is firmly supported by the maximum falling velocity of the ice virga (1.38 m s−1), which significantly exceeds the typical terminal velocity of individual pristine ice crystals. When the ice virga sinks down to about 1 km, as shown in Fig. 6a, due to the relatively dry (Fig. 6h–i) and strong northeast wind blowing from the desert hinterland and the frictional effects of air resistance, the ice virga evaporates before reaching the ground. At the same time, the amounts of dust from wet and dry deposition are very limited (Fig. S5a-d), however, dust sedimentation is evident (Fig. S5f–i). The maximum falling velocity of ice virga during the observation period is 1.38 m s−1, which agrees well with previous observations (Ansmann et al., 2008; Abshire et al., 1974). Note that the evaporation of ice crystals pushes the dust aerosol down to the lower layer, making the CNR increase below 1 km, reducing the relative humidity to below 60 % at 825 hPa, and causing the presence of dust convection scavenging near the study site (Fig. S5s–t).
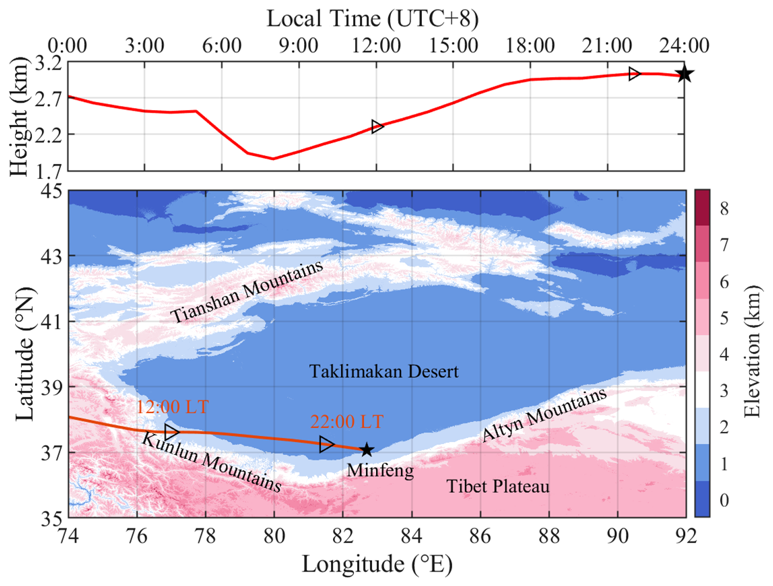
Figure 7The 24 h HYSPLIT backward trajectory results of dust transport calculated at 24:00 LT (UTC+8) on 5 February 2022. The starting location is set at 3 km above the study site Minfeng. The study site exhibits a distinct upward dust transport process between 12:00 and 22:00 LT. (a) Dust aerosol vertical transport path, (b) dust aerosol horizontal transport path.
Compared with Fig. 4, the distribution of ice clouds observed by CDWL is generally consistent with that of FY-4A. Due to the fact that the FY-4A observation focuses on the cloud top state and its horizontal spatial resolution and time resolution are much coarser than the CDWL. Additionally, by using the nine pixels closest to the study site in both FY-4A and ERA5 datasets as the subject of the study, so the cloud results are also slightly different. As a comparison, the observation results of Himawari-8 satellite and local meteorological instruments are shown in Figs. 5 and S2. From the observation results of these data, it can be seen that there is the same change trend with the CDWL data.
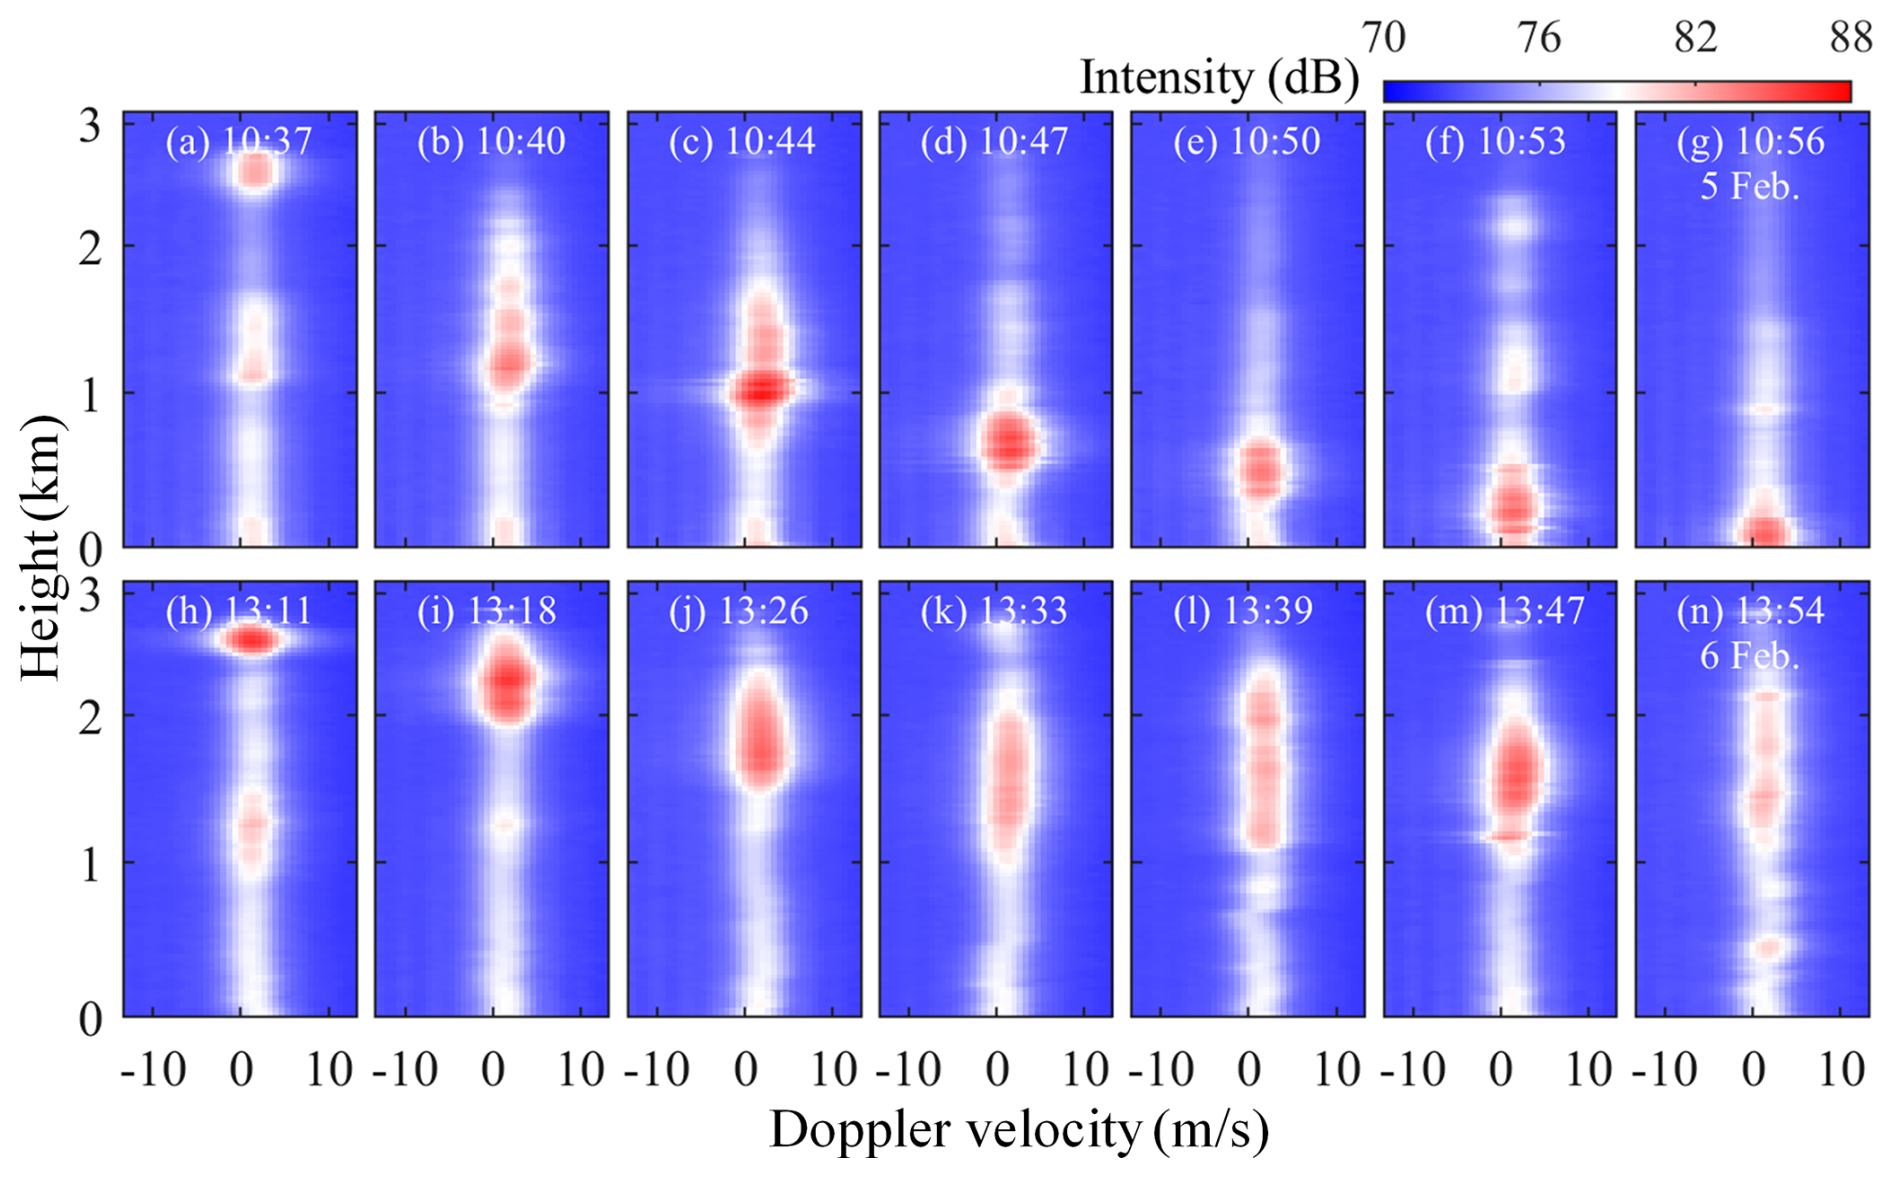
Figure 8The power spectrum observation results of two typical ice phase precipitation events were obtained during the lidar experiment. (a–g) From 10:37 to 10:56 LT (UTC+8) on 5 February 2022, (h–m) from 13:11 to 13:57 LT on 6 February 2022.
Figure 8 shows two typical power spectrum of the vertical speed during the ice phase precipitation events observed by CDWL. Figure 8a–g shows a precipitation event that occurred on 5 February, a light precipitation hits the ground when the wind below 1 km is weak. In another different case as shown in Fig. 8h–n, the precipitation failed to touch the ground due to the higher temperature and stronger wind below 1 km. As shown in Fig. 8, the difference between the speed of the aerosol and that of the ice crystal is not obvious. This may suggest that, no liquid precipitation occurs, since the Doppler double-peak power spectrum structure caused by the difference between wind speed and rain speed is not observed (Wei et al., 2019).
In this study, multi-source data were used to analyze a complete ice cloud evolution process on the southern edge of Taklamakan Desert from 5 to 6 February 2022. The results indicated that the aerosol-cloud-precipitation interaction plays an important role in the life cycle of ice clouds. As an effective IN, dust aerosols make more water vapor distributed into dust particles, and the limited water content in the desert atmosphere will lead to fierce competition for water vapor, thus increasing the difficulty of the growth of ice crystal particle size and inhibiting the occurrence of precipitation. The terrain of Taklamakan Desert is a relatively enclosed basin terrain surrounded by mountains on three sides, and the complete formation of the ice cloud is at night when the turbulent activity of the stable nocturnal boundary layer is weak and the underlying surface of the atmosphere is a dry desert, which greatly weakens the upward transport of water vapor and dust aerosol, thus making the cloud base height maintained at around 3 km. Due to the enhancement of solar radiation, the heterogeneous nucleation makes the cloud top temperature rise slowly, and due to the lack of water vapor and dust aerosol supplement, the ice cloud begins to decompose and produce ice precipitation, which evaporates before reaching the ground.
Overall, the results not only reveal the transmission and diffusion mechanism of dust in the Taklamakan Desert, but also reflect the important role of terrain, turbulence and wind in the life cycle of ice clouds in a more comprehensive and detailed way, thus improving the understanding of the dust-cloud-atmosphere interaction in the desert hydrological cycle. To capture such complex interactions, this multi-source approach synergizes CDWL's high vertical resolution with satellites' broad horizontal coverage, capturing both microphysical dynamics and macro-scale thermodynamics. However, CDWL's fixed-point Eulerian nature requires clouds to advect overhead and relies on auxiliary data for phase classification. While applicable to other Taklamakan ice clouds, the importance of specific datasets shifts dynamically: HYSPLIT and MERRA-2 are crucial for initial dust tracking, whereas CDWL becomes essential later for observing localized ice virga evaporation. In view of this, our future research plans to integrate polarization lidar and weather radar (Ma et al., 2015; Yin et al., 2021; Wu et al., 2015; Yuan et al., 2022b). This will enable precise classification of clouds and aerosols, thereby deepening our understanding of ice cloud formation mechanisms in desert environments.
Data supporting the results are available in the Supplement. The ERA5 data sets are publicly available from the ECMWF website at https://doi.org/10.24381/cds.bd0915c6 (Hersbach et al., 2023). The MERRA-2 data used can be downloaded from https://doi.org/10.5067/HM00OHQBHKTP (GMAO, 2015). The FY-4A satellite data are available on the National Satellite Meteorological Center (NSMC) website at https://satellite.nsmc.org.cn (last access: 10 March 2026). The Himawari-8 data can be downloaded from https://www.eorc.jaxa.jp/ptree/index.html (last access: 10 March 2026). The aerosol source and transport path can be visualized on the website: https://www.ready.noaa.gov/HYSPLIT.php (last access: 10 March 2026). All the above data need to be registered before downloading. The CDWL datas can be downloaded from https://doi.org/10.6084/m9.figshare.25432984 (Su, 2024).
The supplement related to this article is available online at https://doi.org/10.5194/amt-19-2657-2026-supplement.
H.X., L.S., and J.Y. planned the campaign; L.S., X.W., and Q.H. performed the measurements; L.S., C.L., J.Y., K.W., T.W. and X.H. analyzed the data; L.S. wrote the manuscript draft; H.X., C.L., and M.E. reviewed and edited the manuscript. All authors have read and agreed to the published version of the manuscript.
The contact author has declared that none of the authors has any competing interests.
Publisher's note: Copernicus Publications remains neutral with regard to jurisdictional claims made in the text, published maps, institutional affiliations, or any other geographical representation in this paper. The authors bear the ultimate responsibility for providing appropriate place names. Views expressed in the text are those of the authors and do not necessarily reflect the views of the publisher.
Thanks for the support of the Xinjiang Uygur Autonomous Region Meteorological Service and the Desert Meteorological Institute of China Meteorological Administration for this experiment and local meteorological data. The National Satellite Meteorological Center of the China Meteorological Administration for providing support with the cloud product data. The European Centre for Medium-Range Weather Forecasts for providing support with atmospheric reanalysis data.
This paper was edited by Dmitry Efremenko and reviewed by two anonymous referees.
Abshire, N., Schwiesow, R., and Derr, V.: Doppler lidar observations of hydrometeors, J. Appl. Meteorol., 13, 951–953, https://doi.org/10.1175/1520-0450(1974)013<0951:DLOOH>2.0.CO;2, 1974.
Alexander, S. and Protat, A.: Cloud properties observed from the surface and by satellite at the northern edge of the Southern Ocean, J. Geophys. Res.-Atmos., 123, 443–456, https://doi.org/10.1002/2017JD026552, 2018.
Ansmann, A., Mattis, I., Müller, D., Wandinger, U., Radlach, M., Althausen, D., and Damoah, R.: Ice formation in Saharan dust over central Europe observed with temperature/humidity/aerosol Raman lidar, J. Geophys. Res.-Atmos., 110, D18S12, https://doi.org/10.1029/2004JD005000, 2005.
Ansmann, A., Tesche, M., Althausen, D., Müller, D., Seifert, P., Freudenthaler, V., Heese, B., Wiegner, M., Pisani, G., and Knippertz, P.: Influence of Saharan dust on cloud glaciation in southern Morocco during the Saharan Mineral Dust Experiment, J. Geophys. Res.-Atmos., 113, D04210, https://doi.org/10.1029/2007JD008785, 2008.
Ansmann, A., Tesche, M., Seifert, P., Althausen, D., Engelmann, R., Fruntke, J., Wandinger, U., Mattis, I., and Müller, D.: Evolution of the ice phase in tropical altocumulus: SAMUM lidar observations over Cape Verde, J. Geophys. Res.-Atmos., 114, https://doi.org/10.1029/2008JD011659, 2009.
Banakh, V., Smalikho, I., and Falits, A.: Estimation of the turbulence energy dissipation rate in the atmospheric boundary layer from measurements of the radial wind velocity by micropulse coherent Doppler lidar, Opt. Express, 25, 22679–22692, https://doi.org/10.1364/OE.25.022679, 2017.
Bessho, K., Date, K., Hayashi, M., Ikeda, A., Imai, T., Inoue, H., Kumagai, Y., Miyakawa, T., Murata, H., and Ohno, T.: An introduction to Himawari-8/9 – Japan's new-generation geostationary meteorological satellites, J. Meteorol. Soc. Jpn. Ser. II, 94, 151–183, https://doi.org/10.2151/jmsj.2016-009, 2016.
Cheng, C. and Yi, F.: Falling mixed-phase ice virga and their liquid parent cloud layers as observed by ground-based lidars, Remote Sens., 12, 2094, https://doi.org/10.3390/rs12132094, 2020.
Chouza, F., Reitebuch, O., Benedetti, A., and Weinzierl, B.: Saharan dust long-range transport across the Atlantic studied by an airborne Doppler wind lidar and the MACC model, Atmos. Chem. Phys., 16, 11581–11600, https://doi.org/10.5194/acp-16-11581-2016, 2016.
Crawford, I., Bower, K. N., Choularton, T. W., Dearden, C., Crosier, J., Westbrook, C., Capes, G., Coe, H., Connolly, P. J., Dorsey, J. R., Gallagher, M. W., Williams, P., Trembath, J., Cui, Z., and Blyth, A.: Ice formation and development in aged, wintertime cumulus over the UK: observations and modelling, Atmos. Chem. Phys., 12, 4963–4985, https://doi.org/10.5194/acp-12-4963-2012, 2012.
DeMott, P. J., Finnegan, W. G., and Grant, L. O.: An Application of Chemical Kinetic Theory and Methodology to Characterize the Ice Nucleating Properties of Aerosols Used for Weather Modification, J. Appl. Meteorol. Clim., 22, 1190–1203, https://doi.org/10.1175/1520-0450(1983)022<1190:AAOCKT>2.0.CO;2, 1983.
Field, P. R.: Aircraft observations of ice crystal evolution in an altostratus cloud, J. Atmos. Sci., 56, 1925–1941, https://doi.org/10.1175/1520-0469(1999)056<1925:AOOICE>2.0.CO;2, 1999.
Gelaro, R., McCarty, W., Suárez, M. J., Todling, R., Molod, A., Takacs, L., Randles, C. A., Darmenov, A., Bosilovich, M. G., Reichle, R., Wargan, K., Coy, L., Cullather, R., Draper, C., Akella, S., Buchard, V., Conaty, A., da Silva, A. M., Gu, W., Kim, G.-K., Koster, R., Lucchesi, R., Merkova, D., Nielsen, J. E., Partyka, G., Pawson, S., Putman, W., Rienecker, M., Schubert, S. D., Sienkiewicz, M., and Zhao, B.: The Modern-Era Retrospective Analysis for Research and Applications, Version 2 (MERRA-2), J. Climate, 30, 5419–5454, https://doi.org/10.1175/JCLI-D-16-0758.1, 2017.
Global Modeling and Assimilation Office (GMAO): MERRA-2 tavg1_2d_adg_Nx: 2d,1-Hourly,Time-averaged,Single-Level,Assimilation,Aerosol Diagnostics (extended) V5.12.4, Greenbelt, MD, USA, Goddard Earth Sciences Data and Information Services Center (GES DISC) [data set], https://doi.org/10.5067/HM00OHQBHKTP, 2015.
Gultepe, I., Heymsfield, A., Field, P., and Axisa, D.: Ice phase precipitation, Meteorol. Mon., 58, 6.1–6.36, https://doi.org/10.1175/AMSMONOGRAPHS-D-16-0013.1, 2017.
Harvey, N. J., Hogan, R. J., and Dacre, H. F.: A method to diagnose boundary-layer type using Doppler lidar, Q. J. Roy. Meteor. Soc., 139, 1681–1693, https://doi.org/10.1002/qj.2068, 2013.
He, Q., Li, J., Zhao, T., Zhang, H., and Meng, L.: Observing a dust aerosol layer at a height of 3–4 km above the ground on the southern margin of the Tarim Basin, Atmos. Environ., 318, 120236, https://doi.org/10.1016/j.atmosenv.2023.120236, 2023.
He, Y., Liu, F., Yin, Z., Zhang, Y., Zhan, Y., and Yi, F.: Horizontally oriented ice crystals observed by the synergy of zenith-and slant-pointed polarization lidar over Wuhan (30.5° N, 114.4° E), China, J. Quant. Spectrosc. Ra., 268, 107626, https://doi.org/10.1016/j.jqsrt.2021.107626, 2021.
Heese, B., Flentje, H., Althausen, D., Ansmann, A., and Frey, S.: Ceilometer lidar comparison: backscatter coefficient retrieval and signal-to-noise ratio determination, Atmos. Meas. Tech., 3, 1763–1770, https://doi.org/10.5194/amt-3-1763-2010, 2010.
Hersbach, H., Bell, B., Berrisford, P., Hirahara, S., Horányi, A., Muñoz-Sabater, J., Nicolas, J., Peubey, C., Radu, R., and Schepers, D.: The ERA5 global reanalysis, Q. J. Roy. Meteor. Soc., 146, 1999–2049, https://doi.org/10.1002/qj.3803, 2020.
Hersbach, H., Bell, B., Berrisford, P., Biavati, G., Horányi, A., Muñoz Sabater, J., Nicolas, J., Peubey, C., Radu, R., Rozum, I., Schepers, D., Simmons, A., Soci, C., Dee, D., and Thépaut, J.-N.: ERA5 hourly data on pressure levels from 1940 to present, Copernicus Climate Change Service (C3S) Climate Data Store (CDS) [data set], https://doi.org/10.24381/cds.bd0915c6, 2023.
Heymsfield, A. J.: Production of ice in tropospheric clouds:A Review, B. Am. Meteorol. Soc., 86, 795–808, https://doi.org/10.1175/BAMS-86-6-795, 2005.
Holtslag, A. and Boville, B.: Local versus nonlocal boundary-layer diffusion in a global climate model, J. Climate, 6, 1825–1842, https://doi.org/10.1175/1520-0442(1993)006<1825:LVNBLD>2.0.CO;2, 1993.
Huang, J., Wang, T., Wang, W., Li, Z., and Yan, H.: Climate effects of dust aerosols over East Asian arid and semiarid regions, J. Geophys. Res.-Atmos., 119, 11398-11416, https://doi.org/10.1002/2014JD021796, 2014.
Jiang, P., Yuan, J., Wu, K., Wang, L., and Xia, H.: Turbulence Detection in the Atmospheric Boundary Layer using Coherent Doppler Wind Lidar and Microwave Radiometer, Atmos. Meas. Tech. Discuss. [preprint], https://doi.org/10.5194/amt-2021-288, 2021.
Kanji, Z. A., Ladino, L. A., Wex, H., Boose, Y., Burkert-Kohn, M., Cziczo, D. J., and Krämer, M.: Overview of Ice Nucleating Particles, Meteorol. Mon., 58, 1.1–1.33, https://doi.org/10.1175/AMSMONOGRAPHS-D-16-0006.1, 2017.
Klein, H., Nickovic, S., Haunold, W., Bundke, U., Nillius, B., Ebert, M., Weinbruch, S., Schuetz, L., Levin, Z., Barrie, L. A., and Bingemer, H.: Saharan dust and ice nuclei over Central Europe, Atmos. Chem. Phys., 10, 10211–10221, https://doi.org/10.5194/acp-10-10211-2010, 2010.
Lai, R., Teng, S., Yi, B., Letu, H., Min, M., Tang, S., and Liu, C.: Comparison of Cloud Properties from Himawari-8 and FengYun-4A Geostationary Satellite Radiometers with MODIS Cloud Retrievals, Remote Sens., 11, 1703, https://doi.org/10.3390/RS11141703, 2019.
Li, M., Xia, H., Su, L., Han, H., Wang, X., and Yuan, J.: The Detection of Desert Aerosol Incorporating Coherent Doppler Wind Lidar and Rayleigh-Mie-Raman Lidar, Remote Sens., 15, 5453, https://doi.org/10.3390/rs15235453, 2023.
Li, R., Dong, X., Guo, J., Fu, Y., Zhao, C., Wang, Y., and Min, Q.: The implications of dust ice nuclei effect on cloud top temperature in a complex mesoscale convective system, Sci. Rep., 7, 13826, https://doi.org/10.1038/s41598-017-12681-0, 2017.
Li, Z., Niu, F., Fan, J., Liu, Y., Rosenfeld, D., and Ding, Y.: Long-term impacts of aerosols on the vertical development of clouds and precipitation, Nat. Geosci., 4, 888–894, https://doi.org/10.1038/NGEO1313, 2011.
Liu, H., Yuan, L., Fan, C., Liu, F., Zhang, X., Zhu, X., Liu, J., Zhu, X., and Chen, W.: Performance validation on an all-fiber 1.54-µ m pulsed coherent Doppler lidar for wind-profile measurement, Opt. Eng., 59, 014109, https://doi.org/10.1117/1.OE.59.1.014109, 2020.
Liu, Z., Dong, Z., Zhang, Z., Cui, X., and Xiao, N.: Spatial and temporal variation of the near-surface wind regimes in the Taklimakan Desert, Northwest China, Theor. Appl. Climatol., 138, 433–447, https://doi.org/10.1007/s00704-019-02824-w, 2019.
Lloyd, G., Choularton, T. W., Bower, K. N., Gallagher, M. W., Connolly, P. J., Flynn, M., Farrington, R., Crosier, J., Schlenczek, O., Fugal, J., and Henneberger, J.: The origins of ice crystals measured in mixed-phase clouds at the high-alpine site Jungfraujoch, Atmos. Chem. Phys., 15, 12953–12969, https://doi.org/10.5194/acp-15-12953-2015, 2015.
Ma, Y., Gong, W., and Mao, F.: Transfer learning used to analyze the dynamic evolution of the dust aerosol, J. Quant. Spectrosc. Ra., 153, 119–130, https://doi.org/10.1016/j.jqsrt.2014.09.025, 2015.
Manninen, A. J., Marke, T., Tuononen, M., and O'Connor, E. J.: Atmospheric Boundary Layer Classification With Doppler Lidar, J. Geophys. Res.-Atmos., 123, 8172–8189, https://doi.org/10.1029/2017JD028169, 2018.
Moore, E. B. and Molinero, V.: Structural transformation in supercooled water controls the crystallization rate of ice, Nature, 479, 506–508, https://doi.org/10.1038/nature10586, 2011.
Morris, C. E., Georgakopoulos, D. G., and Sands, D. C.: Ice nucleation active bacteria and their potential role in precipitation, J. Phys. IV, 121, 87–103, https://doi.org/10.1051/jp4:2004121004, 2004.
Murray, B., O'sullivan, D., Atkinson, J., and Webb, M.: Ice nucleation by particles immersed in supercooled cloud droplets, Chem. Soc. Rev., 41, 6519–6554, https://doi.org/10.1039/c2cs35200a, 2012.
Peña, A., Gryning, S.-E., and Hahmann, A. N.: Observations of the atmospheric boundary layer height under marine upstream flow conditions at a coastal site, J. Geophys. Res.-Atmos., 118, 1924–1940, https://doi.org/10.1002/jgrd.50175, 2013.
Ramanathan, V., Crutzen, P. J., Kiehl, J., and Rosenfeld, D.: Aerosols, climate, and the hydrological cycle, Science, 294, 2119–2124, https://doi.org/10.1126/science.1064034, 2001.
Rogers, D. C. and Vali, G.: Ice crystal production by mountain surfaces, J. Appl. Meteorol. Clim., 26, 1152–1168, https://doi.org/10.1175/1520-0450(1987)026<1152:ICPBMS>2.0.CO;2, 1987.
Rosenfeld, D., Rudich, Y., and Lahav, R.: Desert dust suppressing precipitation: A possible desertification feedback loop, P. Natl. Acad. Sci. USA, 98, 5975–5980, https://doi.org/10.1073/pnas.101122798, 2001.
Rosenfeld, D., Yu, X., Liu, G., Xu, X., Zhu, Y., Yue, Z., Dai, J., Dong, Z., Dong, Y., and Peng, Y.: Glaciation temperatures of convective clouds ingesting desert dust, air pollution and smoke from forest fires, Geophys. Res. Lett., 38, https://doi.org/10.1029/2011GL049423, 2011.
Seifert, P., Ansmann, A., Mattis, I., Wandinger, U., Tesche, M., Engelmann, R., Müller, D., Pérez, C., and Haustein, K.: Saharan dust and heterogeneous ice formation: Eleven years of cloud observations at a central European EARLINET site, J. Geophys. Res.-Atmos., 115, D20201, https://doi.org/10.1029/2009JD013222, 2010.
Shuoqiu, W. and Xiaoyan, M.: Analysis of dust vertical and horizontal distribution during dust events in northwest China based on FY-4A, MODIS and CALIPSO satellite data, Acta Scientiae Circumstantiae, 40, 2892–2901, https://doi.org/10.13671/j.hjkxxb.2020.0093, 2020.
Stein, A. F., Draxler, R. R., Rolph, G. D., Stunder, B. J. B., Cohen, M. D., and Ngan, F.: NOAA's HYSPLIT Atmospheric Transport and Dispersion Modeling System, B. Am. Meteorol. Soc., 96, 2059–2077, https://doi.org/10.1175/BAMS-D-14-00110.1, 2015.
Su, L.: ice_crystal_cloud_lidar_datas, figshare [data set], https://doi.org/10.6084/m9.figshare.25432984, 2024.
Su, L., Lu, C., Yuan, J., Wang, X., He, Q., and Xia, H.: Measurement report: The promotion of the low-level jet and thermal effects on the development of the deep convective boundary layer at the southern edge of the Taklimakan Desert, Atmos. Chem. Phys., 24, 10947–10963, https://doi.org/10.5194/acp-24-10947-2024, 2024a.
Su, L., Xia, H., Yuan, J., Wang, Y., Maituerdi, A., and He, Q.: Study on Daytime Atmospheric Mixing Layer Height Based on 2-Year Coherent Doppler Wind Lidar Observations at the Southern Edge of the Taklimakan Desert, Remote Sens., 16, 3005, https://doi.org/10.3390/rs16163005, 2024b.
Sullivan, S., Voigt, A., Miltenberger, A., Rolf, C., and Krämer, M.: A Lagrangian perspective of microphysical impact on ice cloud evolution and radiative heating, J. Adv. Model. Earth Sy., 14, e2022MS003226, https://doi.org/10.1029/2022MS003226, 2022.
Sun, J. and Liu, T.: The Age of the Taklimakan Desert, Science, 312, 1621–1621, https://doi.org/10.1126/science.1124616, 2006.
Tang, D., Wei, T., Yuan, J., Xia, H., and Dou, X.: Observation of bioaerosol transport using wideband integrated bioaerosol sensor and coherent Doppler lidar, Atmos. Meas. Tech., 15, 2819–2838, https://doi.org/10.5194/amt-15-2819-2022, 2022.
Tao, W. K., Chen, J. P., Li, Z., Wang, C., and Zhang, C.: Impact of aerosols on convective clouds and precipitation, Rev. Geophys., 50, RG2001, https://doi.org/10.1029/2011RG000369, 2012.
Vali, G.: Nucleation terminology, B. Am. Meteorol. Soc., 66, 1426–1427, 1985.
Wang, L., Qiang, W., Xia, H., Wei, T., Yuan, J., and Jiang, P.: Robust Solution for Boundary Layer Height Detections with Coherent Doppler Wind Lidar, Adv. Atmos. Sci., 38, 1920–1928, https://doi.org/10.1007/s00376-021-1068-0, 2021.
Wang, L., Yuan, J., Xia, H., Zhao, L., and Wu, Y.: Marine mixed layer height detection using ship-borne coherent Doppler wind lidar based on constant turbulence threshold, Remote Sens., 14, 745, https://doi.org/10.3390/rs14030745, 2022.
Wei, T., Xia, H., Hu, J., Wang, C., Shangguan, M., Wang, L., Jia, M., and Dou, X.: Simultaneous wind and rainfall detection by power spectrum analysis using a VAD scanning coherent Doppler lidar, Opt. Express, 27, 31235–31245, https://doi.org/10.1364/OE.27.031235, 2019.
Westbrook, C. and Illingworth, A.: The formation of ice in a long-lived supercooled layer cloud, Q. J. Roy. Meteor. Soc., 139, 2209–2221, https://doi.org/10.1002/qj.2096, 2013.
Westbrook, C., Illingworth, A., O'Connor, E., and Hogan, R.: Doppler lidar measurements of oriented planar ice crystals falling from supercooled and glaciated layer clouds, Q. J. Roy. Meteor. Soc., 136, 260–276, https://doi.org/10.1002/qj.528, 2010.
Wu, C. and Yi, F.: Local ice formation via liquid water growth in slowly ascending humid aerosol/liquid water layers observed with ground-based lidars and radiosondes, J. Geophys. Res.-Atmos., 122, 4479–4493, https://doi.org/10.1002/2016JD025765, 2017.
Wu, K., Wei, T., Yuan, J., Xia, H., Huang, X., Lu, G., Zhang, Y., Liu, F., Zhu, B., and Ding, W.: Thundercloud structures detected and analyzed based on coherent Doppler wind lidar, Atmos. Meas. Tech., 16, 5811–5825, https://doi.org/10.5194/amt-16-5811-2023, 2023.
Wu, S., Song, X., Liu, B., Dai, G., Liu, J., Zhang, K., Qin, S., Hua, D., Gao, F., and Liu, L.: Mobile multi-wavelength polarization Raman lidar for water vapor, cloud and aerosol measurement, Opt. Express, 23, 33870–33892, https://doi.org/10.1364/OE.23.033870, 2015.
Yang, J., Zhang, Z., Wei, C., Lu, F., and Guo, Q.: Introducing the New Generation of Chinese Geostationary Weather Satellites, Fengyun-4, B. Am. Meteorol. Soc., 98, 1637–1658, https://doi.org/10.1175/BAMS-D-16-0065.1, 2017.
Yang, X., Shen, S., Yang, F., He, Q., Ali, M., Huo, W., and Liu, X.: Spatial and temporal variations of blowing dust events in the Taklimakan Desert, Theor. Appl. Clim., 125, 669–677, https://doi.org/10.1007/s00704-015-1537-4, 2016.
Yin, Z., Yi, F., He, Y., Liu, F., Yu, C., Zhang, Y., and Wang, W.: Asian dust impacts on heterogeneous ice formation at Wuhan based on polarization lidar measurements, Atmos. Environ., 246, 118166, https://doi.org/10.1016/j.atmosenv.2020.118166, 2021.
Yoshida, R., Okamoto, H., Hagihara, Y., and Ishimoto, H.: Global analysis of cloud phase and ice crystal orientation from Cloud-Aerosol Lidar and Infrared Pathfinder Satellite Observation (CALIPSO) data using attenuated backscattering and depolarization ratio, J. Geophys. Res., 115, D00H32, https://doi.org/10.1029/2009JD012334, 2010.
Yuan, J., Xia, H., Wei, T., Wang, L., Yue, B., and Wu, Y.: Identifying cloud, precipitation, windshear, and turbulence by deep analysis of the power spectrum of coherent Doppler wind lidar, Opt. Express, 28, 37406–37418, https://doi.org/10.1364/OE.412809, 2020.
Yuan, J., Su, L., Xia, H., Li, Y., Zhang, M., Zhen, G., and Li, J.: Microburst, windshear, gust front, and vortex detection in mega airport using a single coherent Doppler wind lidar, Remote Sens., 14, 1626, https://doi.org/10.3390/rs14071626, 2022a.
Yuan, Y., Di, H., Liu, Y., Yang, T., Li, Q., Yan, Q., Xin, W., Li, S., and Hua, D.: Detection and analysis of cloud boundary in Xi'an, China, employing 35 GHz cloud radar aided by 1064 nm lidar, Atmos. Meas. Tech., 15, 4989–5006, https://doi.org/10.5194/amt-15-4989-2022, 2022b.
Zeng, X., Tao, W., Zhang, M., Hou, A., Xie, S., Lang, S. E., Li, X., Starr, D., and Li, X.: A contribution by ice nuclei to global warming, Q. J. Roy. Meteor. Soc., 135, https://doi.org/10.1002/qj.449, 2009.
Zhang, Y., Wu, Y., and Xia, H.: Spatial resolution enhancement of coherent Doppler wind lidar using differential correlation pair technique, Opt. Lett., 46, 5550–5553, https://doi.org/10.1109/jlt.2022.3160294, 2021.