the Creative Commons Attribution 4.0 License.
the Creative Commons Attribution 4.0 License.
 | 03 Jun 2026
From real-time to long-term source apportionment of PM10 using high-time-resolution measurements of aerosol physical properties: methodology and example application at an urban background site (Aosta, Italy)
Francesca Barnaba
Luca Ferrero
Ivan K. F. Tombolato
Caterina Mapelli
Annachiara Bellini
Claudia Desandré
Tiziana Magri
Manuela Zublena
Identifying aerosol sources is essential for designing effective air quality policies. This study introduces a novel PM10 source apportionment approach – RASPBERRY (Real-time Aerosol Source apportionment using Physics-Based Experimental data and multivaRiate factoR analYsis) – based on the analysis of aerosol physical properties, namely particle size distributions in the accumulation and coarse modes (diameter in the range 0.18–18 µm) and spectrally resolved light absorption (at 7 wavelengths in the range 370–950 nm). The availability of such measurements at high temporal resolution, down to a few minutes, enables aerosol mass source apportionment from real time to long-term scales. To demonstrate the implementation of RASPBERRY, we apply the method to a 5-year hourly dataset (2020–2024) from an urban background site in the north-western Italian Alps, combining observations from a cost-effective optical particle counter (Palas Fidas 200) and an aethalometer (Magee Scientific AE33). RASPBERRY identifies six source factors contributing to PM10: traffic (9 %), biomass burning (10 %), two secondary aerosol modes (condensation, 23 %, and droplet, 16 %), desert dust (21 %), and local dust resuspension (21 %). Hourly resolved RASPBERRY estimates show strong agreement with traditional chemical source apportionment techniques when aggregated to daily resolution to match that of the chemical analyses. Further validation is provided through comparisons with ground-based remote sensing (lidar-ceilometers, sun photometers) and modelling tools (Validated ReAnalysis ensemble from the Copernicus Atmosphere Monitoring Service, CAMS). Selected real-time applications are also presented, including emergency surveillance during accidental events and the rapid identification of regional transport of secondary particles, as well as long-range transport of desert dust and Canadian wildfire smoke. The effective variance least squares (EVLS) method is additionally implemented within RASPBERRY as an enhanced variant (RASPBERRY+EVLS), enabling full propagation of uncertainties associated with both the source profiles and the measurements. Although demonstrated at a single site, RASPBERRY is readily transferable to international air quality networks engaged in aerosol mass source apportionment, as it relies on optical instruments commonly employed by regulatory authorities and environmental protection agencies. The RASPBERRY and RASPBERRY+EVLS codes and the dataset described in this paper can be freely accessed at https://doi.org/10.5281/zenodo.20174876 (Diémoz, 2026).
- Article
(10521 KB) - Full-text XML
-
Supplement
(20950 KB) - BibTeX
- EndNote


Atmospheric aerosols have drawn significant attention for their impact on climate (IPCC, 2023) and their adverse impacts on human health. In particular, particulate matter (PM) with aerodynamic diameter smaller than 10 µm (PM10) or 2.5 µm (PM2.5) has been linked to cardiovascular, respiratory, and cerebrovascular diseases, as well as cancer (Chen and Hoek, 2020; Orellano et al., 2020). Consequently, PM is recognised as a critical air pollutant (European Environment Agency, 2024), to which a large proportion of the global population remains exposed (World Health Organization, 2021; Targa et al., 2024). Under the European Green Deal's Zero Pollution Action Plan, the Council of the European Union recently adopted a revised Ambient Air Quality Directive (AAQD, 2024/2881/EC; European Commission, 2024). This directive is more closely aligned with WHO guidelines through the adoption of stricter air quality standards for key pollutants, including PM10 and PM2.5, and by introducing the monitoring of additional aerosol metrics such as black carbon (BC) content. In this context, the identification of primary and secondary aerosol sources has become even more critical for the implications for penalties imposed on Member States exceeding the thresholds, and to tailor effective air quality policies aimed at reducing morbidity and premature mortality (Guo et al., 2018; Bouscasse et al., 2022). Additionally, starting from the previous EU AAQD 2008/50/EC (European Commission, 2008, 2011), countries are allowed to exclude natural sources from PM exceedances, making it important to distinguish between anthropogenic and natural contributions. In southern Europe, for example, transported mineral dust from the Sahara Desert represents a significant portion of PM10, contributing in some cases to over 5 µg m−3 to the annual average PM10 concentration (Querol et al., 2009; Aas et al., 2012; Pey et al., 2013; Barnaba et al., 2017; Gobbi et al., 2019; Barnaba et al., 2022; Salvador et al., 2022).
The identification of PM emission sources – commonly referred to as source apportionment – is carried out either using models (source-oriented approach; Mircea et al., 2020) or through statistical analyses of multivariate observations (receptor-oriented approach; Belis et al., 2019), with positive matrix factorisation (PMF) being the most widely used method (Paatero and Tapper, 1994; Paatero et al., 2014). The receptor-oriented approach traditionally relies on offline chemical aerosol characterisation and laboratory analyses of filter samples. This method is highly effective, as documented extensively in the literature (Hopke et al., 2020), and is currently considered the “gold standard” for PM source apportionment. However, it is labor-intensive, requiring significant manual effort and costs for sampling and analysis. Furthermore, the resulting information is often limited to daily resolution, which overlooks sub-daily variations caused by emission sources and meteorological factors. Higher-resolution sampling can be achieved during short-term campaigns (Pokorná et al., 2020), but this increases analytical workloads and reduces the collected aerosol mass for the same sampling flux, necessitating more sensitive instruments to meet detection limits.
In recent years, automated instruments for online (in-field) chemical PM analyses have attracted significant interest. Instruments such as the aerosol mass spectrometer (AMS; Jimenez et al., 2003) and its more compact and simpler to operate counterpart, the aerosol chemical speciation monitor (ACSM; Ng et al., 2011b), enable real-time measurements of the chemical composition and mass contributions of non-refractory aerosols, with a focus on the organic and fine fractions (Via et al., 2023). Combined approaches that integrate online chemical analyses with aerosol optical property measurements (Valentini et al., 2020; Barreira et al., 2024; Camman et al., 2024) have been explored, e.g. within the H2020 RI-URBANS project (Petit et al., 2024), achieving comprehensive source apportionment. Despite these advances, the widespread deployment of online chemical characterisation instruments remains challenging due to their high costs, operational complexity, and the expertise required for their use. Moreover, these techniques do not currently enable the chemical characterisation of the coarse fraction (e.g., PM10), and quick and accessible tools are needed for cross-validation or as complementary strategies.
In principle, any multivariate dataset obtained from automated instruments can be used in receptor modelling (Vecchi, 2023). Particle size distributions (PSDs), for instance, can serve as alternatives or complements to chemical speciation (Vu et al., 2015; Belis et al., 2019; Hopke et al., 2022). Indeed, several studies have explored the rich information provided by PSDs (Zhou et al., 2004; Ogulei et al., 2007; Pey et al., 2009; Costabile et al., 2009; Thimmaiah et al., 2009; Dall'Osto et al., 2012; Wegner et al., 2012; Cusack et al., 2013; Wang et al., 2013; Beddows et al., 2015; Krecl et al., 2015; Masiol et al., 2017a; Beddows and Harrison, 2019; Liang et al., 2020; Rivas et al., 2020; Wu et al., 2021; Kim et al., 2023; Kalkavouras et al., 2024; Vörösmarty et al., 2024) and analysed their temporal and spatial variations (Beddows et al., 2014; Garcia-Marlès et al., 2024). Most PSD-based studies focus on the number distribution of submicron particles (typically measured using scanning mobility particle sizers) in nucleation or Aitken modes. In EU regulatory contexts, however, in which particle mass (PM10 and PM2.5) is still the primary focus, accumulation and coarse particles play the major role.
Analysis of PSD including accumulation and coarse modes (covering diameters of up to 2.5–10 µm or larger) has been explored in several studies using aerodynamic particle sizers (APSs; Zhou et al., 2004, 2005a, b; Ogulei et al., 2006b, a; Gu et al., 2011; Harrison et al., 2011; Sowlat et al., 2016; Masiol et al., 2016, 2017b; Leoni et al., 2018; Pokorná et al., 2020; Liang et al., 2021; Song et al., 2021). Optical particle counters and sizers (OPCs/OPSs) are more affordable alternatives to APSs (Mazzei et al., 2007; Yue et al., 2008; Cuccia et al., 2010; Khan et al., 2015; Sowlat et al., 2016; Hagan et al., 2019; Bihałowicz et al., 2023; Bousiotis et al., 2021; Ouaret et al., 2021; Bousiotis et al., 2023b, a; Qin et al., 2023; Kumar et al., 2024; Wang et al., 2024a). Instead of measuring the aerodynamic diameter, these instruments quantify particle numbers and sizes based on optical principles. However, converting optical diameters to aerodynamic diameters is not straightforward, as the OPC response depends on particle properties such as refractive index and morphology (Ferrero et al., 2011, 2019; Chien et al., 2016). While not critical for source apportionment purposes as in the present work, these limitations have historically hindered the use of OPCs in such analyses. Recent technological and algorithmic advances, however, have mitigated some of these issues, even leading to the certification of some OPCs as equivalent to gravimetric methods for PM mass concentration measurements (TÜV Rheinland Energie und Umwelt GmbH, 2016; Marsteen and Hak, 2021). Consequently, many environmental agencies now integrate OPCs into air quality networks, either alongside or as alternatives to traditional automated PM instruments. While OPCs are primarily used to measure PM concentrations, their potential for providing PSDs remains underutilised.
Aerosol optical properties such as light absorption coefficients – used for example to derive equivalent black carbon concentrations (eBC) – have also been employed in source apportionment studies as proxies for chemical composition (Sandradewi et al., 2008; Favez et al., 2010; Massabò et al., 2015; Bernardoni et al., 2017b; Ferrero et al., 2021; Rovira et al., 2025), sometimes in combination with other techniques (Wang et al., 2012; Cusack et al., 2013; Beddows et al., 2015; Sowlat et al., 2016; Masiol et al., 2017a; Forello et al., 2019, 2023; Davulienė et al., 2024). The extension of BC measurement requirements to sites not affiliated with the Aerosol, Clouds and Trace Gases Research Infrastructure (ACTRIS) under the new EU AAQD (2024/2881) is expected to further promote the use of optical instruments for aerosol characterisation.
With the aim of combining the strengths of the PMF approach with the high resolution and affordability of aerosol physical measurements, we present a novel source apportionment method based on aerosol physical/optical properties, named RASPBERRY (Real-time Aerosol Source apportionment using Physics-Based Experimental data and multivaRiate factoR analYsis). We then evaluate its performances at an urban background station in Italy (Aosta). This site is influenced by multiple aerosol sources, including particle advection from the Po Valley. Previous investigations (Diémoz et al., 2019a, b, 2021) have demonstrated strong correlations at this location between source apportionment results derived from chemical speciation and those based on PSDs obtained from OPCs (Palas Fidas 200). The main limitation in those studies was the inability to fully separate, in the examined size range (0.18–18 µm), the finest particle modes associated with primary combustion emissions (e.g., traffic and biomass burning) and secondary particles (e.g., sulfates) using size data from OPC alone. To overcome these limitations, the present work integrates OPC data with multiwavelength aerosol light absorption measurements from an aethalometer (Magee Scientific AE33).
Overall, this study has the following objectives:
-
Develop a simple and reproducible method for high temporal (hourly to sub-hourly) resolution PM source apportionment using widely available automated instruments and software, and provide a reproducible procedure that facilitates both the analysis of large datasets and real-time implementation.
-
Evaluate whether, and to which extent, PSDs in accumulation and coarse modes from cost-effective OPCs, routinely used by environmental and air quality agencies to estimate PM concentrations, can provide valuable information for PM10 source apportionment.
-
Apply the method over the long term and compare the results with those obtained from the more conventional chemical approach.
-
Verify its capabilities for fast response in real-time applications.
The work is organised as follows. Section 2 describes the experimental dataset and the measurement site; Sect. 3 outlines the baseline source apportionment methodologies and the original development of RASPBERRY; Sect. 4 presents the results from the new algorithm based on physical properties and the comparison with the chemical source apportionment; Sects. 5 and 6 provide the discussion and conclusions.
This section provides an overview of the measurement site (Sect. 2.1), of the automated in-situ instruments (Sect. 2.2), and of the remote sensing techniques employed to support data interpretation (Sect. 2.3). Chemical analyses conducted on the collected filters, which served as a reference for validating the new algorithm, are also described (Sect. 2.4).
2.1 Measurement site
Aosta (580 m a.s.l., 45.73° N, 7.32° E) is the capital of the Aosta Valley region in the northwestern Alps (Fig. 1a). It has a population of approximately 33 000 and lies at the bottom of a valley surrounded by mountains exceeding 3500 m a.s.l (Fig. 1b). The urban background air quality station of Aosta–Downtown, operated by the regional environmental protection agency (ARPA Valle d'Aosta), is located in a residential and commercial area near a street and an outdoor parking lot (Fig. S1 in the Supplement, point P1). Yearly mean PM10 concentrations at the site ranged between 16 and 19 µg m−3 over the 5 years spanned by this study (2020–2024), with higher values during winter months, peaking at 35 µg m−3 on a monthly basis. This seasonal variation is attributed to both increased local emissions and meteorological conditions favouring pollutant accumulation in the cold season (Agnesod et al., 1996). Previous studies (Diémoz et al., 2019a, 2020; Campanelli et al., 2021; Mazzi et al., 2025) identified traffic and residential heating as significant pollution sources in winter, along with road salting as a winter de-icing agent. Another probable local source at this urban site is a steel mill located 500 m south of the station (Fig. S1, point P2), which influences PM levels downtown (Diémoz et al., 2021). As anticipated, PM concentrations are modulated by the daily evolution of the mixing layer (Bellini et al., 2025) and, more generally, by mountain meteorological dynamics. Wintertime temperature inversions and cold-pool events reduce atmospheric mixing and up-slope and down-slope winds favour vertical exchange. Episodes of Foehn winds, i.e. adiabatically warmed lee-side downslope winds associated with orographic precipitation and rain-shadow effects, contribute to fast drop of pollutants and improved air quality. On a broader spatial scale (mesoscale), thermally driven winds transport pollutants from the Po basin to the Alps (Diémoz et al., 2019a, b; Balestrini et al., 2024) on most sunny days from spring to autumn. In fact, the Po basin is a well-documented atmospheric pollution hotspot, indeed the geographical and meteorological conditions typical of this densely populated and industrialised region in northern Italy lead to frequent exceedances of the EU daily PM limits. Increased PM concentrations of secondary particles in Aosta–Downtown were found to correlate with these transport events (Diémoz et al., 2019b). Finally, on the synoptic scale, the region is periodically affected by desert dust transport (Fasano et al., 2021), a typical feature of the Mediterranean basin (Barnaba and Gobbi, 2004).
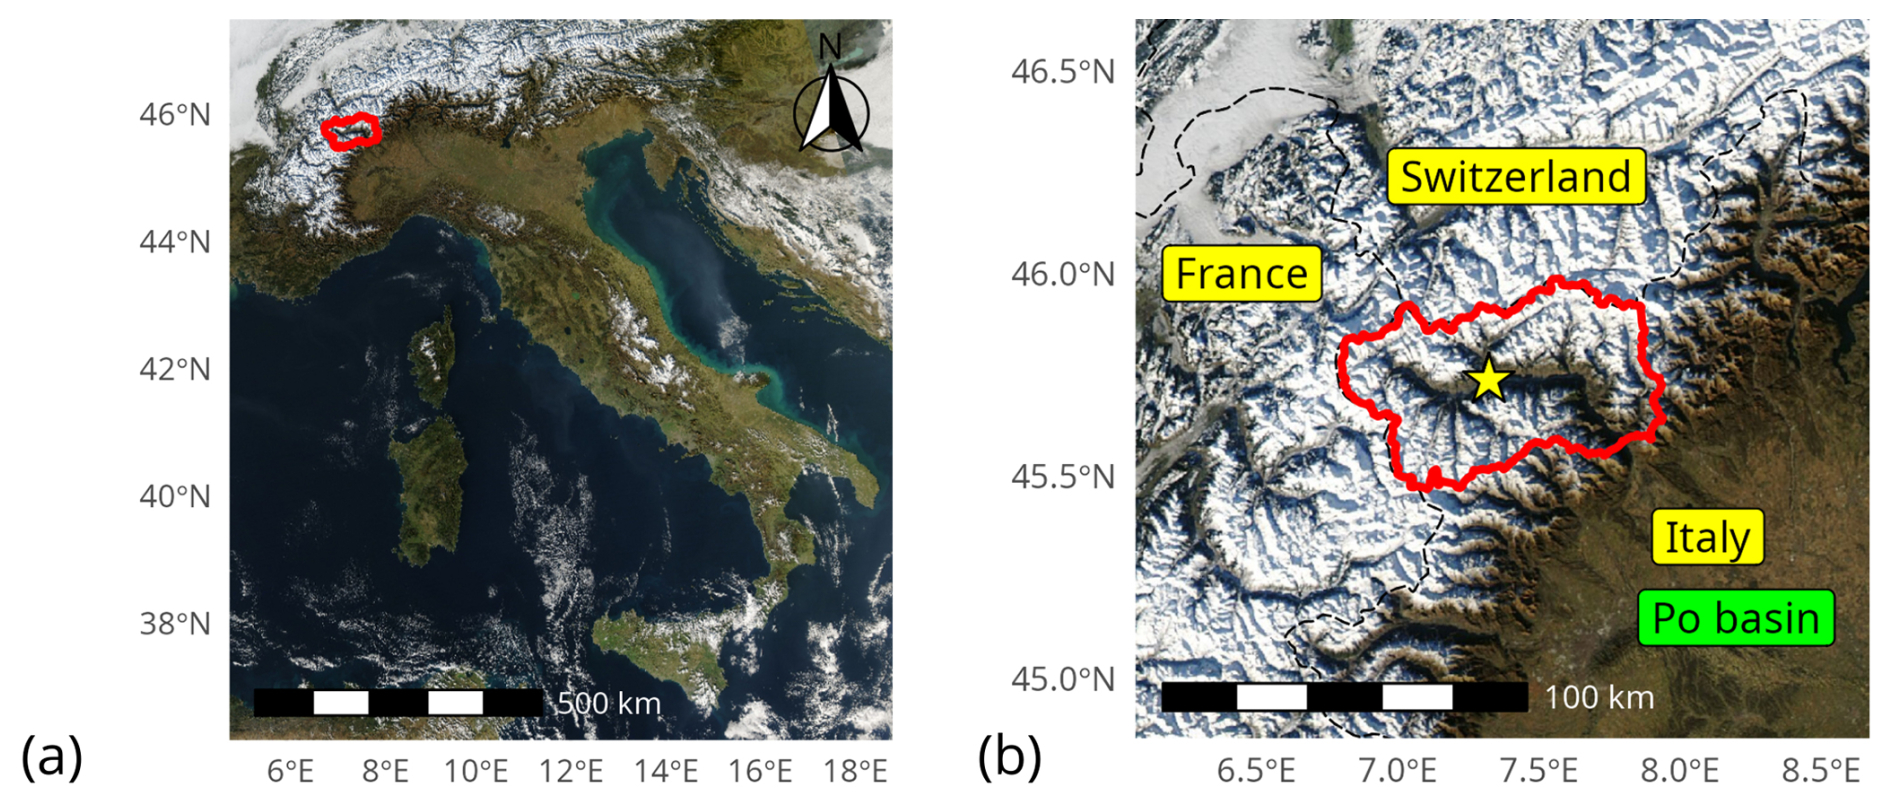
Figure 1(a) The Aosta Valley region, in the northwestern Alps, outlined in red. (b) Close-up of the Aosta Valley (red), bordered by France and Switzerland to the north and by the Piedmont region, within the Po basin in Italy, to the south. The city of Aosta is marked with a star. The background image is Italy observed from space by the MODIS Aqua radiometer on 29 December 2024 (NASA, 2024).
The nearby atmospheric and solar observatory, located at Aosta–Saint-Christophe (e.g., Fountoulakis et al., 2020) 2.6 km east of the downtown site (Fig. S1, point P3), hosts ground-based remote sensing instruments (described in Sect. 2.3). It is situated in a semi-rural residential area and is influenced by similar pollution sources as the downtown location.
2.2 Automated in-situ instruments
The primary automated instruments installed at the Aosta–Downtown station in a temperature-stabilised shelter are summarised in Table 1 and detailed in the following sections. The instruments operate at different temporal resolutions ranging from 1 min to 1 h. In this study, for homogeneity, and to enhance the signal-to-noise ratio (SNR), all measurements were averaged to a common temporal resolution of 1 h.
Table 1Measurement stations and corresponding instrumentation employed in this study. The application purpose, the period of data availability for each specific instrument and the portion employed in the present research are also listed.
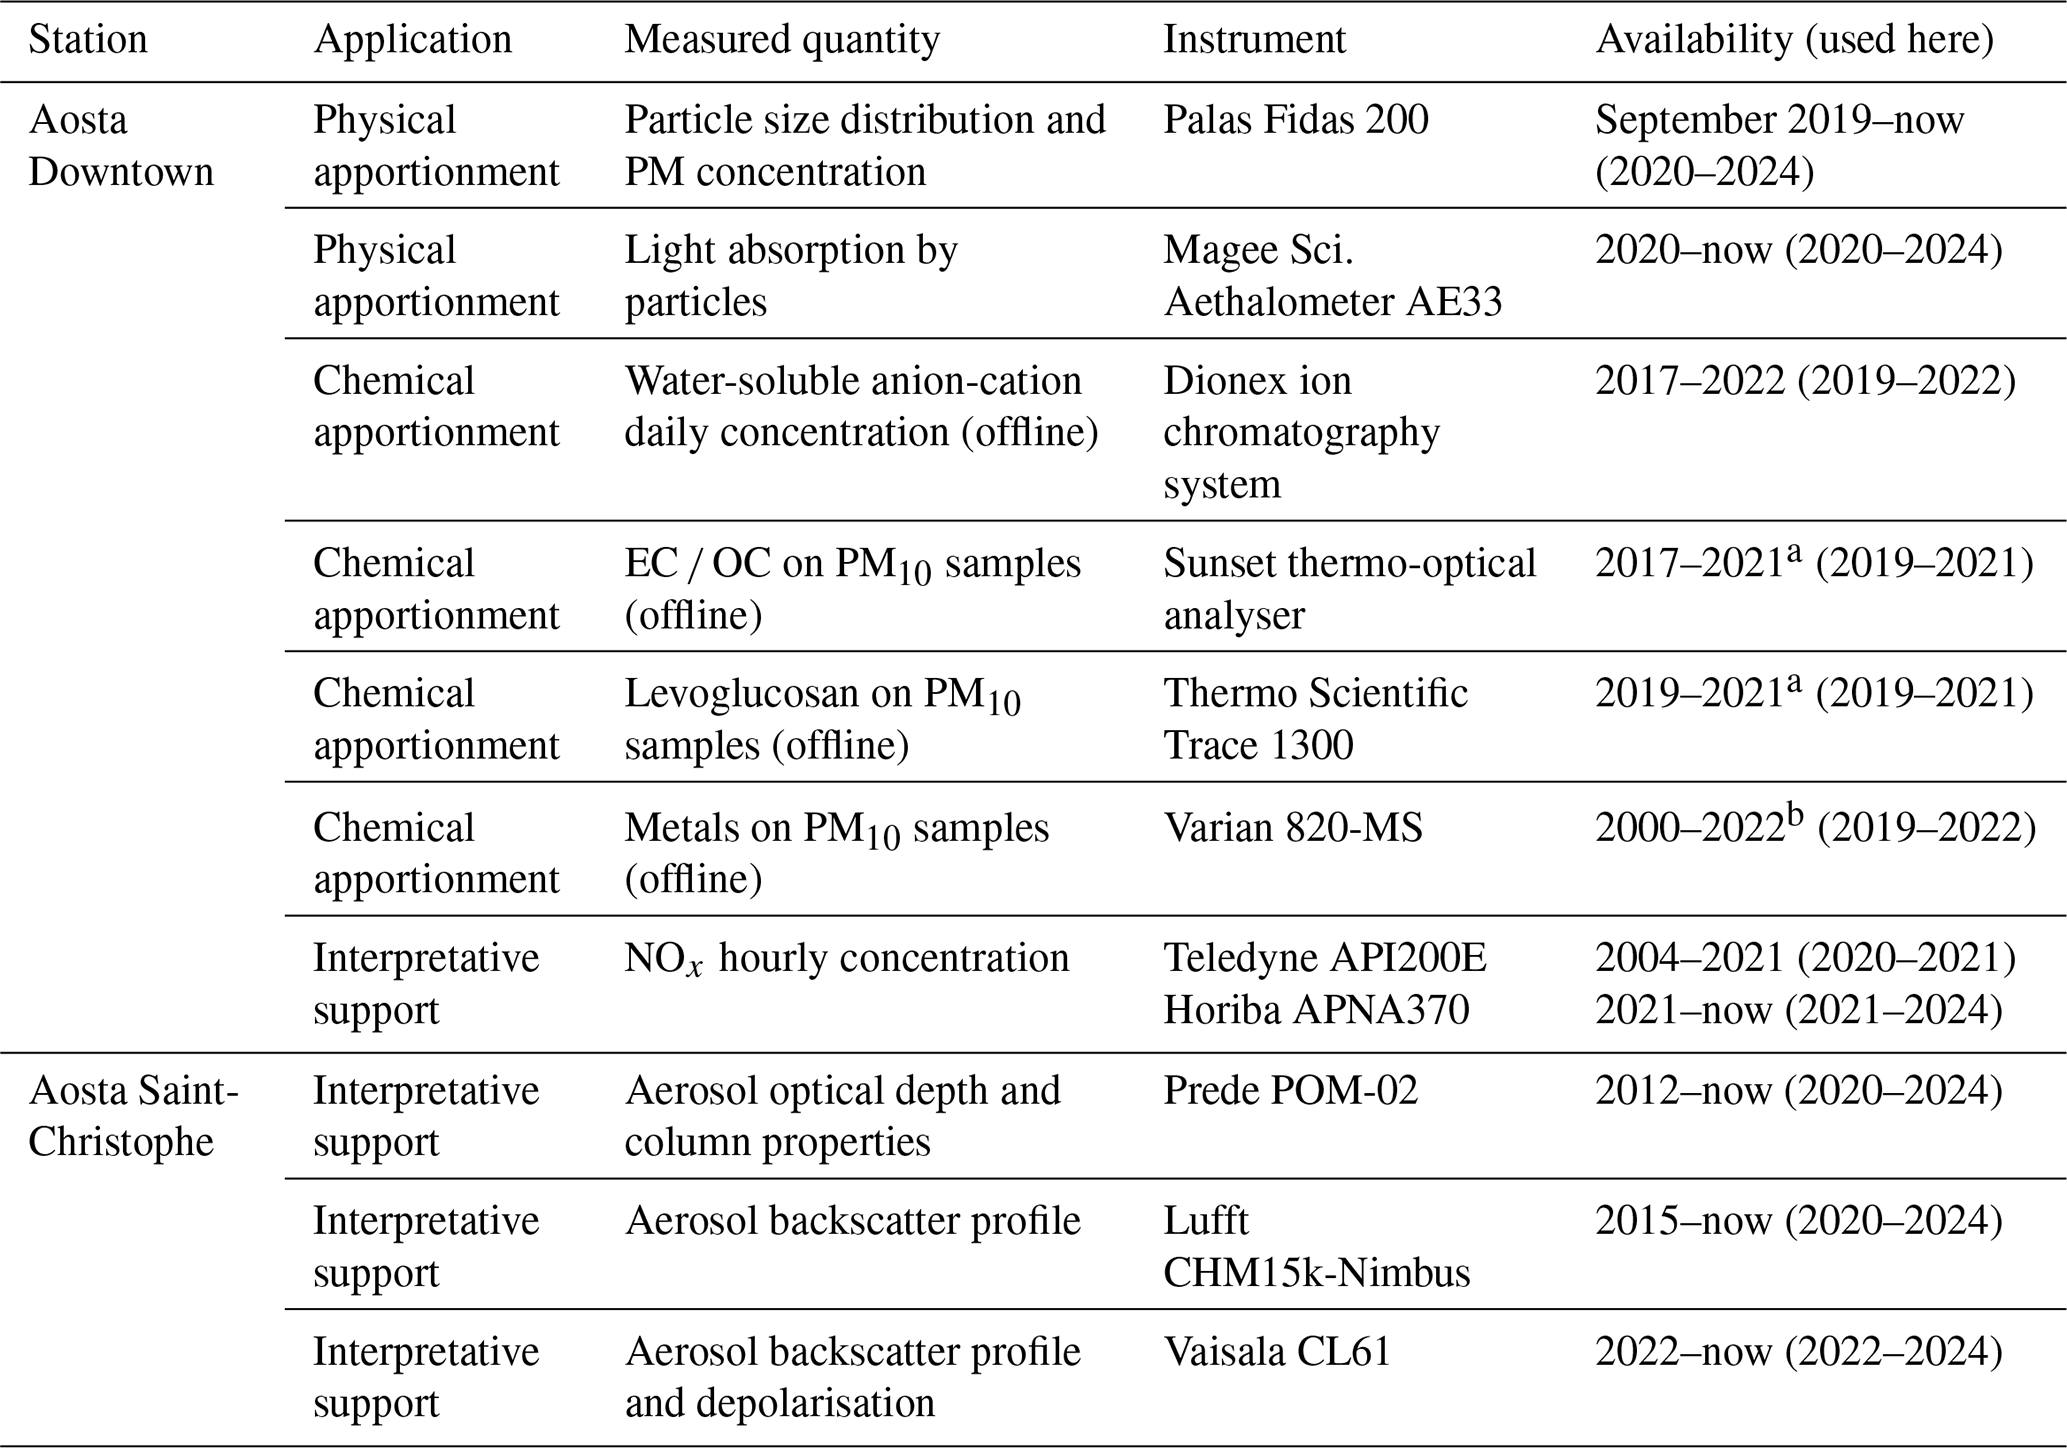
a The analysis is performed on 4 out of 10 d according to the laboratory schedule, except for 2020, when analyses are performed along with the metal and anion/cation characterisation (on 6 out of 10 d). b The analysis is performed on 6 out of 10 d according to the laboratory schedule.
2.2.1 Optical particle counter
Particle size distributions and PM concentrations are monitored by a Palas Fidas 200 (Palas GmbH, Karlsruhe, Germany), an aerosol optical spectrometer designed for regulatory purposes and referenced in various studies (Di Antonio et al., 2018; Bousiotis et al., 2021; Ibrir et al., 2021; Diez et al., 2022; Maher et al., 2022; Van Poppel et al., 2023; Amodeo, 2023, 2024; Mecca et al., 2024; Rodríguez and López-Darias, 2024; Jiang et al., 2025). The instrument determines PSDs in 63 logarithmically spaced bins across a particle diameter range of 0.18–18 µm using the principle of aerosol light scattering. The implications of the minimum diameter detected by the instrument are discussed in Sect. 5. Based on the PSDs, the Palas Fidas 200 also retrieves PM1, PM2.5, PM4, and PM10 concentrations, with equivalence certification by TÜV (TÜV Rheinland Energie und Umwelt GmbH, 2016) for PM2.5 and PM10. Details on the built-in proprietary retrieval algorithm, PM_ENVIRO_0011, can be found in the instrument manual (PALAS GmbH, 2016). Some information is reported in Sect. S2 together with a more exhaustive description of the instrument operating principles, the sampling drying system, and an approximate quantification of the measurement uncertainty.
For this study, which primarily focuses on PM10 mass concentrations, the number size distributions from the Palas Fidas 200 are further converted to volume size distributions (VSDs) under the assumption of spherical particle shape. Additionally, the resulting VSD is adjusted using the typical US-EPA efficiency curve for standardised sampling inlets as defined by EN 481 (with a 50 % cut-off at 10 µm) and detailed in the Palas Fidas 200 manual (PALAS GmbH, 2016). These conversion steps are optional, as the PMF optimisation metric (introduced in Sect. 3.1, Eq. 3) includes a normalisation based on the estimated uncertainty and is thus insensitive to the type of distribution provided. Nevertheless, we anticipate here that an important step is to select a PM10 efficiency curve that includes diameter bins larger than 10 µm in the analysis, without cutting the VSD at 10 µm, in order to improve the separation between desert dust and local resuspension contributions (Sects. 3.1 and 4.2).
2.2.2 Aethalometer
The dual-spot Aerosol Magee Scientific AE33 aethalometer (Drinovec et al., 2015) continuously determines the light absorption coefficient, babs(λ), of particles deposited on a tape, at seven wavelengths spanning from ultraviolet (UV, 370 nm) to infrared (IR, 950 nm). The spectral dependence of babs(λ) is commonly parameterised by an exponential function, defined by an Ångström Absorption Exponent (AAE; Zotter et al., 2017). The AAE facilitates the discrimination of carbonaceous aerosol species such as black/brown carbon (BC/BrC; e.g., Sandradewi et al., 2008). However, the optical properties of carbonaceous aerosols show large variability depending on particle size and chemical composition, and thus on the measurement location and period (Harrison et al., 2013; Bernardoni et al., 2017b), therefore caution is advised when using predefined (a priori) AAE values in the optical source apportionment.
The babs value at 880 or 950 nm can be converted to eBC mass concentration, expressed in ng m−3, using a mass absorption cross-section (MAC) coefficient. This conversion is actually operated by the instrument at all wavelengths, based on a set of manufacturer-defined coefficients that scale inversely with wavelength, thus accounting for the theoretical spectral dependence of black carbon absorption (Bond, 2001) and leading to the “nominal eBC” (NeBC), as defined by Savadkoohi et al. (2024). Employing NeBC(λ) “mass concentrations” calculated as such instead of babs(λ) allows for a simpler computation of spectral absorption differences. For instance, positive differences between NeBC mass concentrations in the UV and IR spectral ranges are indicators of UV-absorbing compounds, such as those associated with biomass burning. This quantity, often referred to as “Delta-C” in the scientific literature (Allen et al., 2011; Wang et al., 2011), is included as a variable in our PMF analysis (Sect. 3.1.2):
The choice of the upper limit (880 or 950 nm) is not critical. Conversely, we selected the lower limit based on both the correlation index between levoglucosan concentrations and aethalometer measurements at 370 nm, and the temporal patterns of Delta-C (further details are provided in Sect. S3). Although recent research demonstrates that using instrument- and site-specific parameters (Grange et al., 2020; Ferrero et al., 2024), or harmonised coefficients (Zanatta et al., 2016; Savadkoohi et al., 2024), leads to more accurate determination of the absorption coefficients, we employ nominal values since the source apportionment results within the examined time frame are influenced more by short-term temporal and spectral variations in aerosol light absorption than by the absolute accuracy of babs values.
In any case, it is worth highlighting that our RASPBERRY algorithm directly incorporates all 7-wavelength measurements from the aethalometer, in contrast to other studies that rely on a priori assumptions of the AAE for the apportionment of fossil fuel and biomass burning sources (e.g., Sandradewi et al., 2008; Beddows et al., 2015). Additional details regarding the aethalometer instrumental setup and maintenance can be found in Sect. S4.
2.2.3 Other in-situ surface instruments
Common EU regulated air pollutants are monitored at the Aosta–Downtown station. In this study, we employ NOx hourly concentrations determined with Teledyne API200E and Horiba APNA370 chemiluminescent analysers as proxy for combustion processes in a posteriori correlation analysis. We opted not to include gases in the source apportionment, unlike some previous studies (Zhou et al., 2005a; Ogulei et al., 2007; Thimmaiah et al., 2009; Chan et al., 2011; Sowlat et al., 2016; Masiol et al., 2017b; Rivas et al., 2020; RI-URBANS, 2024), as gases might undergo different processes compared to PM10 and their photochemical behaviour can be highly dependent on meteorological conditions. More details on this aspect are provided in Sect. S5.
2.3 Remote sensing techniques
Ground-based active and passive remote sensing instruments (Table 1) provide a three-dimensional view of the atmosphere, supporting and enhancing the interpretation of in situ surface measurements. In particular, two automated lidar-ceilometers (ALCs) – a Lufft CHM15k-Nimbus and a Vaisala CL61 –, contributing to the national ALC network ALICENET (Bellini et al., 2024, 2025), are used to determine the particle backscatter coefficient and to derive other geophysically relevant quantities, such as particle mass concentration, along the vertical profile. Additionally, particle depolarisation (δp) profiles are derived from volume linear depolarisation ratios (δv, e.g. Tesche et al., 2009) measured by the CL61 instrument and are carefully analysed to infer the shape (spherical or irregular) and, consequently, the likely source/type, of suspended particles in the atmosphere (Goi et al., 2026).
A Prede POM-02 sun photometer is also used to derive the amount and the aerosol properties integrated over the atmospheric column (Diémoz et al., 2014; Fasano et al., 2021). Its calibration and processing are centralised within the Skynet network (Campanelli et al., 2024). Specifically, direct-sun irradiance measurements are processed using the sunrad code (Estellés et al., 2012) to determine aerosol optical depth (AOD) at 11 wavelengths and the Ångström extinction exponent. Aerosol size distribution and optical properties are instead retrieved from radiance data collected in the almucantar and principal plane using the Skyrad Pack MRI version 2 software (Kudo et al., 2021). As this latter technique requires the entire almucantar/principal plane to be cloud-free and above the local mountain horizon, the present study also employs the algorithm by O'Neill et al. (2001), which is based solely on direct-sun measurements and the spectral variation of the Ångström exponent, to separately estimate the fine- and coarse-mode AOD fractions. Although this approach provides less information content, it enables a greater number of retrievals, including those performed under scattered cloud conditions and at low solar elevation. The fine/coarse AOD fraction retrievals are then used to identify the presence of transported desert dust within the atmospheric column.
2.4 Chemical analyses
PM10 samples were collected daily on filters and analysed offline at ARPA laboratory until 2022 (2021 for EC OC and levoglucosan), following methods described in previous studies (Diémoz et al., 2019b, 2021). Key details are summarised below, while additional information can be found in the cited publications. Due to limited availability of sampling equipment and laboratory resources, certain analyses were conducted every day, whereas others alternated on different days (Table 1), further highlighting the substantial effort required to maintain continuous and comprehensive chemical analyses.
PM10 collected on PTFE-coated glass fiber filters using an SM200 low-volume sequential sampler (1 m3 h−1) was analysed daily to determine concentrations of water-soluble anions and cations, i.e. Cl−, , , Na+, , K+, Mg2+, and Ca2+. These were measured using ion chromatography with a Dionex system (AQUION/UCS-1000 modules) based on the CEN/TR 16269:2011 guideline. In contrast, PM10 collected on quartz fiber filters with an MCZ Micro-PNS LVS16 low-volume sequential sampler (2.3 m3 h−1) was analysed for elemental/organic carbon (EC OC) and levoglucosan on 4 out of every 10 d on average, and for metals on the remaining 6 d. EC OC was determined using the thermo-optical transmission method in accordance with the EUSAAR-2 protocol (Cavalli et al., 2010), while levoglucosan was analysed via gas chromatography with flame ionisation detection (GC-FID) after acetonitrile-based solid-liquid extraction. Metals (Cr, Cu, Fe, Ni, Pb, Zn, As, Cd, Mo, and Co) were quantified using coupled plasma mass spectrometry after acid mineralisation of the filter in aqueous solution.
The alternating schedule prevents simultaneous analysis of all species. Therefore, two separate datasets are considered for chemical source apportionment:
-
Dataset 1 (2019–2021): includes water-soluble ions, EC OC, and levoglucosan. This dataset is useful to separate the main aerosol emission sources, allowing differentiation between liquid (fossil) fuels and solid (wood) combustion based on EC OC and levoglucosan.
-
Dataset 2 (2019–2022): includes water-soluble ions and metals. This dataset is better suited for constraining crustal elements and the steel-mill contribution, but lacks the ability to further separate combustion sources accurately.
Chemical speciation is employed here as an independent reference dataset to validate the new physical source apportionment by RASPBERRY. The potential integration of physical and chemical properties in a joint analysis is reserved for future studies.
3.1 Source apportionment methods
The source apportionment methods employed in this study are mainly based on the PMF technique, as implemented in the US Environmental Protection Agency (EPA) PMF v5.0 tool (United States Environmental Protection Agency, 2014). The EPA PMF software is well-established and widely used by numerous agencies, making it a robust starting point for developing an algorithm that can be easily replicated by other users.
PMF aims to factorise the matrix X, whose m columns represent the series of analysed species or measured variables, and the n rows correspond to the respective samples, into the product of a source contribution matrix G (n×p) and a source profile matrix F (p×m):
where p is the user-defined number of factor profiles and E represents the matrix of the residuals from the factorisation. To ensure the elements of both G and F have physical meaning, the factorisation is constrained such that all values are non-negative. In other words, PMF decomposes a multivariate dataset with a large number (m) of variables into a smaller set of p fixed profiles F, attributable to different emission sources, and their corresponding time-varying contributions G. The factorisation is performed by minimising the squared sum of the residuals E, scaled by the uncertainties u of the variables, i.e. the objective function Q:
In this study, PMF is applied twice: once using chemical data (hereafter referred to as “chemical PMF”, Sect. 3.1.1) and once using optical-dimensional data (hereafter referred to as “physical PMF”, Sect. 3.1.2, as a first step of the complete “physical source apportionment” of RASPBERRY, Sect. 3.2).
3.1.1 Configuration of the chemical PMF
The chemical PMF setup closely follows the methodology described by Diémoz et al. (2019b, 2021). An important difference in this study is the use of PM10 concentrations from the Palas Fidas 200 as the total variable for the chemical PMF, replacing the data from a previously co-located Opsis SM200 beta attenuation monitor (no longer available in the period under investigation). This change also ensures consistency with the physical PMF, based on hourly PM10 concentrations and size distributions from the same Palas Fidas 200 instrument. Analytical error fractions and detection limits reported by ARPA chemical laboratory are applied using an equation-based approach (Norris et al., 2014) to estimate total uncertainties for each sample/species combination. As outlined in Sect. 2.4, two separate chemical PMF analyses are performed due to the alternating sampling schedule and differing chemical characterisations. Further information on the configuration of the chemical PMF is reported in Sect. S6.
3.1.2 Configuration of the physical PMF
The physical PMF analysis incorporates hourly averages of volume size distributions derived from the Palas Fidas 200 and multiwavelength optical absorption data obtained from the aethalometer. For the size-related measurements, we employ 63 VSD bins with mid-point diameters (Dp) ranging from 0.2 to 17.17 µm, without any channel grouping (further details are provided in Sect. S7). For the optical absorption part, we include multiwavelength measurements from the aethalometer, specifically NeBC at six wavelengths from 470 to 950 nm and Delta-C as defined in Eq. (1). NeBC(370 nm) is excluded to avoid collinearity with Delta-C. The PM10 concentration measured by the Palas Fidas 200 is retained as the “total variable” (Norris et al., 2014).
It is worth emphasising that dimensional and optical absorption information is combined in this study within a single PMF analysis. This approach differs from the methodology presented, for example, in Beddows and Harrison (2019), where two separate PMFs are conducted sequentially – one based on chemical information and the other on size distribution data – to determine the size distributions associated with specific chemical characteristics. Our approach also differs from those of Cuccia et al. (2010) and Mazzei et al. (2007), who performed a post-hoc multi-linear regression between particle number measured in different size bins and source contributions from a prior chemical/elemental PMF. Conversely, our method integrates dimensional and light absorption properties into a unified PMF, both contributing to shaping the final solution and stabilising it by reducing rotational ambiguity in the profiles (Emami and Hopke, 2017; Paatero, 2018; Belis et al., 2019).
A critical step for achieving successful source apportionment is the definition of uncertainties to be inputted into the PMF (Forello et al., 2023). In this study, we adopt the same uncertainty framework described by Vörösmarty et al. (2024), which is often employed in PMFs based on particle size/number distributions. The measurement uncertainty for each data point is modelled as:
where Nij is the size distribution for sample i and size channel j, is the time average in channel j, and A and α are free parameters. The overall effective uncertainty is subsequently defined as:
where C3 is an additional parameter to be selected. For this study, the formulae utilise particle volume distributions (rather than number distributions, N) for the dimensional data, and NeBC mass concentrations at aethalometer wavelengths for the optical absorption data.
In previous works, the uncertainty configuration is typically addressed pragmatically through trial-and-error procedures or iterative approaches that explore combinations of parameter values to optimise a given metric (Chueinta et al., 2000; Ogulei et al., 2006b, 2007; Beddows et al., 2015). Moreover, when different quantities are combined within a single PMF analysis, their residuals must be appropriately weighted in Q (Paatero, 2018) to ensure that each quantity exerts a balanced influence on the final solution (i.e., through the total contribution of their scaled residuals to Q). Throughout this procedure, we deliberately avoided “tuning” the physical PMF results to reproduce those obtained from the chemical PMF, thereby preserving the independence of the two datasets. The full procedure is described in Sect. S7, where an objective and reproducible workflow is presented for interested readers. The final coefficients A, α, and C3 adopted for the PMF analysis are reported in Table S1. The field Extra Modelling Uncertainty of the EPA PMF was left unchanged (0 %). These values refer to the input uncertainties used in the training (PMF) phase of RASPBERRY. A more comprehensive overview of the method limitations and of the overall uncertainties associated with the retrievals is provided in Sects. 3.3 and 5.
Seasonal splitting was attempted, but without satisfactory results. This is discussed in Sect. 5 (and Sect. S8). No normalisation for the dilution effect (Dai et al., 2020) was performed a priori on the input dataset, since under many conditions the wind contributes to aerosol advection rather than dilution at the study site (Diémoz et al., 2019a). An alternative approach, based on a posteriori meteorological normalisation and applied to the source-apportioned results (e.g. Grange and Carslaw, 2019; Stirnberg et al., 2021), will be described in a forthcoming publication.
3.2 Strategy to address large datasets, and real-time implementation of physical source apportionment
At this stage, two apparently unrelated challenges emerge:
-
EPA PMF v5.0 notoriously encounters difficulties with large datasets, during both the factorisation phase and the subsequent diagnostic tests (United States Environmental Protection Agency, 2014). This is a concern for our dataset, which consists of 70 species sampled at hourly intervals over 5 years. While Hopke et al. (2023) recently proposed a solution using the multilinear engine (ME-2) combined with specific scripts, this introduces additional complexity and licencing constraints. Aggregating hourly measurements to a daily or longer timescale is an option, but it would smooth extreme values (peaks and zeros) that help reduce rotational ambiguity in the PMF and would result in the loss of sub-daily information.
-
As mentioned, a major objective of this study is to implement a real-time approach that quickly updates the source contributions as new data become available, without the need to re-run the PMF software. Moreover, we avoided solutions relying on additional proprietary software (Chen et al., 2022).
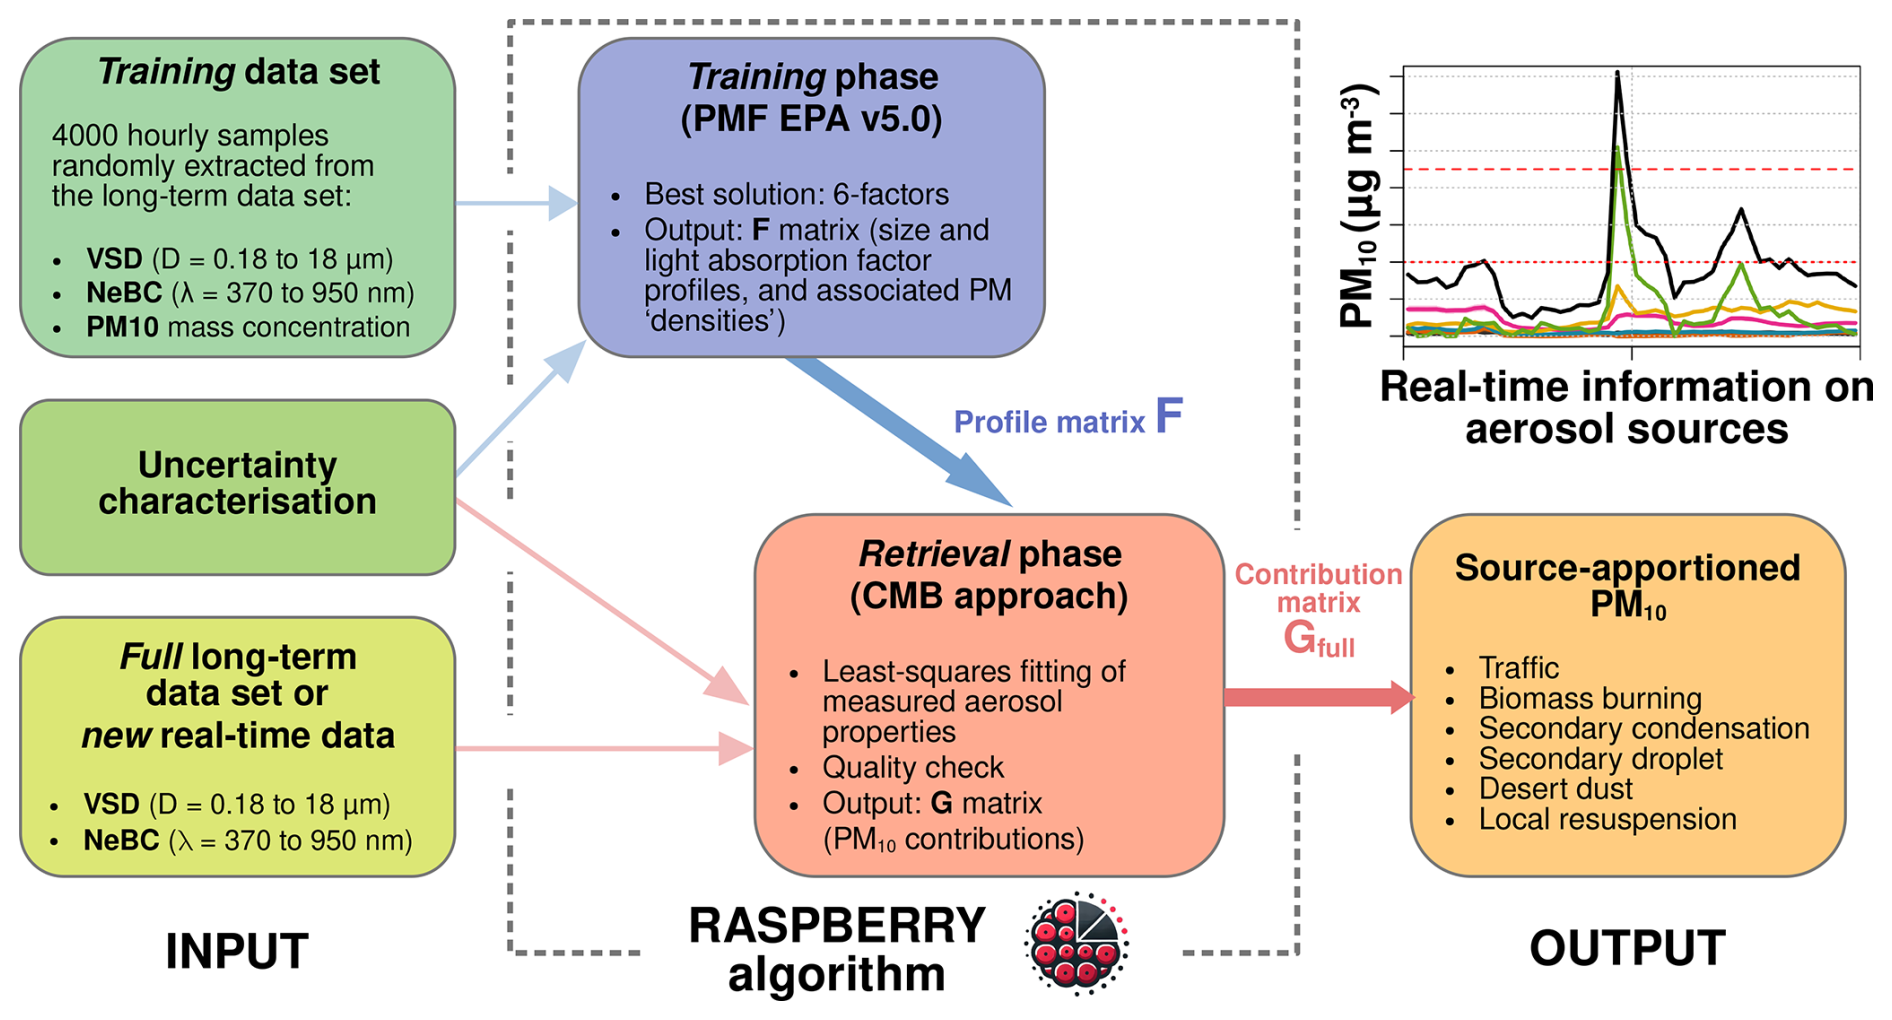
These challenges prompted the development of a simplified strategy, outlined in Fig. 2, and consisting of the following steps:
- a.
A random subset of the whole data series is selected, which includes a few thousands of samples (rows of the X matrix spanning all species). To maintain annual balance, equal sample numbers (1000) are taken from each season, resulting in 4000 samples (i.e. about 10 % of all available measurements in the Aosta–Downtown dataset). Owing to the continuous 24 h measurement coverage in the original dataset, the random sampling procedure also results in a nearly homogeneous distribution of observations throughout the day. For example, when considering four day-quarter intervals (0–6, 6–12, 12–18, and 18–24 h), the maximum deviation from a uniform distribution is approximately 3 %. This random sampling enables quicker PMF execution while preserving key features, such as peaks and zeros, in the original series without averaging. Dall'Osto et al. (2012) followed a similar approach for the same reasons.
- b.
The PMF is performed with this random subset as input, followed by diagnostic tests. This phase can be thought of as “training” the algorithm. Stability of the solution has been ensured by manually repeating the factorisation with different random subsets.
- c.
We adopt a principle similar to that of the chemical mass balance approach (CMB; Watson et al., 1991; Coulter, 2004), using the factor profiles (F matrix) previously derived during the “training phase”, together with the same uncertainty estimates employed in the PMF analysis. Such an extrapolation allows us to estimate source contributions for both the samples excluded at point “a” (for long-term dataset analyses) and new measurements (e.g., for real-time implementation), assuming the profiles remain stable over time. A similar approach was previously followed by Ng et al. (2011a).
This CMB technique retrieves the source contribution matrix (G) by minimising the same Q metric used by the PMF (Eqs. 2–3), which was employed to calculate both the profile and contribution matrices with the additional positivity constraint. This simplified method corresponds to solving a weighted least square problem, i.e. every row i of G satisfies the equation (e.g., Aster et al., 2019):
Here, Wi is a diagonal matrix containing the inverse of the uncertainties given as input to the PMF for sample i and all species j, , and ()+ denotes the Moore-Penrose inverse matrix. For this calculation, the column of F relative to the total variable () is excluded, as well as the total variable PM10 from X, leaving optical absorption data (NeBC concentrations and Delta-C) and volume size distributions as predictors. The profile matrix (F) is derived from the PMF output tagged as “concentration of species”, yielding unitless retrieved contributions with an average of 1. To estimate the contribution to PM10, the normalised time series are scaled by the average PM10 carried by each factor (). This calculation can be implemented in any scientific programming environment using pseudo-inverse or singular value decomposition. In this study, we used basic matrix operations in the R environment (R Core Team, 2022). Verification confirmed that, for samples included in the training dataset, the results correspond with the PMF output (Fig. S7). The whole approach is referred to as RASPBERRY.
As an additional remark, we emphasise that, in contrast to the nonlinear minimisation approach with positivity constraints used by Beddows and Harrison (2019), our simpler weighted least squares method facilitates the identification of cases where PMF profiles do not adequately represent the new measurements. Indeed, negative retrieval values may indicate that specific measurements exhibit characteristics absent from the training dataset, thus providing useful information on the retrieval quality to the user. In the dataset under investigation, this mostly occurs with coarse particles, with approximately 1.5 % exhibiting retrieved PM10 contributions below −0.5 µg m−3.
3.3 Retrieval uncertainty and “RASPBERRY+EVLS”
Conventional PMF analysis as implemented in EPA PMF software yields uncertainties associated with the profile matrix, F, but not with the contribution matrix, G (Paatero et al., 2014). To our knowledge, the evaluation of uncertainties in source contributions remains a debated topic in the scientific literature, and no methodology has yet been universally accepted and implemented by the community. As a direct consequence, RASPBERRY does not directly provide uncertainty estimates for the source-apportioned PM10 retrievals. Based on common practice and the state-of-the-art literature, however, we propose two approaches to address this limitation.
A first and simpler method consists of propagating the uncertainty from the PMF-derived profiles based on the range of the DISP test, i.e. the range associated with a maximum increase of 4 in the objective function Q (Eq. 3). This range, often referred to as the “interval ratio” in the literature (Brown et al., 2015), is commonly used as a proxy for rotational uncertainty in PMF profiles (e.g., Paatero et al., 2014; Masiol et al., 2017a). Within this framework, the same relative interval ratio associated to the PM10 component of a given profile is also assigned to the contributions of the corresponding factor. For the sake of simplicity, this method is selected to provide an estimate of the uncertainty range in the figures presented in the main text.
The second, more comprehensive method allows not only the propagation of uncertainties associated with the factor profiles but also with the uncertainties in the PMF input species concentrations. This approach is based on the effective variance least squares (EVLS) technique (Watson et al., 1984; Chen et al., 2025), which is also currently implemented in the EPA CMB model (Coulter, 2004). Derived from maximum likelihood theory and successfully validated against the Monte Carlo method (Watson et al., 1984), this technique minimises, through an iterative scheme, a modified Q′ metric (slightly different from that used in PMF) that accounts for uncertainties in both receptor concentrations and source profiles. In the present study, following the approach of Chen et al. (2025), the profile uncertainties are derived from the displacement intervals of all species in a profile. Individual uncertainties in the estimated source contributions for each retrieval are subsequently derived by propagation through the covariance matrix of the inversion. We refer to this approach as “RASPBERRY+EVLS”. The interested reader will find further methodological details and a comparison with RASPBERRY in Sect. S9.
The results of the chemical PMF are briefly presented in Sect. 4.1, followed by a detailed analysis of the overall RASPBERRY results in Sect. 4.2, where we focus on the identified source profiles and their average contributions to PM10. Section 4.3 compares the novel methodology with the traditional source apportionment based on chemical characterisation. Finally, Sect. 4.4 showcases the performances of the method during specific events, with a particular focus on the real-time algorithm capabilities.
4.1 Chemical PMF
For both chemical PMFs, using datasets 1 and 2 (Sect. 2.4), six-factor solutions were selected as optimal, based on the criteria of source separation and physical interpretability. Their profiles and additional details on this selection process, along with the associated quality metrics, are provided in Sect. S10, following current reporting recommendations (Paatero et al., 2014; Brown et al., 2015; Belis et al., 2019). These findings have already been discussed in previous studies (Diémoz et al., 2019b, 2021), to which interested readers are referred. Therefore, only a brief summary is provided below.
From dataset 1 (anion/cation, EC OC, and levoglucosan), the following factors are identified:
-
Vehicle traffic emissions, characterised by high EC concentrations and the absence of levoglucosan, with maximum contributions in winter and moderate levels throughout the rest of the year. This profile also contains some Ca2+ and Mg2+, likely indicating non-exhaust particles from road dust resuspension associated with exhaust emissions (in-depth discussion in Sect. S10).
-
Residential biomass burning, marked by elevated concentrations of levoglucosan, K+ and EC, and maximum contributions occurring in winter.
-
Sulfate-rich factor, dominated by high concentrations of sulfate and ammonium, with relatively stable contributions throughout the year.
-
Nitrate-rich factor, characterised by high concentrations of nitrate and ammonium, with maximum contributions observed from autumn to spring.
-
Winter salting, identified by high concentrations of Na+ and Cl− and distinct contribution spikes in winter.
-
Crustal source, associated with elevated concentrations of Ca2+ and Mg2+, along with OC, and displaying stable contributions throughout the year.
In previous studies (Diémoz et al., 2019a, b, 2021), factors 3 and 4 rich in secondary compounds were primarily attributed to the advection of polluted air masses being transported from the Po basin to the Alps. Secondary formation at a more local level (e.g., Yue et al., 2008), potentially facilitated by pre-existing advected particles (Masiol et al., 2017a), cannot be ruled out and will be the focus of future research.
PMF analysis using dataset 2 produces similar results. However, in the absence of levoglucosan, the two combustion sources (vehicle traffic emissions and residential biomass burning) combine into a single factor, strongly correlating with NOx. Additionally, a distinct factor associated with the steel mill can be identified. This “industrial” factor is characterised by elevated concentrations of Cr, Ni, and Co, and contributions marked by peaks throughout the year. However, it has a marginal average contribution to PM10 at Aosta–Downtown and will not be considered in further analyses. With respect to dataset 2, only the two most important factors containing coarse particles (crustal and winter salting) will be used in the subsequent sections.
4.2 Physical PMF and RASPBERRY source apportionment
Physical PMF solutions with up to seven factors were explored, with the six-factor solution deemed the most suitable (an in-depth examination of the selection criteria is provided in Sect. S11). Based on both their profiles and the temporal patterns of their PM10 contributions, the six factors are assigned to the following aerosol sources/types: traffic emissions, residential biomass burning, secondary aerosol in condensation and droplet modes, desert dust, and local dust resuspension. They are named according to sources considered most representative or significant for each factor, while recognising that other primary and secondary processes may also lead to formation of particles with similar dimensional/optical properties. Indeed, every PMF represents a simplification of actual aerosol processes and six factors cannot fully describe the complexity of real-world emission sources.
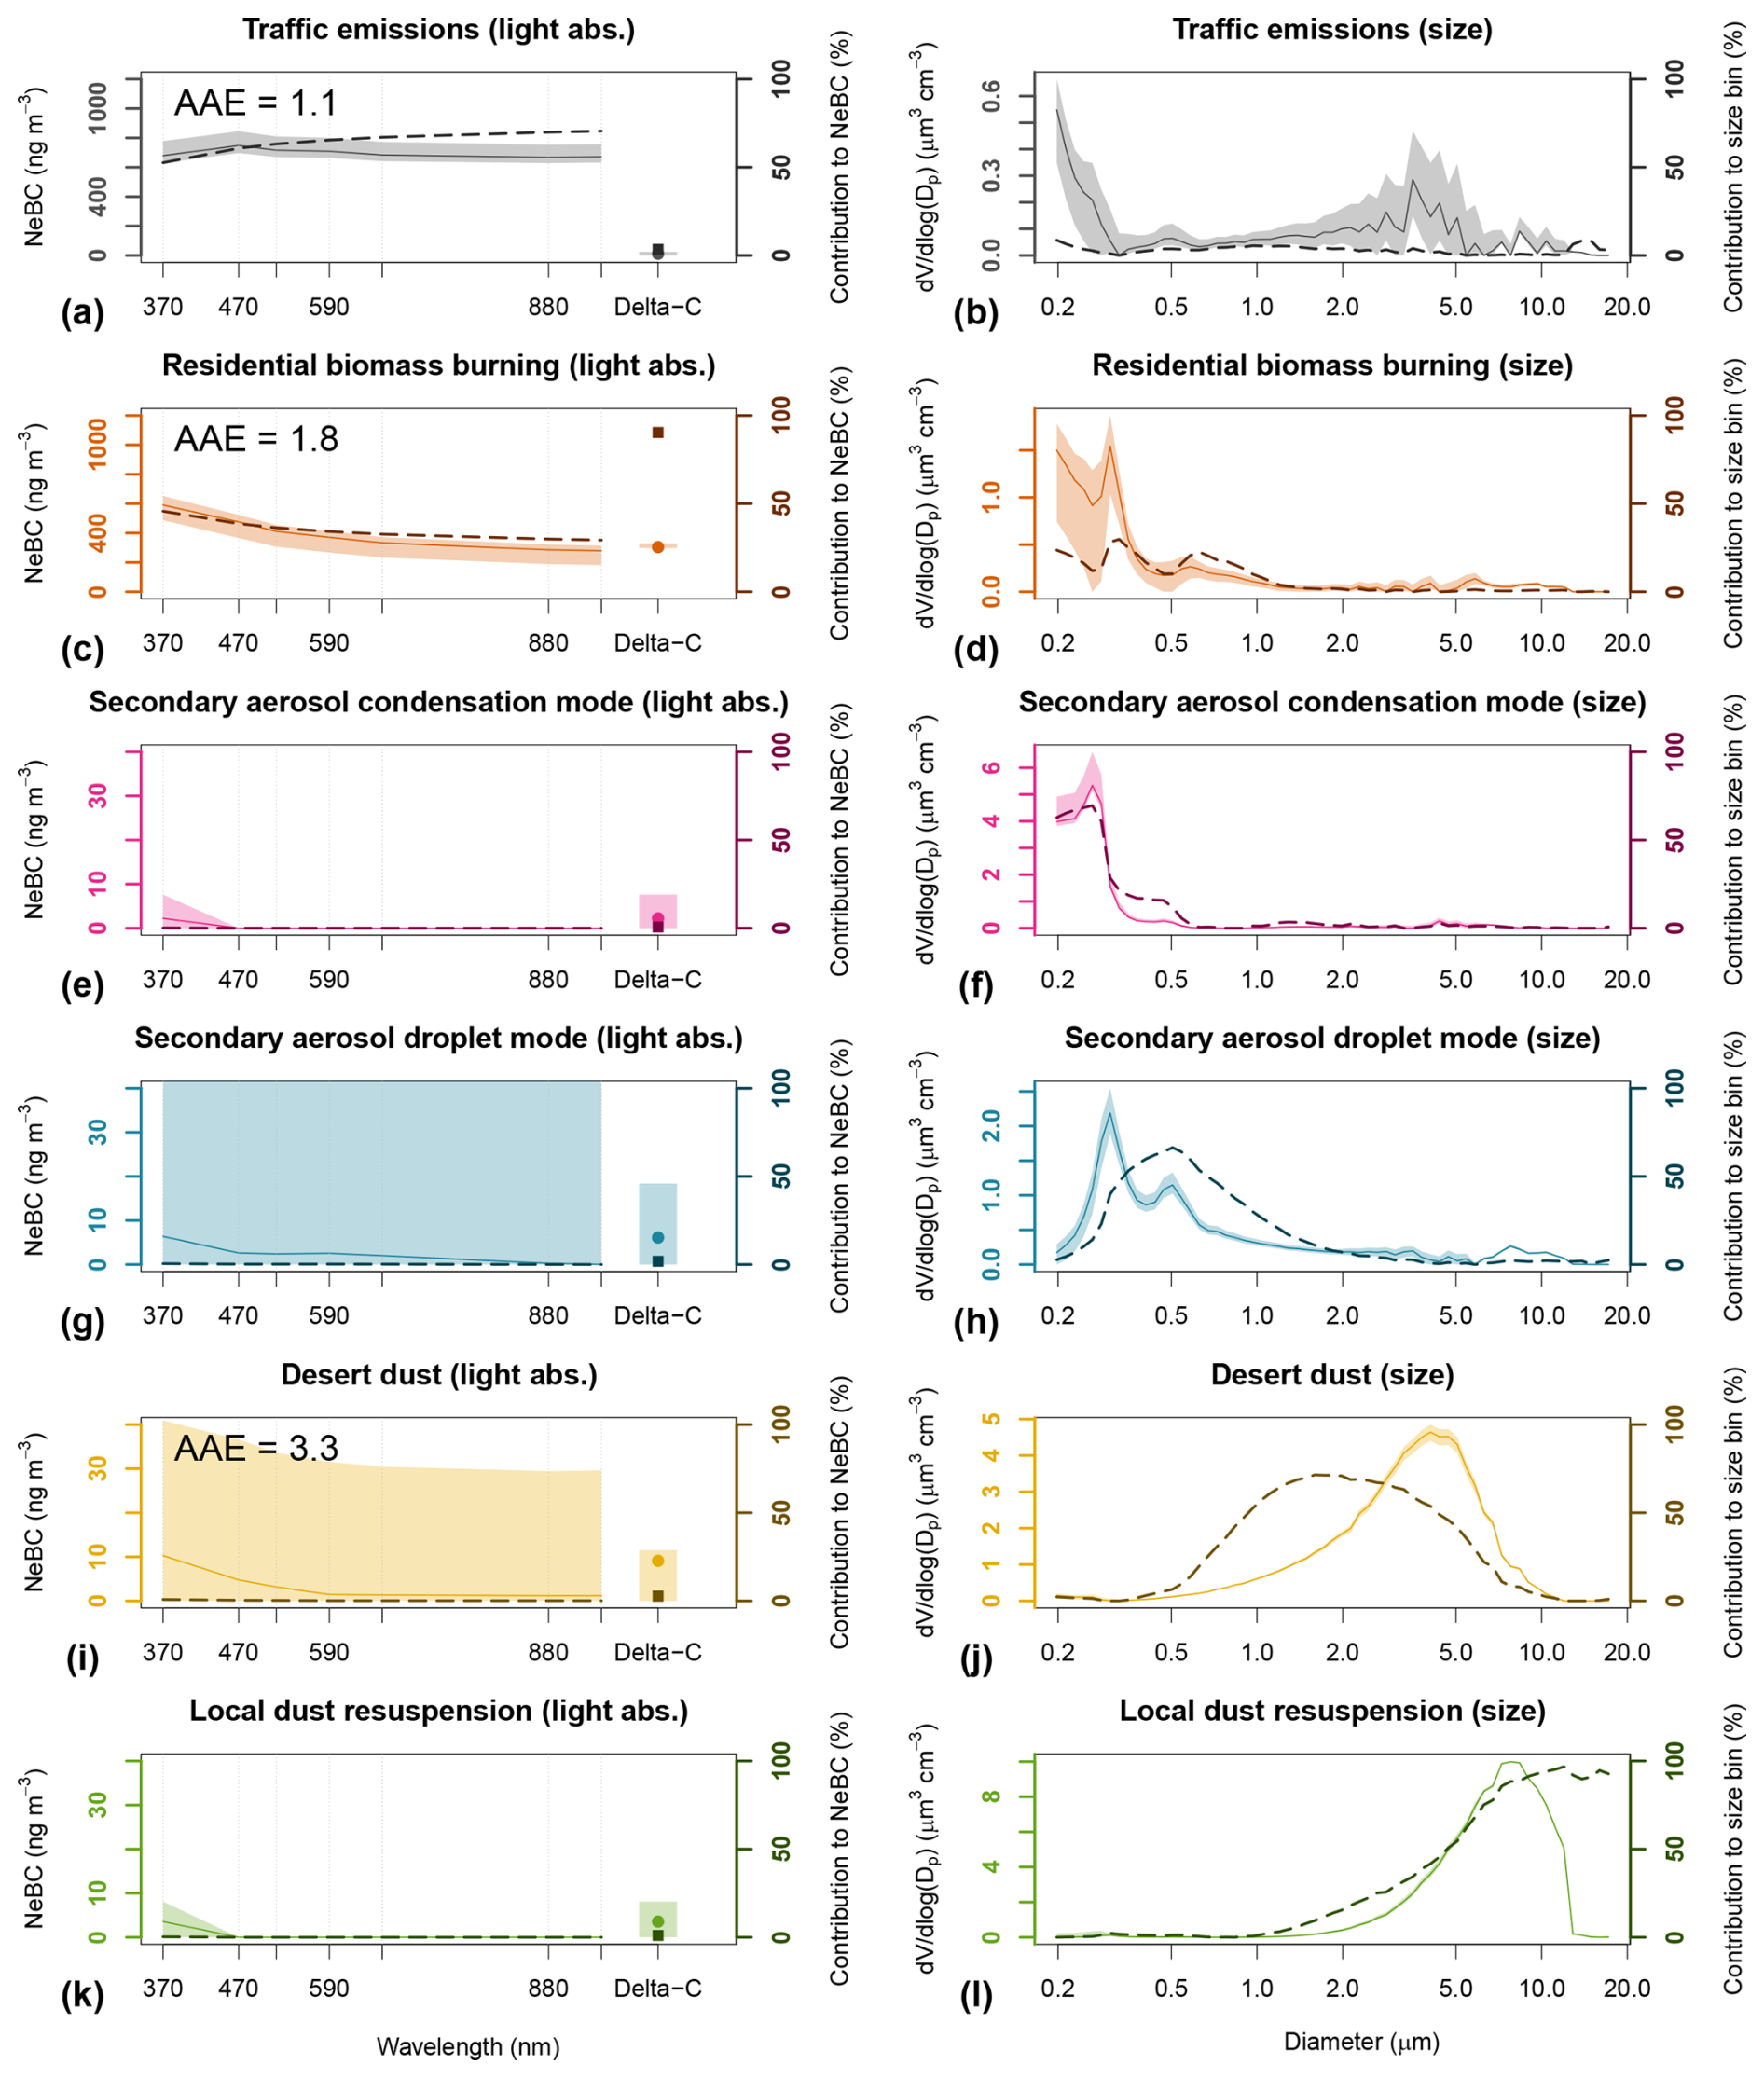
Figure 3Light absorption expressed as NeBC mass concentration (left column) and volume size distribution (right column, logarithmic x-axis) profiles of the six factors identified by the physical PMF. The continuous and light-coloured lines (left y-axis scale, also marked with brighter colours) represent the absolute contribution of each factor to the VSD/NeBC (average over the period 2020–2024), as obtained from the constrained run, together with an estimate of its uncertainty from the DISP test (coloured area). Notice that the ranges of the six plots differ for better visualisation. The dashed and darker lines (right y-axis scale, also marked with darker colours) indicate the percentage contribution of each factor to every size/spectral channel. Note for the optical absorption part: the dotted vertical lines indicate the aethalometer wavelengths. Delta-C is represented both in absolute (circular marker and coloured area) and percentage (square and darker marker) terms, in the right part of the plot. Also shown are the Ångström absorption exponents (AAE) for three selected factors, calculated a-posteriori from the PMF results.
Figure 3 presents these factor profiles for light absorption and volume size distribution. The continuous and light-coloured lines (left y-axis scale, also marked with brighter colours) represent the absolute contributions to the VSD/NeBC (average over the period 2020–2024), as obtained from the constrained run, together with an estimate of their uncertainty derived from the range of the DISP test (coloured area; Sect. 3.3). The dashed and darker lines (right y-axis scale, also marked with darker colours) indicate the percentage contribution of each factor to every size/spectral channel. NeBC(370 nm), not directly included in the PMF, was reconstructed as sum of NeBC(880 nm) and Delta-C.
With the chosen configuration, the PM10 concentration of the subset given as input to the PMF is reconstructed with high accuracy by the factorisation (R2: 0.97, intercept: −0.99 µg m−3, slope: 1.07). All optical absorption and dimensional PMF “species” show good reconstructions (R2>0.9), with the exception of the six largest size fractions, with R2∼0.6. It should be emphasised that this level of agreement, even surpassing that observed in the chemical PMF, is partly attributable to the total variable, PM10, and volume distributions being originally derived from one another by the Palas algorithm (PM_ENVIRO_0011; in-depth discussion in Sect. 5).
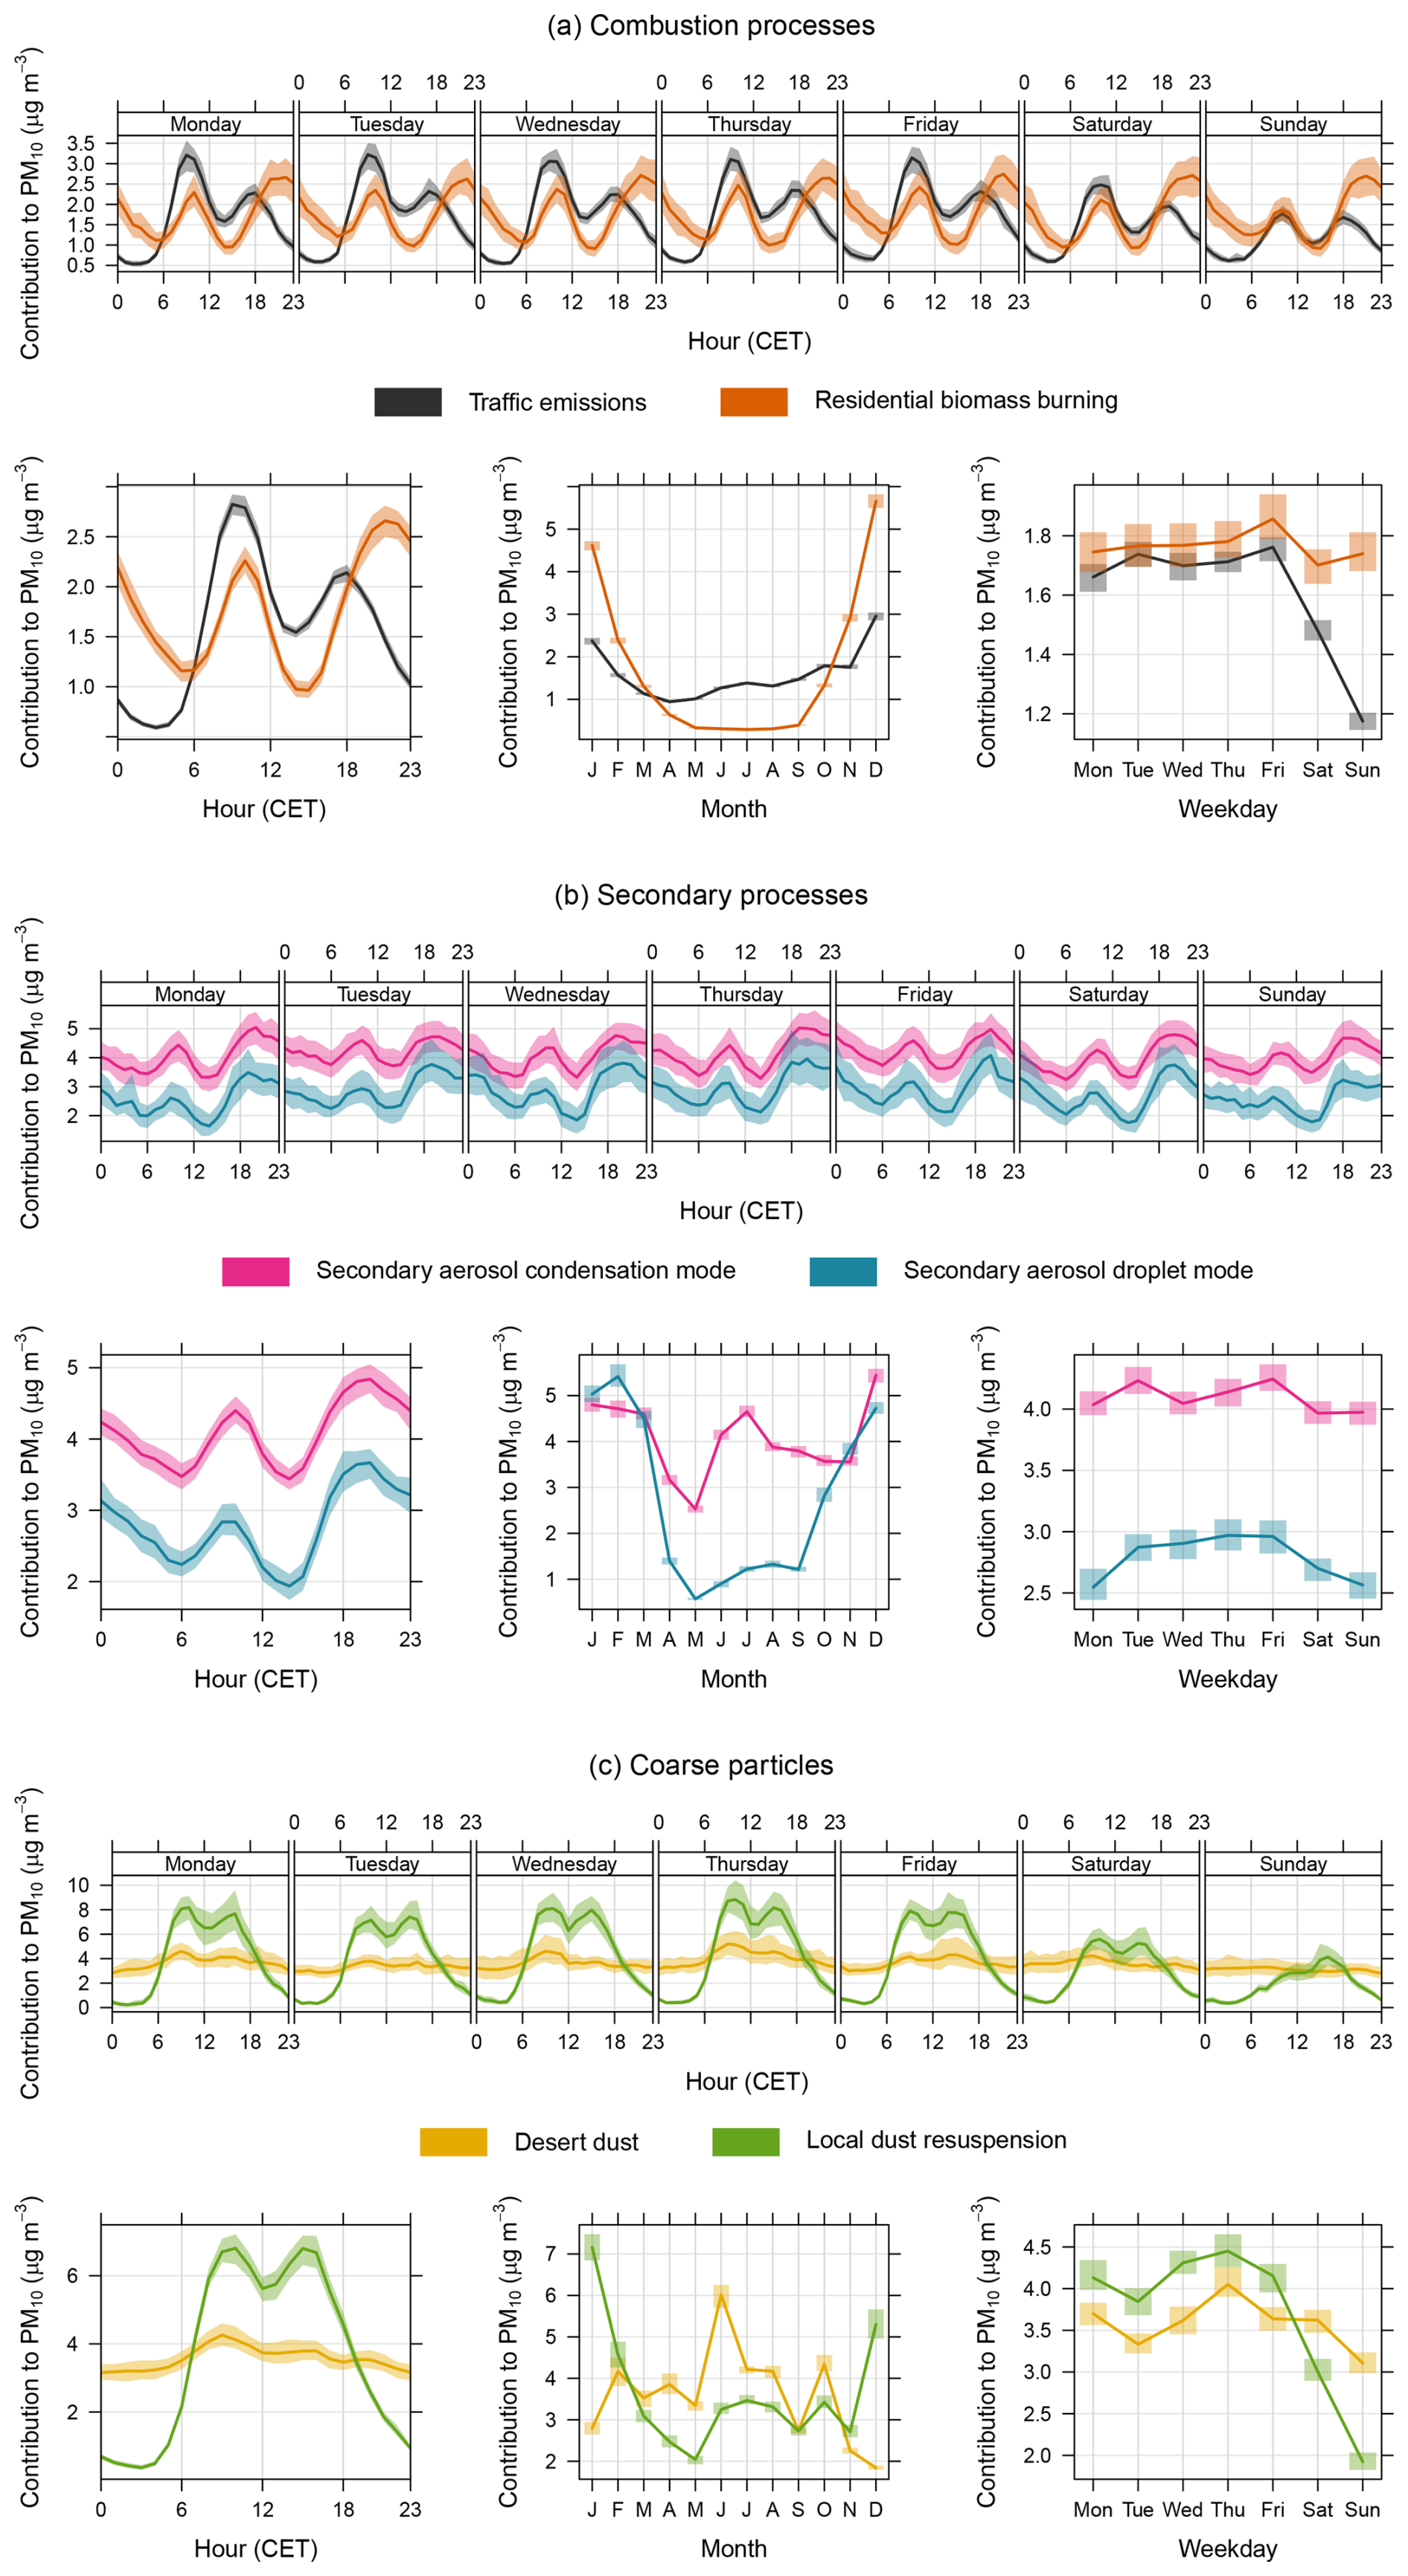
Figure 4Average contributions to PM10 at different temporal scales for factors associated with (a) combustion processes, (b) secondary processes, (c) coarse particles. The bold lines represent the mean contributions, while the coloured areas denote the 95 % confidence interval around the mean.
The contribution time series of each factor to PM10 over the entire 2020–2024 period are obtained by applying Eq. (6) to the whole dataset (a visual example of the procedure is presented in Fig. S8). The hourly absolute PM10 contributions are shown in Fig. S9. Figure 4 (together with Figs. S14–S19) displays their average at different temporal scales, the bold lines representing the mean contributions and the coloured areas denoting the 95 % confidence interval around the mean. Average relative (percentage) contributions, discussed later (Sect. 4.3), are presented in Figs. S13 and S20–S25.
The comparison between the sum of all factor contributions (reconstructed PM10) and the original PM10 measurements from the Palas Fidas 200 (Fig. 5, including nearly 40 000 samples) exhibits similarly robust statistics as found for the training subsample (R2: 0.97, intercept: −0.85 µg m−3, slope: 1.06). For instance, only 5.6 % of the reconstructed PM10 data exhibit discrepancies with respect to measurements exceeding 5 µg m−3, and less than 1 % exceeding 10 µg m−3.
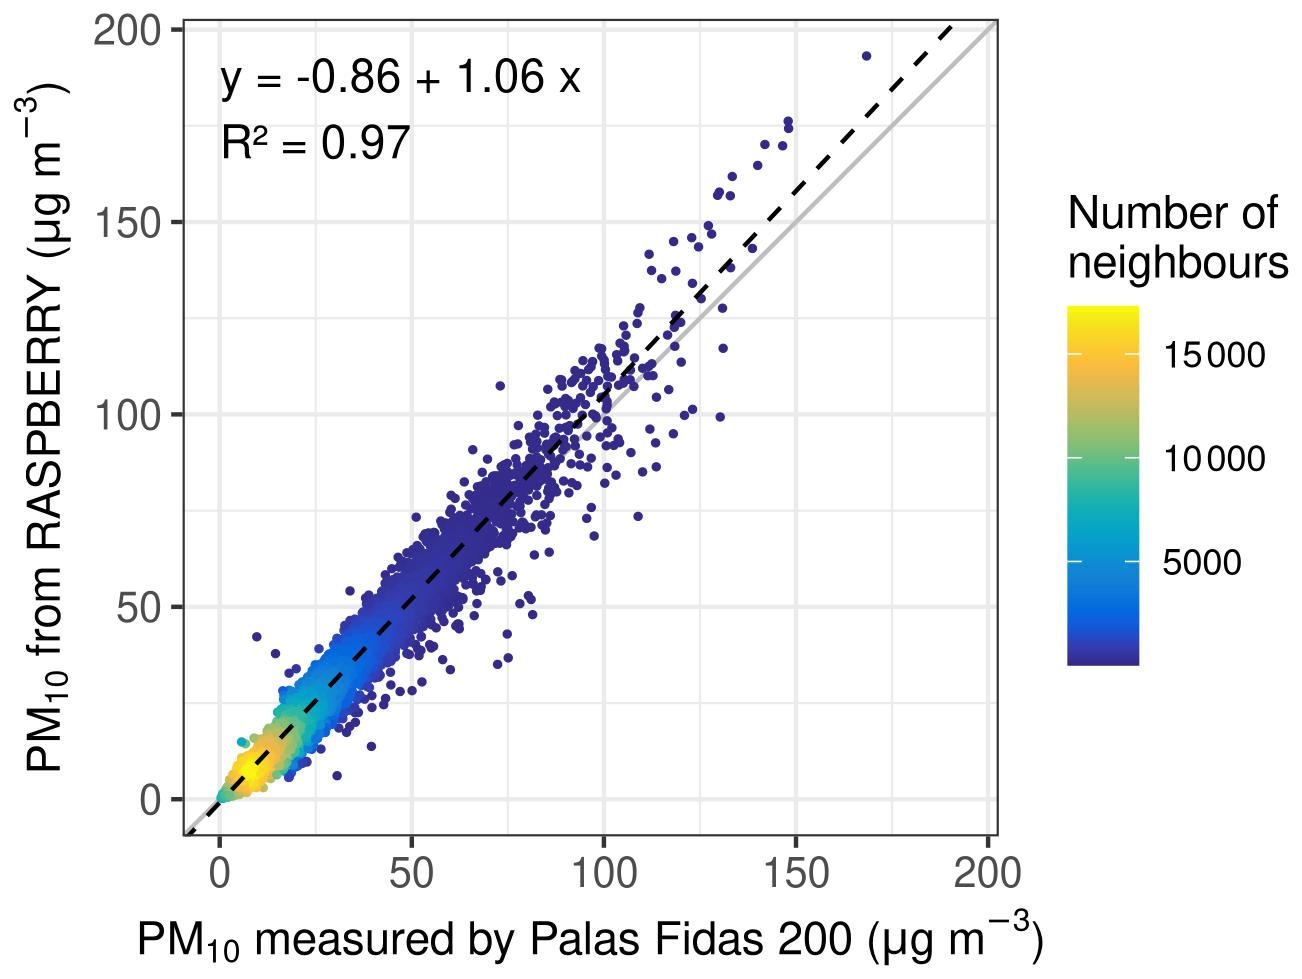
Figure 5Comparison between measured PM10 and PM10 reconstructed by RASPBERRY, including nearly 40 000 samples. The colour scale represents the density of the points. The regression statistics are reported in the plot.
The ratio between the PM mass associated with each factor and the corresponding particle volume concentration represents the mean apparent mass density linked to that factor. These values are reported in Table S2. While most of them are of the same order of magnitude as the expected bulk aerosol density of ∼ 1–2 g cm−3 (Hand and Kreidenweis, 2002; Pitz et al., 2003; Geller et al., 2006; Hu et al., 2012), they systematically increase towards the finest modes. This trend suggests that the OPC compensates for unmeasured particles with size below its sensitivity range. Particles emitted by traffic are assigned the highest density. Based on the apparent density concept, PM concentrations for size fractions other than PM10 can be readily estimated using the same extrapolation algorithm with truncated size distributions (Fig. S10).
Finally, by taking advantage of the hourly resolution obtained with RASPBERRY, factor contributions can be correlated with wind measurements and other meteorological variables on an hourly timescale. The results, presented in Sect. S13, support the source attribution discussed above.
4.2.1 Factors related to combustion processes
The first two factors are assigned to road traffic and residential biomass burning emissions, respectively. Indeed, they both exhibit strong light absorption in their profiles (Fig. 3a and c), with NeBC contributions significantly different from zero as evident from the displacement interval of the perturbed variables (constrained DISP test, coloured areas). Traffic emissions (Fig. 3a) show an average NeBC mass concentration of approximately 700 ng m−3 and a Delta-C of zero, indicating small spectral variation from IR to UV wavelengths, as expected from BC-dominated particles. This factor accounts for about half of the total NeBC at 370 nm and even more at longer wavelengths. Biomass burning (Fig. 3c) has a slightly lower contribution to NeBC (400–600 ng m−3) and a Delta-C accounting for nearly 100 % of its total value, denoting increased absorption in UV wavelengths due to light-absorbing OC (BrC). Ex-post AAEs calculated using absorption coefficients at all wavelengths are 1.1 for road traffic and 1.8 for residential biomass burning. These values are consistent with established AAE ranges of 0.9–1.1 for liquid (fossil) fuel combustion and 1.7–2.2 for biomass burning both at the surface (e.g., Sandradewi et al., 2008; Bernardoni et al., 2017b; Zotter et al., 2017; Belis et al., 2019; Forello et al., 2023; Rovira et al., 2025) and for the total atmospheric column (Russell et al., 2010).
Regarding particle size, a detailed comparison between our results for each source factor and previous literature is provided in Sect. S14. Here, we restrict the discussion to the main considerations. First, the size distributions of both factors (Fig. 3b and d) exhibit multimodal structures, indicating composite source contributions (Mazzei et al., 2007; Cuccia et al., 2010). A common feature, however, is their increase towards the lower limit of the diameter scale, suggesting potentially higher VSD values for particles smaller than 180 nm, which is beyond the lower OPC detection limit. We acknowledge the significant limitations in identifying traffic-related particles based on OPC-derived VSDs. Notably, the largest number contribution from “fresh” traffic exhaust particles typically lies within the Aitken mode (tens of nanometres, e.g. Costabile et al., 2009; El Haddad et al., 2009; Gu et al., 2011; Dall'Osto et al., 2012; Wu et al., 2021), which is not captured by the OPC. Nevertheless, in our case, aethalometer measurements – characterised by high absorption coefficients and an AAE close to 1, the commonly accepted theoretical value for black carbon (Liu et al., 2018) – play a fundamental role in attributing this factor to traffic exhaust emissions, particularly to an “aged traffic” component that has shifted to larger particle sizes (Zhou et al., 2004; Yue et al., 2008; Pey et al., 2009; Gu et al., 2011; Liang et al., 2021). This interpretation is further supported by the associated temporal patterns discussed in the following paragraphs.
Some particles within this factor, especially those with diameters greater than 1 µm, may additionally originate from non-exhaust emissions, and notably tyre and brake wear (Gietl et al., 2010; Harrison et al., 2011, 2012; Vu et al., 2015), road surface abrasion and dust resuspension (Sowlat et al., 2016; Leoni et al., 2018; Masiol et al., 2016; Savadkoohi et al., 2025). Only a small fraction of particles > 5 µm is visible in this factor, as these latter are likely better represented by factor 6 (Sect. 4.2.3). The differing size fractions of exhaust and non-exhaust particles, along with their distinct atmospheric dispersion behaviours and sensitivity to weather and pavement conditions, can lead to partial decorrelation between these particle types. This effect is particularly evident in sub-daily measurements, where temporal patterns of the two fractions may shift relative to each other (see further results on this aspect in Sect. 4.4.1). It is also worth noting that even source apportionments based on aerosol chemical properties face limitations in attributing all coarse particles from non-exhaust emissions to traffic. However, in that case, the temporal decorrelation between exhaust and non-exhaust particles may be partially alleviated by use of daily averaged data.
As a final remark on the size distributions, the region of both combustion-related factors (Fig. 3b and d) is the largest among all PMF profiles in relative terms. This is also confirmed by the relatively large error bars obtained with RASPBERRY+EVLS in Fig. S34 for the same sources. A likely explanation for this behaviour is the greater uncertainty in the VSDs of these factors.
The temporal patterns (Fig. 4a) reveal similarities and differences. Both factors show two maxima in their daily cycles, with peaks in the morning/evening and minimum in the middle of the day. This reflects the daily evolution of the mixing layer in the valley (Bellini et al., 2025) and the emission cycles, with traffic peaking during rush hours and biomass burning, associated with operation of residential heating systems, peaking approximately 3 h later. The differing behaviour of the two emission sources becomes even more apparent when their relative contributions to PM10, rather than absolute values, are considered (Figs. S13a and S20–S21). Notably, biomass burning accounts for 30 %–40 % of nighttime PM10 during the winter months. Seasonally, traffic emissions contribute quite consistently to PM10, however, during the cold season, the morning and late afternoon peaks become more pronounced (Fig. S14), likely due to the reduced mixing height. A slight increase in PM10 from traffic during summer and a marked rise in December are observed (Fig. 4a), probably due to tourism (Diémoz et al., 2021). Indeed, in winter Aosta is a prominent destination for skiers frequenting nearby snowfields, particularly during the winter holiday season. On the other hand, biomass burning is confined to winter.
Weekly trends further distinguish the two, with road traffic emissions showing a pronounced weekend effect, in contrast to biomass burning. In particular, the Sunday morning peak of traffic emissions is remarkably damped compared to the other days of the week (Fig. S14). This difference is confirmed by the Kruskal-Wallis test (e.g., Hollander et al., 2015), used to check whether daily mean PM10 contributions are similar on weekdays and weekends (null hypothesis). The resulting p-values are 1 × 10⁻¹⁷ for traffic emissions, i.e. weekdays/weekend differences are statistically significant at the 5 % level, and 0.89 for biomass burning, i.e. no significant differences. Despite this, the biomass burning morning peak exhibits a slight weekday/weekend difference, potentially indicating a weak interference from traffic emissions. A similar behaviour was identified by Zotter et al. (2017), who suggested that the AAE of traffic emissions may vary throughout the day, with larger values – mimicking that attributed to biomass burning – for fresh emissions. This effect is expected to be more pronounced in low BC concentration scenarios, such as in our study. If this is the case, the observed behaviour is intrinsic to any aethalometer source apportionment model based on only two factors. An additional explanation proposed by the same authors involves the rapid formation of secondary organic aerosol from the ageing of traffic (also Favez et al., 2010), which again leads to an increase in AAE.
The overall contributions of these two factors to the total PM10 in the period 2020–2024 are 1.6 µg m−3 (9 %) for traffic and 1.8 µg m−3 (10 %) for biomass burning. These relatively low fractions reflect the generally unpolluted nature of the site, with weak local emission sources. However, it should be noted that these values represent annual averages, whereas wintertime concentrations can be significantly higher (e.g., Fig. S8).
As confirmation of the correct attribution of these factors, three long-term statistical considerations are provided. First, the sum of the two factor contributions, representing combustion-related PM10, is correlated with the NOx concentration measured at the same station over the 5-year period 2020–2024. Figure S11 shows that, despite the different physical states of the pollutants (particles and gases), their relationship is linear, with a Pearson correlation coefficient of 0.93 (R2 = 0.87). Second, the average daily cycle of PM10 concentrations attributed to traffic at Aosta–Downtown is compared with vehicle counts recorded simultaneously 500 m to the south during a measurement campaign conducted in 2020–2021 (231 measurement days distributed throughout the 2 years). Although rigorous and sophisticated methods exist to disentangle the effects of emissions and meteorology (e.g., Grange and Carslaw, 2019), which will be the focus of a separate study, Fig. S12 confirms that the two quantities are well correlated, exhibiting similar hourly and weekly patterns. Finally, the average daily cycle of traffic-related contributions, as determined by RASPBERRY, is compared over the period 9 March–4 May across different years (Fig. 6). This period was selected as it corresponds, in 2020, to the strictest phase of the COVID-19 “lockdown”. The figure qualitatively shows that the reduction in traffic emissions due to the containment measures had a marked impact on air quality in Aosta. While the overall PM10 concentrations did not vary substantially – partly due to the influence of meteorological conditions – the effect of the lockdown on the composition of the aerosol mixture is clearly discernible. This finding updates the results of Diémoz et al. (2021), providing unprecedented high-time-resolution insights into the “lockdown effect”.
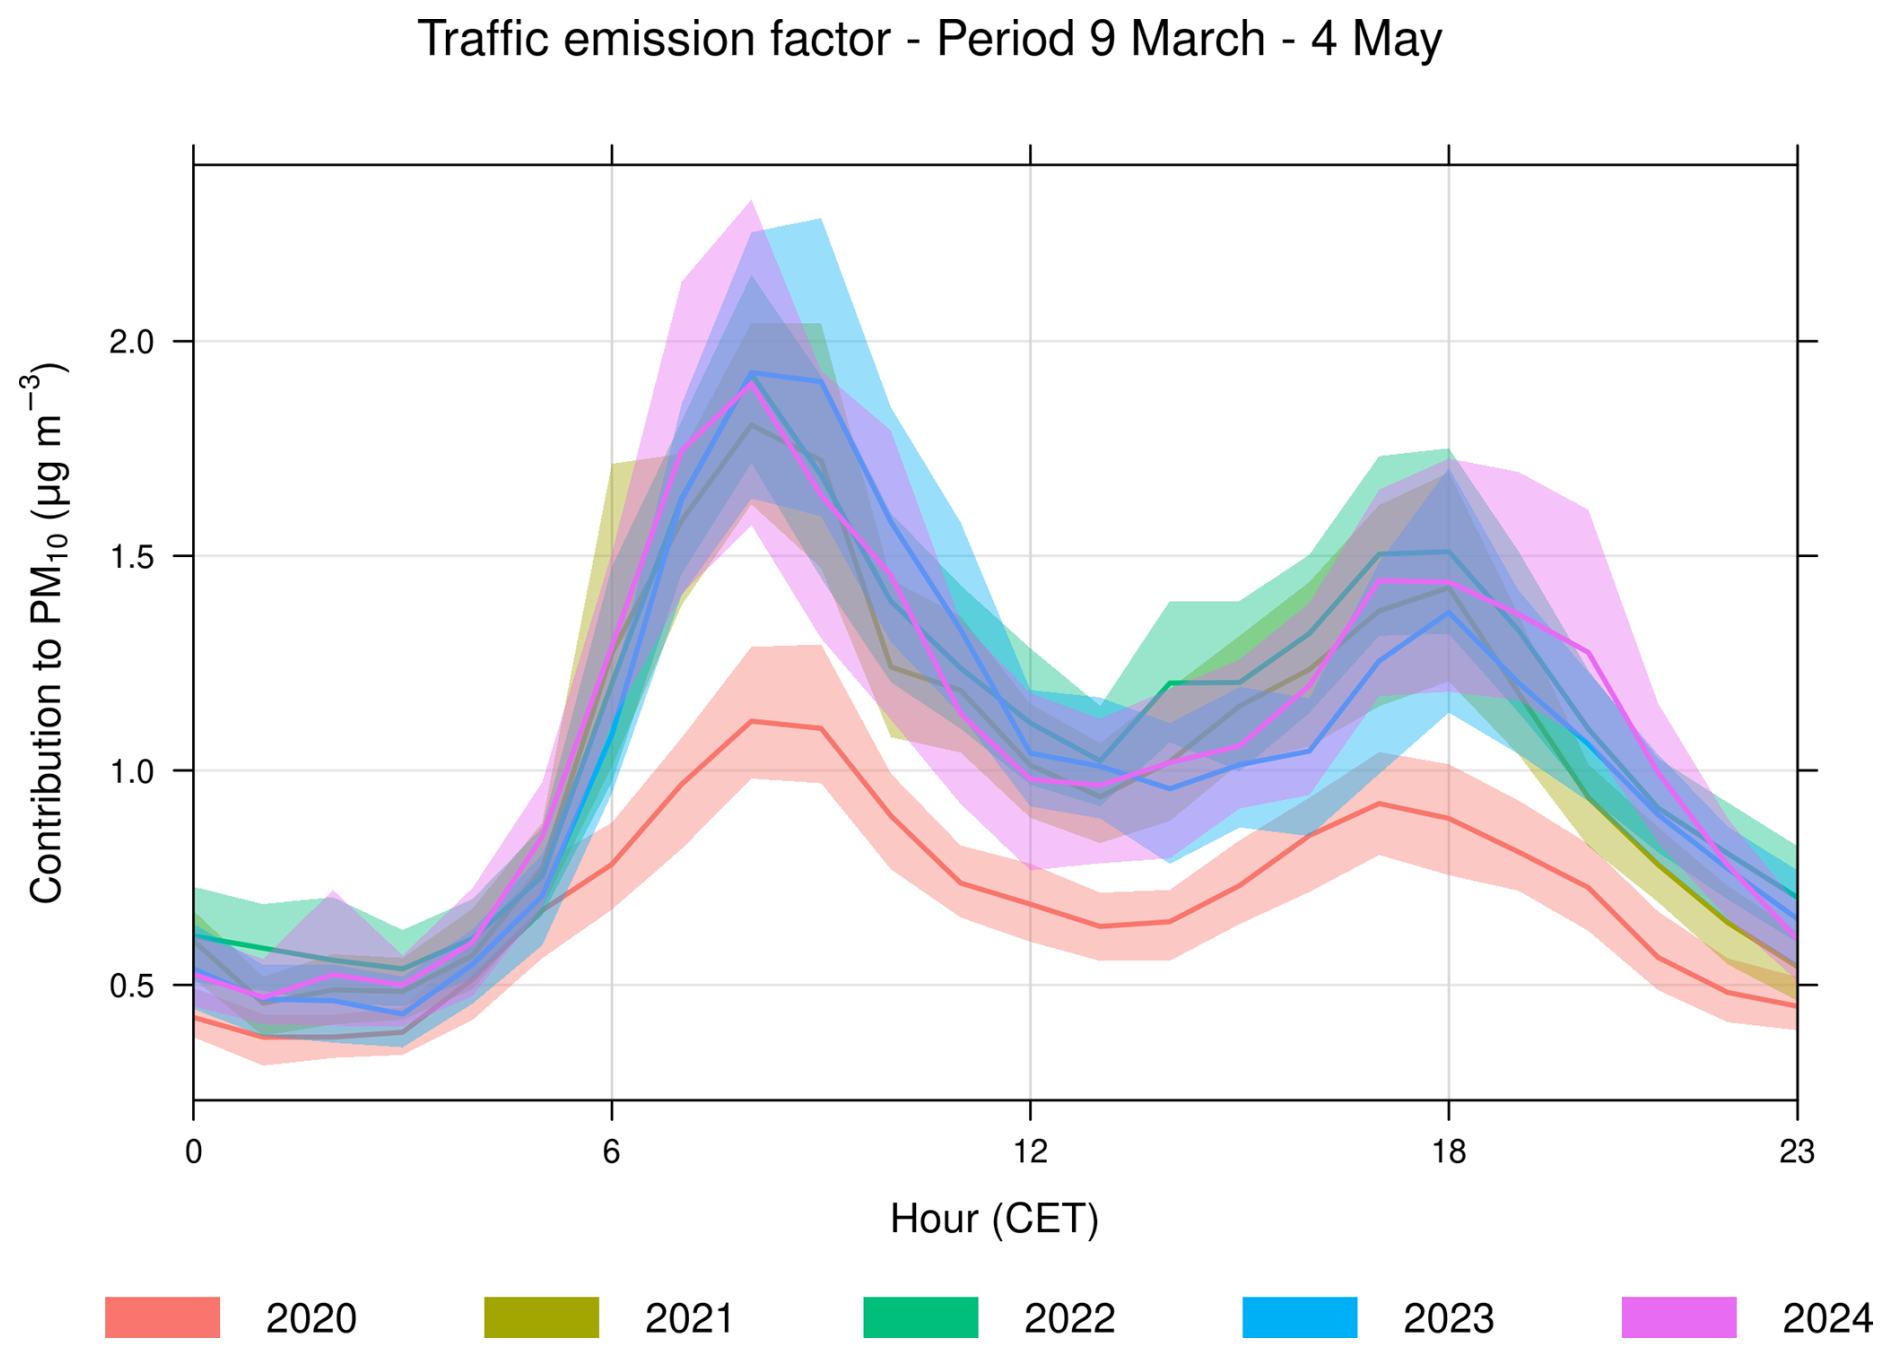
Figure 6Comparison of the average daily cycle of the traffic emission contributions across different years, as retrieved by RASPBERRY, for the period 9 March–4 May. This interval includes the COVID-19-related “lockdown” in 2020.
4.2.2 Factors related to secondary particles
Based on prior literature and studies conducted in the region (Diémoz et al., 2019a, b), factors 3 and 4 are attributed to secondary particles in condensation and droplet modes (Costabile et al., 2009). Indeed, secondary aerosols are well-known contributors to submicron particles in the accumulation mode (Pey et al., 2009; Gu et al., 2011; Harrison et al., 2011; Beddows et al., 2015; Masiol et al., 2017a; Rivas et al., 2020), with many studies identifying two sub-modes at distinct diameters (Mazzei et al., 2007; Fuzzi et al., 2015; Sowlat et al., 2016; Bernardoni et al., 2017a; Kalkavouras et al., 2024; Wang et al., 2024a). In particular, our results indicate that their relative contributions to the volume size distribution peak at 250 nm for factor 3 and 500 nm for factor 4 (Fig. 3f and h). These modes have been associated with different formation mechanisms: gas-phase processes, resulting in smaller particles (the so-called “condensation” mode, e.g. Masiol et al., 2016; Ogulei et al., 2006b), and mixed-phase processes, yielding larger particles (the so-called “droplet” mode). This attribution to secondary particles is also consistent with their weak light absorption (Fig. 3e and g). In particular, secondary inorganic aerosols, rich in sulfate and nitrate, are generally characterised by low absorption coefficients (Savadkoohi et al., 2025). Nevertheless, the droplet mode exhibits greater variability in absorption coefficients and Delta-C, which may, for instance, indicate presence of organic compounds (e.g., formation of organic nitrates).
The diurnal temporal patterns are remarkably similar, with a primary maximum in the late afternoon, a secondary peak in the morning, and a minimum just after midday (Fig. 4b). The observed concentration daily maxima can be attributed to two processes. First, and likely predominant, is the transport of polluted air masses, enriched in secondary particles, from the Po Basin to the Alps. This transport occurs regularly in the Aosta Valley during sunny days with weak synoptic circulation, accounting for approximately 50 % of the days annually (Diémoz et al., 2019b) and peaking in the afternoon. During such events, surface concentrations of fine secondary particles may be further amplified by reduced vertical mixing towards the end of the day. The strongest and prolonged transport episodes, leading to accumulation of particles, are clearly visible as peaks (Fig. S9c and d), which is confirmed by remote sensing techniques (some examples are provided in Sect. 4.4.3). A second, yet unexplored, reason for the afternoon increase could be the local formation of secondary particles after sunset, facilitated by rising relative humidity, favourable meteorological conditions such as atmospheric stability, and presence of local or advected particles promoting secondary formation through heterogeneous reactions. The subsequent nocturnal decrease in concentrations is likely driven by drainage winds in the valley, as also observed for the traffic-related component. The secondary morning maximum could arise from several mechanisms: (i) local secondary particle formation linked to emissions, such as traffic during rush hours; (ii) entrainment of secondary particles from the nighttime residual layer, acting as a reservoir overnight (Curci et al., 2015; Lampilahti et al., 2021); or (iii) the initial stages of a progressive accumulation of secondary particles throughout the day, interrupted by a sudden concentration drop at midday due to enhanced vertical mixing (Bellini et al., 2025). Determining the dominant process needs further investigation. Anyway, the absence of a weekend effect for both factors, as indicated by p-values from the Kruskal-Wallis test well above 0.05 (0.69 for the condensation mode and 0.70 for the droplet mode), suggests that local anthropogenic emissions of aerosol precursors play a minor role. Instead, concentrations appear to be predominantly influenced by regional-scale atmospheric circulation patterns, accumulation processes, and meteorological/thermodynamic conditions.
Seasonally, the contributions to PM10 by condensation and droplet modes are comparable in winter, while from April to September the condensation mode is dominant, accounting for up to 40 %–50 % on an hourly basis during the night (Figs. S22–S23). The decrease in the concentrations of the droplet mode factor during summer (Fig. 4b) is a well-documented phenomenon attributed to less favourable formation conditions and the partitioning of compounds such as nitrate ammonium towards the gas phase under warmer conditions (e.g., Aan de Brugh et al., 2012). The seasonal modulation of the condensation mode is less clear, with a minimum in April–May followed by a rapid increase and a secondary peak in July. Very interestingly, the same distinct minimum in the month of May has been found in Milan in ammonium sulfate concentrations by Colombi et al. (2024). The seasonal behaviour of the condensation mode factor may be linked to (i) varying mesoscale or synoptic circulation patterns (e.g., the transport of sulfates from other European countries) or (ii) enhanced photochemical formation processes in summer.
The overall contributions of these factors to the total PM10 in the period 2020–2024 are 4.1 µg m−3 (23 %) for the condensation mode and 2.8 µg m−3 (16 %) for the droplet mode. These values closely correspond to those determined through chemical analyses by Diémoz et al. (2019b), who estimated the contribution of secondary aerosols (sum of sulfate- and nitrate-rich factors) in Aosta–Downtown to be in the range of 30 %–40 %.
4.2.3 Factors related to coarse particles
Factors 5 and 6 represent coarse, predominantly non-light-absorbing, particles, as shown in Fig. 3i–l. We attribute them to the long-range transport of mineral dust from desert areas and resuspension of soil particles of more local origin, respectively.
For desert dust, this interpretation is mainly supported by results obtained using independent remote sensing techniques, the analysis of back-trajectories and the CAMS Ensemble model, as discussed further below, as well as the characteristic peak-like, impulsive time series of this factor (Gobbi et al., 2019, Fig. S9e) with an isolated average increase in July and a minimum in December, shown in Fig. 4c. Another indicative feature of long-range transport is the weak dependence of the PM10 contribution on the time of day and the day of the week, likely due to the “random” arrival times of these air masses at the site via long-range circulation (Fig. 4c). The small but statistically significant decrease in weekend concentrations (p-value = from the Kruskal-Wallis test) may be attributed to reduced resuspension of deposited dust by vehicular traffic (Barnaba et al., 2017), or to contributions from other local sources. The size profile, peaking at approximately 5 µm, with the maximum contribution to VSD variance occurring over a relatively broad range of diameters centred around 2 µm, is consistent with existing scientific literature on desert dust transported towards Europe. For example, Gu et al. (2011) report that long-range transported dust in continental Europe, identified using lidar and satellite observations, typically has diameters ranging from 0.7 to 3 µm, whereas locally resuspended coarse particles exhibit larger diameters. Comparable values are reported in other studies (Struckmeier et al., 2016; Di Biagio et al., 2019; Herrero del Barrio et al., 2024). Mazzei et al. (2007) note that desert dust in Genoa, Italy, is characterised by a broad range of diameters extending from 0.5 to over 4 µm. In their review, Gobbi et al. (2019) state that clay-like dust typically has a size of ∼ 2 µm, while silt-like dust is larger, at around 5 µm. Finally, Conte et al. (2020) demonstrate that desert dust accounts for the majority of variance in the 2.5–3 µm range, consistent with our findings, also considering that their measurements were conducted in Lecce, further south in Italy.
Regarding optical properties, this dust factor does not exhibit significant light absorption, in contrast to previous findings (Forello et al., 2019). However, unlike remote, pristine sites (Collaud Coen et al., 2004), the absorption by dust is often masked in regions heavily influenced by other light-absorbing aerosols, such as traffic and biomass burning emissions (Tohidi et al., 2022; Rovira et al., 2025; Savadkoohi et al., 2025), due to its lower mass absorption efficiency (Yang et al., 2009). Moreover, the absorption characteristics of desert dust can vary significantly depending on its source region (Di Biagio et al., 2019). Hence, not all studies identify a dust factor with light-absorbing properties, even at southern European stations (e.g., Forello et al., 2023). However, despite the uncertainty in NeBC encompassing the zero line in Fig. 3i, we note that the optical profile of factor 5 increases at wavelengths shorter than 600 nm, consistent with expectations for dust (Collaud Coen et al., 2004; Di Biagio et al., 2019; Tohidi et al., 2022). For our study, the estimated AAE of approximately 3 agrees well with the upper limit of AAE values for dust detected at AERONET sites (Russell et al., 2010).
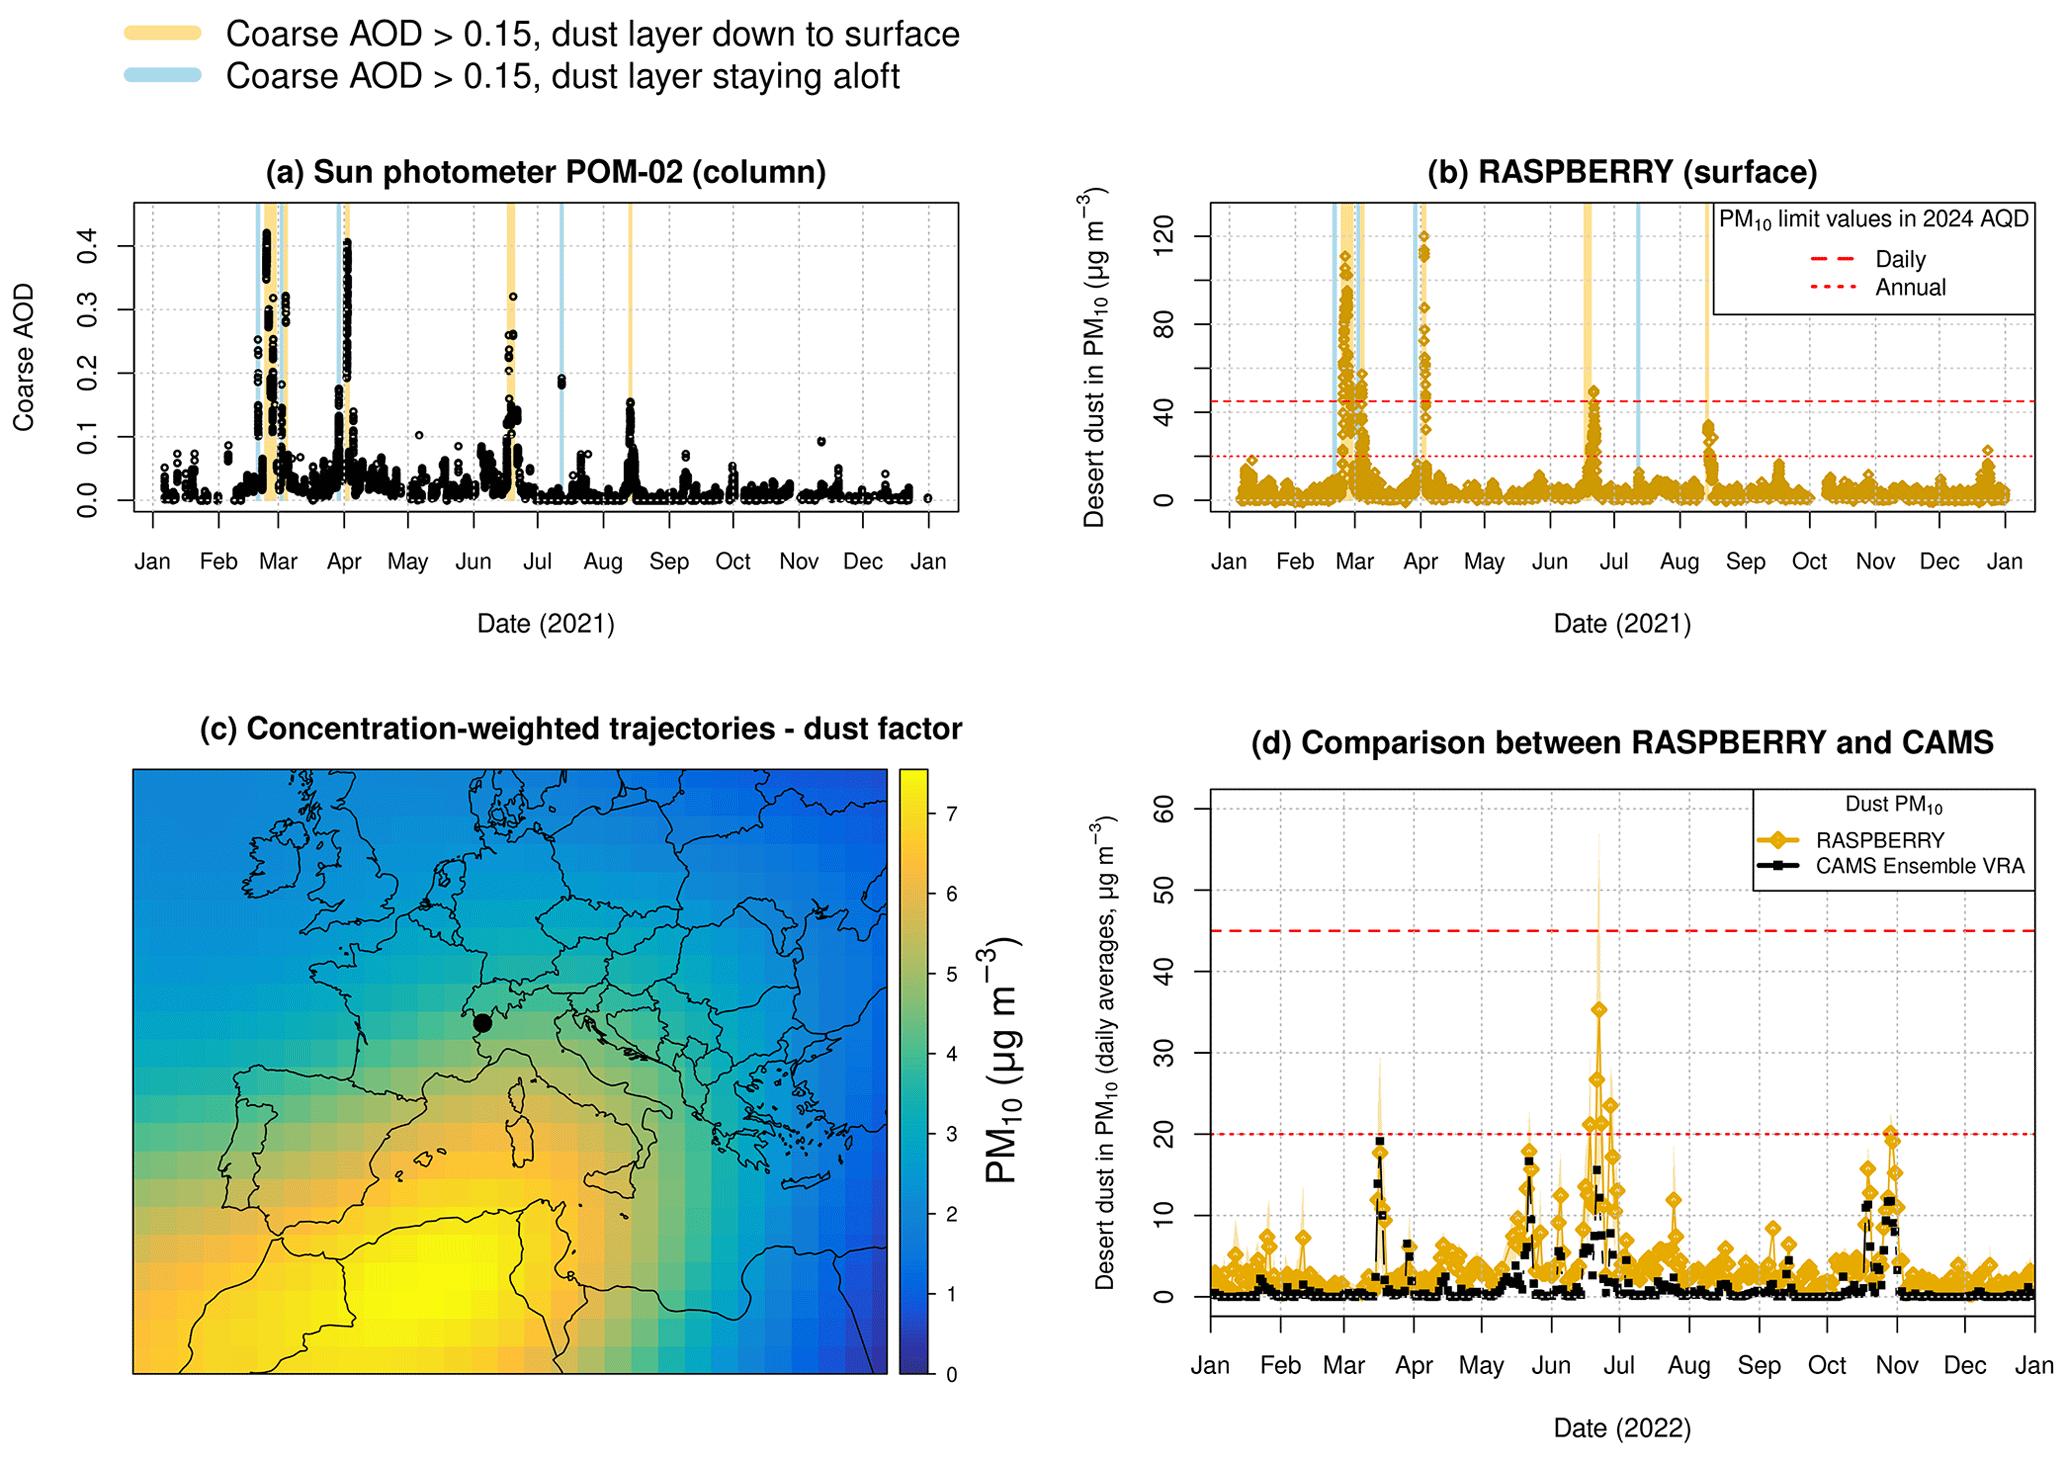
Figure 7Information supporting the attribution of the “dust” factor emerging from the physical PMF to mineral particles transported from the desert. (a) Coarse-mode aerosol optical depth at 500 nm, measured in 2021, as an example. The coloured vertical lines indicate episodes of desert dust transport along the vertical column. Two cases are distinguished based on ALICENET ALC observations: the elevated layer enters the mixing layer and reaches the surface (yellow) or it remains aloft (light blue). (b) Hourly absolute contribution of the dust factor to PM10 measured at the surface in the same period as in panel (a), as determined by RASPBERRY. (c) Concentration-weighted trajectories obtained using factor 5 contributions over the entire 2020–2024 period. (d) Comparison of desert dust in surface PM10 as retrieved by RASPBERRY and the CAMS Ensemble VRA model for the year 2022. The points represent daily averages from both data sources, while the coloured area denotes the daily standard deviation of the hourly RASPBERRY retrievals. Red horizontal lines: PM10 limit values introduced by the 2024/2881/EC AQ directive.
As anticipated, ancillary information from remote sensing techniques and models confirms the correct attribution of this factor. Figure 7a presents the coarse-mode AOD retrieved from the sun photometer using the algorithm by O'Neill et al. (2001) (Sect. 2.3). The year 2021 is chosen as an example, as some of the strongest transport events in Europe occurred in that period (Rodríguez and López-Darias, 2024). An arbitrary minimum threshold of 0.15 on coarse-mode AOD is set to highlight the most indicative episodes in the plot. Furthermore, based on the analysis of vertical profiles from the ALCs in Aosta–Saint-Christophe, dust layers that remain primarily aloft (light blue bands in Fig. 7b), detected by the sun photometer but not by the in-situ surface instruments, are discriminated from those that ultimately enter the mixing layer and reach the ground (yellow bands in Fig. 7b). Representative examples are shown using lidar diagrams in Fig. S31a–d. In the latter cases, the contribution of the desert dust factor in RASPBERRY increases markedly, whereas for the former, the increase is negligible. This confirms that factor 5 serves as an effective proxy for the presence of desert dust. Slight delays are occasionally observed between detection by remote sensing instruments and peaks in the source apportionment. This may be attributed to various effects: (i) absence of photometer measurements in cloudy days; (ii) time required for the layer to descend after being detected in the column or, in some cases, (iii) time needed for the dust to be advected horizontally to the measuring station (and there accumulated) after entering the atmosphere elsewhere (e.g., the Po Basin). The third plot (Fig. 7c) presents the results of the concentration-weighted trajectory analysis (CWT; e.g., Hsu et al., 2003), using the HYSPLIT model and the dust factor contribution as the weighting variable (more details in Sect. S16). The figure clearly shows that the most likely source region for the particles attributed to factor 5 is northwestern Africa.
In addition, a comparison of the daily average concentration of desert dust in surface PM10 from RASPBERRY and the CAMS Ensemble Validated Reanalysis (VRA; Colette et al., 2025) for the year 2022 is presented in Fig. 7d. This year was selected as it corresponds to the study period currently under evaluation within the CAMS–National Collaboration Programme–Italy (CAMS2_72IT_bis). The agreement between the two datasets is notable, both in terms of the timing of dust events (x-axis) and the absolute concentrations (y-axis). The most pronounced differences in concentration occur during the June 2022 event, with RASPBERRY showing peak values approximately twice as high as those from CAMS Ensemble VRA. In this context, both overestimation and underestimation by CAMS relative to surface in situ observations have been documented in the literature, depending on spatial and temporal variability as well as on ancillary conditions (Sarafian et al., 2025). Potential systematic biases may also arise from optical particle counter (OPC) artefacts under dust conditions. However, correcting for these effects would require detailed knowledge of the aerosol refractive index, and thus of its chemical composition, and morphology at high temporal resolution (Ferrero et al., 2019). Finally, a persistent non-zero background is evident in the RASPBERRY dataset throughout the year, as discussed further below.
The attribution of factor 6 to local coarse particles is supported by the pronounced weekend effect (p-value of ), which indicates an anthropogenic origin (Fig. 4c). Moreover, this factor is shifted to larger diameters, with a peak of the absolute contribution between 5 and 6 µm, and its variance contribution extending to the upper limit of diameters detectable by the Palas Fidas 200. Such large particles are unlikely to travel long distances. These particles may include: (i) crustal materials resuspended from the road pavements by vehicular traffic (Sect. 4.2.1) or steelwork slag dust, both characterised by high calcium and magnesium content; (ii) sodium chloride particles originating from road salting used in winter as a de-icing agent; and (iii) pollen and other primary biogenic aerosols. The influence of road salting likely explains the observed increase in coarse particle concentrations during December, January, and February (Fig. 4c, see also the case study presented in Sect. 4.4.1). The average diurnal pattern, with a peak around midday, resembles the evolution of the convection-driven aerosol layer height, as determined in previous studies at the same site using automated lidar-ceilometers (Bellini et al., 2024, 2025), highlighting the role of local-scale mixing. At a closer examination (Figs. S18–S19), a single daily peak is observed at midday during January and December. Conversely, in other months, two distinct peaks emerge. This phenomenon can be attributed to the influence of local atmospheric (valley) circulation, where winds develop around midday and, if strong enough, erode the temperature inversion, dispersing particles into a larger volume of air. The two peaks are unlikely to originate from traffic emissions during rush hours, as their separation remains evident even during the typical summer holiday months. Figure S32 illustrates this behaviour on a representative summer day (18 July 2024). Vertical aerosol profile measurements from polarisation-sensitive ALCs, such as the CL61 (Sect. 2.3), provide valuable information in this context, as high depolarisation ratio values are indicative of the presence of irregularly shaped particles in the atmosphere. Notably, the morning increase and evening decrease in surface concentrations visible in Fig. S32 correspond well with the diurnal evolution of the depolarisation profiles. However, around midday, when the particles are transported and mixed into a larger air volume at altitudes exceeding 1.2 km, surface concentrations decrease. Another interesting feature is that in December the daily peak in coarse particle contribution is shifted towards the afternoon, whereas in January it is more centred around noon or slightly shifted towards the morning. This fact could indicate a different daily pattern in car traffic during the winter holiday period, as discussed in Sect. 4.4.1.
The overall average contributions of these two factors to the total PM10 in the period 2020–2024 are 3.6 µg m−3 (21 %) for desert dust and 3.7 µg m−3 (21 %) for local resuspension of coarser particles, together accounting for more than 40 % of the total PM10. Such a large percentage contribution is justified by the substantial volume carried by these coarse particles and the relatively low contributions from other local sources at this lightly polluted measurement site. In particular, according to RASPBERRY desert dust estimates, 22 out of the 36 PM10 daily exceedances recorded in Aosta–Downtown during the 5-year study period (as defined by the new 2024 AAQD; 16 out of the 26 under the current 2008 AAQD) could in fact be excluded from the count due to the contribution of natural sources. At the same time, we acknowledge that a slight overestimation of the desert dust contribution by RASPBERRY may be possible. Indeed, after removing peak events and data within ±12 h of such episodes, the residual baseline averages ∼ 2 µg m−3, a value compatible with PM measurement uncertainty. Notably, this baseline exhibits a distinct diurnal and weekly variability (including a morning maximum and weekend effect), as well as seasonal features (peaks in July and October), suggesting a contribution from the resuspension of fine crustal particles (of desert or local origin) driven by traffic and modulated by road surface moisture, and not captured by the CAMS ensemble. Despite these limitations, factor 5 remains highly effective for identifying desert dust events and the overall results remain qualitatively consistent with similar dynamics observed in other southern European regions.
4.3 Comparison between chemical PMF and physical source apportionment
The results from RASPBERRY are compared with those obtained from the chemical PMF. To ensure comparability, source contributions from RASPBERRY are averaged to daily values, and only dates common to both datasets are included in the analysis. This limits the comparison to the subperiod 2020–2021 for chemical dataset 1 (with anion, cation, EC OC, and levoglucosan) and 2020–2022 for dataset 2 (with anion, cation, and metals). Dataset 1 is particularly useful for discriminating traffic emissions from residential biomass burning, based on levoglucosan, while dataset 2 is useful for characterising dust particles using metals and has a longer record. The results are presented in Fig. 8. To evaluate the comparison, we use the coefficients of the regression equation relating the source contributions from the physical source apportionment (y) to those from the chemical PMF (x), together with the corresponding explained variance (R2). For the sake of simplicity, we report in the main text only the coefficients obtained using traditional ordinary least squares (OLS) regression. The interested reader can find the results obtained with alternative, more advanced regression approaches in Table S3 and Fig. S34, namely: (i) total least squares (Deming regression; Linnet, 1990), performed by accounting for the actual variance-error ratios obtained from the DISP test of both the physical and chemical PMF solutions; (ii) York regression (York et al., 2004), performed using individual uncertainties calculated through EVLS for both the physical (RASPBERRY+EVLS) and chemical (PMF+EVLS) data sets; and (iii) York regression applied to log-transformed quantities to account for heteroscedasticity in the data.
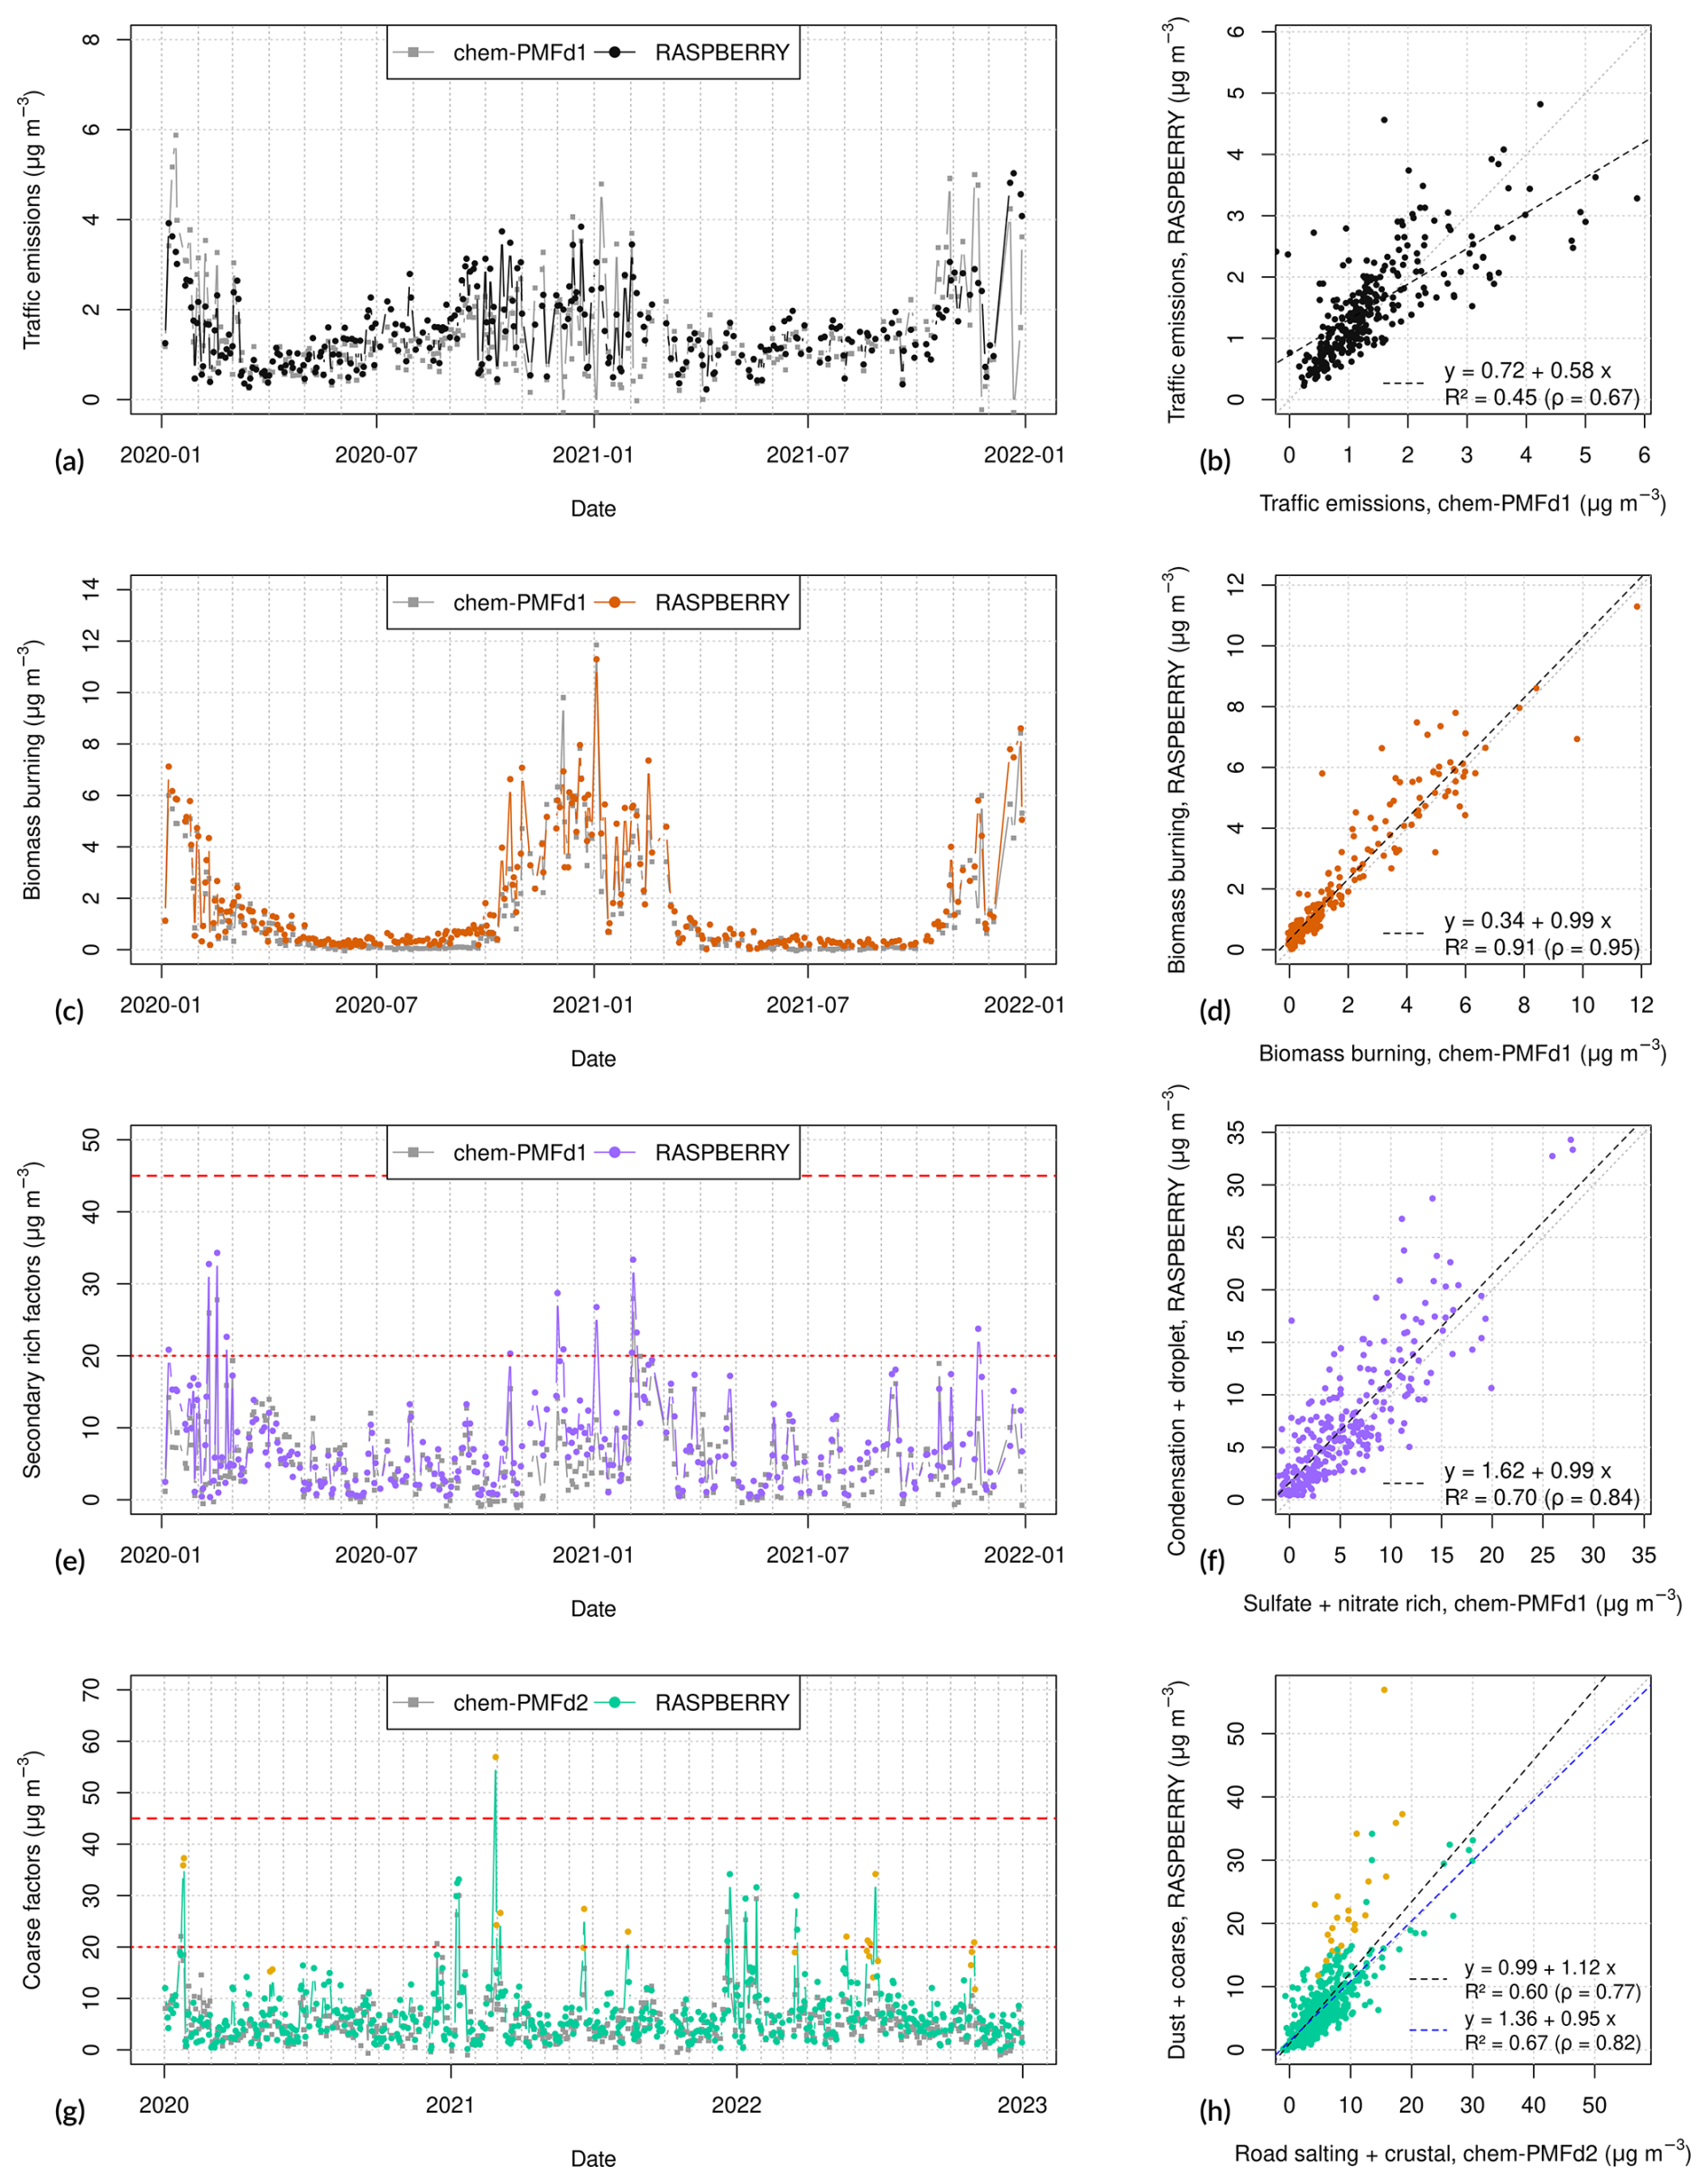
Figure 8Comparison of daily averaged PM10 source contributions derived from the chemical PMF (dataset 1, with anion, cation, EC OC and levoglucosan; dataset 2, with anion, cation and metals) and RASPBERRY, presented using time series plots (left column) and scatter plots (right column). Specifically: panels (a) and (b) represent estimates of traffic emissions; (c, d) residential biomass burning; (e, f) secondary particles, obtained as the sum of sulfate- and nitrate-rich factors from the chemical PMF, and condensation and droplet mode factors from RASPBERRY; (g, h) coarse particles, calculated as the sum of road salting and crustal factors from the chemical PMF, and desert dust and local dust resuspension from RASPBERRY. Yellow points in panels (g) and (h) indicate data influenced by significant Saharan dust events. In panel (h), the blue dashed regression line is calculated excluding these points. Red horizontal lines: PM10 limit values introduced by the 2024/2881/EC AQ directive.
The comparison of traffic factors is depicted in Fig. 8a (time series) and Fig. 8b (scatter plot). From the first panel, it is evident that the magnitude of contributions from both source apportionments is about the same, as are the overall seasonal trends. However, the point-to-point relationship illustrated in the second panel reveals some discrepancies, with a Pearson's correlation coefficient of ρ=0.67 (R2 = 0.45). Furthermore, the regression coefficients deviate from the 1 : 1 line ( µg m−3). This deviation can be attributed to difficulties in accurately identifying the traffic factor, primarily due to the following reasons:
-
Contributions from both source apportionments are relatively low, steadily remaining below 6 µg m−3, which is consistent with the fact that Aosta is a relatively small, low-traffic city (33,000 inhabitants; Diémoz et al., 2019b, 2020, 2021). At the same time, the relative uncertainty associated with traffic emissions is among the highest of all dimensional profiles. This is evident from both the large interval ratio obtained from the DISP test (Sect. 4.2 and Fig. 3) and from the uncertainties derived using the EVLS method for both the physical and the chemical data sets (Fig. S34).
-
The finite lower detection limit of the OPC does not allow all aerosols emitted by traffic to be captured. In particular, most of the studies focusing on ultrafine and accumulation-mode particles (among the most recent examples; Harni et al., 2024; Beddows et al., 2025; Ćirović et al., 2026; Mapelli et al., 2026) identified at least two distinct factors related to traffic (e.g., freshly nucleated vs. more aged or distant particles, or gasoline vs. diesel/heavy-duty emissions). This may indicate that the physical setup and the chemical analyses effectively “detect” different factors attributed to traffic.
-
The coarse resuspended fraction, which significantly contributes to the mass, may be characterised in slightly different amounts in the chemical and the physical source apportionments, as discussed in Sect. S10. Distinguishing unambiguously exhaust and non-exhaust particle contributions is a well-known challenge, frequently reported in the literature (Forello et al., 2023).
-
The mass absorption cross-section (MAC) in aethalometer measurements may decrease in winter compared to summer, as observed in several studies, e.g. Mousavi et al. (2019) in Milan and Savadkoohi et al. (2024) on a European scale. Such seasonal variation is consistent with an underestimation of NeBC during winter, when concentrations are higher, and an overestimation during summer, when concentrations are lower, in RASPBERRY.
At the same time, it should be noted that the comparison slope for the traffic factor is higher than 1 when using York and log-transformed York regressions (Table S3), since the intercept decreases. Therefore, the deviation from the 1 : 1 line may also be partly attributable to an artefact of the regression method itself.
Conversely, an excellent agreement is observed for the residential biomass burning factor, with the contribution time series from both source apportionments nearly overlapping and a regression very close to the 1 : 1 line (ρ=0.95; R2 = 0.91; µg m−3). Notably, the correlation achieved here between the two factors surpasses that reported by Zotter et al. (2017) for the relationship between the wood-burning eBC fraction and levoglucosan (ρ=0.77).
For the secondary particles, a question arises as to whether the separation between sulfate- and nitrate-rich modes in the chemical PMF corresponds to that between condensation and droplet modes in RASPBERRY. Figure S33 indicates that, despite a general similarity, some differences emerge. During the warm season, contributions from the sulfate-rich factor and the condensation mode factor overlap (Fig. S33a). However, from late autumn to early spring, deviations become apparent. Similarly, discrepancies are observed between the nitrate-rich and droplet mode factors (Fig. S33c). These variations are reflected in the suboptimal regression results (sulfate/condensation: ρ=0.71; R2 = 0.50; µg m−3; nitrate/droplet: ρ=0.80, comparable to the value reported by Diémoz et al. (2019b); R2 = 0.65; µg m−3). This imperfect overlap could be explained in different ways:
-
The differences observed between RASPBERRY and the chemical source apportionment may reflect the true nature of aerosol composition, as nitrates could be distributed between condensation and droplet modes, potentially influenced by their source region.
-
Modelling inaccuracies in RASPBERRY may arise if factor profiles evolve over the course of the year (e.g., due to seasonal variations in mode size), leading to cross-talk between species associated with condensation and droplet modes.
-
Differences in aerosol drying conditions between the OPC and filter-based sampling could result in divergent estimates of the secondary volatile fraction.
-
Further research is needed to better characterise the partitioning of organic compounds in the physical source apportionment.
Nonetheless, when the sulfate- and nitrate-rich chemical factors are summed together and compared to the sum of the condensation and droplet physical factors (Fig. 8e and f), the time series exhibit a stronger similarity, and the regression metrics improve (ρ=0.84; R2 = 0.70; µg m−3). This indicates that the total concentration of these two fine, non-light-absorbing secondary factors is highly consistent across the source apportionments. More importantly, from an environmental perspective, it accounts for the fraction of particulate matter originating from secondary formation. Incidentally, the large positive intercept is statistically significant when using OLS and Deming regressions, but not with York regression, and it turns negative (and statistically significant) when York regression is applied to log-transformed data. This result suggests that, similarly to traffic, the apparent high bias is largely an artefact of the regression method, and perhaps of the heteroscedastic nature of the data, rather than a systematic discrepancy between the two source apportionment approaches.
Finally, to compare the contributions of coarse particles assessed by both source apportionment techniques we aggregate the road salting and crustal factors from chemical PMF with the desert dust and local dust resuspension factors from RASPBERRY. This aggregation is necessary because chemical PMF does not allow for a clear distinction between desert dust and local dust resuspension, while RASPBERRY does not differentiate between crustal material and road salting contributions. For this purpose, the extended chemical dataset 2 is utilised. Figure 8g and h indicate that, when considering all data, a reasonable agreement is achieved, albeit with some peaks in the source apportionment not reproduced by the chemical PMF (ρ=0.77; R2 = 0.60; µg m−3). Most of these peaks, which degrade the comparison results by diverging above the upper scatter plot sector, can be attributed to intense Saharan dust events (highlighted in yellow and identified using a threshold corresponding to the 95th percentile of the desert dust contribution). These events are likely not optimally captured by the chemical PMF, or the corresponding PM10 estimates obtained by the OPC may not be very accurate. By excluding measurements exceeding the threshold, the comparison metrics improve (ρ=0.82; R2 = 0.67; µg m−3). However, excluding not only the most pronounced events but the entire contribution from desert dust in RASPBERRY would result in an approximate 20 % underestimation.
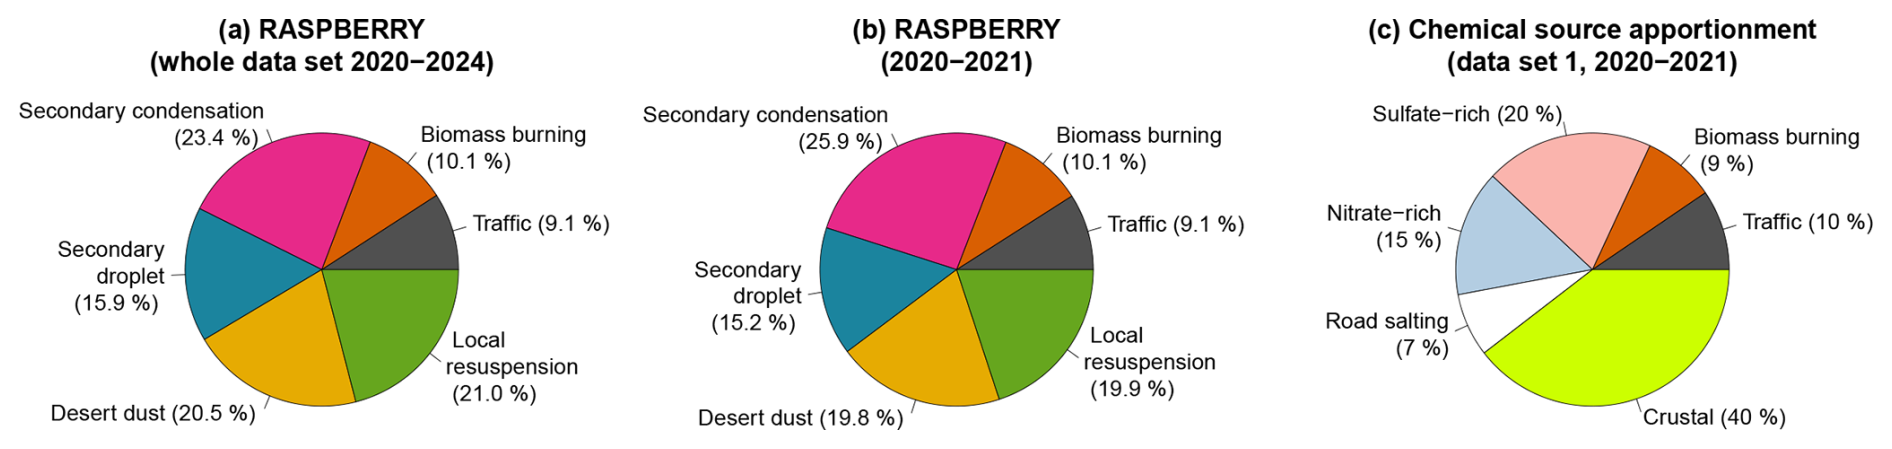
Figure 9Percentage contribution of the identified factors to PM10. (a) Physical source apportionment, whole dataset. (b) Physical source apportionment, subset using the same dates as in the chemical dataset 1. (c) Chemical source apportionment using dataset 1.
The contributions of all factors identified with RASPBERRY to PM10 over the entire analysis period are shown in Fig. 9a. To facilitate comparison with the chemical source apportionment results, such as those obtained using dataset 1, only the subset of coincident days in 2020–2021 is considered (Fig. 9b and c). The relative contributions of the traffic and biomass burning factors are remarkably similar (9 % vs. 10 % for traffic using the physical and chemical methods, respectively; 10 % vs. 9 % for biomass burning). Likewise, the contributions attributed to desert and local dust (19 % and 20 %, respectively) closely match the “crustal” factor identified through the chemical approach, though the 7 % contribution from road salting in the chemical PMF should also be considered among the coarse particles. Additionally, the contributions of droplet-mode aerosols (RASPBERRY) and the nitrate-rich factor (chemical source apportionment) are identical (15 %). The contribution of aerosols in condensation mode is slightly larger in 2020–2021 compared to 2020–2024, reaching 26 %, which exceeds the 20 % attributed to sulfate-rich aerosols by the chemical PMF. While these results are likely within the expected uncertainties of both approaches, it is important to note that the factor definitions differ between methods, and their overlap is only partial.
4.4 High-time-resolution monitoring and real-time applications
This section presents illustrative real-world examples where the application of RASPBERRY proved beneficial. In particular, we highlight the advantages of its high-time-resolution and real-time capabilities. First, we describe examples showcasing the detection of local aerosol sources and the quantification of their impact on surface concentrations (Sect. 4.4.1–4.4.2). We then extend the analysis to larger-scale circulation patterns, presenting cases of particle transport occurring at meso- (Sect. 4.4.3) and synoptic (Sect. 4.4.4) scales. Efforts have been made to include examples for each source identified through RASPBERRY.
4.4.1 Traffic exhaust and non-exhaust: winter holidays 2024
The period from 27 to 31 December 2024 was characterised by high PM10 concentrations across the city, as indicated by all urban quality monitoring stations. RASPBERRY attributes these elevated concentrations primarily to locally resuspended coarse particles, whose hourly contribution reaches the PM10 daily average limit introduced by the 2024/2881/EC AQ directive (45 µg m−3). The temporal pattern of these contributions remains remarkably consistent over the days (Fig. S35), with maxima occurring between 16:00 and 17:00 CET. This winter holiday period was marked by dry conditions, the inactivity of the steel mill, and the absence of construction works within the city. In contrast, vehicular flow associated with winter tourism was significant, making it an ideal case study for assessing the impact of exhaust and non-exhaust emissions from car traffic.
Retrievals from the physical source apportionment for factor 1 (“traffic emissions”, primarily exhaust and brake/tyre abrasion, Sect. 4.2.1) and factor 6 (“local dust resuspension”) are presented in Fig. 10. The first factor (Fig. 10a) exhibits a primary maximum in the morning (around 10:00–11:00 CET), with no corresponding peak in the sixth factor. The same morning peak is also clearly visible in nitric oxide (NO) concentrations (Fig. S36a), confirming its attribution to combustion (mainly traffic) emissions. The afternoon peak in factor 6 (Fig. 10b) is also discernible in factor 1 and NO concentrations, though less pronounced, suggesting a common traffic-related source. Notably, this coincides with the closing times of cable cars operating between Aosta and nearby ski resorts, a well-known rush hour in the southern part of the city.
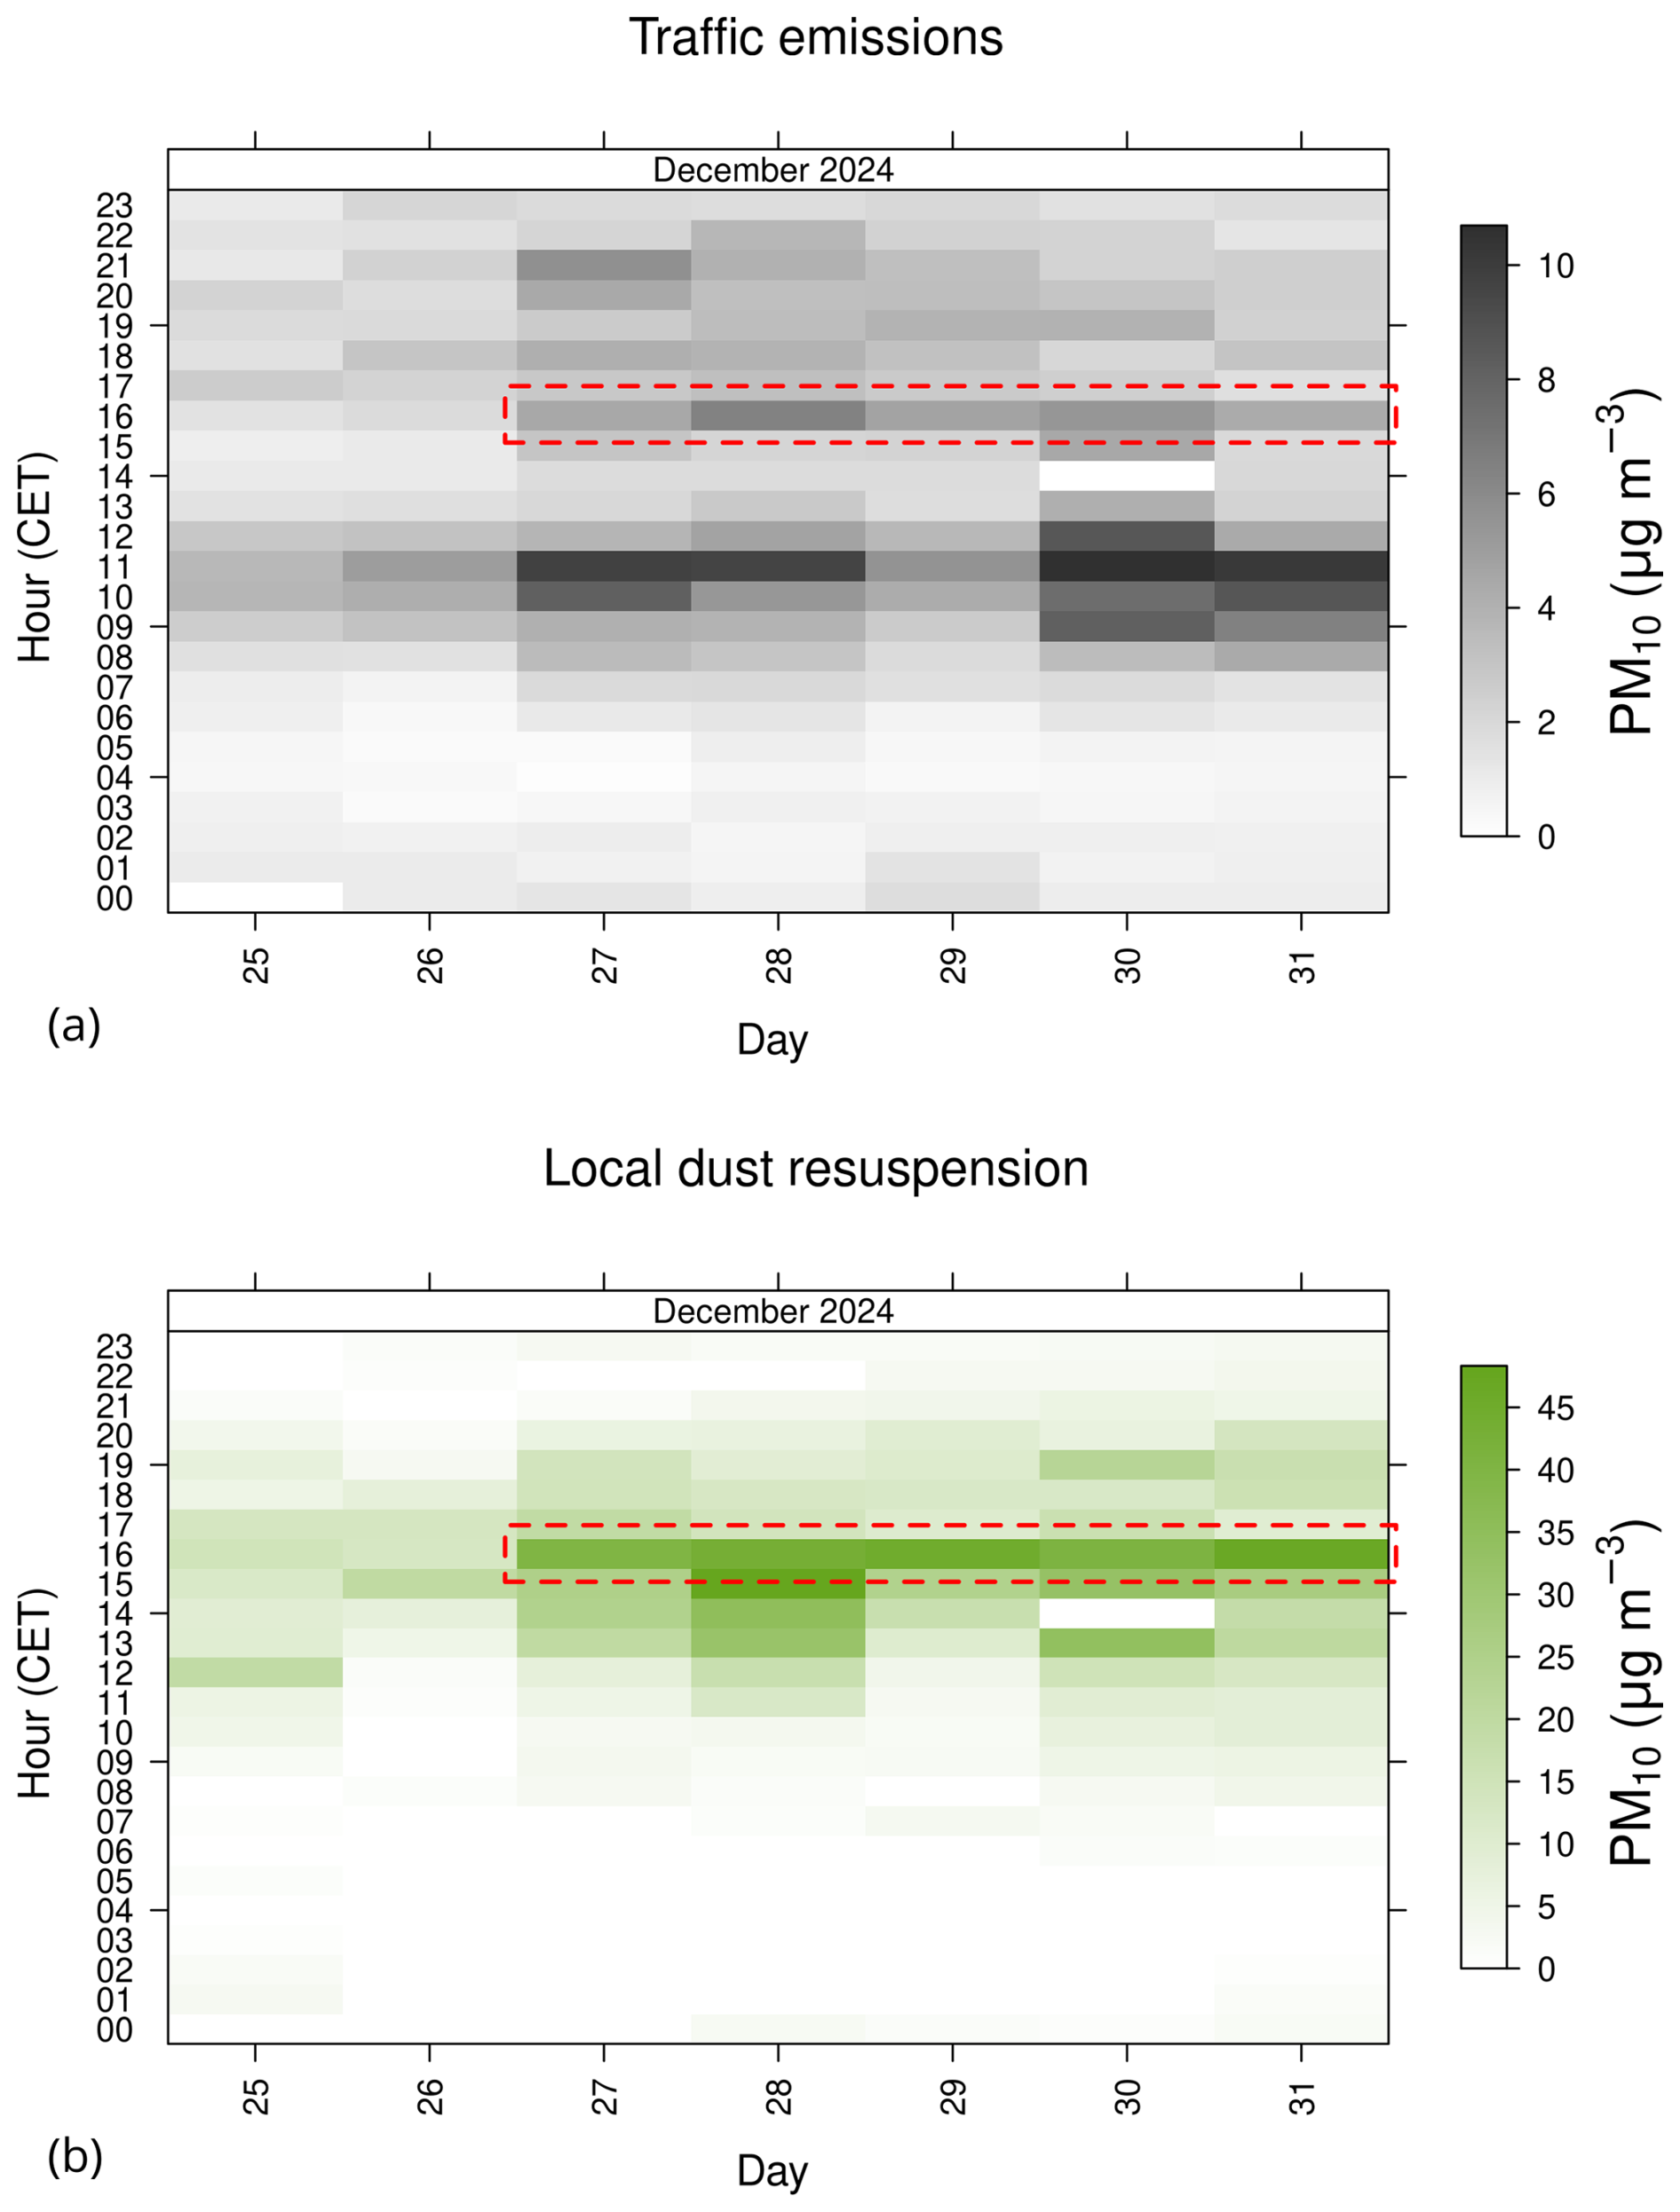
Figure 10Day/hour rectangle diagrams depicting the contributions to PM10 concentrations from 25 to 31 December 2024, as determined by RASPBERRY: (a) traffic emissions (primarily exhaust and brake/tyre abrasion) and (b) coarse particle resuspension. The period of peak coarse particle concentrations in the afternoon is highlighted with a dashed contour.
Road salting is a strong candidate for the observed increase in coarse particles in the afternoon. Sodium chloride, commonly used as a de-icing agent in the region, can reach daily average concentrations exceeding 20 µg m−3 on some winter days, nearly doubling those of the crustal-related factor in chemical PMF (Diémoz et al., 2019b, 2021). Since particle resuspension is strongly influenced by weather and pavement conditions, and in particular by surface moisture (Denby et al., 2013), the absence of a morning increase in coarse particle concentrations during winter may be attributed to humid or frozen road surfaces. As the day progresses and the sun rises over the mountain horizon around midday, relative humidity decreases (Fig. S36b), likely leading to drier road conditions. This short sunlit period is also reflected in the wind speed diagram (Fig. S36c), which shows a slight increase in wind speeds, though still very low and close to calm conditions (∼ 1 m s−1), likely due to strong wintertime temperature inversions. While this weak atmospheric circulation is insufficient to resuspend particles from the road surface on its own, it may contribute to lifting particles already resuspended by vehicular traffic. As the sun sets behind the mountains, resuspended coarse particles settle back onto the surface, while the simultaneous afternoon traffic peak further contributes to the observed PM10 increase.
Although optical particle counters (OPCs) may partly overestimate sodium chloride concentrations (Chien et al., 2016), this example highlights the significant (and unregulated, in the current AAQD) contribution of non-exhaust emissions, and notably road salting in mountainous regions during winter, to PM pollution (McNamara et al., 2020; Grange et al., 2021). It is worth noting that these emissions are not expected to decline with the transition to electric vehicles. The example also underscores the fact that exhaust and non-exhaust traffic emissions cannot be fully captured by a single source apportionment factor.
4.4.2 Local accidental fires: August 2022
Accidental fires are typical events requiring real-time and high-temporal-resolution air quality monitoring, as they demand immediate attention from municipal surveillance bodies, the public, and the media. Since residential biomass burning contributions are negligible during the warm season (Fig. 4a), such events are relatively easy to spot in summer data. One such incident occurred on the night of 22 August 2022, when a restaurant woodshed (used for a wood-fired oven) in the city center caught fire. Although the event lasted only a few hours, it was clearly identified by a peak in the biomass burning component (Fig. 11a), demonstrating the effectiveness of the “biomass burning” source apportionment factor as a specific marker for such occurrences. Due to the uncontrolled nature of the fire, the emitted aerosol spanned a broad size range, overlapping with other factors (Fig. 11b). Given the greater mass contribution of larger-mode factors, concentrations associated in this case with the “droplet mode” peaked at a value of 80 µg m−3, i.e. nearly the total PM10 concentration, which may also reflect the presence of organic compounds within this factor.
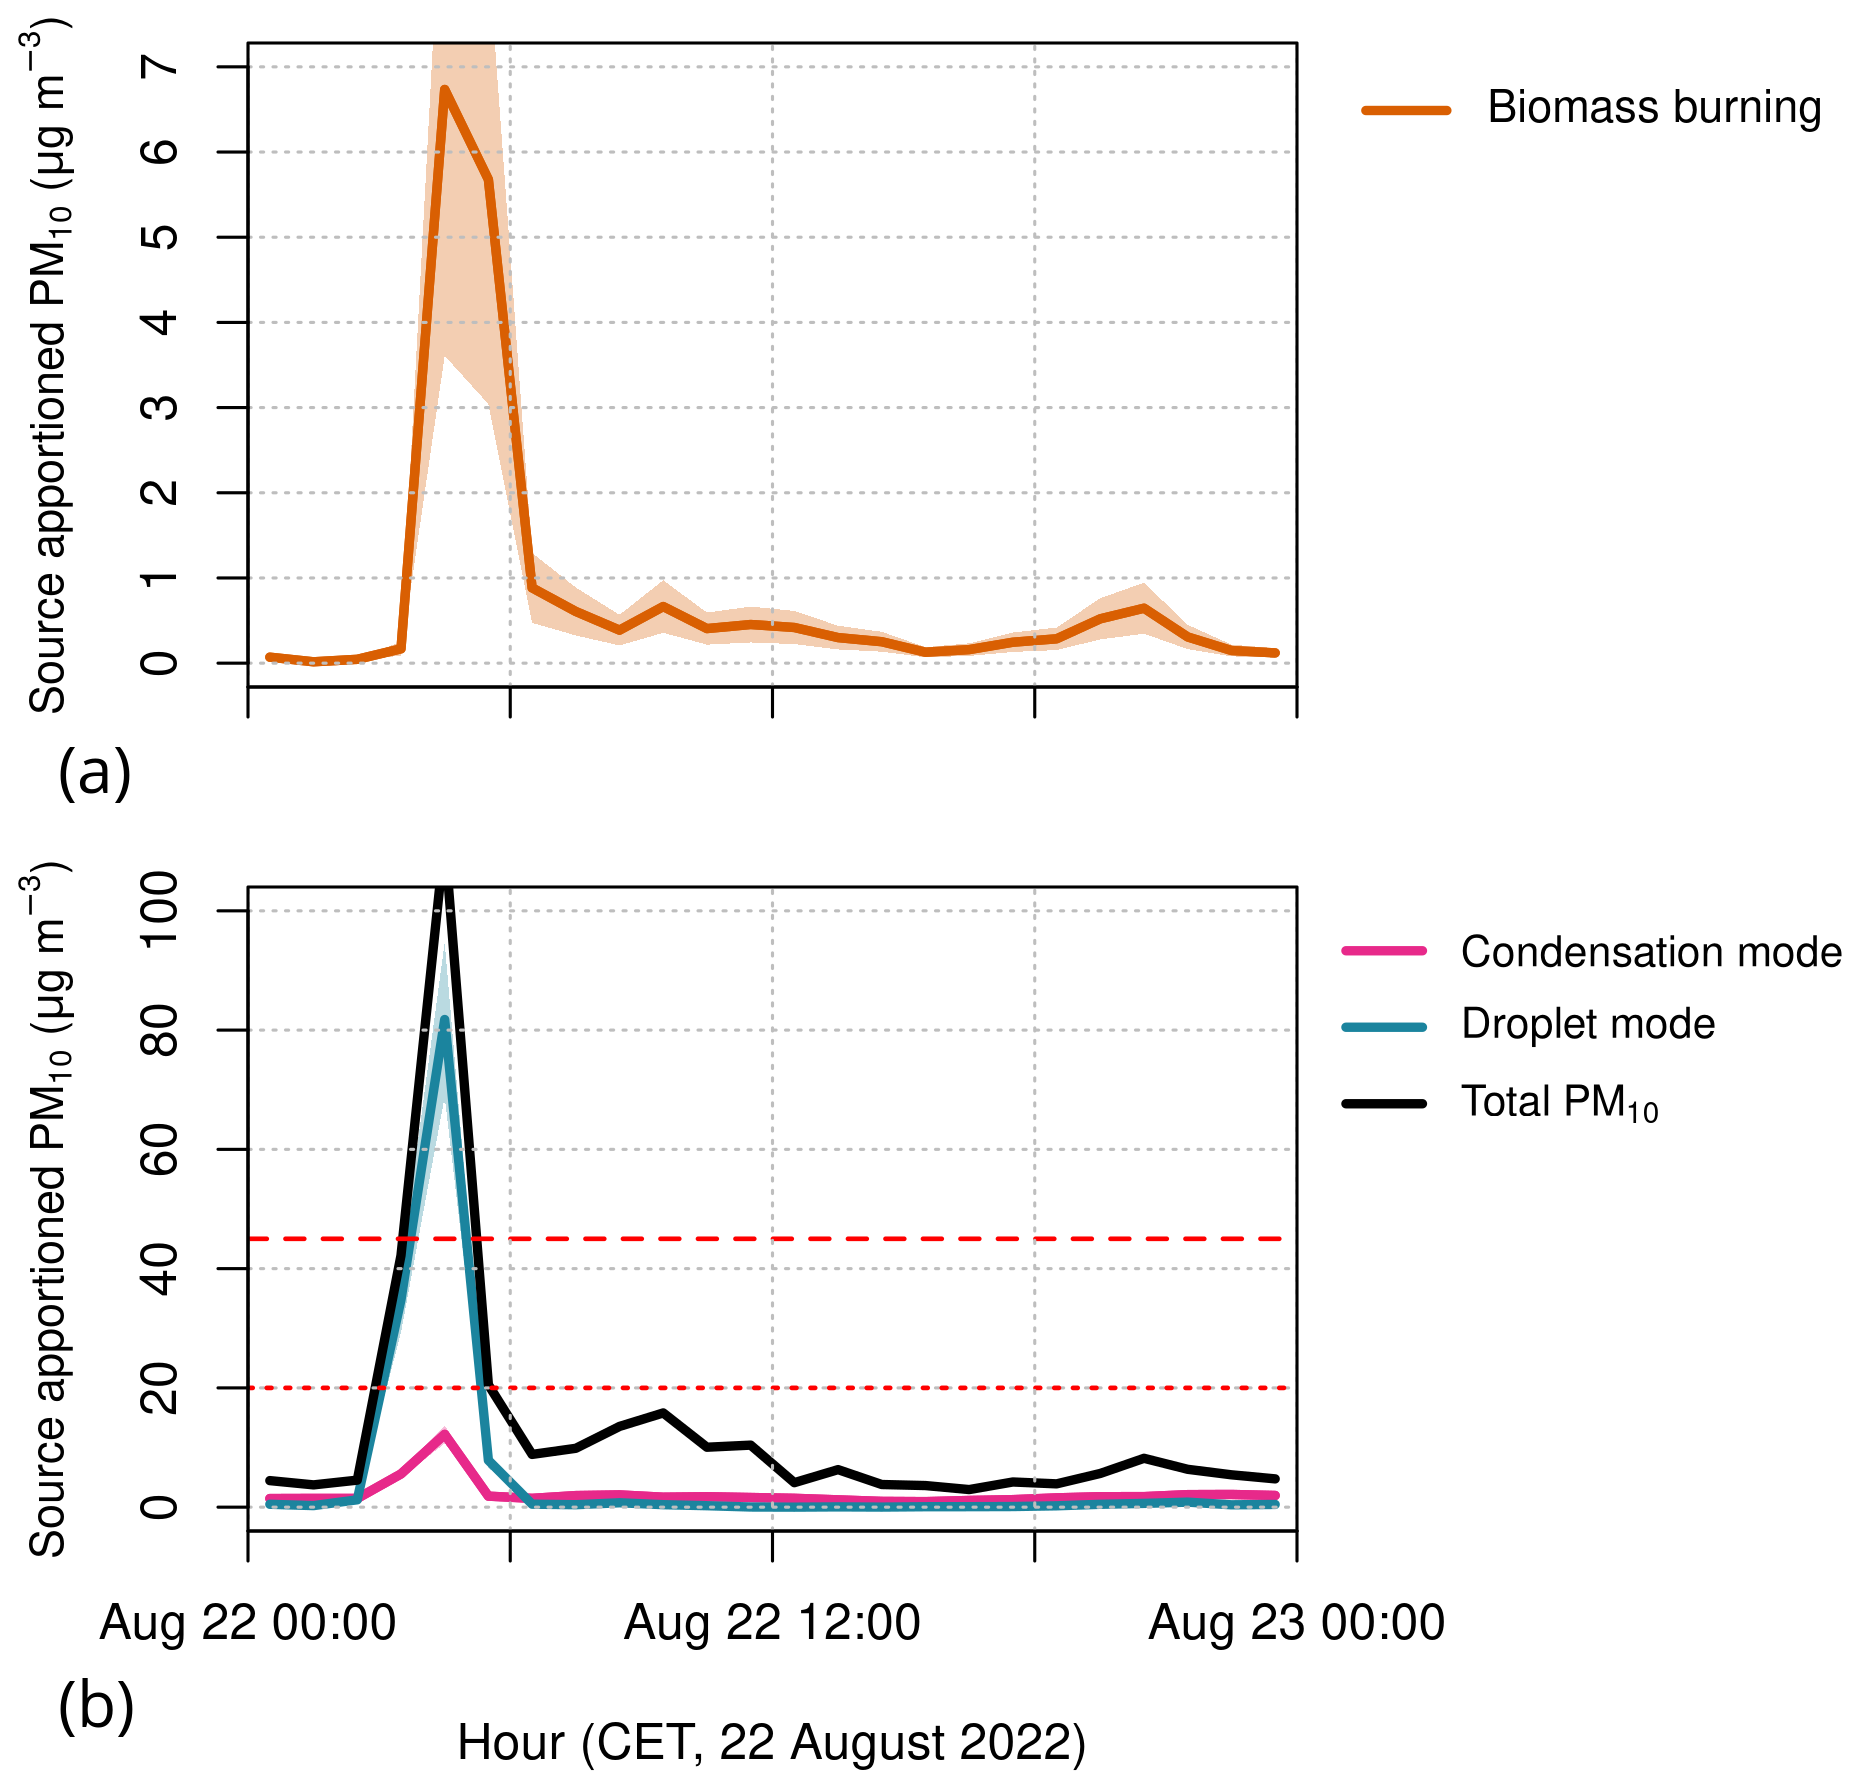
Figure 11RASPBERRY retrievals during an accidental fire in the city centre on the night of 22 August 2022. (a) The biomass burning component effectively identifies the event and defines its duration. (b) Due to the nature of the incident and the uncontrolled combustion, the emitted aerosol spans a broad size range, extending across condensation and droplet modes. Notice the different scales of the y-axes, which have been optimised for ease of visualisation. The shaded areas (most noticeable for the biomass burning factor) represent an estimate of the confidence intervals, based on the PM10 range from the DISP test (Table S2). Red horizontal lines: PM10 limit values introduced by the 2024/2881/EC AQ directive plotted as reference.
4.4.3 Advection of secondary aerosols and dust: March 2022
The mesoscale circulation between the Po Plain and the Alps frequently transports aerosol-rich air masses to the measuring site (Diémoz et al., 2019a, b), exacerbating air pollution and contributing to PM exceedances. An episode in March 2022 was especially noteworthy due to the co-occurrence of such secondary aerosol transport and Saharan dust.
Figure 12a illustrates the RASPBERRY retrievals on 17–18 March, showing desert dust contributions at the beginning and end of the period. The same dust event has been documented in other southern European countries (Micheli et al., 2024). In contrast, the middle of the episode is dominated by an increase in droplet-mode particles, characteristic of wintertime secondary aerosols, with PM10 contributions of up to 45 µg m−3. This is further supported by our chemical analyses, which indicate a daily averaged PM10 contribution from the nitrate-rich factor identified by the chemical PMF larger than 25 µg m−3 on 18 March 2022 in Aosta–Downtown. The increase in droplet mode coincides with eastern surface winds exceeding 5 m s−1, typical of the breeze circulation regime originating from the Po Basin. During the same period, secondary ammonium nitrate and possibly secondary organic aerosols were indeed detected in the Po Valley by Aktypis et al. (2024) and Mattsson et al. (2025). Heterogeneous chemical interactions with mineral dust may have also played a role. A slight increase in PM10 from condensation-mode aerosols is observed, but with much lower concentrations and a slightly different temporal pattern at the end of the episode.
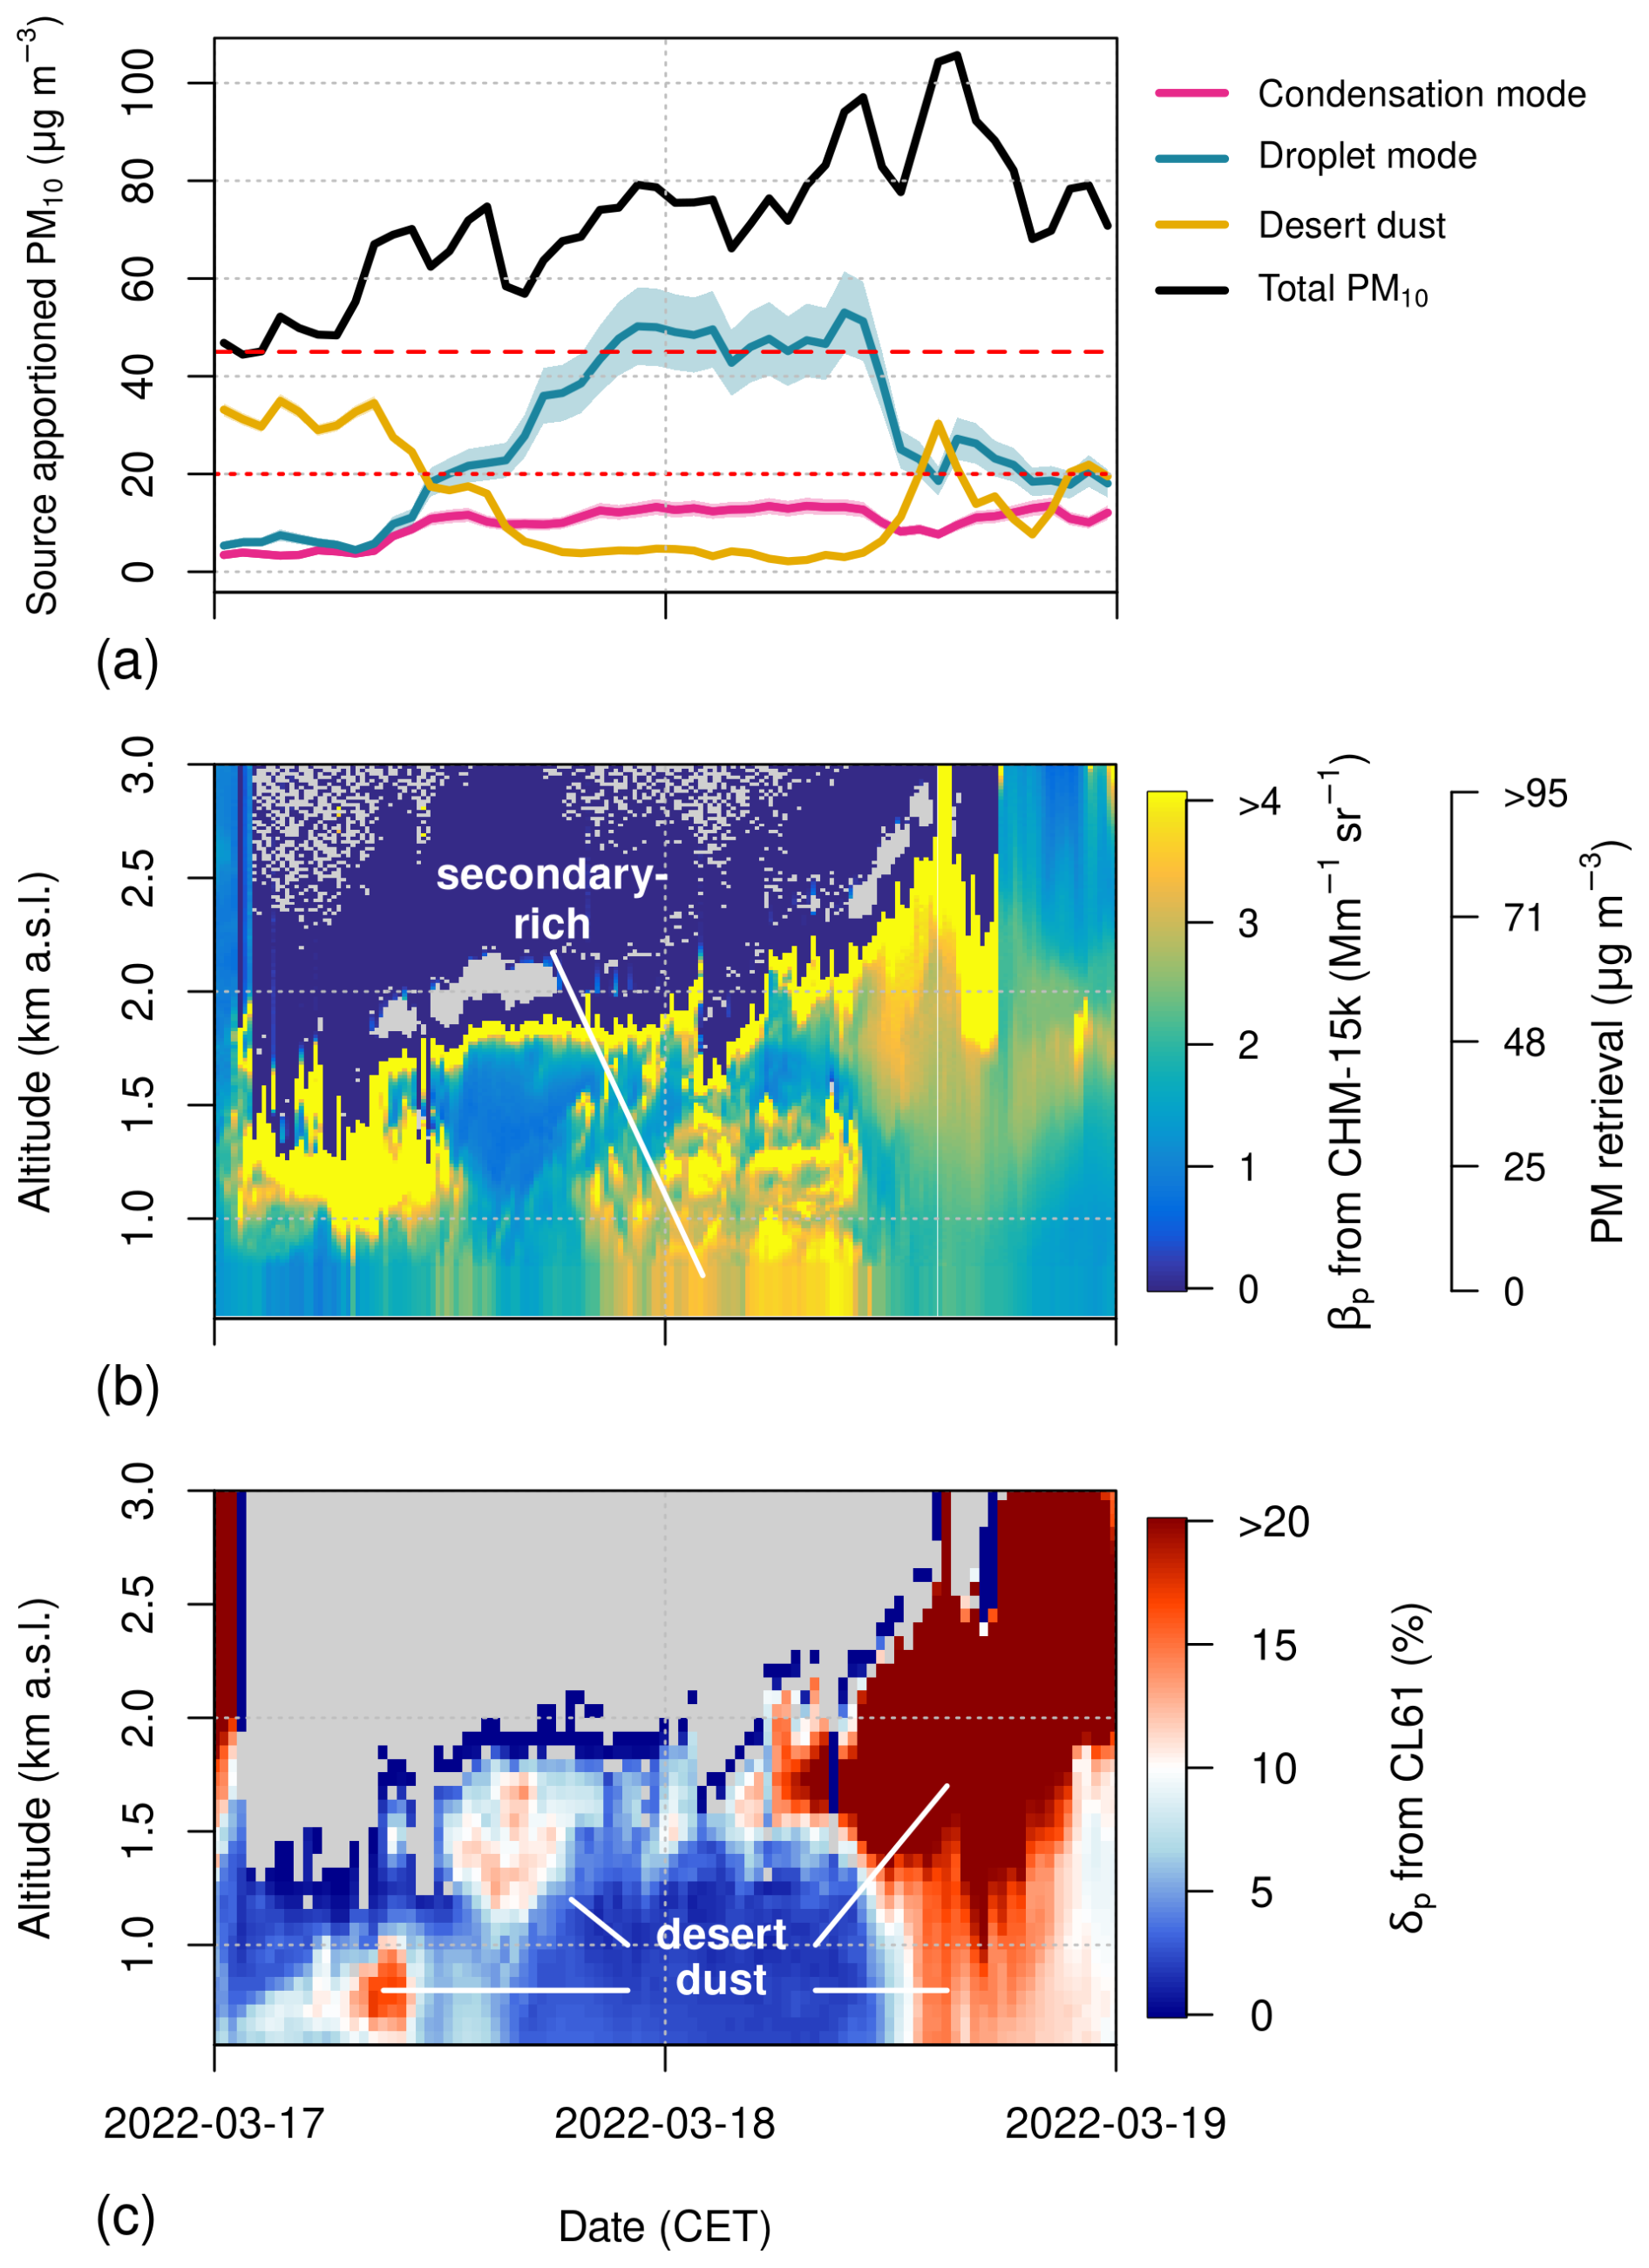
Figure 12Transport episode of secondary-rich aerosols and desert dust in March 2022. (a) PM10 contributions from the condensation mode, droplet mode and desert dust factors, derived from RASPBERRY. Red horizontal lines: PM10 limit values introduced by the 2024/2881/EC AQ directive plotted as reference. (b) Vertical profile of the particle backscatter coefficient measured by the CHM-15k ALC. The conversion to PM concentrations using the ALICENET algorithm (Bellini et al., 2024) is also shown on a secondary scale. (c) Particle depolarisation ratio from the CL61 ALC. Clouds at approximately 2 km a.s.l. prevented retrievals above that altitude for most of the episode.
The surface dynamics explained by RASPBERRY are supported by the vertical profiles from ALCs. Figure 12b reveals thick aerosol layers with high concentrations. Clouds prevented measurements above 2–2.5 km a.s.l, while also contributing to reduced mixing and increased concentrations at the surface. The vertical profiles of PM retrievals clearly show three distinct transport phases, reflecting the peaks in surface concentrations. Additionally, the depolarisation profiles (Fig. 12c) help identify the particle types throughout the episode: at the beginning and end of the episode, particles reaching the surface are irregularly shaped (medium to high depolarisation ratios), which is characteristic of mineral dust. In the middle of the episode, the particles are spherical (indicated by very low depolarisation ratios), which is typical of secondary aerosols. This episode highlights the value of physical source apportionment and active remote sensing techniques, particularly depolarisation-capable ALCs, in disentangling complex aerosol dynamics during mixed transport events.
The case of a summertime advection of secondary-rich aerosols is presented in Fig. S37. This coincides again with eastern surface winds, exceeding 8 m s−1. The RASPBERRY retrievals highlight the reversed roles of condensation (higher concentrations) and droplet mode (lower concentrations) factors compared to winter, while vertical profiles emphasise the importance of the nighttime residual layer in contributing to surface concentrations (Curci et al., 2015).
4.4.4 Smoke from North American wildfires: the summers of 2023 and 2024
In summer 2023, and to a lesser extent in 2024, record-breaking wildfires affected Canada (Jones et al., 2024; Kolden et al., 2024), and on several occasions, their smoke was transported across the North Atlantic, reaching Europe (Herrero del Barrio et al., 2024; Filonchyk and Peterson, 2024; Wang et al., 2024b). This phenomenon was accurately predicted by models (e.g., ECMWF Copernicus Atmosphere Monitoring Service, 2024) and monitored from space by satellite radiometers (EUMETSAT, 2023). For example, Fig. 13a and b present aerosol optical depth (AOD) retrieved from the Moderate-Resolution Imaging Spectroradiometer (MODIS) onboard the Terra and Aqua satellites using the MAIAC algorithm, and carbon monoxide (CO) concentrations at 500 hPa from daytime AIRS/Aqua measurements on 27 June and 22 July 2023. These data clearly reveal high concentrations of both atmospheric constituents over Europe, and notably over the Aosta Valley (marked as a star in the plots).
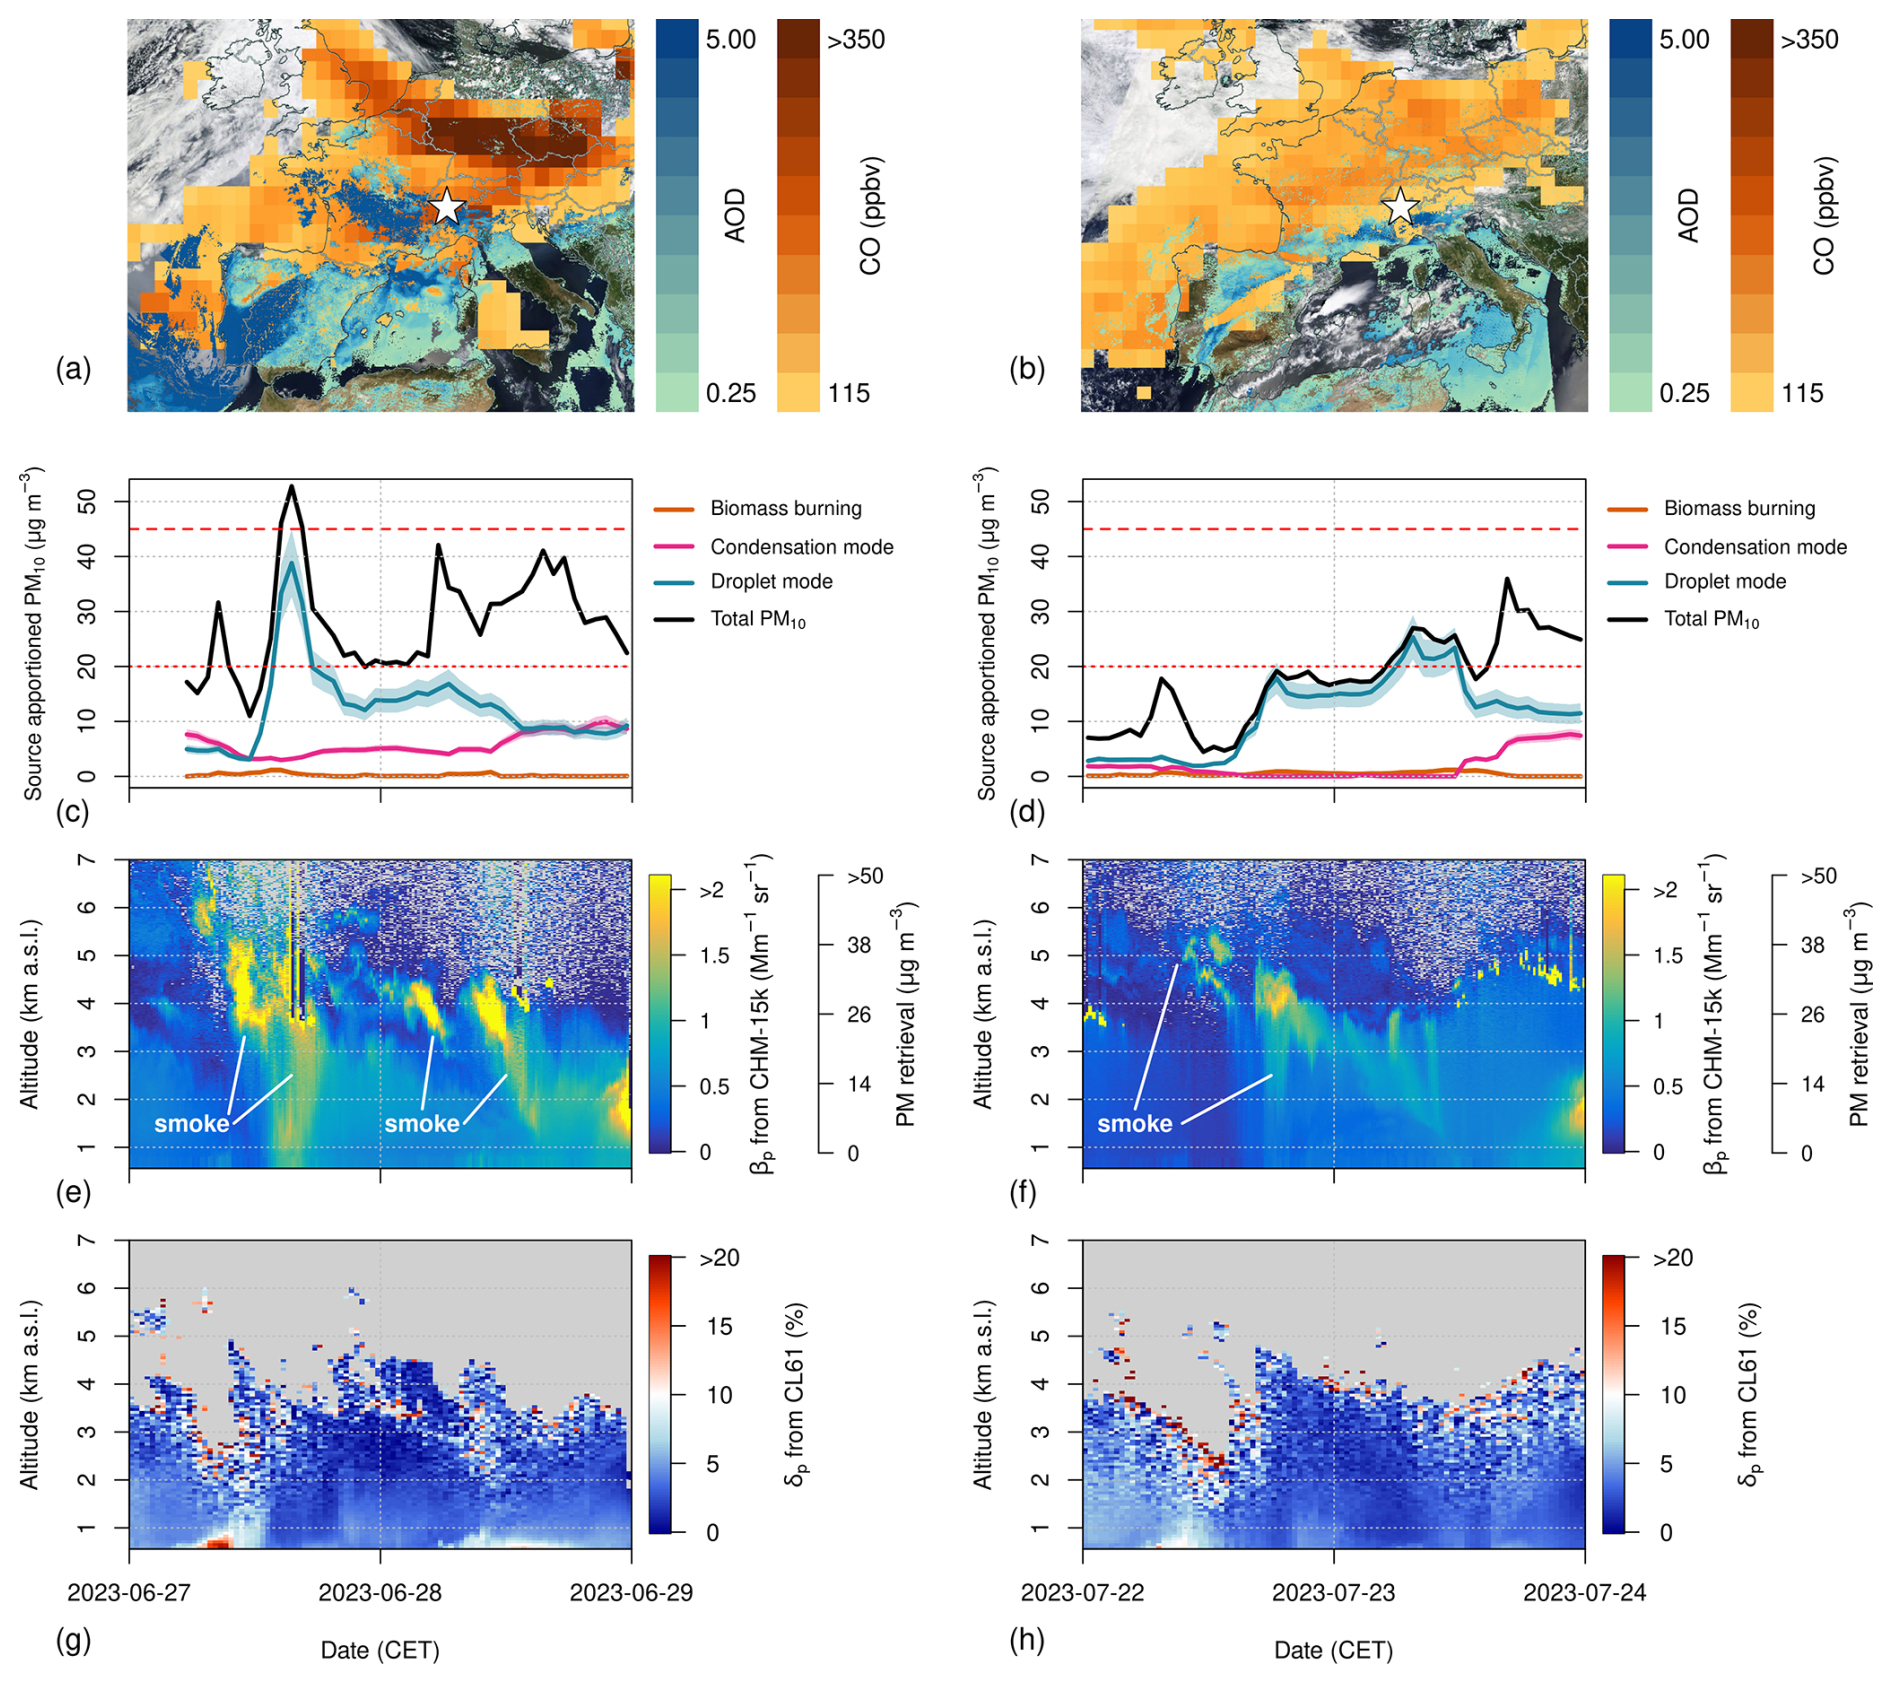
Figure 13Transport of smoke from Canada to Europe in summer 2023. (a, b) Satellite images (27 June and 22 July 2023) with background from MODIS/Terra corrected reflectance. Aosta is indicated by a star marker. Aerosol Optical Depth (AOD) at 470 nm, retrieved from the MODIS spectroradiometer onboard the Terra and Aqua satellites (MAIAC algorithm, v6.1 STD, 1 km resolution), and carbon monoxide concentrations at 500 hPa from daytime AIRS/Aqua measurements (v6 STD, L3) are superimposed using two different colour scales (source: http://worldview.earthdata.nasa.gov, last access: 2 June 2026). (c, d) PM10 contributions from the condensation and droplet modes, derived from RASPBERRY. Red horizontal lines: PM10 limit values introduced by the 2024/2881/EC AQ directive plotted as reference. (e, f) Vertical profiles of ALICENET PM retrievals, based on CHM-15k ALC particle backscatter measurements. (g, h) Particle depolarisation ratio from the CL61 ALC. Note that, in this case, the low smoke depolarisation, together with the weak signal-to-noise ratio of the CL61, limits reliable depolarisation measurements to the lowest atmospheric layers.
Sudden increases in PM10 concentrations were recorded at the surface on the same days. RASPBERRY attributed these increases to droplet-mode aerosols, which are rarely observed in summer (Fig. 4a). Conversely, the contribution by biomass burning-related aerosols and condensation mode particles remained negligible throughout the episodes (Fig. 13c and d). The attribution to the droplet mode can be explained by ageing processes during transport (Reid et al., 2005; Ditas et al., 2018). It is important to note that condensation-mode aerosols were also present in the same period but showed distinct temporal patterns modulated by mesoscale circulation. For example, on 27 June (not shown) and in the morning of 28 June 2023 (Fig. S38), winds at all altitudes over Aosta originated from the north-western quadrant. In the afternoon of 28 June 2023, the wind direction shifted to the south-eastern quadrant, with back-trajectories clearly crossing the Po Basin. This change in air masses explains the anti-correlation between droplet- and condensation-mode behaviours, likely indicating the replacement of aged smoke particles with secondary (sulfate-rich) aerosols. A similar shift in circulation occurred on 22 July 2023, after the second event.
Although confirmation of the above interpretation based on chemical properties is not possible, as no chemical analysis was conducted in 2023, the dynamics are clearly supported by ALC profiles (Fig. 13e–h) and sun photometer retrievals (discussed later). The ALC measurements show that the surface PM10 increases coincide with the rapid entrainment of elevated aerosol layers (> 4000 m a.s.l.) into the mixed layer near the surface. Not only is the timing of the droplet-mode concentration increases highly consistent, but the RASPBERRY-derived PM concentrations at the surface and those retrieved from the ALC (using the ALICENET algorithm) are of comparable magnitude (30–40 µg m−3 for the first event and approximately 20 µg m−3 for the second event). The particle depolarisation ratio measured by the CL61 ALC within the intruding layer is close to zero, further supporting the hypothesis of aged, nearly-spherical aerosols (Gialitaki et al., 2020; Damiano et al., 2024). It should be noted that aerosol depolarisation measurements obtained with the CL61 generally exhibit low signal-to-noise ratios, particularly for elevated and optically thin layers (Looschelders et al., 2025). Consequently, the highest smoke layers identified in the backscatter profiles (Fig. 13e–f) cannot be robustly characterised in terms of their depolarisation properties.
As for the measurements from the sun photometer, the AOD at 500 nm shows an increase during both events, with maximum values close to 0.8 on 27–28 June (first episode) and between 0.6 and 0.4 on 22–23 July (second episode). The extinction Ångström exponent (in the 400–1020 nm range) remains around 1.5 in both cases, never reaching the high values typical of fresh smoke from close sources. Single scattering albedo retrievals, consistently above 0.9 even at the shortest wavelengths, indicate only weak light absorption by the particles (Dubovik et al., 2002; Yang et al., 2009). The size distribution presents a maximum in the accumulation mode between 0.2 and 0.3 µm radius (i.e., 0.4–0.6 µm diameter), thus validating – on average along the atmospheric column – the particle size detected at the surface by the Palas Fidas and explaining the concentration increase in the droplet mode observed by the algorithm. These sizes are larger compared to the condensation mode usually present in summer (0.2–0.3 µm diameter), but are very consistent with published studies on aged smoke (Eck et al., 2009; González et al., 2020) and notably on the same transport episode over Europe (Herrero del Barrio et al., 2024). In both episodes, neither the sun photometer nor the ALC provides evidence of other long-range transport phenomena such as desert dust.
A similar event occurred in August 2024 (Sect. S21 and Fig. S39) during an aerosol sampling campaign at high-altitude mountain stations in the Aosta Valley. Chemical analyses revealed a notable increase in organic compounds but negligible variation in secondary inorganics, and will be the subject of a future publication (Favaro et al., 2025).
Interestingly, in all cases, droplet-mode PM10 concentrations do not immediately return to baseline levels in the days following the peak, in contrast to their rapid initial increase. This persistence suggests that, once smoke has entered the mixed aerosol layer, it recirculates for several days before fully settling at the surface and being removed from the atmosphere, potentially posing implications for human health.
After outlining the strengths of the method in the previous sections, we now discuss its main limitations and provide recommendations for users interested in reproducing the experimental setup.
The main shortcomings originate from both instrument-specific issues and the combined analysis using multiple instruments:
-
Technical instrument limitations. As noted in Sect. 1, OPC measurements may be influenced by particle refractive index and morphology. Additionally, a general limitation of OPCs is their finite lower detection size. In our case, the Palas Fidas 200 provides measurements only for particles larger than 0.18 µm. Consequently, the contribution of smaller particles to PM10 mass must be inferred by the OPC algorithm based on concentrations in larger bins. Although these particles are expected to have a minor impact on PM10 mass in Aosta due to their small volume, this limitation introduces some uncertainties, particularly when analysing emission sources at sites dominated by fine modes, such as traffic, residential biomass burning, and secondary aerosols in condensation mode.
In this regard, we note that the “training” phase of our algorithm can incorporate PM10 estimates from any instrument, not necessarily the same OPC providing the size distribution, provided that the reference dataset is sufficiently long to ensure robust statistics. Thus, the accuracy of our method strongly depends on that of the reference PM instrument, and if a better reference instrument is available, the original PM estimates from the OPC can be further improved. In principle, measurements with the gravimetric method could be used for this purpose. However, in such a case, the hourly observations from the OPC and the aethalometer would need to be degraded to the same time resolution as the gravimetric estimates (e.g., daily) before regression against mass, unless more advanced statistical techniques (e.g., multi-time PMF) are employed. Moreover, long-term gravimetric datasets covering different seasons would be required.
On the other hand, even short-term comparisons (e.g. a few weeks) between the OPC and a reference PM10 instrument can be beneficial, albeit outside the scope of a thorough algorithm calibration. Such comparisons enable the identification of potential scenarios where OPC-derived PM estimates may be inaccurate depending on the dominant particle type. These include cases involving irregularly shaped desert dust particles, significant contributions from particles smaller than the OPC detection limit, or aerosols with refractive indices that differ significantly from the calibration assumptions. In these circumstances, the RASPBERRY approach, by differentiating among aerosol types, could be employed to identify situations where PM estimates may be unreliable.
-
Potential circularity in PM10 estimates. This issue is directly linked to the previous discussion. In this study, due to the absence of an independent PM10 reference instrument, the Palas Fidas 200 was used both to provide the size distribution and to estimate PM mass concentration (certified as equivalent to the gravimetric method). Consequently, these two quantities are not entirely independent, as the proprietary
PM_ENVIRO_0011OPC algorithm determines PM concentrations from the size distribution using a methodology presumably similar to ours. One might argue that, without incorporating light absorption properties, the training phase of our source apportionment method would merely invert the internal OPC algorithm. However, as explained earlier, our approach can be applied using independent PM10 reference instruments, thereby preventing circularity on a general basis. -
Incomplete overlap between instruments. The OPC lower detection limit falls within the accumulation mode, whereas the aethalometer primarily detects light-absorbing aerosols, which are predominantly submicron in size. The larger the gap between the particle size ranges covered by the two instruments, the more significant this issue becomes. In the worst case, the PMF used during the training phase, based on OPC-derived size distributions and aethalometer spectral light absorption, could fail to attribute volume and mass to the traffic and biomass burning factors. Fortunately, in our case, the overlap appears sufficient to mitigate this issue and to allow the two instruments to function in synergy. Otherwise, co-located measurements of ultrafine particles should be considered.
-
Limitations of the aethalometer model. Cases where the aethalometer model (Sandradewi et al., 2008) fails have been reported in the literature, particularly for fresh emissions from traffic (Zotter et al., 2017) or wood burning (Grange et al., 2020). One such case in our study, discussed in Sect. 4.2.1, likely resulted in a weak interference between the traffic and biomass burning factors. In such situations, potential solutions include introducing an additional factor in the PMF to account for fresh emissions or manually adjusting the AAE coefficients based on independent analyses. However, this remains an inherent limitation of source apportionment approaches relying on spectral light absorption properties, rather than a RASPBERRY-specific issue.
-
Source definition. In PMF, the operator plays a key role in defining and shaping factor profiles and assigning them to specific sources. For instance, setting the uncertainties or applying constraints to improve profile separation are critical steps. Some flexibility exists in constraining profiles; for example, as discussed in Sect. S10, we opted not to suppress crustal particles in the traffic profile or modify it towards a more “traffic exhaust” profile. Regardless of the adopted strategy, ensuring consistency between the physical and chemical apportionments is crucial in such cases. Nevertheless, while these issues are important, they are intrinsic to the PMF method rather than specific limitations of our approach.
-
Stationarity of source profiles. In this study, a single PMF analysis was conducted on the entire dataset, encompassing all seasons without distinction. However, several studies highlight the importance of applying PMF separately for each season (Ogulei et al., 2007; Yue et al., 2008; Masiol et al., 2017b; Vörösmarty et al., 2024) or even time of the day (Bhandari et al., 2022) to account for changes in emissions and factor profiles due to environmental and human activity patterns. Another approach is the rolling PMF (Parworth et al., 2015; Via et al., 2022), where a subset of the data is processed in a moving time window. While application of such techniques may be critical for ultrafine particles, which are highly sensitive to ambient conditions and exhibit rapid modal shifts (Zhou et al., 2004; Gu et al., 2011; Wang et al., 2013; Beddows et al., 2014; Vu et al., 2015; Masiol et al., 2017a; Rivas et al., 2020), accumulation-mode and coarse-mode aerosols are likely less affected by such variations.
In this regard, in our study, we prioritised a straightforward methodology. However, for the sake of completeness, we also explored seasonal PMF as a supplementary analysis (Sect. S8). To this end, four separate datasets, each containing 4000 random samples, were reprocessed using the same PMF configuration and constraints as the year-round PMF. This approach yielded unsatisfactory results, with high rotational ambiguity and insufficient zeros leading to instability, particularly in winter and summer. Moreover, as noted by Rivas et al. (2020), seasonal splitting can introduce artificial discontinuities between adjacent periods. For these reasons, we primarily adopted a year-round PMF approach.
Another limitation of using fixed source profiles is unsuitability for assessing long-term trends. Genuine changes in emission sources over time, such as variations in vehicle fleets, fuel types, or residential heating practices, as well as instrumental drifts could affect the measured size distribution and light absorption properties of aerosols (e.g., Grange et al., 2020), potentially leading to less accurate retrievals. More advanced approaches exist that allow a certain degree of flexibility in the profiles (e.g. the multilinear engine implemented in SoFi), but the objective of the present study was to introduce a simple and easily reproducible methodology. In practice, the impact of potential profile variability can be assessed a posteriori using regression-based diagnostics to evaluate the quality of the fit. These metrics allow the identification of situations in which the prescribed profiles are not fully (or no more) representative of the observations. Instrumental sensitivity changes must also be carefully monitored and corrected, ideally through regular comparisons with alternative techniques (e.g., EC measurements using the thermo-optical transmission method against NeBC from the aethalometer). In our case, no systematic degradation of the fit quality was observed as a function of season or over the 5-year study period, suggesting that the assumption of stable profiles is reasonable for the dataset analysed here. When PM mass is not the only focus, a complementary approach, as already mentioned above, is to incorporate additional in situ aerosol measurements using more comprehensive instrumentation (e.g. extending particle size detection to the nucleation mode), thereby providing enhanced training datasets for the RASPBERRY algorithm and improving the detection of trends in particle size distributions.
Another important consideration concerns the effective uncertainty associated with RASPBERRY retrievals. Although a strict propagation of uncertainties from the source profiles alone (PM10 component from the DISP test) or from both the profiles and the measured data (RASPBERRY+EVLS; Sect. 3.3) to the RASPBERRY retrievals could suggest that the method is capable of providing estimates with an accuracy better than 1 µg m−3, the uncertainty intrinsic to the method itself must also be taken into account. Based on our systematic daily evaluation of the source apportionment results, we estimate the sensitivity of the hourly PM10 retrievals to be on the order of a few µg m−3 (≲ 5 µg m−3). Contributions below this threshold should therefore be interpreted with caution, as they may not reliably indicate the actual presence of the corresponding aerosol type. In practice, minor interferences between factors or the leakage of particles that are not fully represented by a single source profile may occur. Conversely, as demonstrated in the second part of this article, hourly concentrations exceeding this threshold are associated with genuine atmospheric events and are supported by independent measurement techniques.
We conclude this section with several recommendations for users interested in applying a method similar to the one described here:
-
We recommend using OPCs with a minimum detection size of 200 nm or smaller. If this condition is not met, the overlap between particles detected by the OPC and the aethalometer may be too small, or even absent, potentially leading to instability in the solution. Additionally, depending on the instrument used as the reference for PM measurements and the dominant particle type at the measuring site, PM estimates with a high fraction of submicron particles could be inaccurate if the minimum detection size is too large.
-
To address this, measurements of ultrafine particles – recently made compulsory for supersites under the revised European Ambient Air Quality Directive (down to particle diameters of 10 nm) – may be beneficial to ensure that the full particle size spectrum is captured (Yue et al., 2008). Even the use of simple condensation particle counters to determine the total particle number concentration could help compensate for the “missing” ultrafine fraction not detected by the OPC. Although instruments operating in different particle size ranges rely on distinct counting techniques and size definitions, perfect continuity between instruments is not essential in this case. Indeed, our method is based on relative variations within each size distribution bin rather than absolute values.
-
We also found that the maximum detection diameter is an important factor. Measurements extending slightly beyond 10 µm, yet still within the efficiency curve of standardised PM10 sampling inlets (with a 50 % cut-off at 10 µm), proved useful for distinguishing local resuspension from desert dust transport. This confirms earlier suggestions (Yue et al., 2008) that including larger particle sizes (10–20 µm) might be helpful to detect and separate mechanically generated coarse-mode aerosols.
-
We believe that the main advantage of RASPBERRY is its ability to provide source apportionment with high time resolution and reduced effort compared to chemical methods. However, it should not be viewed as a simple alternative to aerosol chemical characterisation. Instead, we strongly recommend careful comparison of the physical and chemical source apportionment results, both during the initial algorithm training phase and at regular intervals during routine operation to ensure that instrument sensitivities or source characteristics have not significantly changed. Ideally, such comparisons should be conducted across different seasons and atmospheric conditions.
-
Difficulties in obtaining a stable solution for physical source apportionment, such as unpredictable profile variations depending on the selected input uncertainties (e.g., Sect. S7), may arise due to limited overlap between instruments for small particles and independent random measurement errors for different instruments. This can lead to unrealistically small contributions from traffic emissions and residential biomass burning, as observed by Forello et al. (2023), or excessive uncertainty ranges in the DISP test. If the user is not concerned with maintaining the independence of chemical and physical apportionment, model parameters or input uncertainties could be adjusted to align the results of both approaches. Alternative techniques to estimate approximate traffic and biomass burning contributions to PM10 without relying on chemical analyses, based solely on aethalometer data and empirical coefficients, are documented in the scientific and technical literature (Aujay-Plouzeau, 2020). These methods may serve as an initial check, although they do not provide an accurate validation reference.
-
Finally, users should implement and routinely assess quality metrics for the source apportionment results. These metrics could include calculating, for each retrieval, the variable Q (Sect. 3.1) by comparing the original and reconstructed size distribution and spectral absorption coefficient. At a minimum, the difference between the original and reconstructed PM10 mass concentration should be evaluated. Significant discrepancies, or even negative regression values, could provide valuable insights into special conditions where aerosol types not included in the training phase may be present.
Based on the initial objectives outlined in Sect. 1, we can draw the following conclusions:
-
We have developed a new method, named RASPBERRY, based on measurements of aerosol physical properties and simple, reproducible steps, to provide source-apportioned PM10 concentrations at high temporal resolution (e.g., 1 h). It consists of two phases: (i) training the algorithm on a random subset of the available “physical” data using the well-known and freely available US EPA PMF5 software; (ii) fitting the measured size distributions and spectral absorption coefficients with the PMF profiles. This second step, based on simple algebraic operations, can be adapted for real-time implementation, making RASPBERRY a valuable tool for air quality monitoring networks. As shown in the presented case studies, the available high time resolution enhances the understanding of the diurnal variability of emissions and sensitivity of PM concentrations to meteorological patterns, also facilitating the application of various normalisation techniques based on meteorological data (Grange and Carslaw, 2019; Dai et al., 2020). Even when more advanced instruments for online chemical analyses are available, such as aerosol chemical speciation monitors, the presented technique serves as a simple yet effective backup tool for cross-validation, or to provide information on particles larger than 1–2.5 µm, i.e. beyond the size covered by such instruments.
-
At the core of the method are physical aerosol properties obtained at high temporal resolution from automated optical instruments. We have shown that particle size distributions in the accumulation and coarse modes, measured by optical particle counters, and light absorption properties from aethalometers provide valuable information for identifying both local and remote PM10 sources. In particular, using cost-effective OPCs, we obtained results comparable to those of studies employing more advanced instrumentation, such as the aerodynamic particle sizer (Gu et al., 2011). Thus, we consider OPCs, routinely used by environmental and air quality agencies to estimate PM concentrations, to be an important yet undervalued and underutilised data source. To maximise the information derived from these devices, users should retain the full size distribution rather than solely the PM concentration estimates.
-
The robustness of the technique was demonstrated through its application to a multi-year, hourly resolved dataset collected at the urban valley station of Aosta, Italy. This long-term (5 years) application represents a distinctive trait of the present work compared to most published studies, which typically focus on shorter-term campaigns. The algorithm successfully identified six source factors: traffic, residential biomass burning, two secondary factors (condensation and droplet modes), desert dust, and locally resuspended coarse particles. The respective contributions to PM10 were compared with those obtained from a traditional PMF based on daily averaged chemical data, yielding high correlation coefficients. Moreover, factorisation based on physical data showed greater stability and lower uncertainty than that based on chemical data.
Among the various applications, the proposed method can complement other techniques to identify natural PM sources and quantifying their contribution to PM metrics, helping in their exclusion from regulatory exceedance considerations in accordance with the EU Commission AQ Directive. For example, based on RASPBERRY desert dust estimates and the limit values defined by the new 2024 AAQD, 22 out of the 36 PM10 daily exceedances recorded in Aosta–Downtown during the 5-year study period could be excluded from the count due to natural contributions. Moreover, although further adaptations are required for long-term analyses, the method is already applicable for improving source inventories and air quality models.
Additionally, we highlighted the value of ground-based remote sensing techniques, such as sun photometry and automated lidar-ceilometers, in air quality applications. The synergy between the new source apportionment method and these remote sensing techniques enabled a more comprehensive interpretation of the observed phenomena, including medium- to long-range transport events.
Several developments and improvements will be pursued in future studies. First, the method is currently being tested at another station in southern Italy, which features a more complex mix of aerosol sources (Mapelli et al., 2026). At this second site, ultrafine particle measurements using a scanning mobility particle sizer are also being conducted to facilitate the interpretation of the results and extend the explored size range.
An important aspect to note in this study is that chemical data were used independently of physical data to provide a reference dataset for validating the new method. A natural progression would be to integrate dimensional, optical absorption, and chemical information into a unified approach. To preserve the original resolutions of the various techniques and maximise the available information, a multi-time PMF approach would be required.
Finally, a valuable improvement would be the inclusion of aerosol scattering properties, measured using nephelometers, alongside spectral absorption measurements. This would offer additional insights into the presence of non-light-absorbing aerosols, such as those formed through secondary processes.
Efficient source apportionment techniques are critical for air quality applications and regulatory efforts in the context of the new EU Air Quality directive, as they allow policymakers to assess the impact of measures not only on particulate matter as a whole but also on individual sources. Indeed, while abatement policies have been effective for traffic exhaust emissions and industrial pollution (Rovira et al., 2025), other sources, such as biomass burning and non-exhaust traffic emissions, remain largely unregulated. In this regard, by using only data from automated instrumentation, RASPBERRY expands spatial coverage of source information as it can be applied across all stations equipped with suitable instruments. The methodology has potential applications in other scientific domains, such as improving the understanding of the health effects of different aerosol types, particularly when integrated with health metrics like oxidative potential, and refining the modelling of radiative effects for each aerosol species.
RASPBERRY and RASPBERRY+EVLS code and the data described in this manuscript can be freely accessed at https://doi.org/10.5281/zenodo.20174876 (Diémoz, 2026).
The supplement related to this article is available online at https://doi.org/10.5194/amt-19-3625-2026-supplement.
Henri Diémoz: Conceptualisation, Methodology, Formal analysis, Visualisation, Writing – original draft. Francesca Barnaba: Conceptualisation, Methodology, Writing – review & editing. Luca Ferrero: Conceptualisation, Methodology, Writing – review & editing. Ivan K. F. Tombolato: Conceptualisation, Methodology. Caterina Mapelli: Writing – review & editing, Validation. Annachiara Bellini: Data curation, Investigation. Claudia Desandré: Data curation, Resources. Tiziana Magri: Data curation, Investigation. Manuela Zublena: Supervision, Funding acquisition.
The contact author has declared that none of the authors has any competing interests.
Publisher's note: Copernicus Publications remains neutral with regard to jurisdictional claims made in the text, published maps, institutional affiliations, or any other geographical representation in this paper. The authors bear the ultimate responsibility for providing appropriate place names. Views expressed in the text are those of the authors and do not necessarily reflect the views of the publisher.
We would like to thank F. Joly, D. Panont and M. Pignet for their invaluable work in ensuring the continuous and accurate collection of data at the ARPA air quality stations, the laboratory staff for their chemical analyses, and C. Tarricone (European Commission, Joint Research Centre) for her valuable assistance. The authors gratefully acknowledge the NOAA Air Resources Laboratory (ARL) for providing the HYSPLIT transport and dispersion model used in this study. L. Ferrero is an outcome of the GEMMA Centre, in the framework of Project MUR – Dipartimenti di Eccellenza 2023–2027. This research benefited from discussions within the CAMS National Collaboration Programme – Italy bis Third Edition (CAMS2_72IT_bis), funded by the European Centre for Medium-Range Weather Forecasts (ECMWF), and aligns with its thematic priorities. We sincerely thank the three anonymous reviewers, whose comments helped improve and clarify this manuscript.
This paper was edited by Omar Torres and reviewed by three anonymous referees.
Aan de Brugh, J. M. J., Henzing, J. S., Schaap, M., Morgan, W. T., van Heerwaarden, C. C., Weijers, E. P., Coe, H., and Krol, M. C.: Modelling the partitioning of ammonium nitrate in the convective boundary layer, Atmos. Chem. Phys., 12, 3005–3023, https://doi.org/10.5194/acp-12-3005-2012, 2012. a
Aas, W., Tsyro, S., Bieber, E., Bergström, R., Ceburnis, D., Ellermann, T., Fagerli, H., Frölich, M., Gehrig, R., Makkonen, U., Nemitz, E., Otjes, R., Perez, N., Perrino, C., Prévôt, A. S. H., Putaud, J.-P., Simpson, D., Spindler, G., Vana, M., and Yttri, K. E.: Lessons learnt from the first EMEP intensive measurement periods, Atmos. Chem. Phys., 12, 8073–8094, https://doi.org/10.5194/acp-12-8073-2012, 2012. a
Agnesod, G., De Maria, R., Fontana, M., and Zublena, M.: Determination of PAH in airborne particulate: comparison between off-line sampling techniques and an automatic analyser based on a photoelectric aerosol sensor, Sci. Total Environ., 189-190, 443–449, https://doi.org/10.1016/0048-9697(96)05244-8, 1996. a
Aktypis, A., Sippial, D. J., Vasilakopoulou, C. N., Matrali, A., Kaltsonoudis, C., Simonati, A., Paglione, M., Rinaldi, M., Decesari, S., and Pandis, S. N.: Formation and chemical evolution of secondary organic aerosol in two different environments: a dual-chamber study, Atmos. Chem. Phys., 24, 13769–13791, https://doi.org/10.5194/acp-24-13769-2024, 2024. a
Allen, G. A., Miller, P. J., Rector, L. J., Brauer, M., and Su, J. G.: Characterization of Valley Winter Woodsmoke Concentrations in Northern NY Using Highly Time-Resolved Measurements, Aerosol Air Qual. Res., 11, 519–530, https://doi.org/10.4209/aaqr.2011.03.0031, 2011. a
Amodeo, T.: Guide méthodologique pour la surveillance des PM10 et PM2,5 dans l'air ambiant par FIDAS, 219635-2767795, v1.0, Tech. rep., Ineris, https://www.lcsqa.org/system/files/media/documents/LCSQA2023-Guide%20m%C3%A9thodologique%20pour%20la%20surveillance%20des%20PM10%20et%20PM2%2C5%20dans%20l%27air%20ambiant%20par%20FIDAS%20v1.pdf (last access: 2 June 2026), 2023. a
Amodeo, T.: Méthode de validation pour la mise en œuvre des analyseurs automatiques de PM par diffusion de la lumière. Retour d'expérience des tests de mises en œuvre du FIDAS et définition d'une méthode de validation, 219632-2789152, v1.0, Tech. rep., Ineris, https://www.lcsqa.org/system/files/media/documents/LCSQA2023-FIDAS_Retour%20d%27exp%C3%A9rience_d%C3%A9finition%20de%20crit%C3%A8re%20de%20validation%20des%20tests%20de%20mise%20en%20oeuvre_v2.pdf (last access: 2 June 2026), 2024. a
Aster, R. C., Borchers, B., and Thurber, C. H.: Parameter estimation and inverse problems, 3rd edn., Elsevier, Amsterdam, Netherlands, ISBN 9780128046517, 2019. a
Aujay-Plouzeau, R.: Guide méthodologique pour la mesure du “Black Carbon” par Aethalomètre multi longueur d'onde AE33 dans l'air ambiant (Version 2020), Tech. rep., Ineris, https://www.lcsqa.org/system/files/media/documents/LCSQA2019-Guide_mesure_BlackCarbon_par_AE33_VF03-Approuv%C3%A9CPS15122020.pdf (last access: 2 June 2026), 2020. a
Balestrini, R., Diémoz, H., Freppaz, M., Delconte, C., Caschetto, M., and Matiatos, I.: Nitrogen atmospheric deposition in a high-altitude Alpine environment: A chemical and isotopic approach to investigate the influence from anthropized areas, Atmos. Environ., 328, 120513, https://doi.org/10.1016/j.atmosenv.2024.120513, 2024. a
Barnaba, F. and Gobbi, G. P.: Aerosol seasonal variability over the Mediterranean region and relative impact of maritime, continental and Saharan dust particles over the basin from MODIS data in the year 2001, Atmos. Chem. Phys., 4, 2367–2391, https://doi.org/10.5194/acp-4-2367-2004, 2004. a
Barnaba, F., Bolignano, A., Di Liberto, L., Morelli, M., Lucarelli, F., Nava, S., Perrino, C., Canepari, S., Basart, S., Costabile, F., Dionisi, D., Ciampichetti, S., Sozzi, R., and Gobbi, G. P.: Desert dust contribution to M10 loads in Italy: Methods and recommendations addressing the relevant European Commission Guidelines in support to the Air Quality Directive 2008/50, Atmos. Environ., 161, 288–305, https://doi.org/10.1016/j.atmosenv.2017.04.038, 2017. a, b
Barnaba, F., Alvan Romero, N., Bolignano, A., Basart, S., Renzi, M., and Stafoggia, M.: Multiannual assessment of the desert dust impact on air quality in Italy combining PM10 data with physics-based and geostatistical models, Environ. Int., 163, 107204, https://doi.org/10.1016/j.envint.2022.107204, 2022. a
Barreira, L. M., Aurela, M., Saarikoski, S., Li, D., Teinilä, K., Virkkula, A., Niemi, J. V., Manninen, H., Pirjola, L., Petäjä, T., Rönkkö, T., and Timonen, H.: Characterizing winter-time brown carbon: Insights into chemical and light-absorption properties in residential and traffic environments, Sci. Total Environ., 955, 177089, https://doi.org/10.1016/j.scitotenv.2024.177089, 2024. a
Beddows, D., Brean, J., Rowell, A., Merkel, M., Weinhold, K., Dall'Osto, M., and Harrison, R.: Wide-Positive Matrix Factorisation of particle number size distributions: A new approach accounting for cyclically changing source profiles, Sci. Total Environ., 998, 180231, https://doi.org/10.1016/j.scitotenv.2025.180231, 2025. a
Beddows, D. C. S. and Harrison, R. M.: Receptor modelling of both particle composition and size distribution from a background site in London, UK – a two-step approach, Atmos. Chem. Phys., 19, 4863–4876, https://doi.org/10.5194/acp-19-4863-2019, 2019. a, b, c
Beddows, D. C. S., Dall'Osto, M., Harrison, R. M., Kulmala, M., Asmi, A., Wiedensohler, A., Laj, P., Fjaeraa, A. M., Sellegri, K., Birmili, W., Bukowiecki, N., Weingartner, E., Baltensperger, U., Zdimal, V., Zikova, N., Putaud, J.-P., Marinoni, A., Tunved, P., Hansson, H.-C., Fiebig, M., Kivekäs, N., Swietlicki, E., Lihavainen, H., Asmi, E., Ulevicius, V., Aalto, P. P., Mihalopoulos, N., Kalivitis, N., Kalapov, I., Kiss, G., de Leeuw, G., Henzing, B., O'Dowd, C., Jennings, S. G., Flentje, H., Meinhardt, F., Ries, L., Denier van der Gon, H. A. C., and Visschedijk, A. J. H.: Variations in tropospheric submicron particle size distributions across the European continent 2008–2009, Atmos. Chem. Phys., 14, 4327–4348, https://doi.org/10.5194/acp-14-4327-2014, 2014. a, b
Beddows, D. C. S., Harrison, R. M., Green, D. C., and Fuller, G. W.: Receptor modelling of both particle composition and size distribution from a background site in London, UK, Atmos. Chem. Phys., 15, 10107–10125, https://doi.org/10.5194/acp-15-10107-2015, 2015. a, b, c, d, e
Belis, C., Favez, O., Mircea, M., Diapouli, E., Manousakas, M., Vratolis, S., Gilardoni, S., Paglione, M., Decesari, S., Mocnik, G., Mooibroek, D., Salvador, P., Takahama, S., Vecchi, R., and Paatero, P.: European guide on air pollution source apportionment with receptor models, EUR 29816 EN, Publications Office of the European Union, Luxembourg, JRC117306, ISBN 978-92-76-09001-4, https://doi.org/10.2760/439106, 2019. a, b, c, d, e
Bellini, A., Diémoz, H., Di Liberto, L., Gobbi, G. P., Bracci, A., Pasqualini, F., and Barnaba, F.: ALICENET – an Italian network of automated lidar ceilometers for four-dimensional aerosol monitoring: infrastructure, data processing, and applications, Atmos. Meas. Tech., 17, 6119–6144, https://doi.org/10.5194/amt-17-6119-2024, 2024. a, b, c
Bellini, A., Diémoz, H., Gobbi, G. P., Di Liberto, L., Bracci, A., and Barnaba, F.: Aerosols in the mixed layer and mid-troposphere from long-term data of the Italian Automated Lidar-Ceilometer Network ALICENET and comparison with ERA5 and CAMS models, Remote Sens., 17, https://doi.org/10.3390/rs17030372, 2025. a, b, c, d, e
Bernardoni, V., Elser, M., Valli, G., Valentini, S., Bigi, A., Fermo, P., Piazzalunga, A., and Vecchi, R.: Size-segregated aerosol in a hot-spot pollution urban area: Chemical composition and three-way source apportionment, Environ. Pollut., 231, 601–611, https://doi.org/10.1016/j.envpol.2017.08.040, 2017a. a
Bernardoni, V., Pileci, R. E., Caponi, L., and Massabò, D.: The Multi-Wavelength Absorption Analyzer (MWAA) Model as a Tool for Source and Component Apportionment Based on Aerosol Absorption Properties: Application to Samples Collected in Different Environments, Atmosphere, 8, https://doi.org/10.3390/atmos8110218, 2017b. a, b, c
Bhandari, S., Arub, Z., Habib, G., Apte, J. S., and Hildebrandt Ruiz, L.: Source apportionment resolved by time of day for improved deconvolution of primary source contributions to air pollution, Atmos. Meas. Tech., 15, 6051–6074, https://doi.org/10.5194/amt-15-6051-2022, 2022. a
Bihałowicz, J. S., Rogula-Kozłowska, W., Rogula-Kopiec, P., Świsłowski, P., Rajfur, M., and Olszowski, T.: One-Year-Long, Comprehensive Analysis of PM Number and Mass Size Distributions in Warszawa (Poland), Ecol. Chem. Eng. S., 30, 541–556, https://doi.org/10.2478/eces-2023-0047, 2023. a
Bond, T. C.: Spectral dependence of visible light absorption by carbonaceous particles emitted from coal combustion, Geophys. Res. Lett., 28, 4075–4078, https://doi.org/10.1029/2001GL013652, 2001. a
Bouscasse, H., Gabet, S., Kerneis, G., Provent, A., Rieux, C., Ben Salem, N., Dupont, H., Troude, F., Mathy, S., and Slama, R.: Designing local air pollution policies focusing on mobility and heating to avoid a targeted number of pollution-related deaths: Forward and backward approaches combining air pollution modeling, health impact assessment and cost-benefit analysis, Environ. Int., 159, 107030, https://doi.org/10.1016/j.envint.2021.107030, 2022. a
Bousiotis, D., Singh, A., Haugen, M., Beddows, D. C. S., Diez, S., Murphy, K. L., Edwards, P. M., Boies, A., Harrison, R. M., and Pope, F. D.: Assessing the sources of particles at an urban background site using both regulatory instruments and low-cost sensors – a comparative study, Atmos. Meas. Tech., 14, 4139–4155, https://doi.org/10.5194/amt-14-4139-2021, 2021. a, b
Bousiotis, D., Alconcel, L.-N. S., Beddows, D. C., Harrison, R. M., and Pope, F. D.: Monitoring and apportioning sources of indoor air quality using low-cost particulate matter sensors, Environ. Int., 174, 107907, https://doi.org/10.1016/j.envint.2023.107907, 2023a. a
Bousiotis, D., Allison, G., Beddows, D. C. S., Harrison, R. M., and Pope, F. D.: Towards comprehensive air quality management using low-cost sensors for pollution source apportionment, NPJ Clim. Atmos. Sci., 6, 122, https://doi.org/10.1038/s41612-023-00424-0, 2023b. a
Brown, S. G., Eberly, S., Paatero, P., and Norris, G. A.: Methods for estimating uncertainty in PMF solutions: Examples with ambient air and water quality data and guidance on reporting PMF results, Sci. Total Environ., 518–519, 626–635, https://doi.org/10.1016/j.scitotenv.2015.01.022, 2015. a, b
Camman, J., Chazeau, B., Marchand, N., Durand, A., Gille, G., Lanzi, L., Jaffrezo, J.-L., Wortham, H., and Uzu, G.: Oxidative potential apportionment of atmospheric PM1: a new approach combining high-sensitive online analysers for chemical composition and offline OP measurement technique, Atmos. Chem. Phys., 24, 3257–3278, https://doi.org/10.5194/acp-24-3257-2024, 2024. a
Campanelli, M., Iannarelli, A., Mevi, G., Casadio, S., Diémoz, H., Finardi, S., Dinoi, A., Castelli, E., di Sarra, A., Di Bernardino, A., Casasanta, G., Bassani, C., Siani, A., Cacciani, M., Barnaba, F., Di Liberto, L., and Argentini, S.: A wide-ranging investigation of the COVID-19 lockdown effects on the atmospheric composition in various Italian urban sites (AER – LOCUS), Urban Clim., 39, 100954, https://doi.org/10.1016/j.uclim.2021.100954, 2021. a
Campanelli, M., Estellés, V., Kumar, G., Nakajima, T., Momoi, M., Gröbner, J., Kazadzis, S., Kouremeti, N., Karanikolas, A., Barreto, A., Nevas, S., Schwind, K., Schneider, P., Harju, I., Kärhä, P., Diémoz, H., Kudo, R., Uchiyama, A., Yamazaki, A., Iannarelli, A. M., Mevi, G., Di Bernardino, A., and Casadio, S.: Evaluation of on-site calibration procedures for SKYNET Prede POM sun–sky photometers, Atmos. Meas. Tech., 17, 5029–5050, https://doi.org/10.5194/amt-17-5029-2024, 2024. a
Cavalli, F., Viana, M., Yttri, K. E., Genberg, J., and Putaud, J.-P.: Toward a standardised thermal-optical protocol for measuring atmospheric organic and elemental carbon: the EUSAAR protocol, Atmos. Meas. Tech., 3, 79–89, https://doi.org/10.5194/amt-3-79-2010, 2010. a
Chan, Y.-C., Hawas, O., Hawker, D., Vowles, P., Cohen, D. D., Stelcer, E., Simpson, R., Golding, G., and Christensen, E.: Using multiple type composition data and wind data in PMF analysis to apportion and locate sources of air pollutants, Atmos. Environ., 45, 439–449, https://doi.org/10.1016/j.atmosenv.2010.09.060, 2011. a
Chen, G., Canonaco, F., Slowik, J. G., Daellenbach, K. R., Tobler, A., Petit, J.-E., Favez, O., Stavroulas, I., Mihalopoulos, N., Gerasopoulos, E., El Haddad, I., Baltensperger, U., and Prévôt, A. S. H.: Real-Time Source Apportionment of Organic Aerosols in Three European Cities, Environ. Sci. Tech., 56, 15290–15297, https://doi.org/10.1021/acs.est.2c02509, 2022. a
Chen, J. and Hoek, G.: Long-term exposure to PM and all-cause and cause-specific mortality: A systematic review and meta-analysis, Environ. Int., 143, 105974, https://doi.org/10.1016/j.envint.2020.105974, 2020. a
Chen, J., Dai, Q., Zhang, X., Tian, Y., Feng, Y., and Hopke, P. K.: PMF Source Contribution Uncertainty Estimation via Effective Variance Least Squares, ACS ES&T Air, 2, 3045–3053, https://doi.org/10.1021/acsestair.5c00312, 2025. a, b
Chien, C.-H., Theodore, A., Wu, C.-Y., Hsu, Y.-M., and Birky, B.: Upon correlating diameters measured by optical particle counters and aerodynamic particle sizers, J. Aerosol Sci., 101, 77–85, https://doi.org/10.1016/j.jaerosci.2016.05.011, 2016. a, b
Chueinta, W., Hopke, P. K., and Paatero, P.: Investigation of sources of atmospheric aerosol at urban and suburban residential areas in Thailand by positive matrix factorization, Atmos. Environ., 34, 3319–3329, https://doi.org/10.1016/S1352-2310(99)00433-1, 2000. a
Ćirović, Ž., Stojanović, D. B., Davidović, M., Onjia, A., Alastuey, A., and Jovašević-Stojanović, M.: New Particle Formation and Source Apportionment of Particle Number Size Distribution in the Urban Area of the City of Belgrade, Atmosphere, 17, https://doi.org/10.3390/atmos17020205, 2026. a
Colette, A., Collin, G., Besson, F., Blot, E., Guidard, V., Meleux, F., Royer, A., Petiot, V., Miller, C., Fermond, O., Jeant, A., Adani, M., Arteta, J., Benedictow, A., Bergström, R., Bowdalo, D., Brandt, J., Briganti, G., Carvalho, A. C., Christensen, J. H., Couvidat, F., D'Elia, I., D'Isidoro, M., Denier van der Gon, H., Descombes, G., Di Tomaso, E., Douros, J., Escribano, J., Eskes, H., Fagerli, H., Fatahi, Y., Flemming, J., Friese, E., Frohn, L., Gauss, M., Geels, C., Guarnieri, G., Guevara, M., Guion, A., Guth, J., Hänninen, R., Hansen, K., Im, U., Janssen, R., Jeoffrion, M., Joly, M., Jones, L., Jorba, O., Kadantsev, E., Kahnert, M., Kaminski, J. W., Kouznetsov, R., Kranenburg, R., Kuenen, J., Lange, A. C., Langner, J., Lannuque, V., Macchia, F., Manders, A., Mircea, M., Nyiri, A., Olid, M., Pérez García-Pando, C., Palamarchuk, Y., Piersanti, A., Raux, B., Razinger, M., Robertson, L., Segers, A., Schaap, M., Siljamo, P., Simpson, D., Sofiev, M., Stangel, A., Struzewska, J., Tena, C., Timmermans, R., Tsikerdekis, T., Tsyro, S., Tyuryakov, S., Ung, A., Uppstu, A., Valdebenito, A., van Velthoven, P., Vitali, L., Ye, Z., Peuch, V.-H., and Rouïl, L.: Copernicus Atmosphere Monitoring Service – Regional Air Quality Production System v1.0, Geosci. Model Dev., 18, 6835–6883, https://doi.org/10.5194/gmd-18-6835-2025, 2025. a
Collaud Coen, M., Weingartner, E., Schaub, D., Hueglin, C., Corrigan, C., Henning, S., Schwikowski, M., and Baltensperger, U.: Saharan dust events at the Jungfraujoch: detection by wavelength dependence of the single scattering albedo and first climatology analysis, Atmos. Chem. Phys., 4, 2465–2480, https://doi.org/10.5194/acp-4-2465-2004, 2004. a, b
Colombi, C., D'Angelo, L., Biffi, B., Cuccia, E., Dal Santo, U., and Lanzani, G.: Monitoring ammonia concentrations in more than 10 stations in the Po Valley for the period 2007–2022 in relation to the evolution of different sources, Front. Environ. Health, 3, https://doi.org/10.3389/fenvh.2024.1249457, 2024. a
Conte, M., Merico, E., Cesari, D., Dinoi, A., Grasso, F. M., Donateo, A., Guascito, M. R., and Contini, D.: Long-term characterisation of African dust advection in south-eastern Italy: Influence on fine and coarse particle concentrations, size distributions, and carbon content, Atmos. Res., 233, 104690, https://doi.org/10.1016/j.atmosres.2019.104690, 2020. a
Costabile, F., Birmili, W., Klose, S., Tuch, T., Wehner, B., Wiedensohler, A., Franck, U., König, K., and Sonntag, A.: Spatio-temporal variability and principal components of the particle number size distribution in an urban atmosphere, Atmos. Chem. Phys., 9, 3163–3195, https://doi.org/10.5194/acp-9-3163-2009, 2009. a, b, c
Coulter, C. T.: EPA-CMB8. 2 users manual, US. Environmental Protection Agency, Office of Air Quality Planning & Standards, Emissions, Monitoring & Analysis Division, Air Quality Modeling Group, https://www.epa.gov/sites/default/files/2020-10/documents/epa-cmb82manual.pdf (last access: 2 June 2026), 2004. a, b
Cuccia, E., Bernardoni, V., Massabò, D., Prati, P., Valli, G., and Vecchi, R.: An alternative way to determine the size distribution of airborne particulate matter, Atmos. Environ., 44, 3304–3313, https://doi.org/10.1016/j.atmosenv.2010.05.045, 2010. a, b, c
Curci, G., Ferrero, L., Tuccella, P., Barnaba, F., Angelini, F., Bolzacchini, E., Carbone, C., Denier van der Gon, H. A. C., Facchini, M. C., Gobbi, G. P., Kuenen, J. P. P., Landi, T. C., Perrino, C., Perrone, M. G., Sangiorgi, G., and Stocchi, P.: How much is particulate matter near the ground influenced by upper-level processes within and above the PBL? A summertime case study in Milan (Italy) evidences the distinctive role of nitrate, Atmos. Chem. Phys., 15, 2629–2649, https://doi.org/10.5194/acp-15-2629-2015, 2015. a, b
Cusack, M., Pérez, N., Pey, J., Alastuey, A., and Querol, X.: Source apportionment of fine PM and sub-micron particle number concentrations at a regional background site in the western Mediterranean: a 2.5 year study, Atmos. Chem. Phys., 13, 5173–5187, https://doi.org/10.5194/acp-13-5173-2013, 2013. a, b
Dai, Q., Liu, B., Bi, X., Wu, J., Liang, D., Zhang, Y., Feng, Y., and Hopke, P. K.: Dispersion Normalized PMF Provides Insights into the Significant Changes in Source Contributions to PM2.5 after the COVID-19 Outbreak, Environ. Sci. Tech., 54, 9917–9927, https://doi.org/10.1021/acs.est.0c02776, 2020. a, b
Dall'Osto, M., Beddows, D. C. S., Pey, J., Rodriguez, S., Alastuey, A., Harrison, R. M., and Querol, X.: Urban aerosol size distributions over the Mediterranean city of Barcelona, NE Spain, Atmos. Chem. Phys., 12, 10693–10707, https://doi.org/10.5194/acp-12-10693-2012, 2012. a, b, c
Damiano, R., Amoruso, S., Sannino, A., and Boselli, A.: Lidar Optical and Microphysical Characterization of Tropospheric and Stratospheric Fire Smoke Layers Due to Canadian Wildfires Passing over Naples (Italy), Remote Sens., 16, https://doi.org/10.3390/rs16030538, 2024. a
Davulienė, L., Janicka, L., Minderytė, A., Kalinauskaitė, A., Poczta, P., Karasewicz, M., Hafiz, A., Pashneva, D., Dudoitis, V., Kandrotaitė, K., Valiulis, D., Böckmann, C., Schüttemeyer, D., Stachlewska, I. S., and Byčenkienė, S.: Synergic use of in-situ and remote sensing techniques for comprehensive characterization of aerosol optical and microphysical properties, Sci. Total Environ., 906, 167585, https://doi.org/10.1016/j.scitotenv.2023.167585, 2024. a
Denby, B., Sundvor, I., Johansson, C., Pirjola, L., Ketzel, M., Norman, M., Kupiainen, K., Gustafsson, M., Blomqvist, G., Kauhaniemi, M., and Omstedt, G.: A coupled road dust and surface moisture model to predict non-exhaust road traffic induced particle emissions (NORTRIP). Part 2: Surface moisture and salt impact modelling, Atmos. Environ., 81, 485–503, https://doi.org/10.1016/j.atmosenv.2013.09.003, 2013. a
Di Antonio, A., Popoola, O. A. M., Ouyang, B., Saffell, J., and Jones, R. L.: Developing a Relative Humidity Correction for Low-Cost Sensors Measuring Ambient Particulate Matter, Sensors, 18, https://doi.org/10.3390/s18092790, 2018. a
Di Biagio, C., Formenti, P., Balkanski, Y., Caponi, L., Cazaunau, M., Pangui, E., Journet, E., Nowak, S., Andreae, M. O., Kandler, K., Saeed, T., Piketh, S., Seibert, D., Williams, E., and Doussin, J.-F.: Complex refractive indices and single-scattering albedo of global dust aerosols in the shortwave spectrum and relationship to size and iron content, Atmos. Chem. Phys., 19, 15503–15531, https://doi.org/10.5194/acp-19-15503-2019, 2019. a, b, c
Diémoz, H.: RASPBERRY and RASPBERRY+EVLS: Data and R code for real-time PM10 source apportionment using aerosol physical properties, Zenodo [code and data set], https://doi.org/10.5281/zenodo.20174876, 2026. a, b
Diémoz, H., Campanelli, M., and Estellés, V.: One Year of Measurements with a POM-02 Sky Radiometer at an Alpine EuroSkyRad Station, J. Meteorol. Soc. Jpn., 92A, 1–16, https://doi.org/10.2151/jmsj.2014-A01, 2014. a
Diémoz, H., Barnaba, F., Magri, T., Pession, G., Dionisi, D., Pittavino, S., Tombolato, I. K. F., Campanelli, M., Della Ceca, L. S., Hervo, M., Di Liberto, L., Ferrero, L., and Gobbi, G. P.: Transport of Po Valley aerosol pollution to the northwestern Alps – Part 1: Phenomenology, Atmos. Chem. Phys., 19, 3065–3095, https://doi.org/10.5194/acp-19-3065-2019, 2019a. a, b, c, d, e, f, g
Diémoz, H., Gobbi, G. P., Magri, T., Pession, G., Pittavino, S., Tombolato, I. K. F., Campanelli, M., and Barnaba, F.: Transport of Po Valley aerosol pollution to the northwestern Alps – Part 2: Long-term impact on air quality, Atmos. Chem. Phys., 19, 10129–10160, https://doi.org/10.5194/acp-19-10129-2019, 2019b. a, b, c, d, e, f, g, h, i, j, k, l, m, n
Diémoz, H., Tombolato, I. K. F., Zublena, M., Magri, T., and Ferrero, L.: The impact of biomass burning emissions on PM concentration in the Greater Alpine region, in: Proceedings of 12th International Conference on Air Quality, Science and Application, p. 26, Hatfield, UK, https://doi.org/10.18745/pb.22217, 2020. a, b
Diémoz, H., Magri, T., Pession, G., Tarricone, C., Tombolato, I. K. F., Fasano, G., and Zublena, M.: Air Quality in the Italian Northwestern Alps during Year 2020: Assessment of the COVID-19 “Lockdown Effect” from Multi-Technique Observations and Models, Atmosphere, 12, https://doi.org/10.3390/atmos12081006, 2021. a, b, c, d, e, f, g, h, i, j
Diez, S., Lacy, S. E., Bannan, T. J., Flynn, M., Gardiner, T., Harrison, D., Marsden, N., Martin, N. A., Read, K., and Edwards, P. M.: Air pollution measurement errors: is your data fit for purpose?, Atmos. Meas. Tech., 15, 4091–4105, https://doi.org/10.5194/amt-15-4091-2022, 2022. a
Ditas, J., Ma, N., Zhang, Y., Assmann, D., Neumaier, M., Riede, H., Karu, E., Williams, J., Scharffe, D., Wang, Q., Saturno, J., Schwarz, J. P., Katich, J. M., McMeeking, G. R., Zahn, A., Hermann, M., Brenninkmeijer, C. A. M., Andreae, M. O., Pöschl, U., Su, H., and Cheng, Y.: Strong impact of wildfires on the abundance and aging of black carbon in the lowermost stratosphere, P. Natl. A. Sci., 115, E11595–E11603, https://doi.org/10.1073/pnas.1806868115, 2018. a
Drinovec, L., Močnik, G., Zotter, P., Prévôt, A. S. H., Ruckstuhl, C., Coz, E., Rupakheti, M., Sciare, J., Müller, T., Wiedensohler, A., and Hansen, A. D. A.: The ”dual-spot” Aethalometer: an improved measurement of aerosol black carbon with real-time loading compensation, Atmos. Meas. Tech., 8, 1965–1979, https://doi.org/10.5194/amt-8-1965-2015, 2015. a
Dubovik, O., Holben, B., Eck, T. F., Smirnov, A., Kaufman, Y. J., King, M. D., Tanré, D., and Slutsker, I.: Variability of Absorption and Optical Properties of Key Aerosol Types Observed in Worldwide Locations, J. Atmos. Sci., 59, 590–608, https://doi.org/10.1175/1520-0469(2002)059<0590:VOAAOP>2.0.CO;2, 2002. a
Eck, T. F., Holben, B. N., Reid, J. S., Sinyuk, A., Hyer, E. J., O'Neill, N. T., Shaw, G. E., Vande Castle, J. R., Chapin, F. S., Dubovik, O., Smirnov, A., Vermote, E., Schafer, J. S., Giles, D., Slutsker, I., Sorokine, M., and Newcomb, W. W.: Optical properties of boreal region biomass burning aerosols in central Alaska and seasonal variation of aerosol optical depth at an Arctic coastal site, J. Geophys. Res., 114, https://doi.org/10.1029/2008JD010870, 2009. a
ECMWF Copernicus Atmosphere Monitoring Service: Smoke from Canadian wildfires reaches Europe, https://atmosphere.copernicus.eu/smoke-canadian-wildfires-reaches-europe (last access: 2 June 2026), 2024. a
El Haddad, I., Marchand, N., Dron, J., Temime-Roussel, B., Quivet, E., Wortham, H., Jaffrezo, J. L., Baduel, C., Voisin, D., Besombes, J. L., and Gille, G.: Comprehensive primary particulate organic characterization of vehicular exhaust emissions in France, Atmos. Environ., 43, 6190–6198, https://doi.org/10.1016/j.atmosenv.2009.09.001, 2009. a
Emami, F. and Hopke, P. K.: Effect of adding variables on rotational ambiguity in positive matrix factorization solutions, Chemometr. Intell. Lab., 162, 198–202, https://doi.org/10.1016/j.chemolab.2017.01.012, 2017. a
Estellés, V., Campanelli, M., Smyth, T. J., Utrillas, M. P., and Martínez-Lozano, J. A.: Evaluation of the new ESR network software for the retrieval of direct sun products from CIMEL CE318 and PREDE POM01 sun-sky radiometers, Atmos. Chem. Phys., 12, 11619–11630, https://doi.org/10.5194/acp-12-11619-2012, 2012. a
EUMETSAT: Canadian wildfire monitoring over the Atlantic and Europe, https://user.eumetsat.int/resources/case-studies/canadian-wildfire-monitoring-over-the-atlantic-and-europe (last access: 2 June 2026), 2023. a
European Commission: Directive 2008/50/EC of the European Parliament and of the Council on ambient air quality and cleaner air for Europe, in: 2008/50/EC, edited by: European Parliament, https://eur-lex.europa.eu/legal-content/EN/TXT/?uri=CELEX:02008L0050-20150918 (last access: 2 June 2026), 2008. a
European Commission: Commission staff working paper establishing guidelines for demonstration and subtraction of exceedances attributable to natural sources under the Directive 2008/50/EC on ambient air quality and cleaner air for Europe, http://register.consilium.europa.eu/doc/srv?l=EN&f=ST%206771%202011%20INIT (last access: 2 June 2026), 2011. a
European Commission: Directive 2024/2881/EC of 23 October 2024 on ambient air quality and cleaner air for Europe, in: 2024/2881/EC, edited by: European Parliament, https://eur-lex.europa.eu/eli/dir/2024/2881 (last access: 2 June 2026), 2024. a
European Environment Agency: Europe's air quality status 2024, https://www.eea.europa.eu/publications/europes-air-quality-status-2024 (last access: 2 June 2026), 2024. a
Fasano, G., Diémoz, H., Fountoulakis, I., Cassardo, C., Kudo, R., Siani, A. M., and Ferrero, L.: Vertical profile of the clear-sky aerosol direct radiative effect in an Alpine valley, by the synergy of ground-based measurements and radiative transfer simulations, Bull. Atmos. Sci. Technol., 2, 11, https://doi.org/10.1007/s42865-021-00041-w, 2021. a, b
Favaro, E., Barbaro, E., Diémoz, H., Bertinetti, S., Malandrino, M., Foretier, A., Ferrarese, S., Bellini, A., Freppaz, M., Balestrini, R., Bortolini, M., Munteanu, A., Frassati, S., Marafante, M., Mariani, E., Bonasoni, P., Petracchini, F., Mazari, L., Provenzale, A., Gilardoni, S., Gambaro, A., and Feltracco, M.: Characterizing aerosol composition, size distribution and optical properties in the Western Italian Alps: insights into pollution sources and transport processes, in: European Aerosol Conference 2025, 31 August–5 September 2025, Lecce (Italy), European Aerosol Assembly (EAA), 2025. a
Favez, O., El Haddad, I., Piot, C., Boréave, A., Abidi, E., Marchand, N., Jaffrezo, J.-L., Besombes, J.-L., Personnaz, M.-B., Sciare, J., Wortham, H., George, C., and D'Anna, B.: Inter-comparison of source apportionment models for the estimation of wood burning aerosols during wintertime in an Alpine city (Grenoble, France), Atmos. Chem. Phys., 10, 5295–5314, https://doi.org/10.5194/acp-10-5295-2010, 2010. a, b
Ferrero, L., Mocnik, G., Ferrini, B., Perrone, M., Sangiorgi, G., and Bolzacchini, E.: Vertical profiles of aerosol absorption coefficient from micro-Aethalometer data and Mie calculation over Milan, Sci. Total Environ., 409, 2824–2837, https://doi.org/10.1016/j.scitotenv.2011.04.022, 2011. a
Ferrero, L., Ritter, C., Cappelletti, D., Moroni, B., Močnik, G., Mazzola, M., Lupi, A., Becagli, S., Traversi, R., Cataldi, M., Neuber, R., Vitale, V., and Bolzacchini, E.: Aerosol optical properties in the Arctic: The role of aerosol chemistry and dust composition in a closure experiment between Lidar and tethered balloon vertical profiles, Sci. Total Environ., 686, 452–467, https://doi.org/10.1016/j.scitotenv.2019.05.399, 2019. a, b
Ferrero, L., Bernardoni, V., Santagostini, L., Cogliati, S., Soldan, F., Valentini, S., Massabò, D., Močnik, G., Gregorič, A., Rigler, M., Prati, P., Bigogno, A., Losi, N., Valli, G., Vecchi, R., and Bolzacchini, E.: Consistent determination of the heating rate of light-absorbing aerosol using wavelength- and time-dependent Aethalometer multiple-scattering correction, Sci. Total Environ., 791, 148277, https://doi.org/10.1016/j.scitotenv.2021.148277, 2021. a
Ferrero, L., Losi, N., Rigler, M., Gregorič, A., Colombi, C., D'Angelo, L., Cuccia, E., Cefalì, A., Gini, I., Doldi, A., Cerri, S., Maroni, P., Cipriano, D., Markuszewski, P., and Bolzacchini, E.: Determining the Aethalometer multiple scattering enhancement factor C from the filter loading parameter, Sci. Total Environ., 917, 170221, https://doi.org/10.1016/j.scitotenv.2024.170221, 2024. a
Filonchyk, M. and Peterson, M. P.: Changes in aerosol properties at the El Arenosillo site in Southern Europe as a result of the 2023 Canadian forest fires, Environ. Res., 260, 119629, https://doi.org/10.1016/j.envres.2024.119629, 2024. a
Forello, A. C., Bernardoni, V., Calzolai, G., Lucarelli, F., Massabò, D., Nava, S., Pileci, R. E., Prati, P., Valentini, S., Valli, G., and Vecchi, R.: Exploiting multi-wavelength aerosol absorption coefficients in a multi-time resolution source apportionment study to retrieve source-dependent absorption parameters, Atmos. Chem. Phys., 19, 11235–11252, https://doi.org/10.5194/acp-19-11235-2019, 2019. a, b
Forello, A. C., Cunha-Lopes, I., Almeida, S. M., Alves, C. A., Tchepel, O., Crova, F., and Vecchi, R.: Insights on the combination of off-line and on-line measurement approaches for source apportionment studies, Sci. Total Environ., 900, 165860, https://doi.org/10.1016/j.scitotenv.2023.165860, 2023. a, b, c, d, e, f
Fountoulakis, I., Diémoz, H., Siani, A. M., Hülsen, G., and Gröbner, J.: Monitoring of solar spectral ultraviolet irradiance in Aosta, Italy, Earth Syst. Sci. Data, 12, 2787–2810, https://doi.org/10.5194/essd-12-2787-2020, 2020. a
Fuzzi, S., Baltensperger, U., Carslaw, K., Decesari, S., Denier van der Gon, H., Facchini, M. C., Fowler, D., Koren, I., Langford, B., Lohmann, U., Nemitz, E., Pandis, S., Riipinen, I., Rudich, Y., Schaap, M., Slowik, J. G., Spracklen, D. V., Vignati, E., Wild, M., Williams, M., and Gilardoni, S.: Particulate matter, air quality and climate: lessons learned and future needs, Atmos. Chem. Phys., 15, 8217–8299, https://doi.org/10.5194/acp-15-8217-2015, 2015. a
Garcia-Marlès, M., Lara, R., Reche, C., Pérez, N., Tobías, A., Savadkoohi, M., Beddows, D., Salma, I., Vörösmarty, M., Weidinger, T., Hueglin, C., Mihalopoulos, N., Grivas, G., Kalkavouras, P., Ondráček, J., Zíková, N., Niemi, J. V., Manninen, H. E., Green, D. C., Tremper, A. H., Norman, M., Vratolis, S., Eleftheriadis, K., Gómez-Moreno, F. J., Alonso-Blanco, E., Wiedensohler, A., Weinhold, K., Merkel, M., Bastian, S., Hoffmann, B., Altug, H., Petit, J.-E., Favez, O., Dos Santos, S. M., Putaud, J.-P., Dinoi, A., Contini, D., Timonen, H., Lampilahti, J., Petäjä, T., Pandolfi, M., Hopke, P. K., Harrison, R. M., Alastuey, A., and Querol, X.: Inter-annual trends of ultrafine particles in urban Europe, Environ. Int., 185, 108510, https://doi.org/10.1016/j.envint.2024.108510, 2024. a
Geller, M., Biswas, S., and Sioutas, C.: Determination of Particle Effective Density in Urban Environments with a Differential Mobility Analyzer and Aerosol Particle Mass Analyzer, Aerosol Sci. Tech., 40, 709–723, https://doi.org/10.1080/02786820600803925, 2006. a
Gialitaki, A., Tsekeri, A., Amiridis, V., Ceolato, R., Paulien, L., Kampouri, A., Gkikas, A., Solomos, S., Marinou, E., Haarig, M., Baars, H., Ansmann, A., Lapyonok, T., Lopatin, A., Dubovik, O., Groß, S., Wirth, M., Tsichla, M., Tsikoudi, I., and Balis, D.: Is the near-spherical shape the “new black” for smoke?, Atmos. Chem. Phys., 20, 14005–14021, https://doi.org/10.5194/acp-20-14005-2020, 2020. a
Gietl, J. K., Lawrence, R., Thorpe, A. J., and Harrison, R. M.: Identification of brake wear particles and derivation of a quantitative tracer for brake dust at a major road, Atmos. Environ., 44, 141–146, https://doi.org/10.1016/j.atmosenv.2009.10.016, 2010. a
Gobbi, G., Barnaba, F., Di Liberto, L., Bolignano, A., Lucarelli, F., Nava, S., Perrino, C., Pietrodangelo, A., Basart, S., Costabile, F., Dionisi, D., Rizza, U., Canepari, S., Sozzi, R., Morelli, M., Manigrasso, M., Drewnick, F., Struckmeier, C., Poenitz, K., and Wille, H.: An inclusive view of Saharan dust advections to Italy and the Central Mediterranean, Atmos. Environ., 201, 242–256, https://doi.org/10.1016/j.atmosenv.2019.01.002, 2019. a, b, c
Goi, A., Diémoz, H., Bellini, A., Bracci, A., and Barnaba, F.: Model-assisted retrievals of aerosol properties from Polarization-sensitive Automated Lidar-Ceilometers and test applications to Vaisala CL61 measurements during desert dust transport episodes, EGU General Assembly 2026, Vienna, Austria, 3–8 May 2026, EGU26-11591, https://doi.org/10.5194/egusphere-egu26-11591, 2026. a
González, R., Toledano, C., Román, R., Mateos, D., Asmi, E., Rodríguez, E., Lau, I. C., Ferrara, J., D'Elia, R., Antuña-Sánchez, J. C., Cachorro, V. E., Calle, A., and de Frutos, Á. M.: Characterization of Stratospheric Smoke Particles over the Antarctica by Remote Sensing Instruments, Remote Sens., 12, https://doi.org/10.3390/rs12223769, 2020. a
Grange, S. K. and Carslaw, D. C.: Using meteorological normalisation to detect interventions in air quality time series, Sci. Total Environ., 653, 578–588, https://doi.org/10.1016/j.scitotenv.2018.10.344, 2019. a, b, c
Grange, S. K., Lötscher, H., Fischer, A., Emmenegger, L., and Hueglin, C.: Evaluation of equivalent black carbon source apportionment using observations from Switzerland between 2008 and 2018, Atmos. Meas. Tech., 13, 1867–1885, https://doi.org/10.5194/amt-13-1867-2020, 2020. a, b, c
Grange, S. K., Fischer, A., Zellweger, C., Alastuey, A., Querol, X., Jaffrezo, J.-L., Weber, S., Uzu, G., and Hueglin, C.: Switzerland's PM10 and PM2.5 environmental increments show the importance of non-exhaust emissions, Atmos. Environ., 12, 100145, https://doi.org/10.1016/j.aeaoa.2021.100145, 2021. a
Gu, J., Pitz, M., Schnelle-Kreis, J., Diemer, J., Reller, A., Zimmermann, R., Soentgen, J., Stoelzel, M., Wichmann, H.-E., Peters, A., and Cyrys, J.: Source apportionment of ambient particles: Comparison of positive matrix factorization analysis applied to particle size distribution and chemical composition data, Atmos. Environ., 45, 1849–1857, https://doi.org/10.1016/j.atmosenv.2011.01.009, 2011. a, b, c, d, e, f, g
Guo, H., Otjes, R., Schlag, P., Kiendler-Scharr, A., Nenes, A., and Weber, R. J.: Effectiveness of ammonia reduction on control of fine particle nitrate, Atmos. Chem. Phys., 18, 12241–12256, https://doi.org/10.5194/acp-18-12241-2018, 2018. a
Hagan, D. H., Gani, S., Bhandari, S., Patel, K., Habib, G., Apte, J. S., Hildebrandt Ruiz, L., and Kroll, J. H.: Inferring Aerosol Sources from Low-Cost Air Quality Sensor Measurements: A Case Study in Delhi, India, Environ. Sci. Tech. Lett., 6, 467–472, https://doi.org/10.1021/acs.estlett.9b00393, 2019. a
Hand, J. L. and Kreidenweis, S. M.: A New Method for Retrieving Particle Refractive Index and Effective Density from Aerosol Size Distribution Data, Aerosol Sci. Tech., 36, 1012–1026, https://doi.org/10.1080/02786820290092276, 2002. a
Harni, S. D., Aurela, M., Saarikoski, S., Niemi, J. V., Portin, H., Manninen, H., Leinonen, V., Aalto, P., Hopke, P. K., Petäjä, T., Rönkkö, T., and Timonen, H.: Source apportionment of particle number size distribution at the street canyon and urban background sites, Atmos. Chem. Phys., 24, 12143–12160, https://doi.org/10.5194/acp-24-12143-2024, 2024. a
Harrison, R. M., Beddows, D. C. S., and Dall'Osto, M.: PMF Analysis of Wide-Range Particle Size Spectra Collected on a Major Highway, Environ. Sci. Tech., 45, 5522–5528, https://doi.org/10.1021/es2006622, 2011. a, b, c
Harrison, R. M., Jones, A. M., Gietl, J., Yin, J., and Green, D. C.: Estimation of the Contributions of Brake Dust, Tire Wear, and Resuspension to Nonexhaust Traffic Particles Derived from Atmospheric Measurements, Environ. Sci. Tech., 46, 6523–6529, https://doi.org/10.1021/es300894r, 2012. a
Harrison, R. M., Beddows, D. C., Jones, A. M., Calvo, A., Alves, C., and Pio, C.: An evaluation of some issues regarding the use of aethalometers to measure woodsmoke concentrations, Atmos. Environ., 80, 540–548, https://doi.org/10.1016/j.atmosenv.2013.08.026, 2013. a
Herrero del Barrio, C., Román, R., González, R., Cazorla, A., Herreras-Giralda, M., Antuña-Sánchez, J. C., Molero, F., Navas-Guzmán, F., Serrano, A., Obregón, M. Á., Sola, Y., Pandolfi, M., Herrero-Anta, S., González-Fernández, D., Muñiz-Rosado, J., Mateos, D., Calle, A., Toledano, C., Cachorro, V. E., and de Frutos, Á. M.: CAECENET: An automatic system processing photometer and ceilometer data from different networks to provide columnar and vertically-resolved aerosol properties, Plos One, 19, e0311990, https://doi.org/10.1371/journal.pone.0311990, 2024. a, b, c
Hollander, M., Wolfe, D. A., and Chicken, E.: Nonparametric Statistical Methods, John Wiley & Sons, New York, ISBN 9780470387375, https://doi.org/10.1002/9781119196037, 2015. a
Hopke, P. K., Dai, Q., Li, L., and Feng, Y.: Global review of recent source apportionments for airborne particulate matter, Sci. Total Environ., 740, 140091, https://doi.org/10.1016/j.scitotenv.2020.140091, 2020. a
Hopke, P. K., Feng, Y., and Dai, Q.: Source apportionment of particle number concentrations: A global review, Sci. Total Environ., 819, 153104, https://doi.org/10.1016/j.scitotenv.2022.153104, 2022. a
Hopke, P. K., Chen, Y., Rich, D. Q., Mooibroek, D., and Sofowote, U. M.: The application of positive matrix factorization with diagnostics to BIG DATA, Chemometr. Intell. Lab., 240, 104885, https://doi.org/10.1016/j.chemolab.2023.104885, 2023. a
Hsu, Y.-K., Holsen, T. M., and Hopke, P. K.: Comparison of hybrid receptor models to locate PCB sources in Chicago, Atmos. Environ., 37, 545–562, https://doi.org/10.1016/S1352-2310(02)00886-5, 2003. a
Hu, M., Peng, J., Sun, K., Yue, D., Guo, S., Wiedensohler, A., and Wu, Z.: Estimation of Size-Resolved Ambient Particle Density Based on the Measurement of Aerosol Number, Mass, and Chemical Size Distributions in the Winter in Beijing, Environ. Sci. Tech., 46, 9941–9947, https://doi.org/10.1021/es204073t, 2012. a
Ibrir, A., Kerchich, Y., Hadidi, N., Merabet, H., and Hentabli, M.: Prediction of the concentrations of PM1, PM2.5, PM4, and PM10 by using the hybrid dragonfly-SVM algorithm, Air Qual. Atmos. Hlth, 14, 313–323, https://doi.org/10.1007/s11869-020-00936-1, 2021. a
IPCC: Climate Change 2023: Synthesis Report. Contribution of Working Groups I, II and III to the Sixth Assessment Report of the Intergovernmental Panel on Climate Change, Tech. rep., IPCC, Geneva, Switzerland, https://doi.org/10.59327/IPCC/AR6-9789291691647, 2023. a
Jiang, F., Saathoff, H., Ezenobi, U., Song, J., Zhang, H., Gao, L., and Leisner, T.: Measurement report: Brown carbon aerosol in rural Germany – sources, chemistry, and diurnal variations, Atmos. Chem. Phys., 25, 1917–1930, https://doi.org/10.5194/acp-25-1917-2025, 2025. a
Jimenez, J. L., Jayne, J. T., Shi, Q., Kolb, C. E., Worsnop, D. R., Yourshaw, I., Seinfeld, J. H., Flagan, R. C., Zhang, X., Smith, K. A., Morris, J. W., and Davidovits, P.: Ambient aerosol sampling using the Aerodyne Aerosol Mass Spectrometer, J. Geophys. Res., 108, https://doi.org/10.1029/2001JD001213, 2003. a
Jones, M. W., Kelley, D. I., Burton, C. A., Di Giuseppe, F., Barbosa, M. L. F., Brambleby, E., Hartley, A. J., Lombardi, A., Mataveli, G., McNorton, J. R., Spuler, F. R., Wessel, J. B., Abatzoglou, J. T., Anderson, L. O., Andela, N., Archibald, S., Armenteras, D., Burke, E., Carmenta, R., Chuvieco, E., Clarke, H., Doerr, S. H., Fernandes, P. M., Giglio, L., Hamilton, D. S., Hantson, S., Harris, S., Jain, P., Kolden, C. A., Kurvits, T., Lampe, S., Meier, S., New, S., Parrington, M., Perron, M. M. G., Qu, Y., Ribeiro, N. S., Saharjo, B. H., San-Miguel-Ayanz, J., Shuman, J. K., Tanpipat, V., van der Werf, G. R., Veraverbeke, S., and Xanthopoulos, G.: State of Wildfires 2023–2024, Earth Syst. Sci. Data, 16, 3601–3685, https://doi.org/10.5194/essd-16-3601-2024, 2024. a
Kalkavouras, P., Grivas, G., Stavroulas, I., Petrinoli, K., Bougiatioti, A., Liakakou, E., Gerasopoulos, E., and Mihalopoulos, N.: Source apportionment of fine and ultrafine particle number concentrations in a major city of the Eastern Mediterranean, Sci. Total Environ., 915, 170042, https://doi.org/10.1016/j.scitotenv.2024.170042, 2024. a, b
Khan, M. F., Latif, M. T., Amil, N., Juneng, L., Mohamad, N., Nadzir, M. S. M., and Hoque, H. M. S.: Characterization and source apportionment of particle number concentration at a semi-urban tropical environment, Environ. Sci. Pollut. Res., 22, 13111–13126, https://doi.org/10.1007/s11356-015-4541-4, 2015. a
Kim, N. G., Jeong, S. B., Jin, H. C., Lee, J., Kim, K. H., Kim, S., Park, Y., Choi, W., Kwak, K.-H., Lee, H., Kang, G., Kim, C., Woo, S.-H., Lee, S., Kim, W. Y., Ahn, K., Lee, K.-Y., and Lee, S.-B.: Spatial and PMF analysis of particle size distributions simultaneously measured at four locations at the roadside of highways, Sci. Total Environ., 893, 164892, https://doi.org/10.1016/j.scitotenv.2023.164892, 2023. a
Kolden, C. A., Abatzoglou, J. T., Jones, M. W., and Jain, P.: Wildfires in 2023, Nat. Rev. Earth Environ., 5, 238–240, https://doi.org/10.1038/s43017-024-00544-y, 2024. a
Krecl, P., Targino, A. C., Johansson, C., and Ström, J.: Characterisation and Source Apportionment of Submicron Particle Number Size Distributions in a Busy Street Canyon, Aerosol Air Qual. Res., 15, 220–233, https://doi.org/10.4209/aaqr.2014.06.0108, 2015. a
Kudo, R., Diémoz, H., Estellés, V., Campanelli, M., Momoi, M., Marenco, F., Ryder, C. L., Ijima, O., Uchiyama, A., Nakashima, K., Yamazaki, A., Nagasawa, R., Ohkawara, N., and Ishida, H.: Optimal use of the Prede POM sky radiometer for aerosol, water vapor, and ozone retrievals, Atmos. Meas. Tech., 14, 3395–3426, https://doi.org/10.5194/amt-14-3395-2021, 2021. a
Kumar, V., Malyan, V., Sahu, M., and Biswal, B.: Aerosol sources characterization and apportionment from low-cost particle sensors in an urban environment, Atmos. Environ. X, 22, 100271, https://doi.org/10.1016/j.aeaoa.2024.100271, 2024. a
Lampilahti, J., Leino, K., Manninen, A., Poutanen, P., Franck, A., Peltola, M., Hietala, P., Beck, L., Dada, L., Quéléver, L., Öhrnberg, R., Zhou, Y., Ekblom, M., Vakkari, V., Zilitinkevich, S., Kerminen, V.-M., Petäjä, T., and Kulmala, M.: Aerosol particle formation in the upper residual layer, Atmos. Chem. Phys., 21, 7901–7915, https://doi.org/10.5194/acp-21-7901-2021, 2021. a
Leoni, C., Pokorná, P., Hovorka, J., Masiol, M., Topinka, J., Zhao, Y., Křůmal, K., Cliff, S., Mikuška, P., and Hopke, P. K.: Source apportionment of aerosol particles at a European air pollution hot spot using particle number size distributions and chemical composition, Environ. Pollut., 234, 145–154, https://doi.org/10.1016/j.envpol.2017.10.097, 2018. a, b
Liang, C.-S., Wu, H., Li, H.-Y., Zhang, Q., Li, Z., and He, K.-B.: Efficient data preprocessing, episode classification, and source apportionment of particle number concentrations, Sci. Total Environ., 744, 140923, https://doi.org/10.1016/j.scitotenv.2020.140923, 2020. a
Liang, C.-S., Yue, D., Wu, H., Shi, J.-S., and He, K.-B.: Source apportionment of atmospheric particle number concentrations with wide size range by nonnegative matrix factorization (NMF), Environ. Pollut., 289, 117846, https://doi.org/10.1016/j.envpol.2021.117846, 2021. a, b
Linnet, K.: Estimation of the linear relationship between the measurements of two methods with proportional errors, Stat. Med., 9, 1463–1473, https://doi.org/10.1002/sim.4780091210, 1990. a
Liu, C., Chung, C. E., Yin, Y., and Schnaiter, M.: The absorption Ångström exponent of black carbon: from numerical aspects, Atmos. Chem. Phys., 18, 6259–6273, https://doi.org/10.5194/acp-18-6259-2018, 2018. a
Looschelders, D., Christen, A., Grimmond, S., Kotthaus, S., Fenner, D., Dupont, J.-C., Haeffelin, M., and Morrison, W.: Inter-Instrument Variability of Vaisala CL61 Lidar-Ceilometer's Attenuated Backscatter, Cloud Properties and Mixed-Layer Height, Meteorol. Appl., 32, e70088, https://doi.org/10.1002/met.70088, 2025. a
Maher, B. A., Gonet, T., Karloukovski, V. V., Wang, H., and Bannan, T. J.: Protecting playgrounds: local-scale reduction of airborne particulate matter concentrations through particulate deposition on roadside “tredges” (green infrastructure), Sci. Rep., 12, 14236, https://doi.org/10.1038/s41598-022-18509-w, 2022. a
Mapelli, C., Diémoz, H., Contini, D., Dinoi, A., Cesari, D., and Barnaba, F.: Physics-based aerosol source apportionment at the site of Lecce (Italy), Atmos. Res., in review, 2026. a, b
Marsteen, L. and Hak, C.: NILU Report 21/2021: PM10/PM2.5 comparison exercise in Oslo, Norway. Study in 2015–2016 and 2018, Tech. rep., Norwegian Institute for Air Research (NILU), ISBN 978-82-425-3059-2, 2021. a
Masiol, M., Vu, T. V., Beddows, D. C., and Harrison, R. M.: Source apportionment of wide range particle size spectra and black carbon collected at the airport of Venice (Italy), Atmos. Environ., 139, 56–74, https://doi.org/10.1016/j.atmosenv.2016.05.018, 2016. a, b, c
Masiol, M., Harrison, R. M., Vu, T. V., and Beddows, D. C. S.: Sources of sub-micrometre particles near a major international airport, Atmos. Chem. Phys., 17, 12379–12403, https://doi.org/10.5194/acp-17-12379-2017, 2017a. a, b, c, d, e, f
Masiol, M., Hopke, P., Felton, H., Frank, B., Rattigan, O., Wurth, M., and LaDuke, G.: Source apportionment of PM2.5 chemically speciated mass and particle number concentrations in New York City, Atmos. Environ., 148, 215–229, https://doi.org/10.1016/j.atmosenv.2016.10.044, 2017b. a, b, c
Massabò, D., Caponi, L., Bernardoni, V., Bove, M., Brotto, P., Calzolai, G., Cassola, F., Chiari, M., Fedi, M., Fermo, P., Giannoni, M., Lucarelli, F., Nava, S., Piazzalunga, A., Valli, G., Vecchi, R., and Prati, P.: Multi-wavelength optical determination of black and brown carbon in atmospheric aerosols, Atmos. Environ., 108, 1–12, https://doi.org/10.1016/j.atmosenv.2015.02.058, 2015. a
Mattsson, F., Neuberger, A., Heikkinen, L., Gramlich, Y., Paglione, M., Rinaldi, M., Decesari, S., Zieger, P., Riipinen, I., and Mohr, C.: Enrichment of organic nitrogen in fog residuals observed in the Italian Po Valley, Atmos. Chem. Phys., 25, 7973–7989, https://doi.org/10.5194/acp-25-7973-2025, 2025. a
Mazzei, F., Lucarelli, F., Nava, S., Prati, P., Valli, G., and Vecchi, R.: A new methodological approach: The combined use of two-stage streaker samplers and optical particle counters for the characterization of airborne particulate matter, Atmos. Environ., 41, 5525–5535, https://doi.org/10.1016/j.atmosenv.2007.04.012, 2007. a, b, c, d, e
Mazzi, G., Barbaro, E., Feltracco, M., Favaro, E., Diémoz, H., Milizia, L., Colombi, C., Bove, M. C., Troiano, S., Malloci, E., Ceccon, D., Baiutti, E., and Gambaro, A.: Investigation of airborne benzothiazoles in the North of Italy, Atmos. Environ., 356, 121311, https://doi.org/10.1016/j.atmosenv.2025.121311, 2025. a
McNamara, S. M., Kolesar, K. R., Wang, S., Kirpes, R. M., May, N. W., Gunsch, M. J., Cook, R. D., Fuentes, J. D., Hornbrook, R. S., Apel, E. C., China, S., Laskin, A., and Pratt, K. A.: Observation of Road Salt Aerosol Driving Inland Wintertime Atmospheric Chlorine Chemistry, ACS Cent. Sci., 6, 684–694, https://doi.org/10.1021/acscentsci.9b00994, 2020. a
Mecca, D., Boanini, C., Vaccaro, V., Gallione, D., Mastromatteo, N., and Clerico, M.: Spatial variation, temporal evolution, and source direction apportionment of PM1, PM2.5, and PM10: 3-year assessment in Turin (Po Valley), Environ. Monit. Assess., 196, 1251, https://doi.org/10.1007/s10661-024-13446-9, 2024. a
Micheli, L., Almonacid, F., Bessa, J. G., Álvaro Fernández-Solas, and Fernández, E. F.: The impact of extreme dust storms on the national photovoltaic energy supply, Sustain. Energy Technol. Assess., 62, 103607, https://doi.org/10.1016/j.seta.2024.103607, 2024. a
Mircea, M., Calori, G., Pirovano, G., and Belis, C.: European guide on air pollution source apportionment for particulate matter with source oriented models and their combined use with receptor models, EUR 30082 EN, Publications Office of the European Union, Luxembourg, JRC119067, ISBN 978-92-76-10698-2, https://doi.org/10.2760/470628, 2020. a
Mousavi, A., Sowlat, M. H., Lovett, C., Rauber, M., Szidat, S., Boffi, R., Borgini, A., De Marco, C., Ruprecht, A. A., and Sioutas, C.: Source apportionment of black carbon (BC) from fossil fuel and biomass burning in metropolitan Milan, Italy, Atmos. Environ., 203, 252–261, https://doi.org/10.1016/j.atmosenv.2019.02.009, 2019. a
NASA: Worldview earthdata website, https://worldview.earthdata.nasa.gov (last access: 2 June 2026), 2024. a
Ng, N. L., Canagaratna, M. R., Jimenez, J. L., Zhang, Q., Ulbrich, I. M., and Worsnop, D. R.: Real-Time Methods for Estimating Organic Component Mass Concentrations from Aerosol Mass Spectrometer Data, Environ. Sci. Tech., 45, 910–916, https://doi.org/10.1021/es102951k, 2011a. a
Ng, N. L., Herndon, S. C., Trimborn, A., Canagaratna, M. R., Croteau, P. L., Onasch, T. B., Sueper, D., Worsnop, D. R., Zhang, Q., Sun, Y. L., and Jayne, J. T.: An Aerosol Chemical Speciation Monitor (ACSM) for Routine Monitoring of the Composition and Mass Concentrations of Ambient Aerosol, Aerosol Sci. Tech., 45, 780–794, https://doi.org/10.1080/02786826.2011.560211, 2011b. a
Norris, G., Duvall, R., and Brown, S.: EPA Positive Matrix Factorization (PMF) 5.0 Fundamentals and User Guide, U.S. Environmental Protection Agency Office of Research and Development Washington, DC 20460, ePA/600/R-14/108, https://www.epa.gov/sites/default/files/2015-02/documents/pmf_5.0_user_guide.pdf (last access: 2 June 2026), 2014. a, b
Ogulei, D., Hopke, P. K., and Wallace, L. A.: Analysis of indoor particle size distributions in an occupied townhouse using positive matrix factorization, Indoor Air, 16, 204–215, https://doi.org/10.1111/j.1600-0668.2006.00418.x, 2006a. a
Ogulei, D., Hopke, P. K., Zhou, L., Pancras, J. P., Nair, N., and Ondov, J. M.: Source apportionment of Baltimore aerosol from combined size distribution and chemical composition data, Atmos. Environ., 40, 396–410, https://doi.org/10.1016/j.atmosenv.2005.11.075, 2006b. a, b, c
Ogulei, D., Hopke, P. K., Chalupa, D. C., , and Utell, M. J.: Modeling Source Contributions to Submicron Particle Number Concentrations Measured in Rochester, New York, Aerosol Sci. Tech., 41, 179–201, https://doi.org/10.1080/02786820601116012, 2007. a, b, c, d
O'Neill, N. T., Dubovik, O., and Eck, T. F.: Modified Ångström exponent for the characterization of submicrometer aerosols, Appl. Opt., 40, 2368–2375, https://doi.org/10.1364/AO.40.002368, 2001. a, b
Orellano, P., Reynoso, J., Quaranta, N., Bardach, A., and Ciapponi, A.: Short-term exposure to particulate matter (PM10 and PM2.5), nitrogen dioxide (NO2), and ozone (O3) and all-cause and cause-specific mortality: Systematic review and meta-analysis, Environ. Int., 142, 105876, https://doi.org/10.1016/j.envint.2020.105876, 2020. a
Ouaret, R., Ionescu, A., and Ramalho, O.: Non-negative matrix factorization for the analysis of particle number concentrations: Characterization of the temporal variability of sources in indoor workplace, Build. Environ., 203, 108055, https://doi.org/10.1016/j.buildenv.2021.108055, 2021. a
Paatero, P.: Referee comment RC2, Atmos. Chem. Phys. Discuss., https://doi.org/10.5194/acp-2018-784-RC2, 2018. a, b
Paatero, P. and Tapper, U.: Positive matrix factorization: A non-negative factor model with optimal utilization of error estimates of data values, Environmetrics, 5, 111–126, https://doi.org/10.1002/env.3170050203, 1994. a
Paatero, P., Eberly, S., Brown, S. G., and Norris, G. A.: Methods for estimating uncertainty in factor analytic solutions, Atmos. Meas. Tech., 7, 781–797, https://doi.org/10.5194/amt-7-781-2014, 2014. a, b, c, d
PALAS GmbH: Report on supplementary testing of the Fidas® 200 S respectively Fidas® 200 measuring system manufactured by PALAS GmbH for the components suspended particulate matter PM10 and PM2.5, TÜV-report: 936/21227195/C, Operating Manual Fine Dust Monitor System Fidas® – Version V0230816, TÜV Rheinland Energie und Umwelt GmbH, https://www.palas.de/file/ea8697/application/octet-stream/Palas+T%C3%9CV+Fidas+System (last access: 2 June 2026), 2016. a, b
Parworth, C., Fast, J., Mei, F., Shippert, T., Sivaraman, C., Tilp, A., Watson, T., and Zhang, Q.: Long-term measurements of submicrometer aerosol chemistry at the Southern Great Plains (SGP) using an Aerosol Chemical Speciation Monitor (ACSM), Atmos. Environ., 106, 43–55, https://doi.org/10.1016/j.atmosenv.2015.01.060, 2015. a
Petit, J.-E., Favez, O., and Chauvigné, A.: Deliverable D5 (D1.5) NRT Source Apportionment Service Tools for submicron carbonaceous matter (final), Tech. rep., RI-URBANS Research Infrastructures Services Reinforcing Air Quality Monitoring Capacities in European Urban & Industrial AreaS (GA n. 101036245), https://riurbans.eu/wp-content/uploads/2024/12/RI-URBANS_D5_D1_5.pdf (last access: 2 June 2026), 2024. a
Pey, J., Querol, X., Alastuey, A., Rodríguez, S., Putaud, J. P., and Van Dingenen, R.: Source apportionment of urban fine and ultra-fine particle number concentration in a Western Mediterranean city, Atmos. Environ., 43, 4407–4415, https://doi.org/10.1016/j.atmosenv.2009.05.024, 2009. a, b, c
Pey, J., Querol, X., Alastuey, A., Forastiere, F., and Stafoggia, M.: African dust outbreaks over the Mediterranean Basin during 2001–2011: PM10 concentrations, phenomenology and trends, and its relation with synoptic and mesoscale meteorology, Atmos. Chem. Phys., 13, 1395–1410, https://doi.org/10.5194/acp-13-1395-2013, 2013. a
Pitz, M., Cyrys, J., Karg, E., Wiedensohler, A., Wichmann, H.-E., and Heinrich, J.: Variability of Apparent Particle Density of an Urban Aerosol, Environ. Sci. Tech., 37, 4336–4342, https://doi.org/10.1021/es034322p, 2003. a
Pokorná, P., Leoni, C., Schwarz, J., Ondráček, J., Ondráčková, L., Vodička, P., Zíková, N., Moravec, P., Bendl, J., Klán, M., Hovorka, J., Zhao, Y., Cliff, S. S., Ždímal, V., and Hopke, P. K.: Spatial-temporal variability of aerosol sources based on chemical composition and particle number size distributions in an urban settlement influenced by metallurgical industry, Environ. Sci. Pollut. Res., 27, 38631–38643, https://doi.org/10.1007/s11356-020-09694-0, 2020. a, b
Qin, X., Wei, P., Ghadikolaei, M. A., Gali, N. K., Wang, Y., and Ning, Z.: The application of a multi-channel sensor network to decompose the local and background sources and quantify their contributions, Build. Environ., 230, 110005, https://doi.org/10.1016/j.buildenv.2023.110005, 2023. a
Querol, X., Pey, J., Pandolfi, M., Alastuey, A., Cusack, M., Pérez, N., Moreno, T., Viana, M., Mihalopoulos, N., Kallos, G., and Kleanthous, S.: African dust contributions to mean ambient PM10 mass-levels across the Mediterranean Basin, Atmos. Environ., 43, 4266–4277, https://doi.org/10.1016/j.atmosenv.2009.06.013, 2009. a
R Core Team: R: A Language and Environment for Statistical Computing, R Foundation for Statistical Computing, Vienna, Austria, https://www.R-project.org/ (last access: 2 June 2026), 2022. a
Reid, J. S., Koppmann, R., Eck, T. F., and Eleuterio, D. P.: A review of biomass burning emissions part II: intensive physical properties of biomass burning particles, Atmos. Chem. Phys., 5, 799–825, https://doi.org/10.5194/acp-5-799-2005, 2005. a
RI-URBANS: Guidance documents on measurements and modelling of novel air quality pollutants: Source apportionment of eBC, UFP, OP and VOCs, Tech. rep., Research Infrastructures Services Reinforcing Air Quality Monitoring Capacities in European Urban and Industrial AreaS (GA n. 101036245), https://riurbans.eu/wp-content/uploads/2024/11/ENV_GUIDANCE-DOCUMENT_ST11_SA_BC_UFP_OP_VOCs_Definitive.pdf (last access: 2 June 2026), 2024. a
Rivas, I., Beddows, D. C., Amato, F., Green, D. C., Järvi, L., Hueglin, C., Reche, C., Timonen, H., Fuller, G. W., Niemi, J. V., Pérez, N., Aurela, M., Hopke, P. K., Alastuey, A., Kulmala, M., Harrison, R. M., Querol, X., and Kelly, F. J.: Source apportionment of particle number size distribution in urban background and traffic stations in four European cities, Environ. Int., 135, 105345, https://doi.org/10.1016/j.envint.2019.105345, 2020. a, b, c, d, e
Rodríguez, S. and López-Darias, J.: Extreme Saharan dust events expand northward over the Atlantic and Europe, prompting record-breaking PM10 and PM2.5 episodes, Atmos. Chem. Phys., 24, 12031–12053, https://doi.org/10.5194/acp-24-12031-2024, 2024. a, b
Rovira, J., Savadkoohi, M., Chen, G. I., Močnik, G., Aas, W., Alados-Arboledas, L., Artiñano, B., Aurela, M., Backman, J., Banerji, S., Beddow, D., Brem, B., Chazeau, B., Collaud Coen, M., Colombi, C., Conil, S., Costabile, F., Coz, E., de Brito, J. F., Eleftheriadis, K., Favez, O., Flentje, H., Freney, E., Gregorič, A., Gysel-Beer, M., Harrison, R., Hueglin, C., Hyvärinen, A., Ivančič, M., Kalogridis, A.-C., Keernik, H., Konstantinos, G., Laj, P., Liakakou, E., Lin, C., Listrani, S., Luoma, K., Maasikmets, M., Manninen, H. E., Marchand, N., dos Santos, S. M., Mbengue, S., Mihalopoulos, N., Nicolae, D., Niemi, J. V., Norman, M., Ovadnevaite, J., Petit, J.-E., Platt, S., Prévôt, A. S., Pujadas, M., Putaud, J.-P., Riffault, V., Rigler, M., Rinaldi, M., Schwarz, J., Silvergren, S., Teinemaa, E., Teinilä, K., Timonen, H., Titos, G., Tobler, A., Vasilescu, J., Vratolis, S., Espen Yttri, K., Yubero, E., Zíková, N., Alastuey, A., Petäjä, T., Querol, X., Yus-Díez, J., and Pandolfi, M.: A European aerosol phenomenology – 9: Light absorption properties of carbonaceous aerosol particles across surface Europe, Environ. Int., 195, 109185, https://doi.org/10.1016/j.envint.2024.109185, 2025. a, b, c, d
Russell, P. B., Bergstrom, R. W., Shinozuka, Y., Clarke, A. D., DeCarlo, P. F., Jimenez, J. L., Livingston, J. M., Redemann, J., Dubovik, O., and Strawa, A.: Absorption Angstrom Exponent in AERONET and related data as an indicator of aerosol composition, Atmos. Chem. Phys., 10, 1155–1169, https://doi.org/10.5194/acp-10-1155-2010, 2010. a, b
Salvador, P., Pey, J., Pérez, N., Querol, X., and Artíñano, B.: Increasing atmospheric dust transport towards the western Mediterranean over 1948–2020, npj Clim. Atmos. Sci., 5, 34, https://doi.org/10.1038/s41612-022-00256-4, 2022. a
Sandradewi, J., Prévôt, A. S. H., Szidat, S., Perron, N., Alfarra, M. R., Lanz, V. A., Weingartner, E., and Baltensperger, U.: Using Aerosol Light Absorption Measurements for the Quantitative Determination of Wood Burning and Traffic Emission Contributions to Particulate Matter, Environ. Sci. Tech., 42, 3316–3323, https://doi.org/10.1021/es702253m, 2008. a, b, c, d, e
Sarafian, R., Nathan, S., Nissenbaum, D., Khan, S., and Rudich, Y.: Correction of CAMS PM10 Reanalysis Improves AI-Based Dust Event Forecast, Remote Sens., 17, https://doi.org/10.3390/rs17020222, 2025. a
Savadkoohi, M., Pandolfi, M., Favez, O., Putaud, J.-P., Eleftheriadis, K., Fiebig, M., Hopke, P. K., Laj, P., Wiedensohler, A., Alados-Arboledas, L., Bastian, S., Chazeau, B., Álvaro Clemente María, Colombi, C., Costabile, F., Green, D. C., Hueglin, C., Liakakou, E., Luoma, K., Listrani, S., Mihalopoulos, N., Marchand, N., Močnik, G., Niemi, J. V., Ondráček, J., Petit, J.-E., Rattigan, O. V., Reche, C., Timonen, H., Titos, G., Tremper, A. H., Vratolis, S., Vodička, P., Funes, E. Y., Zíková, N., Harrison, R. M., Petäjä, T., Alastuey, A., and Querol, X.: Recommendations for reporting equivalent black carbon (eBC) mass concentrations based on long-term pan-European in-situ observations, Environ. Int., 185, 108553, https://doi.org/10.1016/j.envint.2024.108553, 2024. a, b, c
Savadkoohi, M., Sofowote, U. M., Querol, X., Alastuey, A., Pandolfi, M., and Hopke, P. K.: Source-dependent absorption Ångström exponent in the Los Angeles Basin: Multi-time resolution factor analyses of ambient PM2.5 and aerosol optical absorption, Sci. Total Environ., 958, 178095, https://doi.org/10.1016/j.scitotenv.2024.178095, 2025. a, b, c
Song, C., Dall'Osto, M., Lupi, A., Mazzola, M., Traversi, R., Becagli, S., Gilardoni, S., Vratolis, S., Yttri, K. E., Beddows, D. C. S., Schmale, J., Brean, J., Kramawijaya, A. G., Harrison, R. M., and Shi, Z.: Differentiation of coarse-mode anthropogenic, marine and dust particles in the High Arctic islands of Svalbard, Atmos. Chem. Phys., 21, 11317–11335, https://doi.org/10.5194/acp-21-11317-2021, 2021. a
Sowlat, M. H., Hasheminassab, S., and Sioutas, C.: Source apportionment of ambient particle number concentrations in central Los Angeles using positive matrix factorization (PMF), Atmos. Chem. Phys., 16, 4849–4866, https://doi.org/10.5194/acp-16-4849-2016, 2016. a, b, c, d, e, f
Stirnberg, R., Cermak, J., Kotthaus, S., Haeffelin, M., Andersen, H., Fuchs, J., Kim, M., Petit, J.-E., and Favez, O.: Meteorology-driven variability of air pollution (PM1) revealed with explainable machine learning, Atmos. Chem. Phys., 21, 3919–3948, https://doi.org/10.5194/acp-21-3919-2021, 2021. a
Struckmeier, C., Drewnick, F., Fachinger, F., Gobbi, G. P., and Borrmann, S.: Atmospheric aerosols in Rome, Italy: sources, dynamics and spatial variations during two seasons, Atmos. Chem. Phys., 16, 15277–15299, https://doi.org/10.5194/acp-16-15277-2016, 2016. a
Targa, J., Colina, M., Banyuls, L., González Ortiz, A., and Soares, J.: Status report of air quality in Europe for year 2023, using validated and up-to-date data (ETC-HE Report 2024/5), Tech. rep., European Topic Centre on Human Health and the Environment, https://www.eionet.europa.eu/etcs/etc-he/products/etc-he-products/etc-he-reports/etc-he-report-2024-5-status-report-of-air-quality-in-europe-for-year-2023-using-validated-and-up-to-date-data (last access: 2 June 2026), 2024. a
Tesche, M., Ansmann, A., Müller, D., Althausen, D., Engelmann, R., Freudenthaler, V., and Groß, S.: Vertically resolved separation of dust and smoke over Cape Verde using multiwavelength Raman and polarization lidars during Saharan Mineral Dust Experiment 2008, J. Geophys. Res., 114, https://doi.org/10.1029/2009JD011862, 2009. a
Thimmaiah, D., Hovorka, J., and Hopke, P. K.: Source apportionment of winter submicron prague aerosols from combined particle number size distribution and gaseous composition data, Aerosol Air Qual. Res., 9, 209–236, https://doi.org/10.4209/aaqr.2008.11.0055, 2009. a, b
Tohidi, R., Farahani, V. J., and Sioutas, C.: Real-time measurements of mineral dust concentration in coarse particulate matter (PM10–2.5) by employing a novel optical-based technique in Los Angeles, Sci. Total Environ., 838, 156215, https://doi.org/10.1016/j.scitotenv.2022.156215, 2022. a, b
TÜV Rheinland Energie und Umwelt GmbH: Report on supplementary testing of the Fidas® 200 S respectively idas® 200 measuring system manufactured by PALAS GmbH for the components suspended particulate matter PM10 and PM2.5, TÜV-report: 936/21227195/C, Tech. rep., TÜV Rheinland Energie und Umwelt GmbH, https://www.palas.de/file/ea8697/application/octet-stream/Palas+T%C3%9CV+Fidas+System (last access: 2 June 2026), 2016. a, b
United States Environmental Protection Agency: Positive Matrix Factorization Model for Environmental Data Analyses, https://www.epa.gov/air-research/positive-matrix-factorization-model-environmental-data-analyses (last access: 2 June 2026), 2014. a, b
Valentini, S., Barnaba, F., Bernardoni, V., Calzolai, G., Costabile, F., Di Liberto, L., Forello, A. C., Gobbi, G. P., Gualtieri, M., Lucarelli, F., Nava, S., Petralia, E., Valli, G., Wiedensohler, A., and Vecchi, R.: Classifying aerosol particles through the combination of optical and physical-chemical properties: results from a wintertime campaign in Rome (Italy), Atmos. Res., 235, 104799, https://doi.org/10.1016/j.atmosres.2019.104799, 2020. a
Van Poppel, M., Schneider, P., Peters, J., Yatkin, S., Gerboles, M., Matheeussen, C., Bartonova, A., Davila, S., Signorini, M., Vogt, M., Dauge, F. R., Skaar, J. S., and Haugen, R.: SensEURCity: A multi-city air quality dataset collected for 2020/2021 using open low-cost sensor systems, Sci. Data, 10, 322, https://doi.org/10.1038/s41597-023-02135-w, 2023. a
Vecchi, R.: Cutting-Edge Approaches for Aerosol Source Apportionment by Receptor Modelling, vol. European Aerosol Conference (EAC2023), https://www.dfmf.uned.es/EAC2023/service.php?myabstract=5659643a&uuid=51568afba12da4238d10bdc62aa4ddf7 (last access: 2 June 2026), 2023. a
Via, M., Chen, G., Canonaco, F., Daellenbach, K. R., Chazeau, B., Chebaicheb, H., Jiang, J., Keernik, H., Lin, C., Marchand, N., Marin, C., O'Dowd, C., Ovadnevaite, J., Petit, J.-E., Pikridas, M., Riffault, V., Sciare, J., Slowik, J. G., Simon, L., Vasilescu, J., Zhang, Y., Favez, O., Prévôt, A. S. H., Alastuey, A., and Cruz Minguillón, M.: Rolling vs. seasonal PMF: real-world multi-site and synthetic dataset comparison, Atmos. Meas. Tech., 15, 5479–5495, https://doi.org/10.5194/amt-15-5479-2022, 2022. a
Via, M., Yus-Díez, J., Canonaco, F., Petit, J.-E., Hopke, P., Reche, C., Pandolfi, M., Ivančič, M., Rigler, M., Prevôt, A. S., Querol, X., Alastuey, A., and Minguillón, M. C.: Towards a better understanding of fine PM sources: Online and offline datasets combination in a single PMF, Environ. Int., 177, 108006, https://doi.org/10.1016/j.envint.2023.108006, 2023. a
Vörösmarty, M., Hopke, P. K., and Salma, I.: Attribution of aerosol particle number size distributions to main sources using an 11-year urban dataset, Atmos. Chem. Phys., 24, 5695–5712, https://doi.org/10.5194/acp-24-5695-2024, 2024. a, b, c
Vu, T. V., Delgado-Saborit, J. M., and Harrison, R. M.: Review: Particle number size distributions from seven major sources and implications for source apportionment studies, Atmos. Environ., 122, 114–132, https://doi.org/10.1016/j.atmosenv.2015.09.027, 2015. a, b, c
Wang, P., Wang, Q., Jia, Y., Ma, J., Wang, C., Qiao, L., Fu, Q., Mellouki, A., Chen, H., and Li, L.: A Novel Apportionment Method Utilizing Particle Mass Size Distribution across Multiple Particle Size Ranges, Atmosphere, 15, https://doi.org/10.3390/atmos15080955, 2024a. a, b
Wang, Y., Hopke, P. K., Rattigan, O. V., Xia, X., Chalupa, D. C., and Utell, M. J.: Characterization of Residential Wood Combustion Particles Using the Two-Wavelength Aethalometer, Environ. Sci. Tech., 45, 7387–7393, https://doi.org/10.1021/es2013984, 2011. a
Wang, Y., Hopke, P. K., Rattigan, O. V., Chalupa, D. C., and Utell, M. J.: Multiple-year black carbon measurements and source apportionment using Delta-C in Rochester, New York, J. Air Waste Ma., 62, 880–887, https://doi.org/10.1080/10962247.2012.671792, 2012. a
Wang, Z., Wang, Z., Zou, Z., Chen, X., Wu, H., Wang, W., Su, H., Li, F., Xu, W., Liu, Z., and Zhu, J.: Severe Global Environmental Issues Caused by Canada's Record-Breaking Wildfires in 2023, Adv. Atmos.Sci., 41, 565–571, https://doi.org/10.1007/s00376-023-3241-0, 2024b. a
Wang, Z. B., Hu, M., Wu, Z. J., Yue, D. L., He, L. Y., Huang, X. F., Liu, X. G., and Wiedensohler, A.: Long-term measurements of particle number size distributions and the relationships with air mass history and source apportionment in the summer of Beijing, Atmos. Chem. Phys., 13, 10159–10170, https://doi.org/10.5194/acp-13-10159-2013, 2013. a, b
Watson, J. G., Cooper, J. A., and Huntzicker, J. J.: The effective variance weighting for least squares calculations applied to the mass balance receptor model, Atmos. Environ., 18, 1347–1355, https://doi.org/10.1016/0004-6981(84)90043-X, 1984. a, b
Watson, J. G., Chow, J. C., and Pace, T. G.: Chapter 4 – Chemical Mass Balance, in: Receptor modeling for air quality management, edited by: Hopke, P. K., vol. 7 of Data Handling in Science and Technology, Elsevier, 83–116, https://doi.org/10.1016/S0922-3487(08)70127-8, 1991. a
Wegner, T., Hussein, T., Hämeri, K., Vesala, T., Kulmala, M., and Weber, S.: Properties of aerosol signature size distributions in the urban environment as derived by cluster analysis, Atmos. Environ., 61, 350–360, https://doi.org/10.1016/j.atmosenv.2012.07.048, 2012. a
World Health Organization: WHO global air quality guidelines: particulate matter (PM2.5 and PM10), ozone, nitrogen dioxide, sulfur dioxide and carbon monoxide, World Health Organization, ISBN 9789240034228, 2021. a
Wu, H., Li, Z., Jiang, M., Liang, C., Zhang, D., Wu, T., Wang, Y., and Cribb, M.: Contributions of traffic emissions and new particle formation to the ultrafine particle size distribution in the megacity of Beijing, Atmos. Environ., 262, 118652, https://doi.org/10.1016/j.atmosenv.2021.118652, 2021. a, b
Yang, M., Howell, S. G., Zhuang, J., and Huebert, B. J.: Attribution of aerosol light absorption to black carbon, brown carbon, and dust in China – interpretations of atmospheric measurements during EAST-AIRE, Atmos. Chem. Phys., 9, 2035–2050, https://doi.org/10.5194/acp-9-2035-2009, 2009. a, b
York, D., Evensen, N. M., Martínez, M. L., and De Basabe Delgado, J.: Unified equations for the slope, intercept, and standard errors of the best straight line, Am. J. Phys., 72, 367–375, https://doi.org/10.1119/1.1632486, 2004. a
Yue, W., Stölzel, M., Cyrys, J., Pitz, M., Heinrich, J., Kreyling, W. G., Wichmann, H.-E., Peters, A., Wang, S., and Hopke, P. K.: Source apportionment of ambient fine particle size distribution using positive matrix factorization in Erfurt, Germany, Sci. Total Environ., 398, 133–144, https://doi.org/10.1016/j.scitotenv.2008.02.049, 2008. a, b, c, d, e, f
Zanatta, M., Gysel, M., Bukowiecki, N., Müller, T., Weingartner, E., Areskoug, H., Fiebig, M., Yttri, K., Mihalopoulos, N., Kouvarakis, G., Beddows, D., Harrison, R., Cavalli, F., Putaud, J., Spindler, G., Wiedensohler, A., Alastuey, A., Pandolfi, M., Sellegri, K., Swietlicki, E., Jaffrezo, J., Baltensperger, U., and Laj, P.: A European aerosol phenomenology-5: Climatology of black carbon optical properties at 9 regional background sites across Europe, Atmos. Environ., 145, 346–364, https://doi.org/10.1016/j.atmosenv.2016.09.035, 2016. a
Zhou, L., Hopke, P. K., Paatero, P., Ondov, J. M., Pancras, J., Pekney, N. J., and Davidson, C. I.: Advanced factor analysis for multiple time resolution aerosol composition data, Atmos. Environ., 38, 4909–4920, https://doi.org/10.1016/j.atmosenv.2004.05.040, 2004. a, b, c, d
Zhou, L., Hopke, P. K., Stanier, C. O., Pandis, S. N., Ondov, J. M., and Pancras, J. P.: Investigation of the relationship between chemical composition and size distribution of airborne particles by partial least squares and positive matrix factorization, J. Geophys. Res., 110, https://doi.org/10.1029/2004JD005050, 2005a. a, b
Zhou, L., Kim, E., Hopke, P. K., Stanier, C., and Pandis, S. N.: Mining airborne particulate size distribution data by positive matrix factorization, J. Geophys. Res., 110, https://doi.org/10.1029/2004JD004707, 2005b. a
Zotter, P., Herich, H., Gysel, M., El-Haddad, I., Zhang, Y., Močnik, G., Hüglin, C., Baltensperger, U., Szidat, S., and Prévôt, A. S. H.: Evaluation of the absorption Ångström exponents for traffic and wood burning in the Aethalometer-based source apportionment using radiocarbon measurements of ambient aerosol, Atmos. Chem. Phys., 17, 4229–4249, https://doi.org/10.5194/acp-17-4229-2017, 2017. a, b, c, d, e
- Abstract
- Introduction
- Experimental dataset
- Baseline and novel approaches to source apportionment: from PMF to RASPBERRY
- Results
- Discussion
- Conclusions and perspectives
- Code and data availability
- Author contributions
- Competing interests
- Disclaimer
- Acknowledgements
- Review statement
- References
- Supplement