the Creative Commons Attribution 4.0 License.
the Creative Commons Attribution 4.0 License.
 | 04 Jun 2026
CopterSonde-SWX: development of a UAS-based Vertical Atmospheric Profiler for severe weather
Tyler M. Bell
Abdullah A. Tasim
Aaron Quiroz
Jeremy D. Simms
Joshua G. Gebauer
Elizabeth N. Smith
Growing demand for high spatiotemporal resolution observations in the planetary boundary layer has driven the development of affordable, small uncrewed aircraft systems (UAS) technology to fill critical observational gaps and support improved understanding and future assimilation into prediction models. This work presents the CopterSonde-SWX (CSWX), an in-situ UAS vertical profiler that combines a high-thrust tilted-body airframe, a wind-vane flight mode for sampling undisturbed air, and a shielded actively ventilated sensor scoop to acquire thermodynamic and full 3D wind vectors without dedicated anemometers. Through a series of flow simulations and intercomparison field campaigns, including colocated flights with its predecessor (CS3D), Doppler wind lidars, and radiosondes, the CSWX demonstrated inter-sensor temperature uniformity within ±0.2 °C across variable solar and wind regimes and achieved Linear Extended State Observer (LESO)-based wind retrieval RMSEs of 0.49 m s−1 (vertical) and 1.03 m s−1 (horizontal). In a nocturnal low-level jet case, the CSWX sustained winds up to ∼ 24 m s−1 at 520 m (versus the CS3D's 20 m s−1 limit at ∼ 275 m), with polynomial fits projecting a safe maximum wind tolerance of 29.5 m s−1 while retaining sufficient battery energy margin for safe return. These results support the CSWX as a resilient, high-fidelity platform for atmospheric profiling, advancing the transition from a research prototype to an operational instrument. Even though the CopterSonde is an experimental design, this work may serve as a guideline to define future standards for weather-sensing UAS (WxUAS) development.
- Article
(4511 KB) - Full-text XML
- BibTeX
- EndNote


Accurate, high-resolution observations of the planetary boundary layer (PBL) are essential for improving weather forecasting and climate modeling. Conventional measurement methods – such as ground-based sensors and radiosondes – have long provided valuable atmospheric data but are limited by infrequent sampling and coarse spatial resolution (Geerts et al., 2018; Dabberdt et al., 2005). In particular, radiosondes, which are typically launched only a couple of times a day at low spatial density, cannot resolve the rapid, localized changes that occur within the PBL. This observational gap poses a significant challenge for capturing the fast mesoscale evolution that is often key to predicting severe weather phenomena. A better understanding of the atmospheric processes could be beneficial to society, given the profound socio-economic impacts associated with severe weather events. This includes thunderstorms, tornadoes, and tropical storms that cost billions of dollars annually to the U.S. economy (Lazo et al., 2011; Goklany, 2009; Webster, 2013). Changes in severe weather patterns further amplify these impacts by intensifying damaging weather extremes (Liu, 2017; Frame et al., 2020), affecting biodiversity (Scheffers and Pecl, 2019), food production (Rosenzweig et al., 2001; Gregory et al., 2005), supply chains (Markolf et al., 2019), and public health (Curtis et al., 2017; Mirza, 2003).
Recognizing these challenges, meteorological organizations have underscored the need for innovative observation technologies. Initiatives by the National Weather Service (NWS) and the National Severe Storm Laboratory (NSSL) advocate for integrated, high-resolution sensor networks to better monitor the lower atmosphere (National Weather Service (NWS), 2019; National Severe Storm Laboratory (NSSL), 2015; Zhang et al., 2016). Recent advances in uncrewed aircraft systems (UAS) have opened promising avenues for atmospheric sampling. Fiebrich et al. (2021) further shows that a network of weather-sensing UAS (WxUAS) profilers could potentially deliver high-resolution vertical atmospheric data to improve forecasting, optimize agriculture and energy use, manage wildfires and air quality, and support climate monitoring, thereby yielding significant economic, environmental, and public health benefits. Driven by progress in automation, affordable construction materials, and innovative design techniques, UAS technology has found success in fields such as agriculture, land surveying, and surveillance (Shakhatreh et al., 2019). Yet, while the commercial market has predominantly focused on these applications, the potential for UAS in meteorological research and operations, especially for high-frequency vertical profiles, has remained largely underexploited.
In response to this pressing need, this article introduces the next generation of CopterSonde UAS. The CopterSonde is a novel WxUAS concept that is constantly evolving for in situ thermodynamic and kinematic profiling of the PBL. The CopterSonde diverges from conventional UAS designs by integrating a dedicated thermodynamic sensor package with an aspiration system and by incorporating custom flight control algorithms to mitigate platform-induced measurement errors (Segales et al., 2020; Bell et al., 2020; Greene et al., 2018, 2019). Furthermore, its onboard weathervane-like function enables the collection of high-fidelity thermodynamic and kinematic data without reliance on bulky and costly wind sensors (Segales, 2022). This design concept preserves the CopterSonde's streamlined aerodynamic profile and minimizes aerodynamic drag. Altogether, these features make the CopterSonde uniquely suited to capture detailed vertical profiles of the PBL, particularly in high-wind conditions, thereby mitigating some of the limitations of traditional in situ techniques.
Collaborative field experiments across multiple institutions compared various WxUAS platforms alongside conventional meteorological instruments (de Boer et al., 2024; Hervo et al., 2023; Barbieri et al., 2019; Jacob et al., 2018; Koch et al., 2018; Kral et al., 2018). These experiments have guided the evolution of WxUAS designs and shown that UAS-based sampling effectively bridges observational gaps by delivering flexible, high-frequency, and targeted atmospheric profiles. Many creative and effective WxUAS-based measurement techniques were tested and evaluated, with their results shared with the research community (Kistner et al., 2024; Wildmann and Wetz, 2022; Segales et al., 2022; de Boer et al., 2022; Islam et al., 2019; Houston and Keeler, 2018). Even the World Meteorological Organization (WMO) launched a global demonstration campaign in 2024 to evaluate the capacity of emerging UAS technologies to satisfy future operational requirements (WMO, 2021). Datasets from some field experiments are available for analysis and verification (Bell and Segales, 2024; Greene et al., 2020; de Boer et al., 2020b; Lappin et al., 2023). The CopterSonde also contributed to the PERiLS linear-storm field campaign (Kosiba et al., 2024), yielding valuable datasets (Bell et al., 2024; Smith et al., 2024). During PERiLS, extreme (> 25 m s−1) pre-storm winds exposed the platform's operational limits, showing how such conditions can hinder critical atmospheric data collection for forecasting. We have thus determined that WxUAS require enhanced performance to operate in high-wind layers and reach deeper atmospheric profiles. We also invite the reader to explore other datasets to become familiar with the variety of WxUAS platforms used in atmospheric studies, such as those collected during TORUS (Targeted Observations using Radars and UAS in Supercells) in 2019 and TORUS-LItE in 2021 (Houston et al., 2026).
The work presented in this article is built upon the hypothesis that the CopterSonde system, a WxUAS-based in-situ vertical profiler tailored specifically for atmospheric sampling, can deliver measurements of comparable quality to conventional instruments such as radiosondes and Doppler wind lidars, while also providing enhanced temporal and spatial resolution and filling the observational gap in the PBL, even in extreme wind conditions. The design and implementation of the CopterSonde draw on lessons from past field campaigns and extensive collaborative studies, including early prototype concepts and other further innovations in UAS meteorological applications (Wildmann et al., 2014; Chilson et al., 2019; de Boer et al., 2020a; McFarquhar et al., 2020). In doing so, the CopterSonde can not only help to fill the existing observational data gap but also pave the way for more adaptive and comprehensive weather sampling and monitoring systems, in line with strategic objectives from NOAA (National Oceanic and Atmospheric Administration (NOAA), 2020) and the recommendations outlined in recent decadal surveys (National Academies of Sciences, Engineering, and Medicine, 2018; National Research Council (NRC), 2009).
The following sections detail the technological innovations, design considerations, and field validation experiments that underpin the development of the CopterSonde. This research leverages UAS capabilities to develop a reusable platform for reliable atmospheric data acquisition, potentially enabling its integration into numerical weather model data assimilation to improve forecast accuracy and deepen our understanding of PBL dynamics, as demonstrated by recent studies that have successfully assimilated UAS observations into numerical weather prediction models (Murdzek and Ladwig, 2025; Jensen et al., 2021; Flagg et al., 2018).
The remainder of this article is structured into five sections as follows. Section 2 traces the evolution of the CopterSonde from early prototypes to modular UAS concepts, detailing design drivers and prototype learnings. Section 3 describes the CopterSonde-SWX severe-weather edition, including its high-thrust propulsion, 3D-wind estimation, and thermodynamic sensor enclosure aimed at mitigating solar radiation effects. Section 4 summarizes field operations and observations, covering deployment procedures and validation experiments under high wind and in precipitation. Finally, Sect. 5 concludes by synthesizing key findings on the CopterSonde-SWX (CSWX) design effectiveness, operational improvements, and demonstrated resilience in severe-weather environments, and outlines future development directions.
The evolution of the CopterSonde began as part of the ambitious 3D Mesonet project led by the University of Oklahoma between 2016 and 2021 (Chilson et al., 2019). The project aimed to enhance thermodynamic and kinematic measurements of the lower troposphere by augmenting traditional 2D, tower-based observations with high-resolution vertical profiles obtained from UAS. Early prototypes, such as the CopterSonde-1 (CS1), see Fig. 1, adopted a standard multicopter configuration with a symmetrical arrangement of temperature and humidity sensors mounted below the rotors. Although these initial designs facilitated quick manufacturing and deployment, preliminary field tests revealed that placing atmospheric sensors in the rotor wash region of the UAS often compromised measurement quality (Greene et al., 2018). Overall, the underperformance of the early CS1 design was noticeable in comparison to other platforms during field campaigns (Koch et al., 2018).
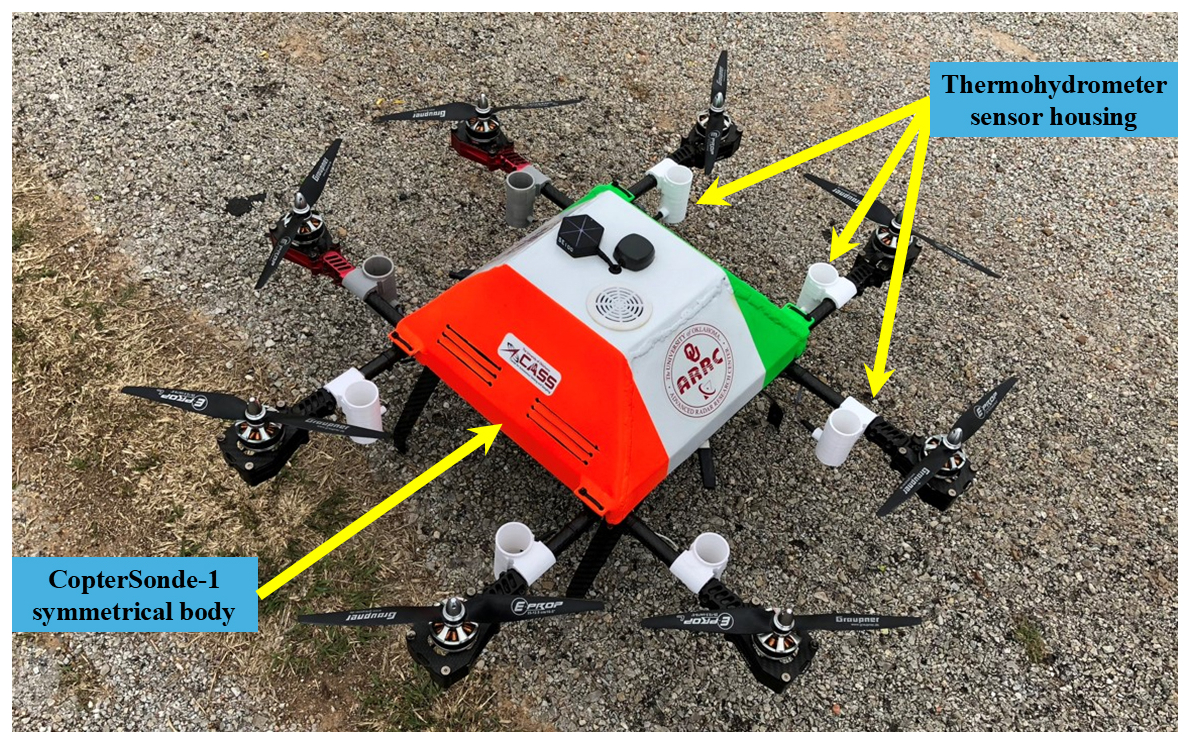
Figure 1CopterSonde-1 concept made in early 2017. An H-frame octocopter UAS with thermohygrometer sensors distributed in a symmetrical arrangement around the main body. The atmospheric sensors were housed and protected inside white plastic tubes and mounted on the UAS's arms below the rotors, shown by the yellow arrows pointing to some of the sensors.
To address these issues, extensive experiments were conducted in controlled settings, where various onboard sensor locations were evaluated to minimize aerodynamic disturbances caused by the UAS. (Jacob et al., 2018; Greene et al., 2018, 2019). The results indicated that no single position in proximity to propellers could entirely eliminate contamination, thereby prompting a redesign focused on airflow management. Consequently, we opted to integrate a dedicated ventilation and solar shielding system to maximize undisturbed air aspiration across the thermohygrometer sensors. We refer to this integration as the CopterSonde's scoop, which constitutes a centralized and modular sensor payload as depicted in Fig. 2b. The scoop and payload compartment were then molded and shaped to seamlessly blend with the external shell of the CopterSonde with the intent of improving aerodynamic performance. CAD software and 3D-printing techniques were used for fast development and prototyping of the CopterSonde's shell and scoop. A comprehensive description of these features is provided by Segales et al. (2020) and Chilson et al. (2021). These features form a core aspect of the CopterSonde's design and development, extending to subsequent generations.
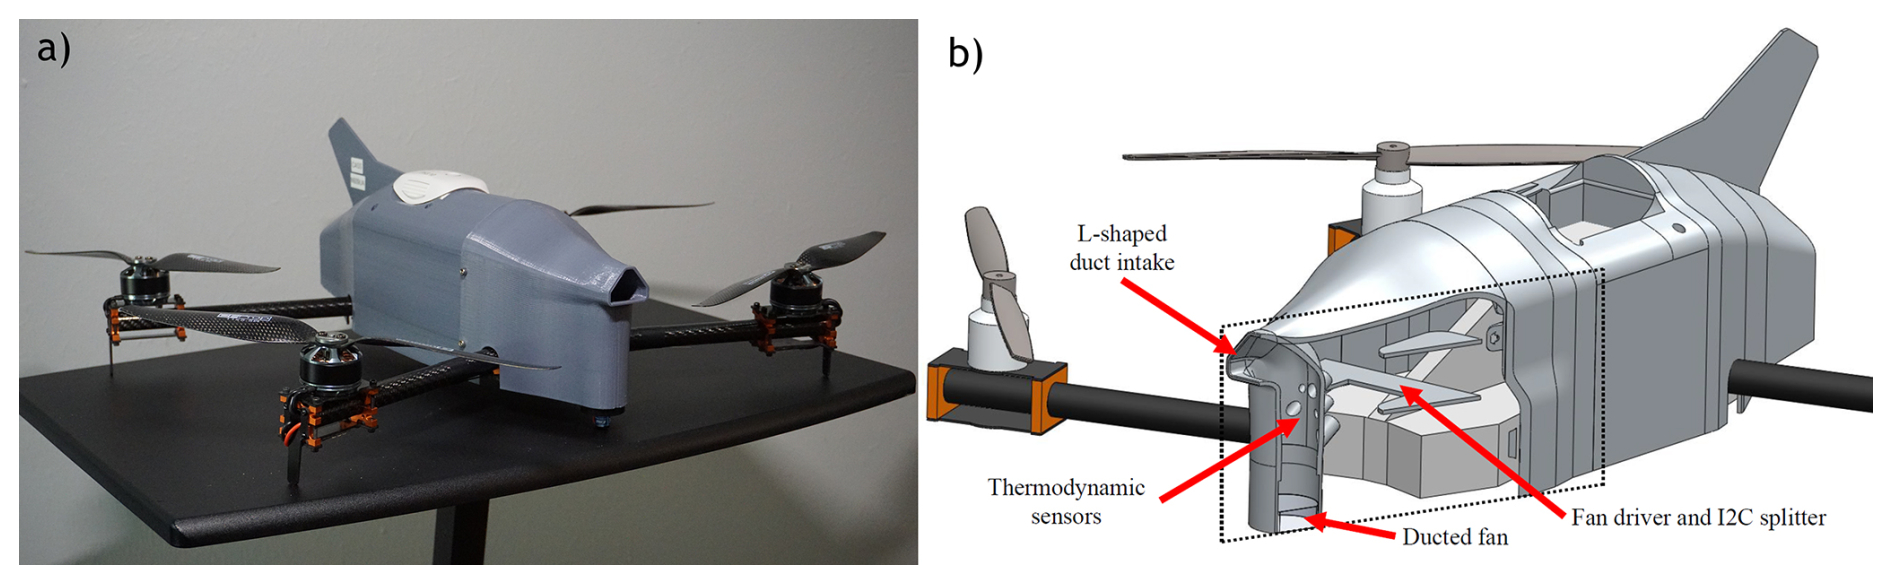
Figure 2(a) CopterSonde-3D concept developed in early 2022. This quadcopter UAS is designed for thermodynamic observations and vertical profiling of the lower atmosphere. Its distinctive shape results from an optimized internal layout that enhances airflow across the sensors via a wind vane flight mode. (b) Section cut of the front shell from the CopterSonde-3D CAD model, illustrating the solar shield and sensor compartment design, along with the placement of the thermodynamic sensors and other critical components. The dotted rectangle marks the plane of the cut.
The adoption of the scoop would not have been feasible without the implementation of a custom wind vane flight mode (WVFM). The WVFM is a function implemented on the autopilot system to orient the CopterSonde into the wind, positioning the sensor compartment in the most upwind section of the aircraft to sample undisturbed air and guarantee the sensors operate within their nominal conditions. Such iterative design refinements led to the development of the CopterSonde-3D (CS3D) UAS (shown in Fig. 2a). This comprehensive evolution, from the provisional CS1 to the advanced CS3D, exemplifies a robust engineering workflow that balances rapid prototyping with thorough testing in real-world scenarios.
The WVFM's effectiveness and validation were demonstrated in field experiments with the CS3D (see Appendix A) by measuring the heading dependence of temperature observations. Based on those observations (Fig. A1), a yaw tolerance range of 50° on either side of the wind direction was established as a design constraint for the wind vane mode, ensuring that the thermodynamic measurements remain reliable even with slight deviations in orientation. These findings have been critical in refining the CopterSonde design and carry over to the next platform generations.
High-impact weather events often have extreme atmospheric conditions that many conventional UAS struggle to overcome. Therefore, the impetus for the newest generation of WxUAS-based vertical profilers stems from our belief that these platforms must outperform conventional UAS to measure extreme atmospheric conditions. Extensive field experience in these types of environments shows that current systems often hit their performance limits – whether due to altitude range, wind tolerance, temperature extremes, or energy consumption – and are thus unable to collect valuable data in harsh weather conditions. In a networked system of drones, similar to the 3D Mesonet concept presented by Chilson et al. (2019), understanding these platform limits is crucial for reliably maximizing high-fidelity data collection for research and weather modeling. Consequently, in addressing these challenges, we have prioritized the development of a platform with increased thrust-to-weight ratio that can endure high-wind conditions while incorporating environment-aware failsafe logic (e.g., real-time wind-limit monitoring) and battery-selection-dependent operational modes.
Building on the success of the CS3D (Segales et al., 2020) and targeting severe weather measurement and high-resolution vertical profiling of the PBL, the CopterSonde-SWX (CSWX), shown in Fig. 3, was engineered with a high-performance propulsion system and aerodynamic configuration. Under this design philosophy, the CSWX sacrifices some flight endurance in favor of superior power and operational robustness. This trade-off enables the platform to operate in atmospheric conditions with sustained winds exceeding 25 m s−1, where lower-thrust UAS platforms are typically grounded. However, we are confident that future advancements in high-capacity, lightweight battery technology (Hasan et al., 2025; Itani and De Bernardinis, 2023) will eventually restore and even enhance flight endurance without sacrificing these high-power specifications. Ultimately, the goal of the CSWX is to mark a significant step forward in developing resilient, high-impact WxUAS for advanced atmospheric research and, subsequently, future operational networks.
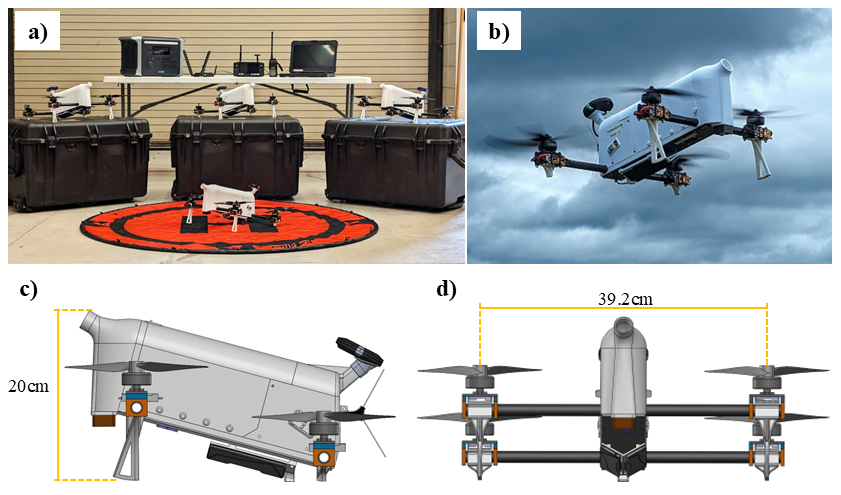
Figure 3CopterSonde-SWX (CSWX) concept developed in 2024. Building on the success of the CopterSonde-3D, the CSWX is a weather-sensing UAS tailored for severe weather measurements and fabricated with a high-performance propulsion configuration. Panel (a) shows a fleet of CSWX UAS sitting alongside its ground support equipment and transport cases. Panel (b) captures an airborne CSWX on a stormy day. The bottom row presents the CSWX's side view (c) and front view (d), each annotated with key dimensions for scale.
3.1 Airframe and Propulsion System
Similar to its predecessor, the CSWX is a quadcopter featuring an in-house-manufactured airframe built from carbon-fiber plates connected by aluminum standoffs. The airframe is elongated, narrowed, and angled upward to reduce the frontal cross-sectional area exposed to oncoming wind, thereby lowering dynamic pressure drag under strong wind conditions. Figure 4 illustrates the updated SWX airframe both in a stationary hover configuration (or resting on the ground) and pitched forward during forward flight or to counteract strong winds. The figure also depicts the relative positions of external components, such as the Global Navigation Satellite System (GNSS) antenna and air intake, aligned with the wind direction typically experienced during vertical atmospheric profiling.
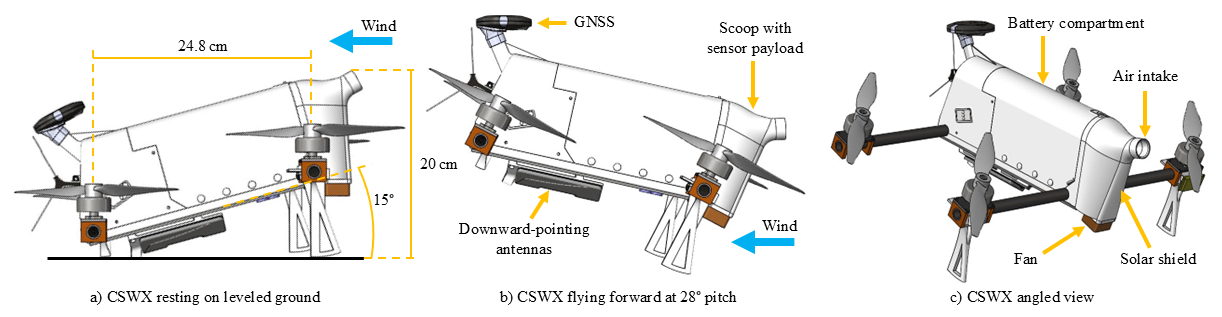
Figure 4(a) Right-side view of the CopterSonde-SWX (CSWX) resting on level ground and typical orientation during hover conditions in calm wind. Key dimensions are provided for scale. The wind-direction arrow is included for reference, clearly indicating the front and rear of the platform and highlighting the typical flight heading of the CSWX during vertical atmospheric profiling. (b) Side view of the CSWX in forward-flight configuration, exhibiting a 28° pitch angle to counteract wind-induced drag. In this configuration, the aerodynamic profile of the CSWX effectively reduces air resistance, which is the primary purpose of the inclined body design. External components, such as the GNSS antenna and air intake, align with the wind vector, further enhancing aerodynamic efficiency. (c) Angled perspective view of the CSWX, providing a three-dimensional visualization of the UAS and its structural components.
The aircraft's outer shell was 3D-printed using polycarbonate plastic, a material substantially stronger than the previously used PLA. Polycarbonate also provides superior resistance to debris impact and can withstand ambient temperatures up to approximately 80 °C before warping. The arms consist of single-piece, hollow carbon-fiber tubes, through which wiring is internally routed to the motors. These tubes allow for rotational adjustment of the rotor orientation, enabling changes in the inclination of the aircraft's main body relative to the propeller plane.
At the end of each arm is a 3110-size 900 KV brushless motor, driven by an electronic speed controller (ESC) rated for a maximum continuous current of 80 A. To ensure effective cooling, the ESCs were positioned directly below their corresponding motor-mounted propellers, leveraging the propeller-induced airflow. Each propeller has a diameter of 10 in. (25.4 cm) and a pitch of 4.5 in. (11.4 cm), and can produce a maximum thrust of approximately 3.8 kgf when spinning at 14 000 revolutions per minute (rpm).
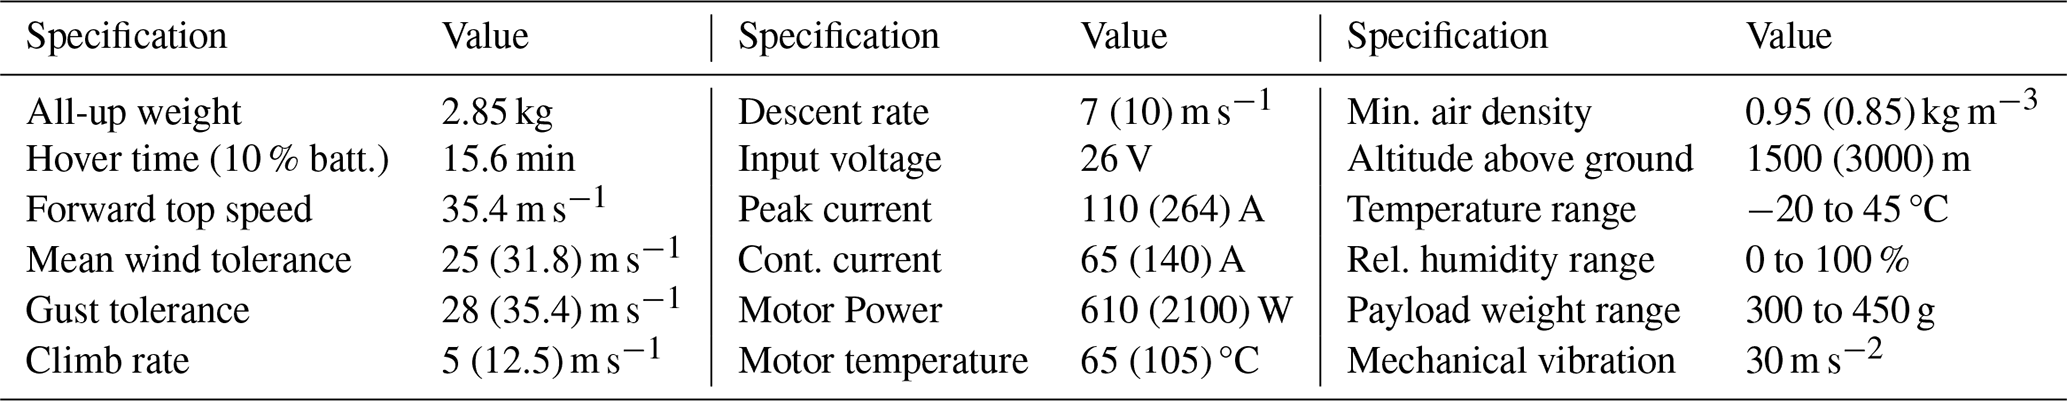
Table 1 summarizes the CSWX's measured technical specifications based on extensive flight testing, with values in parentheses representing analytically derived upper bounds based on the propulsion system's rated specifications under idealized conditions (see Table 1 caption for details).
Table 1Measured technical specifications defining the flight envelope of the CopterSonde-SWX, obtained from more than 65 flight tests in the high-performance (LiPo battery) configuration. Values outside parentheses represent the maximum values observed during testing. Values in parentheses are analytically derived upper bounds based on the propulsion system's rated specifications (e.g., maximum motor RPM, ESC current limits, and battery discharge capacity) under idealized conditions (sea-level air density, no wind, and nominal motor efficiency); these theoretical limits were not reached during testing due to safety margins and risk mitigation.
3.2 Operating Modes
The CSWX was intentionally designed to be modular and scalable. Unlike the CS3D, the battery compartment can accommodate various battery types and capacities, provided they share similar voltage characteristics. Leveraging this design feature, two distinct operating modes were developed to showcase the scalability and adaptability of the CSWX based on battery selection.
In its highest-performance configuration, the CSWX utilizes a 6000 mAh (130 Wh) 6S LiPo battery capable of delivering a maximum continuous discharge current of 168 A, evenly distributed among the four rotors. This powerful setup enables the CSWX to operate reliably under extreme conditions, allowing it to power through wind layers with quasi-horizontal speeds up to a theoretical maximum of ∼ 35 m s−1 before automatically activating its return-to-launch failsafe mechanism. In this configuration, the maximum attainable altitude – generally < 1500 m above ground level (a.g.l.) – is strongly influenced by power consumption resulting from wind resistance. The specifications provided in Table 1 are derived based on this high-power operating mode.
Alternatively, a second operational mode employs a 9000 mAh (194 Wh) 6S LiIon battery capable of providing a maximum discharge current of 90 A. Although approximately 10 % heavier than the LiPo battery, this LiIon battery stores 50 % more energy, resulting in approximately 30 % longer flight endurance. This increased endurance allows the CSWX to achieve higher altitudes – potentially exceeding 2000 m a.g.l. – which may require beyond visual line of sight (BVLOS) authorization, depending on the applicable airspace regulations and jurisdiction. However, this operating mode necessitates flying in low-wind conditions to ensure optimal performance.
Overall, this flexibility significantly broadens the CSWX's operational envelope over previous CopterSonde generations, enabling a wider range of atmospheric research applications and facilitating detailed studies into the design limitations and potential enhancements of weather-sensing UAS technology.
3.3 Autopilot System
The CSWX is controlled using a CubePilot CubeOrange autopilot running a customized ArduPilot firmware. This firmware integrates the advanced flight and sensor features originally developed for the CS3D and extends them for the CSWX. Custom firmware incorporates and enhances key capabilities from the CS3D – such as automated waypoint mission planning, environment-aware failsafe logic (e.g., wind limits), our wind vane flight mode (WVFM), and compact custom telemetry messages (Segales et al., 2024). For communications, the Android-based HereLink 2.4 GHz radio system is used, which provides a robust, real-time link-up to around 20 km – to the ground control station (GCS). At the GCS, we use enhanced visualization software tailored to display and analyze CSWX telemetry and sensor data, as detailed in a later section.
3.4 Enhanced Weather Oriented Features
In addition to the selected high-power propulsion configuration, we incorporated and tested several new and enhanced features into the CSWX that benefit weather sampling. These features were designed to improve the sampling of air from the PBL and boost the accuracy of thermodynamic and kinematic measurements. Concurrently, enhancing high-wind resilience was also a priority; the CSWX's internal components were repackaged and rearranged to create a more compact layout and reduce its longitudinal frontal area, thereby lowering dynamic pressure drag. A detailed description of these enhancements is provided in the following subsections, along with supporting evidence demonstrating their effectiveness.
3.4.1 Thermodynamic Sensor Suite
The front shell – comprising the scoop and payload compartment – was shaped and integrated with the CSWX's outer shell to produce a smooth and continuous-surface aerodynamic enclosure that minimizes step changes and flow separation. The front shell is fully detachable to facilitate the installation of different sensor package configurations, as well as calibration and maintenance tasks. The CSWX's front shell is equipped with multiple thermohygrometers for measurement redundancy: three iMet-XF bead thermistors and three IST HYT-271 capacitance humidity sensors. Following the sensor placement methodology described by Chilson et al. (2021), the sensors were arranged in an inverted “V” shape within a cylindrical chamber.
Figure 5 illustrates a sectional view of the CSWX front shell showing the airflow across the scoop and internal sensor chamber. The scoop's geometry and fan placement were designed to ensure airflow aspiration while blocking direct line‐of‐sight to the sensing elements. A small brushless ducted fan, mounted at the bottom of the sensor chamber (see Fig. 5), draws ambient air through the scoop at a calibrated constant aspiration speed of approximately 12 m s−1 (Segales et al., 2020). This fan-driven flow is supplemented by the forced-air effect of the CSWX flying into the wind via the WVFM. The inlet curvature, chamber diameter, and sensor depth combine to protect the thermohygrometers from solar radiation regardless of solar incidence angle.
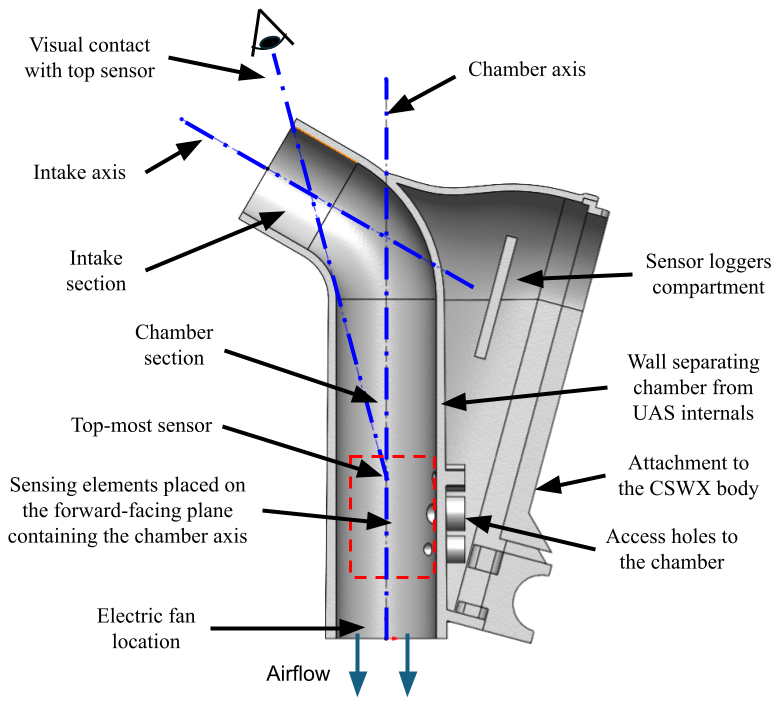
Figure 5Sectional view of the CSWX front shell showing the airflow across the scoop and internal sensor chamber. Sensors are arranged inside the red dashed box with their sensing elements placed on the forward‐facing plane containing the chamber's axis. The scoop's geometry and fan placement were specifically designed to ensure airflow aspiration while blocking direct line‐of‐sight (visual contact) to the sensing elements. The inlet curvature, chamber diameter, and sensor depth combine to protect the thermohygrometers from solar radiation and external disturbances.
To quantify the influence of solar heating on onboard thermohygrometer measurements, we conducted computational flow‐simulation studies in SolidWorks® followed by a comparison against field data from both the CS3D and CSWX platforms. In the flow simulations, each run replicated similar conditions (solar incident angle, ambient temperature, wind speed, drone pitch, cloud cover, etc.) recorded during corresponding flight days. Both CopterSonde scoops (CS3D and CSWX) were CAD-modeled with all three temperature and three humidity sensors, including the fan for aspiration. The simulations used steady-state conditions with the fan aspiration speed set to 12 m s−1, ambient wind speeds matching the mean conditions observed on each corresponding flight day (ranging from 2 to 12 m s−1), and solar irradiance values between 0 and 800 W m−2 depending on sky conditions. While the simulated temperature spreads (green boxes in Fig. 7) show mean differences of 0.06–0.15 °C relative to the measured CSWX data, we acknowledge that the steady-state approach does not capture transient effects such as turbulent gusts and rapid sun-angle changes, which likely account for the remaining discrepancies in Fig. 7. These experiments helped establish a baseline distribution of airflow and temperature inside each scoop under purely aerodynamic and solar effects, allowing us to isolate and measure the contributions of solar radiation and aerodynamics to the measurement bias at varying wind speeds and sun angles.
Flow simulations offered our first glimpse into how sunlight and ambient wind interact with the CSWX sensor housing. As shown in Fig. 6, sunlit areas on the front shell heat up noticeably, with a clear hot spot forming just behind and below the intake, but not reaching the weather sensors located deeper in the scoop. This shows that shielding the instruments from direct and reflected solar radiation is critical to prevent measurement bias, but it also shows that any cover may introduce other sources of error, since heated walls can disrupt local airflow and introduce convective heating, particularly when the Richardson number exceeds order unity (i.e., when buoyancy-driven effects dominate over forced convection). At the aspiration speeds maintained by the ducted fan (∼ 12 m s−1), forced convection is expected to dominate within the sensor chamber, limiting but not entirely eliminating this effect. Re-radiation from heated interior walls may also contribute a small bias, though this is mitigated by the white, high-reflectivity surfaces used inside the scoop. In practice, the final sensor enclosure must therefore have a balance between sufficient sun protection and adequate ventilation, all while maintaining a smooth surface profile that blends with the aircraft's body and does not compromise the UAS's flight performance.
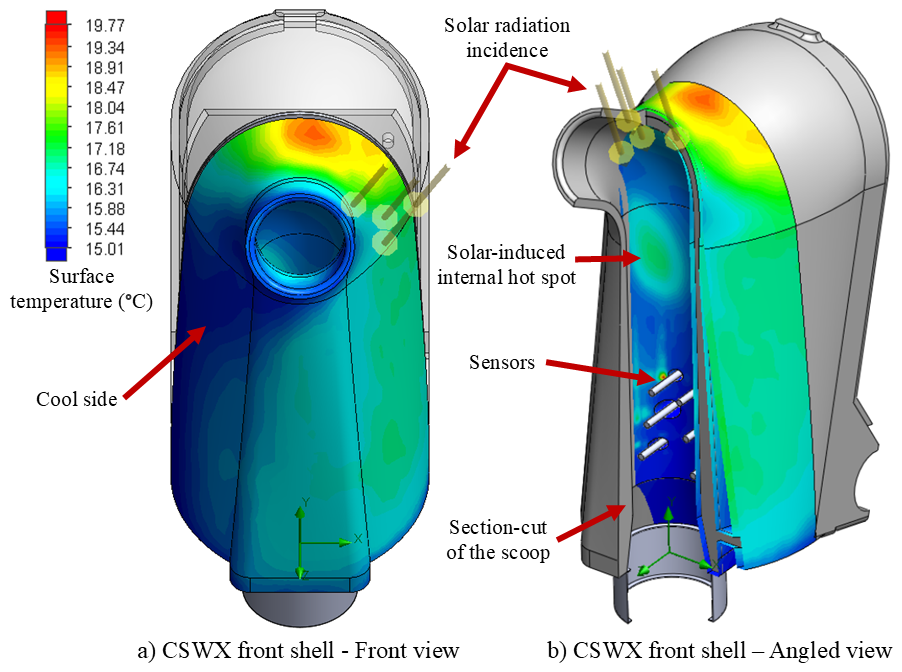
Figure 6SolidWorks® FlowSim-derived surface‐temperature heatmaps of the CSWX front shell under a representative solar incidence angle of 45° (solar irradiance = 800 Wm−2, ambient = 15 °C, wind = 2 m s−1). (a) Front view of the CSWX scoop exterior, with cooler regions (blue hues) indicating surfaces shaded from direct sun and warmer regions (yellow‐to‐red hues) showing panels exposed to solar irradiance. (b) Section‐cut through the scoop wall revealing the internal wall‐temperature distribution. A localized hot spot appears just below the intake (red region, 17 °C), indicating a potential bias risk for this particular solar incidence. This hotspot shows the importance of placing the thermohygrometer deep inside the scoop or even applying internal reflective coatings to prevent radiative heating of the sensing elements.
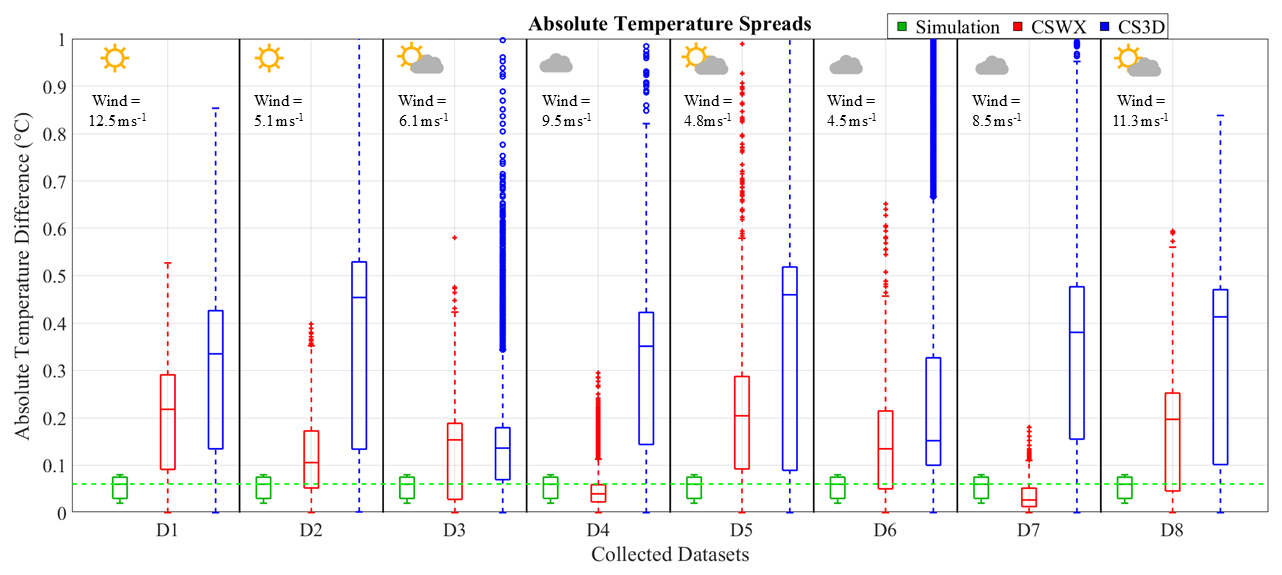
Figure 7Box‐and‐whisker plots of absolute temperature differences between onboard thermohygrometers for eight separate sampling days (panels D1–D8). In each panel, three boxplots compare: the baseline CopterSonde‐SWX CAD model simulation (green), CopterSonde‐SWX field data (red), and CopterSonde‐3D field data (blue). Each boxplot distribution was generated by combining 4–5 vertical profiles collected each day during Summer and Fall 2024 in Oklahoma. For the simulation, we approximated the environmental conditions on a sampling day, including sun incidence and ambient temperature. The icons above each panel indicate clear sky, scattered clouds, or overcast conditions in addition to the mean wind speed. The mean difference values between the real and simulated CopterSonde-SWX data from D1–D8 are as follows: 0.15, 0.06, 0.07, −0.01, 0.15, 0.08, −0.02, and 0.11 °C.
Figure 7 illustrates the absolute temperature spread among the three onboard thermistors for both CopterSonde configurations (CSWX in red, CS3D in blue) alongside the CSWX simulation baseline (green) across different flight days (D1–D8). On days with negligible solar irradiance and moderate winds (D4 and D7), the CSWX's measured spread collapses to near or even below the simulated baseline (green), demonstrating excellent thermal uniformity; by contrast, the CS3D continues to exhibit some variability (blue), suggesting inherent design‐induced biases unrelated to solar radiation. More broadly, for the CSWX, variations in wind speed – even up to ∼ 12 m s−1 – produce only marginal changes in temperature spread, indicating that convective heat transfer (enclosure to air) diminishes, homogenizing sensor readings once airflow exceeds a minimal threshold (also seen in the thermal comparison from the low-to-high-wind flights in Fig. 11). In contrast, full exposures to solar radiation (clear‐sky panels) correlate with pronounced increases in both CSWX and CS3D spreads, with the CS3D showing the largest absolute deviations. The larger CS3D spreads are attributed to differences in scoop geometry: the CSWX features a deeper sensor chamber with a more curved inlet path that increases the separation between the heated outer walls and the sensing elements, as well as hiding the sensors from direct sun radiation exporsure regardless of the incidence angle, thereby reducing both direct and re-radiated solar heating of the sensors compared to the CS3D's shallower duct design. These observations suggest that solar loading is the dominant driver of sensor‐to‐sensor temperature discrepancies on both platforms, whereas wind speed plays a secondary role. The CSWX mitigates both effects more effectively than the CS3D.
3.4.2 Wind Vector Estimation
Over the past 5 years, our team has developed and refined several algorithms to infer the wind vector using only the CopterSonde's flight data, since no dedicated anemometer is present onboard. These methods exploit the quadcopter's dynamics and kinematics – measured by the autopilot's inertial measurement unit (IMU) – to estimate wind vectors. The most commonly used techniques for the CS3D were based on the linear (Neumann and Bartholmai, 2015) and quadratic regression curves (Greene et al., 2022) as a function of the wind-induced tilt of the platform, assuming horizontally-steady vertical flights. These algorithms were initially implemented and evaluated on the CS3D (Bell et al., 2020) and then ported to the CSWX with the parameters retuned in open-field tests against meteorological towers and Doppler wind lidars (Segales et al., 2020; Segales, 2022).
However, the linear and quadratic methods were limited to horizontal wind estimation. To resolve the full wind vector – including the vertical component – we must leverage rotor thrust information. By accurately measuring each rotor's angular velocity and mapping it to thrust (through propeller characterization), the CopterSonde can infer the drag force acting on its airframe. Combining the known weight vector, estimated thrust, and measured accelerations into the dynamic model allows for the computation of the complete wind vector. The formulation of these relationships in a simplified linear time-invariant (LTI) dynamic model is as follows:
where P is position, V velocity, T total thrust, D aerodynamic drag, is the body-to-inertial rotation matrix, mg weight (mass times gravity) of the quadcopter UAS. In the LTI form, x is the state vector, u the input vector, and y the measured outputs, with system matrices A, B, and C being the state, input, and output weights, respectively. Segales (2022) shows a more detailed deduction and formulation of the presented equations.
A critical requirement for this method is the use of an accurate propeller model, for which we adopted the characterization provided by Gill and D'Andrea (2019). However, their thrust formulation depends on the inflow velocity to the propellers (perpendicular to the rotor disk), which is equal to the airspeed of the CSWX. The airspeed of the CSWX is the difference between the CSWX ground velocity vector and the wind vector; the latter is unknown, and we aim to measure it in the first place. Therefore, we opted to use a Linear Extended State Observer (LESO) for the estimation of non-measurable parameters (Han, 2009; Li et al., 2012). In Eq. (1), the unknown parameter is the aerodynamic drag D, which is a function of the wind-induced airspeed and acts as the coupling between the wind vector and the platform's translational dynamics through the Rayleigh drag equation. Subsequently, the LESO extends the state-space variables x to include an estimation process for D as an integrator. After applying these control-theory operations to Eq. (1), the resulting LTI+LESO system is:
where = is the state estimate, u is the rotated thrust vector combined with the weight vector – where thrust is computed from measured rotor RPM using the propeller model of Gill and D'Andrea (2019), iteratively refined with the current airspeed estimate – and h is the rate of change of the wind. Assuming that the mean wind changes slowly over time, then h = 0. This quasi-steady assumption is appropriate for the profiling ascent rates used (3.5 m s−1) and WVFM function enabled. As a result, the platform traverses slowly enough that the mean wind speed profile evolves on longer timescales than the LESO's 10 Hz update rate. Additionally, it is assumed that the WVFM's time response is fast enough to catch up with the mean angular wind shear and keep the CSWX pointing into the wind, making h stay close to zero relative to the CSWX's reference frame. The LESO then initializes with a first guess of wind velocity estimate (usually set to zero) and iteratively refines it using the wind and thrust estimate computed in the previous step. With sufficiently high sampling rates (∼ 10 Hz), this approach quickly corrects and converges to stable drag estimates. The matrices in Eq. (2) are defined as:
The observer gain L determines the convergence speed and noise sensitivity; this is a user-defined parameter chosen so that the eigenvalues of lie in the left half of the complex plane, ensuring system stability and estimation errors decay to zero (Stevens et al., 2015). The CSWX is capable of sampling the input parameters for the LESO estimation at a rate of 10 Hz
Figure 8 demonstrates the LESO-based CopterSonde's wind‐sensing performance compared to data collected with a Doppler wind Lidar (DWL) system. The cumulative scatter plots aggregate over 31 000 data points from 16 profiles, revealing strong correlations (R = 0.79 vertical, R = 0.90 horizontal) and low RMSEs (0.49 m s−1 vertical, 1.03 m s−1 horizontal) between LESO estimates and DWL measurements. Although both systems were tested over a relatively narrow range of horizontal wind speeds, the LESO begins to underestimate at higher wind speeds (see the deviation from the red one-to-one line at higher wind speeds in Fig. 8b). This is likely because the simplified dynamic model underperforms in fully capturing the platform's nonlinear aerodynamic behavior at high speeds.
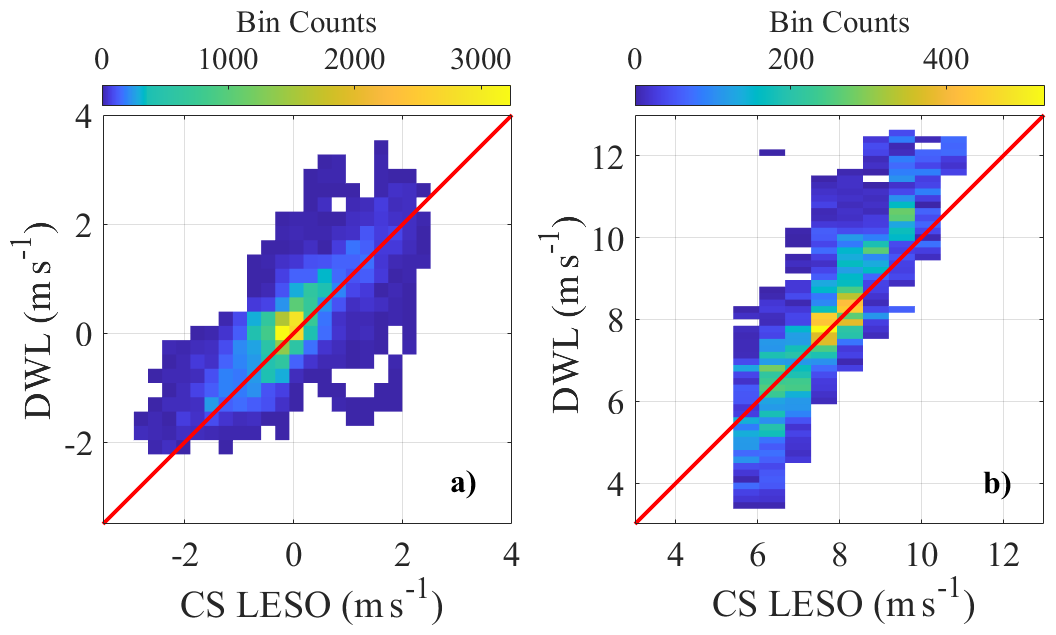
Figure 8Cumulative scatter plots compare LESO-based CopterSonde (CS) vertical wind (a) and horizontal wind (b) estimates against Doppler wind Lidar (DWL) measurements, aggregating data from 16 vertical profiles (N = 31 386 data points). The color density in each plot indicates the frequency of observations, and a red one-to-one line marks perfect agreement. Prior to analysis, outliers from low DWL signal-to-noise ratios were removed. The correlation coefficient (R), mean difference (MD), standard deviation (SD), and RMSE for each panel are: (a) vertical wind with R = 0.791, MD = −0.197 m s−1, RMSE = 0.492 m s−1, and SD = 0.451 m s−1; (b) horizontal wind speed with R = 0.90, MD = −0.287 m s−1, RMSE = 1.025 m s−1, and SD = 0.984 m s−1.
3.4.3 Angled airframe
To achieve higher resilience to high wind conditions, a powerful propulsion system alone is not enough. The airframe must also be designed to minimize wind-induced drag at high wind speeds without sacrificing sensitivity for wind estimation under calmer conditions. Tilting or angling the UAS body relative to its rotor disk can significantly enhance high-speed flight performance by reducing aerodynamic drag. Traditional quadcopters typically tilt their entire body to produce a desired inclination of the thrust vector to compensate for wind effects or shift the UAS position in 3D space. This inclination increases the exposed frontal area, drag, and reduces aerodynamic efficiency. In contrast, a built-in tilted-body quadcopter can increase maximum achievable speeds as much as 12.5 %, as demonstrated by Tang et al. (2022). However, Tang et al. (2022) recommends limiting the airframe angle to below 20° to preserve flight stability and maneuverability. Based on this guidance, the CSWX airframe was designed with a fixed airframe angle of 15°, leaving a safety margin with the upper limit.
To quantify the CSWX's wind sensitivity over the CS3D, we performed 10 side-by-side vertical profiles (up to 1000 m) colocated with NSSL's Collaborative Lower Atmosphere Profiling System (CLAMPS) DWL reference system (Wagner et al., 2019), sensing wind speeds up to 22 m s−1. Subsequently, using this dataset, we tuned our three wind estimation algorithms – linear, quadratic, and LESO – using a Differential Evolution optimizer (DEO) to minimize root-mean-square error (RMSE) relative to the DWL observations. For each CopterSonde version, RMSE values from all the methods were averaged over 2 m s−1 wind-speed bins to produce the comparison plot in Fig. 9. Averaging across all methods ensures a fair comparison of the aircraft's aerodynamic performance independent of the performance of any single wind-estimation algorithm. The results show that the CSWX outperforms the CS3D at low wind speeds (demonstrating enhanced sensitivity), matches performance at mid-range winds, and again delivers lower RMSE at higher speeds, evidencing the benefits of its refined aerodynamic design.
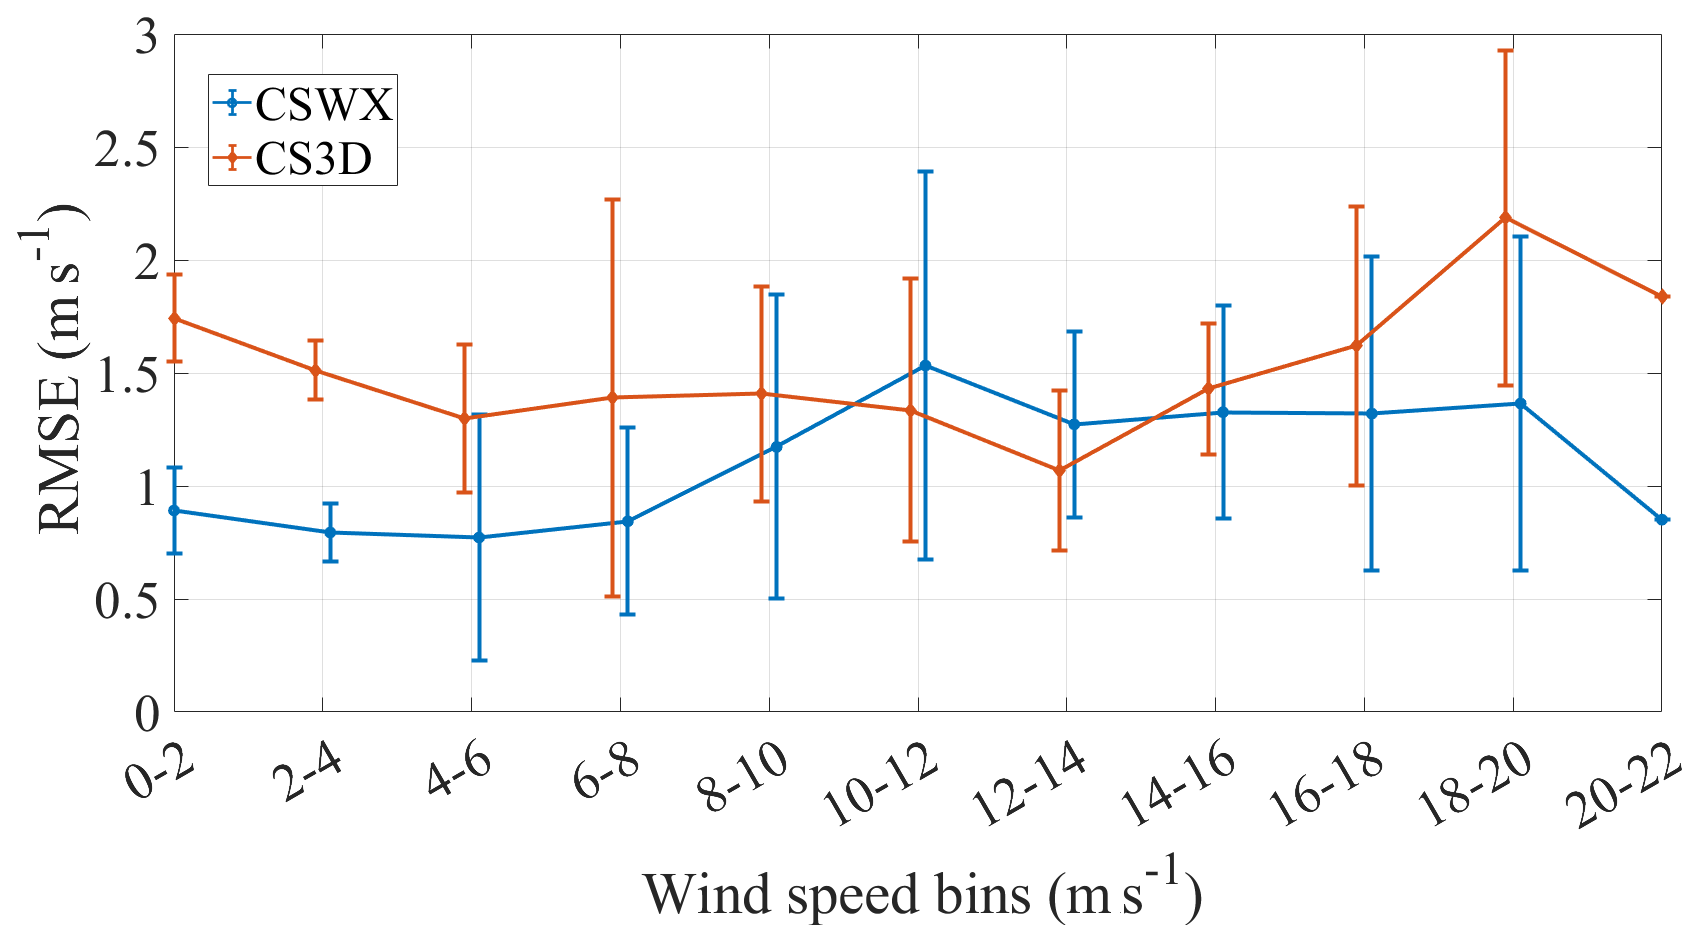
Figure 9Comparison of wind estimation RMSE for the CSWX (blue) and CS3D (orange) across wind‐speed bins up to 22 m s−1, including error bars of 2 standard deviation. The CSWX consistently shows lower RMSE in the 0–8 m s−1 range, matches CS3D performance in moderate winds (8–16 m s−1), and diverges with significantly lower errors at higher speeds, demonstrating the aerodynamic advantages of the SWX design.
Figure 10 presents two examples of colocated vertical soundings from CopterSonde (CS3D and CSWX), radiosonde, and DWL. In the high‐wind profile (left), all instruments align closely, with the CSWX maintaining the best agreement with the reference instruments at the upper end of wind speeds. In the low‐wind profile (right), the CSWX's LESO‐based estimates closely track the references, benefiting from the LESO algorithm's ability to isolate wind‐induced aerodynamic effects and the tilted airframe's enhanced sensitivity to gentle breezes.
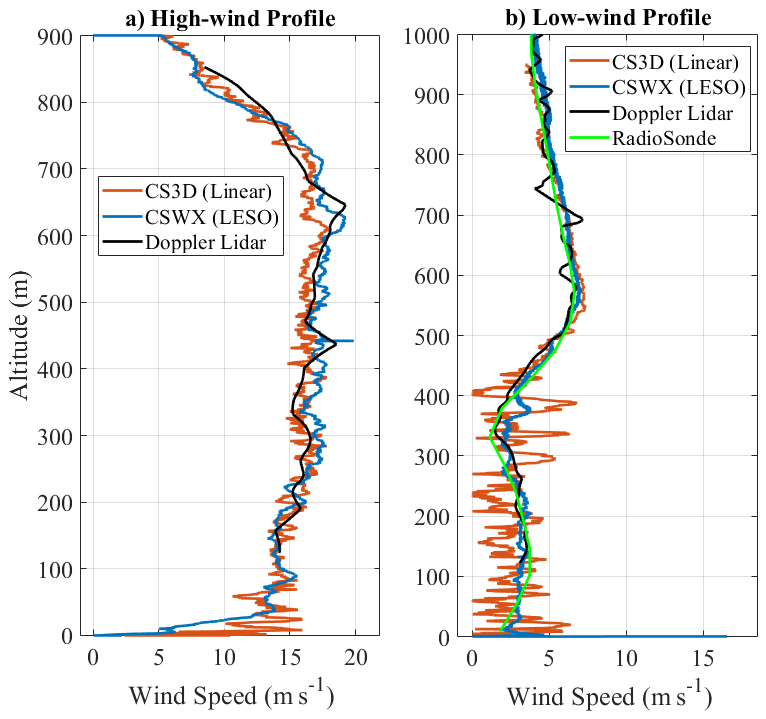
Figure 10Comparison of vertical wind profiles from the CSWX (blue), CS3D (orange), Doppler wind lidar (black), and radiosonde (green) for two colocated soundings, collected during a developing convective boundary layer approximately one hour after sunrise under clear skies. In the high‐wind profile (a), all sensors align closely. The CSWX most accurately agrees with the lidar above 15 m s−1, while in the low‐wind profile (b), the CSWX's LESO‐based estimates (blue) closely track both lidar and radiosonde below 6 m s−1, whereas the CS3D (orange) shows greater scatter, which may reflect both higher noise in the CS3D's wind-estimation algorithm due to a bulkier airframe, less responsive propulsion system, and less accurate GPS unit. The raw DWL profiles were collected using 5 s temporal averages, which were then linearly interpolated to match the 0.1 s sampling period of the CopterSondes.
The CopterSonde system, in its current iteration, has adhered to all relevant FAA and NOAA Office of Marine and Aviation Operations (OMAO) regulations governing UAS operations, even during non-NOAA-related UAS missions. All flights conducted during this study took place at the Kessler Atmospheric and Ecological Field Station (KAEFS) in Purcell, Oklahoma, USA, located 30 km southwest of the OU Norman campus. These flights were compliant under the Certificate of Authorization (COA) with number 2024-CSA-14684-COA, issued by the Federal Aviation Administration (FAA), which allowed us to fly UAS above 121.9 m (400 ft) a.g.l. with a flight ceiling of 1524 m (5000 ft) a.g.l. Every person involved in CopterSonde missions received proper training for safe and successful deployments in the field. The following sections detail some relevant CopterSonde deployments in which we deliberately pushed the platform toward its performance limits to evaluate its capabilities and resilience for atmospheric data collection and to make practical conclusions about its future operational use.
4.1 Thermodynamic and Kinematic Measurement Performance
This section focuses on presenting statistical evidence and justifying the weather-oriented engineering developments (see Sect. 3.4) implemented on the CopterSonde-SWX during real profiling operations. The CS3D was used as the baseline from which the CSWX's measurement performance is compared. We present four case studies of side-by-side CSWX and CS3D soundings colocated with two DWLs and two Vaisala RS41-SGP radiosonde (RS) launches. Thus, we have kinematic datasets for all four soundings from both DWL and RS but only two thermodynamic datasets from the RS. The experiment took place soon after sunrise to capture the residual nocturnal inversion, which features sharp vertical temperature gradients that test each sensor's response time: a sensor with slower thermal response will lag through the inversion layer, producing a smeared temperature profile relative to a faster-responding instrument. This timing was chosen specifically to maximize the discriminating power of the intercomparison. During the measurements of these profiles, the two DWLs were running simultaneously; one was set to fixed-point (DLFP) mode, ideal for vertical wind measurements, while the second was set to velocity-azimuth display (VAD) mode, optimized for horizontal wind measurements. Together, the DWLs took 3D-wind profiles of the PBL up to ∼ 1500 m a.g.l. every 5 s. The CSWX, CS3D, and RS were launched nearly simultaneously from locations less than 20 m apart. The climb rate for both CSWX and CS3D was set to 3.5 m s−1, whereas the RS balloons' pressure was calibrated such that its ascent rate was the standard 5 m s−1.
For the thermodynamic comparison, Fig. 11 shows two vertical soundings up to 1000 m with their respective temperature and relative humidity profiles, as well as the wind profile for a better understanding of the atmospheric conditions. These two examples exhibit a strong thermal inversion, including a well-defined shear layer at approximately 500 m a.g.l., useful for identifying and comparing measurement effectiveness related to aspiration and sensor response. Under higher winds, all instruments agree closely; in light winds, the CSWX exhibits smaller deviations from the radiosonde reference (i.e., lower point-to-point differences), as well as smoother temperature and relative humidity curves. We note that smoother profiles do not inherently guarantee higher accuracy; however, the simultaneous reduction in RMSE relative to the radiosonde (Table 2) supports the interpretation that the CSWX's enhanced aspiration, solar shielding, and tilted-body design effectively mitigate self-heating and radiation biases, rather than simply filtering out real atmospheric variability.
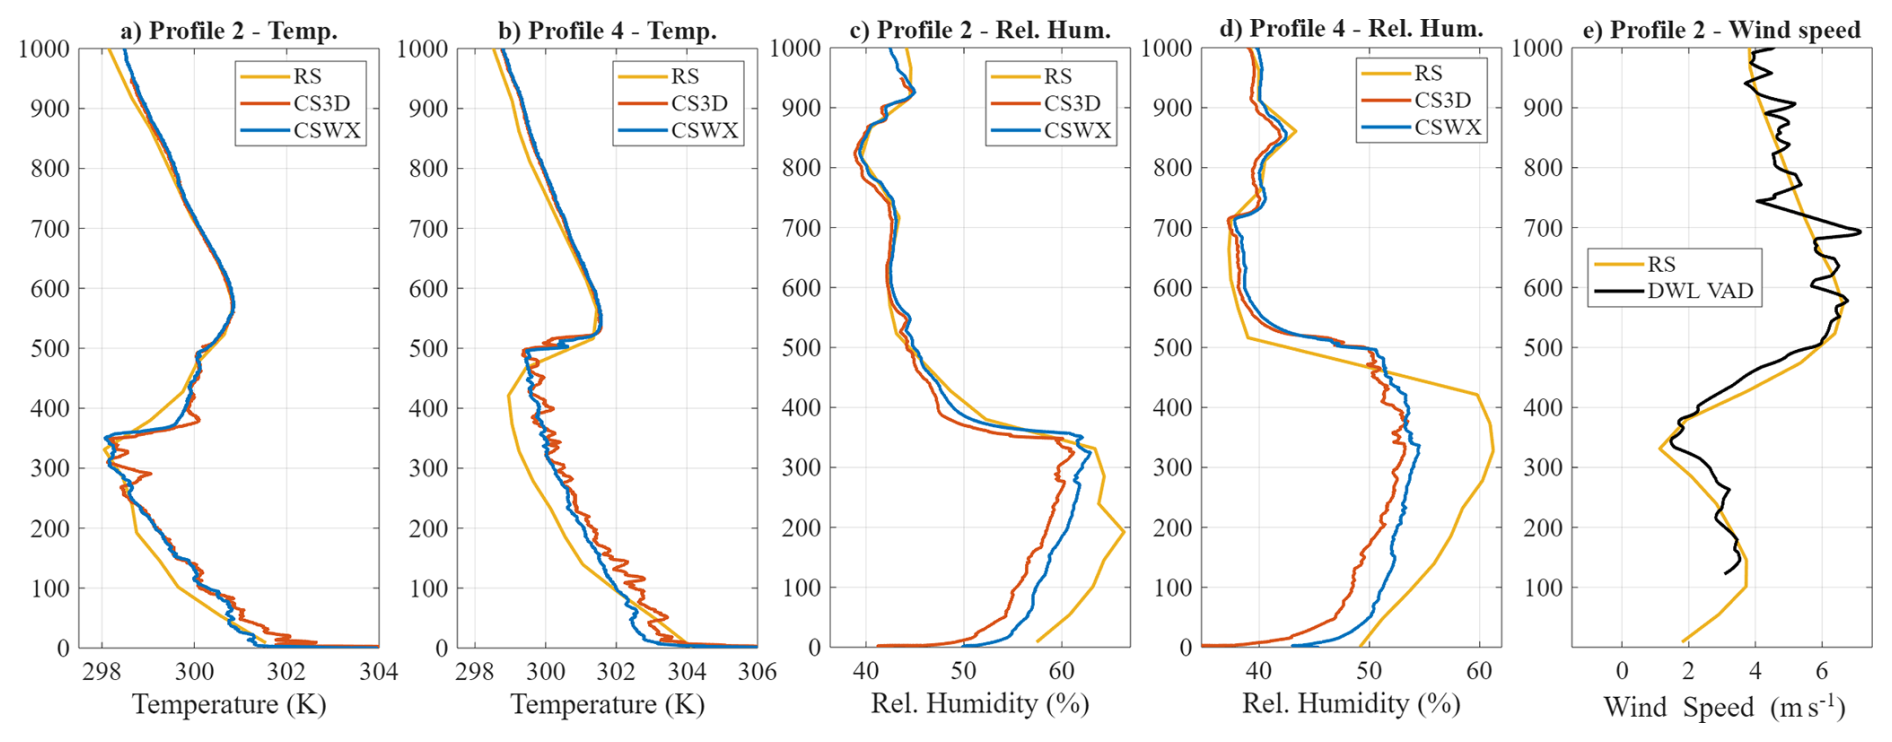
Figure 11Profiles of temperature and relative humidity from two CopterSonde models (SWX in blue, CS3D in red) alongside radiosonde (RS) in orange and Doppler wind lidar (DWL) references in black. The first four panels show temperature (a, b) and relative humidity (c, d) for profiles 2 and 4 up to 1000 m. Panel e overlays wind speed, highlighting low (< 4 m s−1) and high (> 4 m s−1) wind layers near 450 m. Under stronger winds, all instruments converge closely, whereas light winds produce greater scatter, demonstrating that the SWX's improved aspiration and shielding effectively suppress sensor self-heating and solar-radiation biases, as evidenced by its smoother low-wind temperature traces.
Table 2Root mean squared error (RMSE) of both CopterSonde (CS) – CSWX and CS3D – temperature and relative humidity profiles with respect to Vaisala radiosonde (RS) profiles (see Fig. 11). The instruments had a horizontal spatial separation of less than 20 m between each other and were launched almost simultaneously.
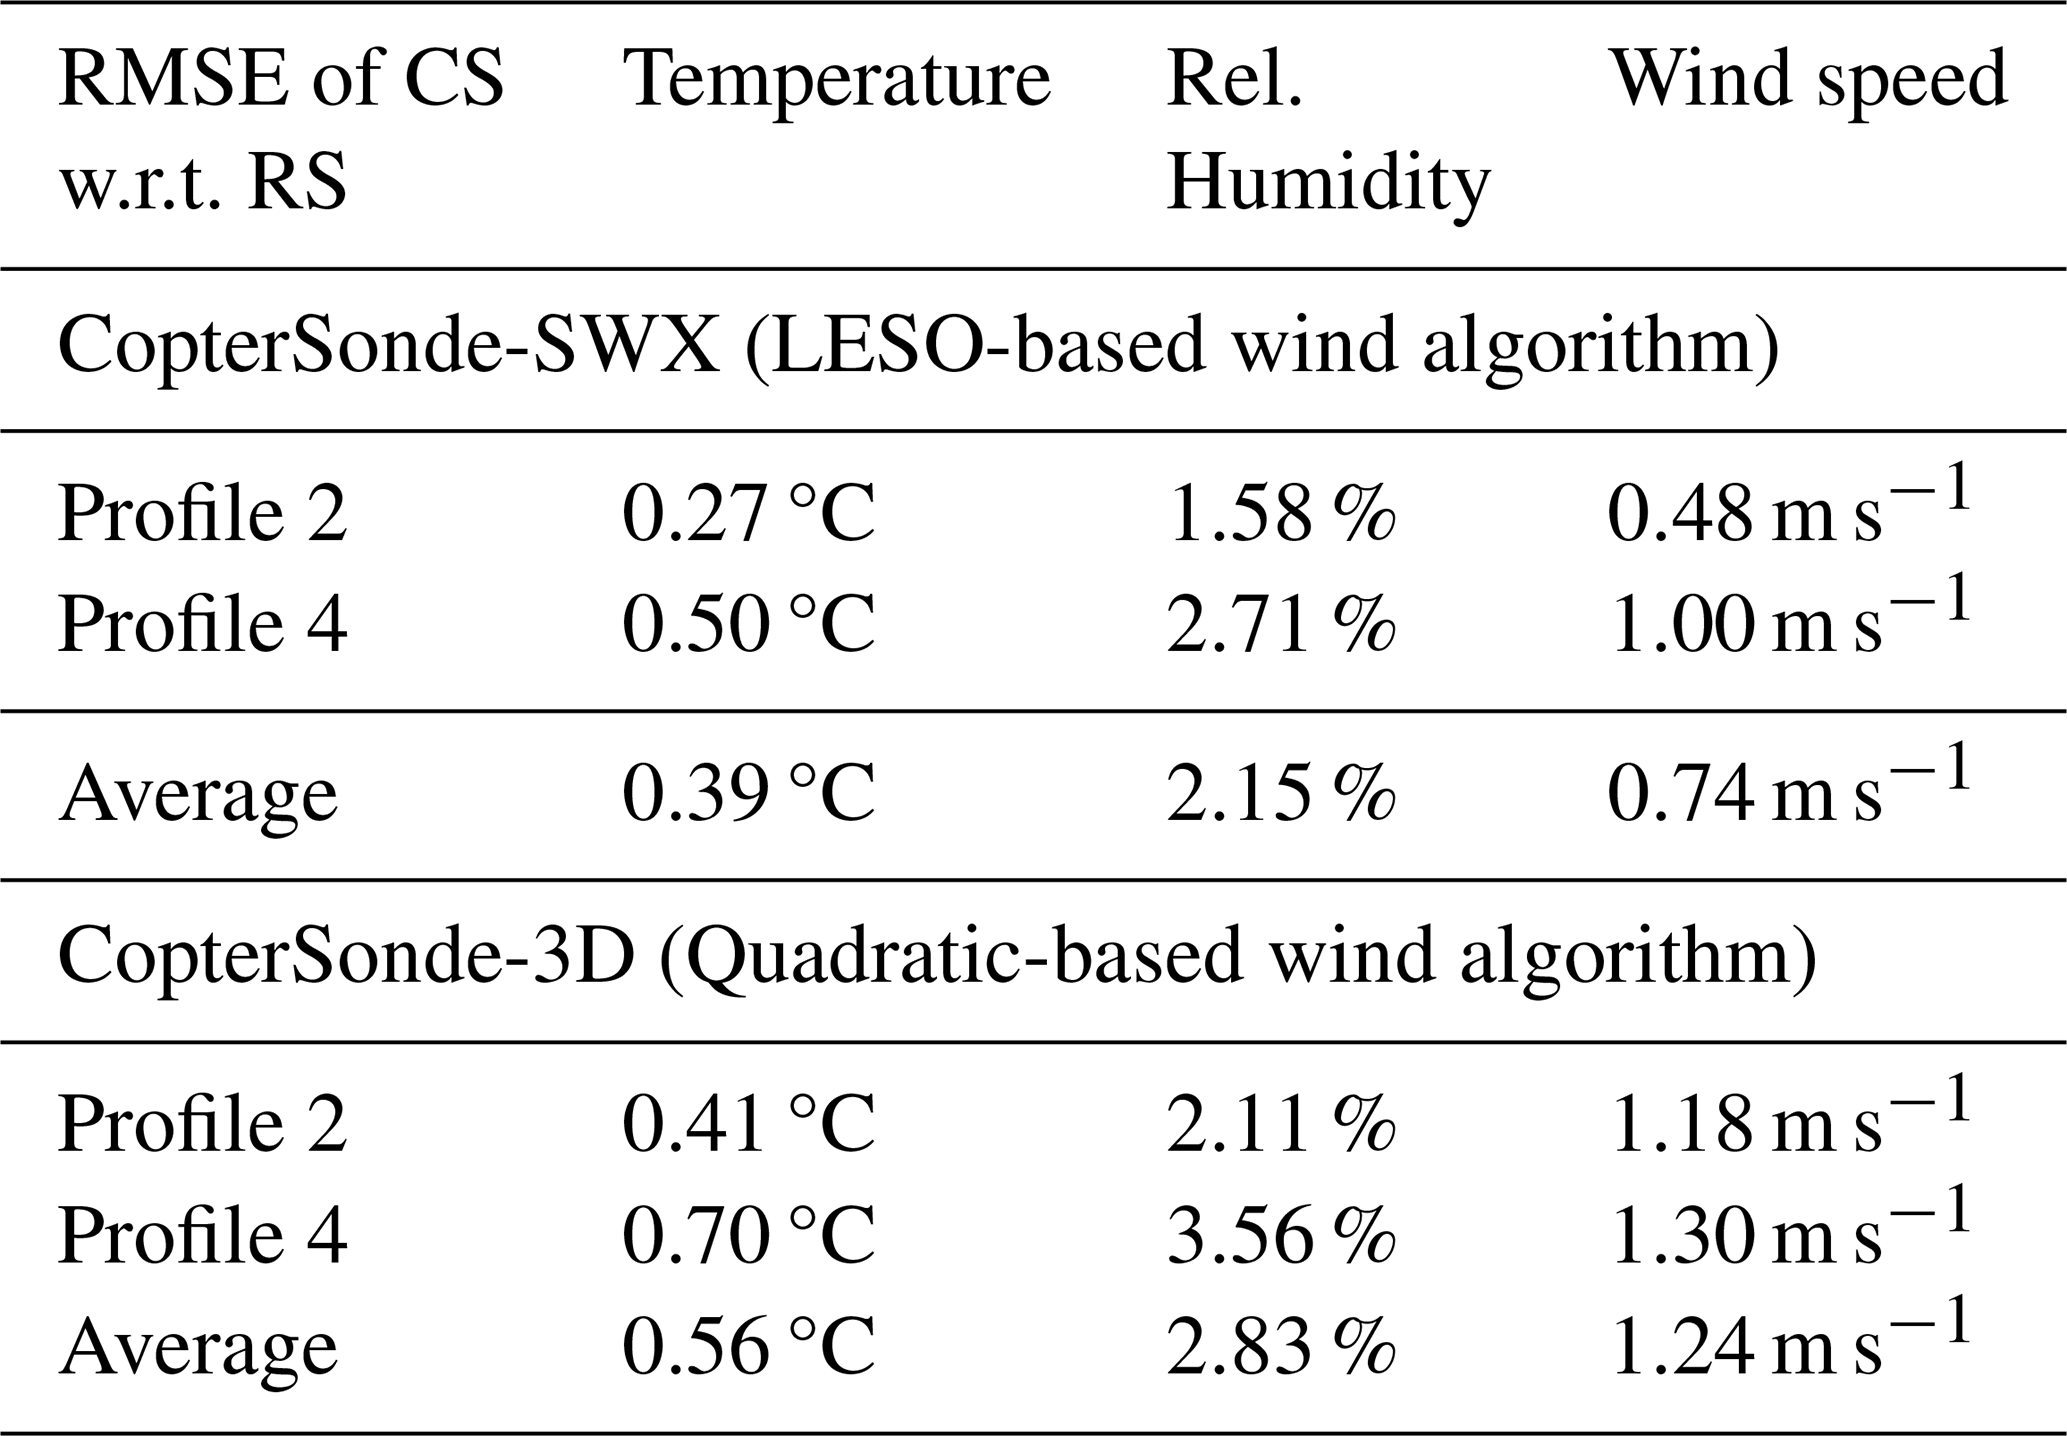
Table 2 presents a statistical assessment of thermodynamic measurement performance based on the presented vertical profiles. The table reports the root-mean-square error (RMSE) of each UAS platform's profile relative to the RS data. The results show that the CSWX achieved lower RMSE values than the CS3D, indicating improved thermodynamic measurement consistency relative to its predecessor through engineering improvements as described in Sect. 3.4.1. We acknowledge that RMSE values are influenced by profile variability and the spatial and temporal separation between instruments; nonetheless, the consistent improvement across both profiles supports the effectiveness of the CSWX's design changes. Assuming that the RMSE reflects the CSWX's estimation accuracy, doubling those values gives 95 % confidence intervals of ±0.78 °C for temperature and ±6.62 % for relative humidity.
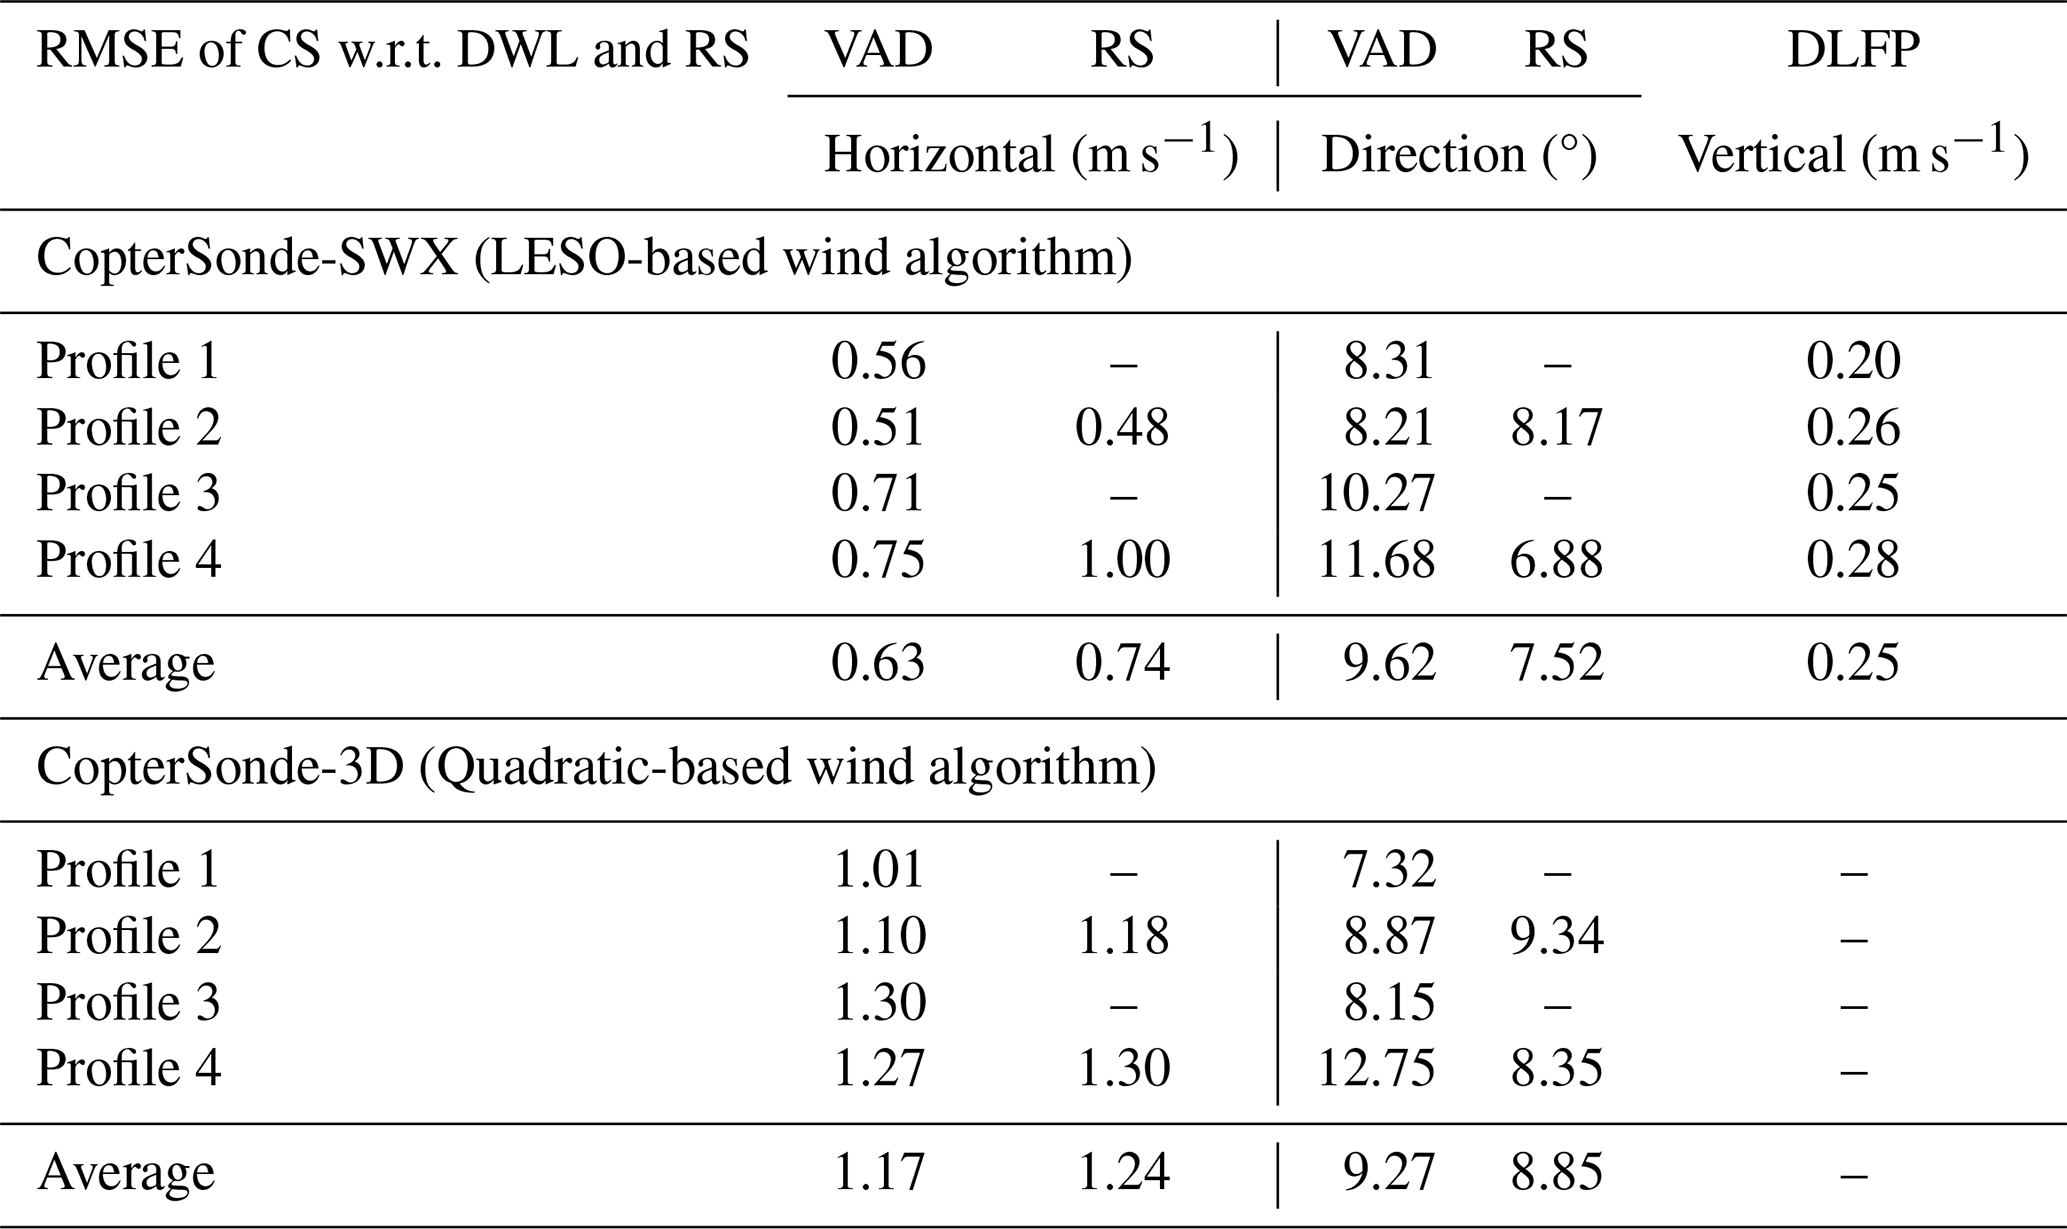
Figure 12 shows profiles of the horizontal and vertical wind where both CSWX and DWL captured wind shear, downdrafts, updrafts, and regions of vertically steady flow. These plots demonstrate that the LESO's estimates of horizontal and vertical wind closely followed the DWL's observed trends within the RMSE values reported in Table 3. Table 3 provides a quantitative evaluation of each CopterSonde's wind‐estimation performance, reporting the RMSE of their profiles relative to DWL data (VAD and DLFP) and, where available, RS measurements. The CSWX consistently achieved lower RMSE values than the CS3D – evidence of its engineered improvements – with a mean horizontal wind RMSE of 0.63 m s−1 and a mean vertical wind RMSE of 0.25 m s−1. These results indicate that a multirotor UAS, when aerodynamically and structurally optimized for atmospheric sampling, can deliver wind measurements comparable to those from conventional instruments without requiring onboard wind-specific sensors. In contrast to temperature and relative humidity, treating the wind RMSE as a direct estimation of the CSWX's true accuracy can be misleading. Differences in sensor response and sampling rate between the CSWX, DWL, and RS may have been significant such that the CSWX captured smaller‐scale wind fluctuations that appear as large deviations from the DWL and RS, thereby inflating the RMSE (a metric that heavily penalizes large differences). Accordingly, wind speed and direction RMSE values should be interpreted with caution and not assumed to represent the CSWX's inherent wind‐measurement accuracy.
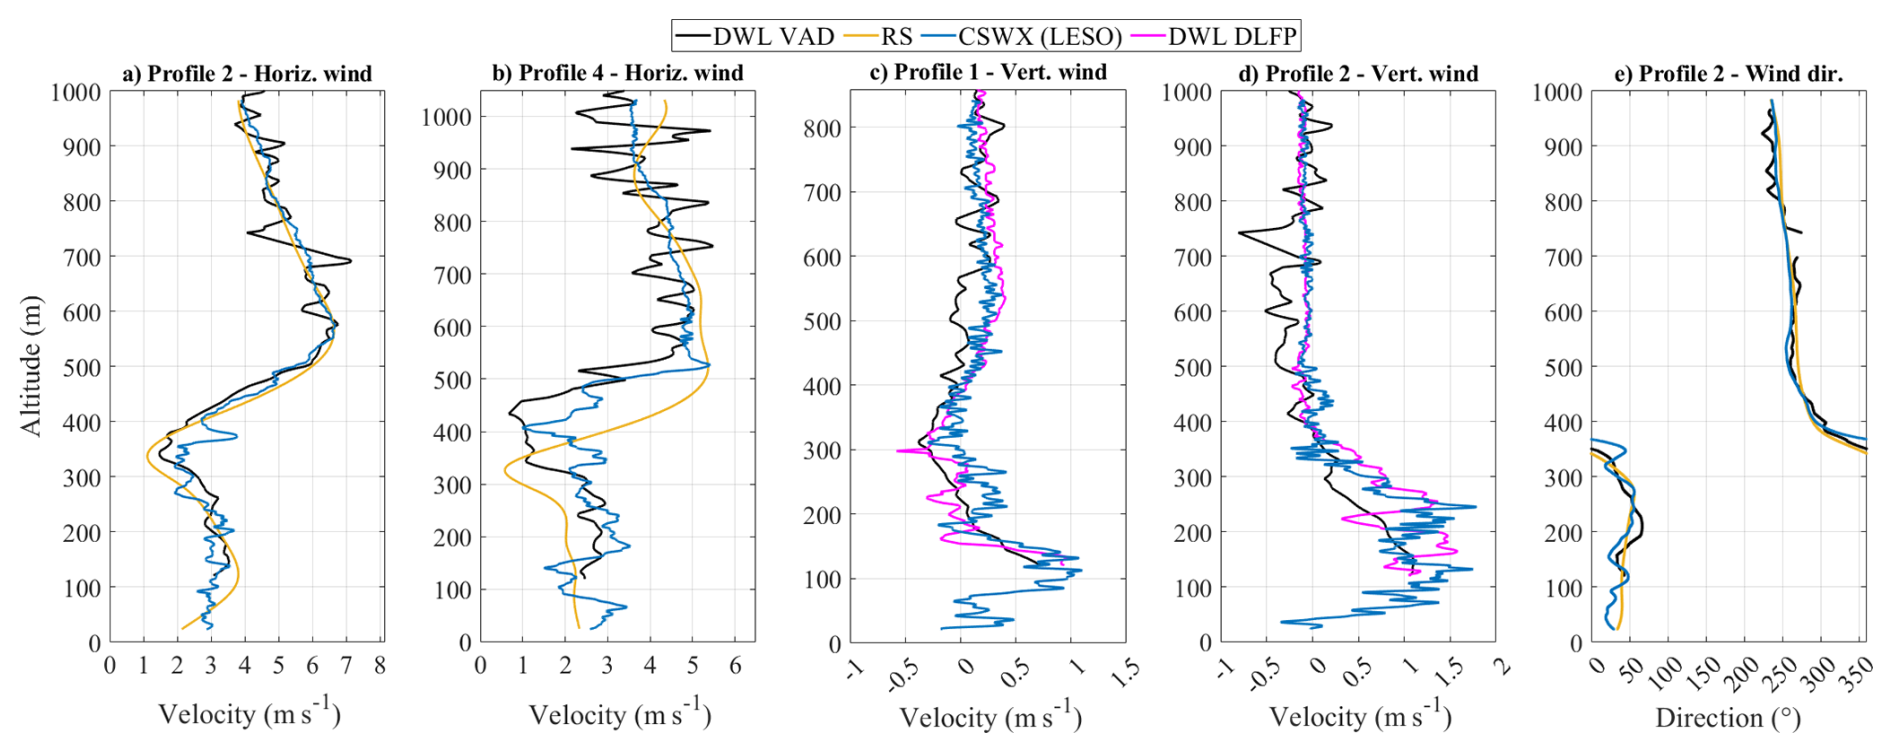
Figure 12Vertical profile comparison between LESO-based CopterSonde-SWX (CSWX) and two Doppler wind lidars (DWL); one set in fixed-point (DLFP) mode and the other in vertical-azimuth display (VAD) mode, showing two different profiles of horizontal wind speed (a, b), vertical wind velocity (c, d), and wind direction (e). The CSWX collected samples every 0.1 s, while both DWLs took samples every 5 s. The spatial separation between the CSWX and both DWLs was 20 m. These profiles were produced from the same CSWX flights and DWL measurements shown in Fig. 11.
Table 3Root mean squared error (RMSE) of both CopterSonde (CS) – CSWX and CS3D – wind profiles relative to two Doppler wind lidar (DWL) and Vaisala radiosonde (RS) profiles (see Fig. 12). One DWL was set to Fixed-point (DLFP) mode, ideal for vertical wind measurements, while the second was set to vertical-azimuth display (VAD) mode, optimized for horizontal wind measurements. The instruments had a horizontal spatial separation of less than 20 m between each other and were launched almost simultaneously.
4.2 Severe Weather Deployment
In this section, we outline our approach for deploying the CSWX in challenging PBL conditions. We describe the operational strategies, measurement objectives, and evaluation metrics used to assess its wind tolerance, precipitation resilience, and data‐quality performance. Through targeted case studies and systematic analyses, we demonstrate how the CSWX enables profiling of thermodynamic and kinematic structures in environments where conventional UAS often fail. Although the CSWX's heavy power consumption reduces flight time, it grants us the unique opportunity to characterize UAS performance under extreme conditions. Additionally, this trade-off would enable measurements of fast-evolving thermodynamic and kinematic features in atmospheric conditions almost entirely unexplored by WxUAS.
To define the CSWX's propulsion limits and develop real‐time failsafe algorithms, we conducted a series of controlled stress flights in which we logged instantaneous voltage, current, power, and airspeed across a range of extreme aerial maneuvers and high-speed test flights. Additionally, the CSWX collected vertical profiles on windy days, which extended the propulsion characterization to realistic ascent–descent profiles. For all vertical profiles, both CopterSondes were programmed to ascend at 3.5 m s−1 and descend at 5 m s−1. From these experiments, we derived third-order polynomial expressions for the ascent‐leg power Pa and descent‐leg power Pd consumptions of the CSWX as functions of horizontal wind speed U (in m s−1), yielding:
with power in W. These relationships were used in the following section to quantify the CSWX's energy consumption under varying wind conditions and form the foundation for autonomous and real‐time protection against propulsion overstress.
4.2.1 Flights in High Wind
Over the last five years and through numerous field experiments as referenced in Sect. 3, the CS3D has been thoroughly characterized, enabling us to consider its maximum safe wind tolerance of 20 m s−1 as accurately established. Figure 13 presents a case where the CSWX and CS3D, both colocated and simultaneously, measured wind profiles of a nocturnal low-level jet (LLJ). In panel (a), wind estimates from each UAS show that the CS3D reached its wind limit of 20 m s−1 at approximately 275 m, automatically triggering return-to-launch (RTL) mode, whereas the CSWX sustained winds approaching 24 m s−1 up to about 520 m.
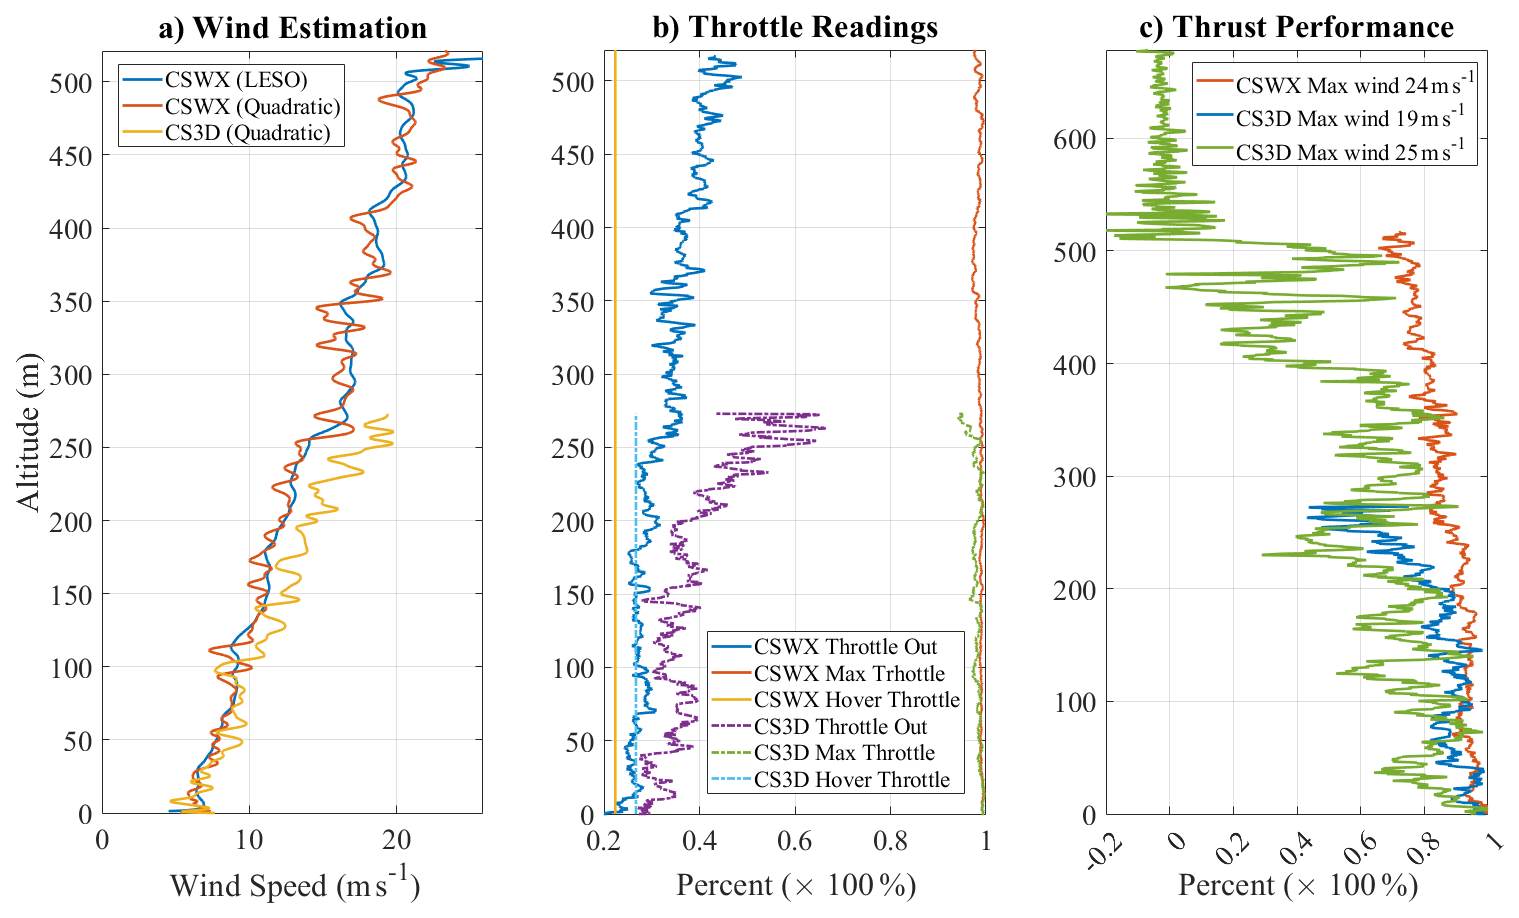
Figure 13Comparison of CSWX and CS3D wind estimation and thrust performance during a colocated, simultaneous nocturnal LLJ sounding. (a) Wind speed profiles versus altitude for CSWX (blue: LESO-based estimate; orange: linear estimate) and CS3D (yellow: quadratic estimation), showing the CS3D reaching its 20 m s−1 wind limit at ∼ 275 m (triggering RTL) while the CSWX sustains winds up to ∼ 24 m s−1 at ∼ 520 m before operator intervention. (b) Autopilot throttle metrics during ascent, such as available thrust ThM, commanded throttle ThO, and hover throttle ThH expressed as a fraction of maximum output. (c) Normalized thrust performance as formulated in Eq. (7) plotted versus altitude, illustrating the CS3D safe cutoff at ThP ≈ 0.4 and CSWX's extended thrust margin under high-wind conditions. A maxed-out CS3D case is also depicted in green where 25 m s−1 winds exhausted its available thrust (ThP ≈ 0), causing the CS3D to be pushed off course.
Given that the CSWX was a less-well-characterized platform, its ascent was terminated by operator intervention for caution rather than by reaching an unproven estimated wind threshold. Figure 13b shows the instantaneous throttle values ranging from 0 to 1 for each platform during ascent. Maximum available throttle (ThM) is internally calculated by the autopilot based on the current UAS attitude and available power to achieve a stable flight. The throttle out (ThO) is the amount of throttle requested by the autopilot to the rotors, while the throttle hover (ThH) is the estimated throttle required to maintain a stationary hover.
To quantify thrust performance ThP of each CopterSonde, we computed the difference between ThM and ThO and then normalized it by the difference between ThM and their corresponding ThH, as expressed by:
Here, the numerator ThM − ThO represents the excess thrust available above the thrust required for the current operating condition, while the denominator ThM − ThH quantifies the total thrust margin above the hover thrust (the minimum thrust needed to maintain flight in calm conditions). Therefore, ThP becomes a dimensionless metric of how much of the available thrust reserve is still usable to counter external disturbances, allowing for consistent comparison across flight regimes and platforms.
Figure 13c, shows the resultant ThP for both CSWX and CS3D in red and blue, respectively, for this particular example. Once the CS3D's ThP falls to approximately 0.4 (the predefined safe margin), it automatically initiates RTL. We therefore adopted this thrust-based safety cutoff as a high-wind performance metric to evaluate the CSWX, estimate its maximum wind tolerance, and predict the altitude at which the CSWX would have triggered RTL, assuming that the wind profile approximates a quadratic curve.
The quadratic curve fitting was used to determine ThP = f(h) and U = f(h) from Fig. 13, where h is the altitude above ground in meters. The resulting polynomials are:
By setting ThP(h) = 0.4 and solving for h we obtained the estimated altitude at which the CSWX would have reached its maximum wind tolerance. We then applied the estimated max altitude to the wind-speed fit U(h) to obtain the corresponding safe mean-wind limit. For the profile shown in Fig. 13, this procedure yielded hsafe ≈ 818 m and Usafe ≈ 29.5 m s−1. The absolute mean-wind limit (ThP = 0) corresponds to Umax ≈ 33.5 m s−1.
Next, we evaluated whether the CSWX's stored energy is sufficient to reach the safe altitude hsafe under sustained high-wind conditions. The CSWX's total energy consumption ET was obtained by summing the integrals Eqs. (5) and (6) over the ascent and descent legs.
where Ta and Td are the total ascent and descent times, respectively, which can be calculated using the UAS's fixed ascent and descent speeds. For the presented theoretical flight case up to hsafe = 818 m and assumming quadratic increase of wind speed to 29.5 m s−1 from Eq. (9), it yields ET ≈ 82 Wh. This is below the LiPo battery's total energy capacity of 130 Wh. Thus, we anticipate that the CSWX can safely reach 818 m and return to its launch point with roughly 35 % of the total energy still available. Under the same wind conditions, this represents almost 200 % increase in maximum altitude compared to the CS3D.
Unfortunately, we could not empirically validate these estimates because no sufficiently strong LLJ occurred during this study to test the CSWX's wind limits. However, achieving a top speed of 35.6 m s−1 during stress-flight tests and using the well-characterized CS3D as a proxy gave us confidence in the feasibility of these performance predictions.
4.2.2 Flights in Rain
At the KAEFS site, in addition to the Oklahoma Mesonet tower, we deployed an OTT Pluvio2 L precipitation weighing gauge (pluviometer) (Oue et al., 2025). Because the CSWX must withstand both high winds and precipitation during severe weather, it was designed to be nearly sealed, with only a few strategically placed vents for airflow and heat dissipation. To evaluate its performance in wet conditions, we conducted flights on a rainy day at KAEFS. Overcast skies with a low cloud ceiling of approximately 700 m limited our maximum flight altitude to around 300 m due to poor visibility.
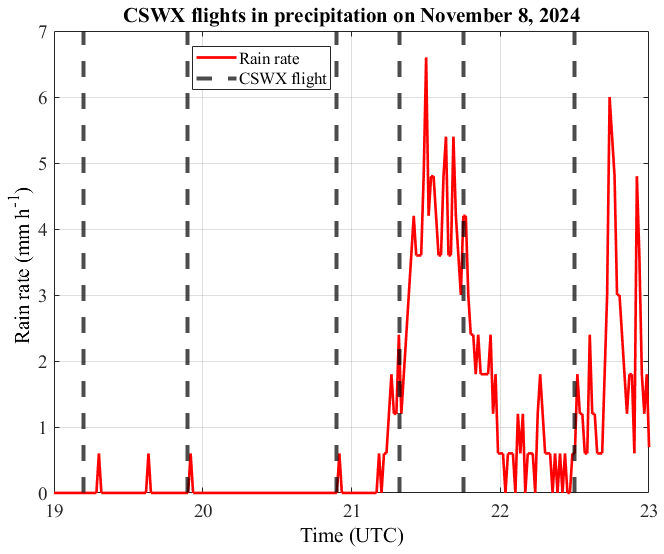
Figure 14Precipitation rate measured by the OTT Pluvio2 L weighing gauge at KAEFS on 8 November 2024 (red line), with vertical dashed lines indicating each CSWX flight. Light rainfall and elevated humidity preceded 21:00 UTC, after which moderate rain coincided with CSWX operations up to 23:00 UTC, demonstrating the platform's exposure to varying wet conditions.
Figure 14 shows the precipitation rate recorded by the pluviometer (red line) during CSWX operations, with vertical dashed lines marking each flight. Although the gauge indicates almost no rainfall between 19:00 and 21:00 UTC, ambient humidity was elevated. After 21:00 UTC, the CSWX encountered moderate rain during its flights, which it handled successfully. Figure 15 presents the temperature and relative humidity profiles measured by the CSWX for the last four flights between approximately 21:00 and 23:00 UTC. These profiles show that the CSWX operated in highly humid and rainy conditions and produced smooth, physically plausible temperature and relative humidity curves without exhibiting obvious rain-induced artifacts (e.g., sudden jumps or sensor saturation). However, no independent reference instrument (e.g., a colocated radiosonde) was available during these flights to quantitatively validate the absolute accuracy of the measurements. Therefore, these results demonstrate the platform's operational resilience in wet conditions but should not be interpreted as a full accuracy assessment under precipitation.
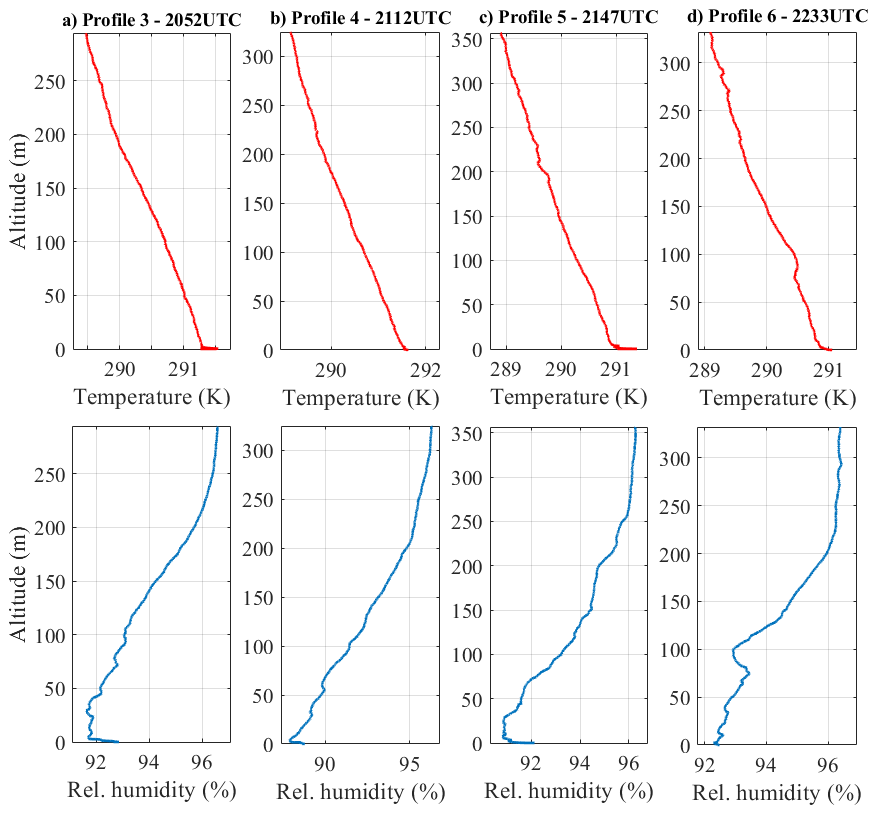
Figure 15Vertical profiles of temperature (top row, red) and relative humidity (bottom row, blue) recorded by the CSWX during its last four flights between approximately 21:00 and 23:00 UTC, profiles 3–6 from Fig. 14. The smooth, monotonic curves through altitudes up to 350 m indicate that the thermohygrometer produced accurate readings without rain‐induced artifacts.
This work has presented the CopterSonde concept, tracing its evolution from early prototypes to the severe-weather-capable CopterSonde-SWX. Extensive field campaigns under diverse weather conditions have shaped and refined the CopterSonde into a capable weather-sensing UAS with demonstrated improvements over its predecessor designs. Three core innovations distinguish the CSWX design:
-
Wind-vane flight mode. A custom autopilot routine continuously aligns the weather sensor package into the ambient wind, ensuring that thermohygrometer sensors sample relatively undisturbed air even in gusty conditions.
-
Shielded, active – ventilation sensor scoop. The front shell – with internal air circulation and solar shielding – combined with the wind-vane behavior, minimizes rotor-wash contamination and radiative heating, while preserving rapid aspiration through strategically placed vents.
-
High-thrust, tilted-body airframe. An angled fuselage paired with a powerful propulsion system trades endurance for high-wind tolerance and aerodynamic efficiency, enabling us to characterize WxUAS in above-average harsh weather conditions.
Comprehensive calibration and field validation demonstrate that these enhancements deliver measurable improvements. In side-by-side flights with the CS3D predecessor and radiosondes, the CSWX maintained inter-sensor temperature uniformity within ±0.2 °C across diverse sun irradiance and wind regimes. LESO-based wind retrievals – validated against DWL and RS – achieved RMSE of 0.49 m s−1 (vertical) and 1.03 m s−1 (horizontal), outperforming earlier CopterSonde models and showing tight agreement even under light-wind conditions.
High-wind and rain flights further demonstrate the CSWX's resilience under challenging conditions. In a nocturnal low-level jet sounding, the CSWX sustained winds up to 24 m s−1 at 520 m (beyond the CS3D's 20 m s−1 at 275 m limit) before operator intervention. Polynomial fits predict a safe maximum wind tolerance of 29.5 m s−1 and absolute wind limit of 33.5 m s−1. An example profile showed that in high-wind conditions the CSWX could reach an altitude of 818 m before automatically triggering RTL, returning to the launch point with ∼ 35 % battery energy remaining. Rain-flight tests at KAEFS on an overcast and rainy evening produced smooth temperature and humidity profiles to 350 m, with no obvious rain-induced artifacts, though no independent reference was available to verify absolute accuracy during precipitation.
Together, these findings establish the CSWX as a robust in situ profiler capable of operating in high-wind (up to ∼ 24 m s−1 observed and ∼ 32 m s−1 theoretical) and wet conditions that exceed the operational limits of its predecessor and many comparable small UAS platforms. A current limitation is that the CopterSonde cannot consistently collect reliable thermodynamic observations during descent, because the reversed rotor wash draws heated air from the platform's body and electronics across the sensor scoop; consequently, only ascent-leg data are used for atmospheric profiling. The CSWX's modular design, environment-aware autopilot features, and demonstrated performance make it a promising candidate for networked high-wind observing systems and future data-assimilation efforts in numerical weather prediction. Ongoing and future work will focus on integrating higher-energy-density batteries, enabling BVLOS operations, investigating descent-leg data quality, and adding complementary sensors (e.g., trace gases, aerosol counters) to further broaden the CopterSonde's scientific utility.
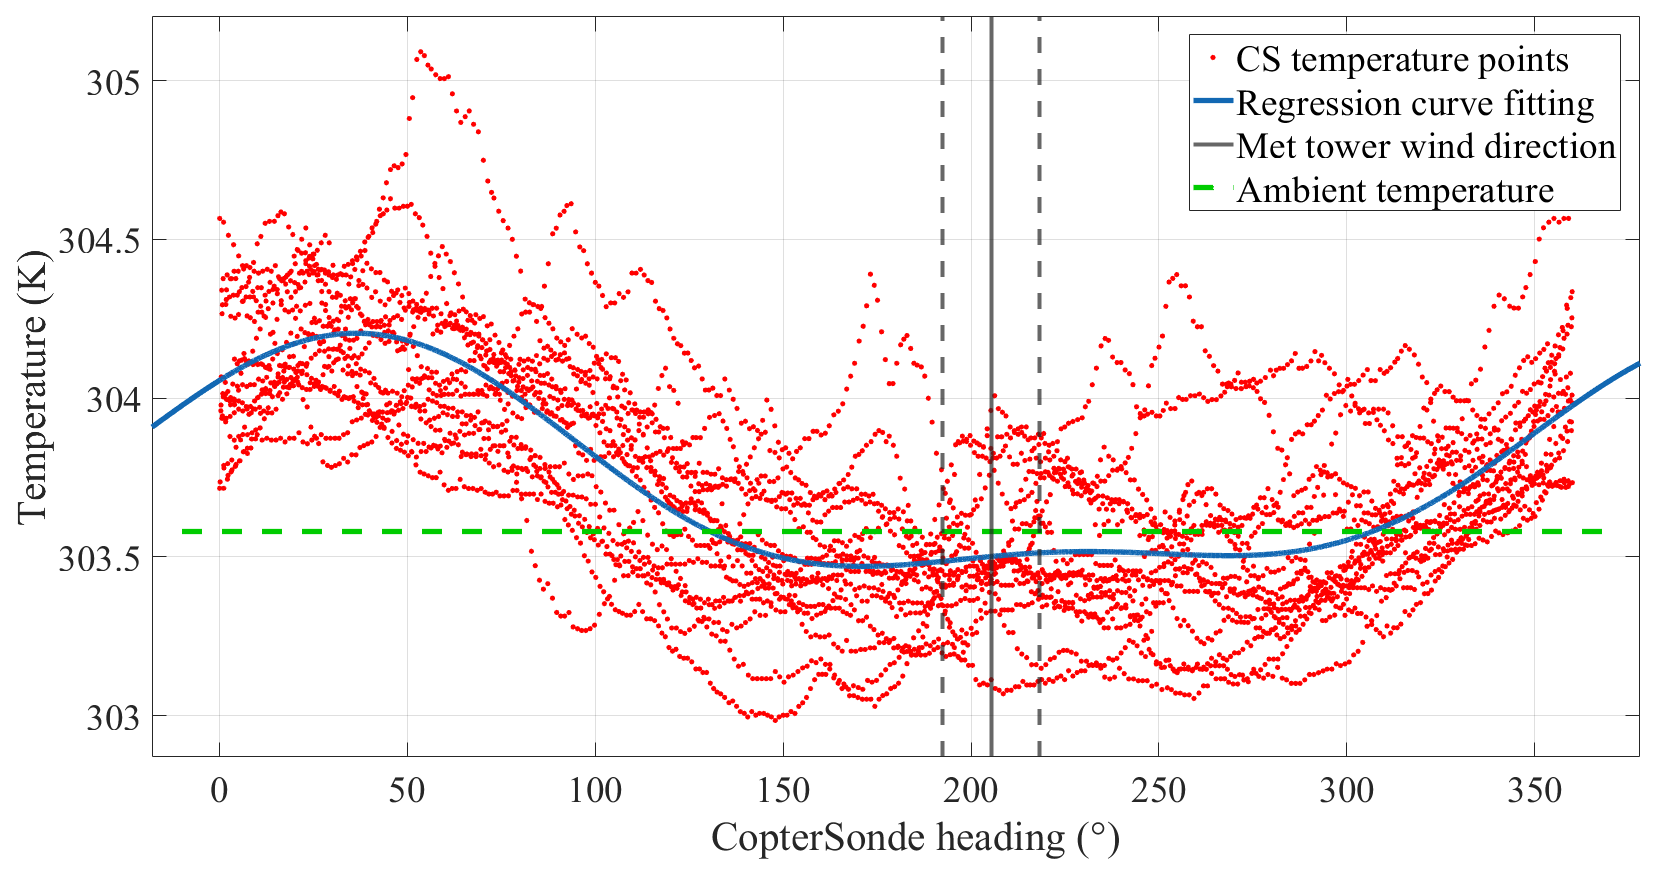
Figure A1Scatter plot of temperature observations against the aircraft's heading collected with the CS3D while hovering and rotating with a constant angular speed of 2 rpm. The mean ambient temperature and wind direction were computed using observations from a nearby meteorological tower during the flight. The vertical dashed lines represent 3 times the standard deviation of the measured wind direction. The blue line represents the best-fit polynomial curve.
Field experiments were conducted to demonstrate the CS3D design's functionality. These were specifically designed to validate sensor placement and to assess the effectiveness of the WVFM in mitigating undesired platform-induced heat sources under real-world conditions. Windy days were chosen to increase the prominence of the heat advection effects produced by the CopterSonde's body, electronics, and motors. Flights were scheduled around solar noon to minimize the temperature bias caused by solar radiation on the sides of the platform. Stationary flight or hovering configurations were performed at the same height as the temperature probes from a nearby meteorological tower used for reference.
For this experiment, the CS3D was programmed to rotate continuously about its vertical axis at a constant angular speed of 2 rpm. Through this configuration, the localized sensor arrangement of the CS3D effectively captured temperature measurements across all azimuthal directions. Figure A1 shows a point cloud of temperature observations plotted against the CS3D's heading. The best fit curve, derived through Fourier curve fitting, demonstrated a distinct wave-like pattern. Notably, the region corresponding to the minimum temperature – closely matching the mean ambient temperature obtained from a nearby meteorological tower – was flattened over a range of approximately 50° on either side of the mean wind direction. This confirmed the effectiveness of the sensor package design and provided quantitative operational constraints for the WVFM.
The data mentioned in the article can be obtained by contacting the corresponding author.
AS conceptualized the study. AS, TB, and AT curated the data, developed the methodology, and implemented the software. AS, AT, AQ, and JS performed the formal analysis and prepared the visualizations. AS and TB supervised, administered, and validated the project. AS, TB, JG, and ES conducted the investigation. ES acquired the funding and, together with AS and TB, provided the resources. AS, AT, and AQ wrote the original draft, and AS, TB, and JG reviewed and edited the manuscript with contributions from all co-authors.
The contact author has declared that none of the authors has any competing interests.
The scientific results and conclusions, as well as any views or opinions expressed herein, are those of the authors and do not necessarily reflect those of NOAA-OAR or the Department of Commerce.
Publisher's note: Copernicus Publications remains neutral with regard to jurisdictional claims made in the text, published maps, institutional affiliations, or any other geographical representation in this paper. The authors bear the ultimate responsibility for providing appropriate place names. Views expressed in the text are those of the authors and do not necessarily reflect the views of the publisher.
The authors gratefully acknowledge the financial support of the NOAA/Office of Oceanic and Atmospheric Research, U.S. Department of Commerce.
Funding was provided by NOAA/Office of Oceanic and Atmospheric Research under NOAA-University of Oklahoma Cooperative Agreement #NA21OAR4320204, U.S. Department of Commerce.
This paper was edited by Huilin Chen and reviewed by Sean Bailey and Adam Houston.
Barbieri, L., Kral, S. T., Bailey, S. C. C., Frazier, A. E., Jacob, J. D., Reuder, J., Brus, D., Chilson, P. B., Crick, C., Detweiler, C., Doddi, A., Elston, J., Foroutan, H., González-Rocha, J., Greene, B. R., Guzman, M. I., Houston, A. L., Islam, A., Kemppinen, O., Lawrence, D., Pillar-Little, E. A., Ross, S. D., Sama, M. P., Schmale, D. G., Schuyler, T. J., Shankar, A., Smith, S. W., Waugh, S., Dixon, C., Borenstein, S., and de Boer, G.: Intercomparison of Small Unmanned Aircraft System (sUAS) Measurements for Atmospheric Science during the LAPSE-RATE Campaign, Sensors, 19, https://doi.org/10.3390/s19092179, 2019. a
Bell, T. and Segales, A. R.: M2HATS: CopterSonde WxUAS Profile Data, NSF NCAR Earth Observing Laboratory [data set], https://doi.org/10.26023/KNPE-Z557-360A, 2024. a
Bell, T., Segales, A. R., and Smith, E. N.: PERiLS_2023: CopterSonde WxUAS Profile Data, NSF NCAR Earth Observing Laboratory [data set], https://doi.org/10.26023/ZF5M-CRDN-8103, 2024. a
Bell, T. M., Greene, B. R., Klein, P. M., Carney, M., and Chilson, P. B.: Confronting the boundary layer data gap: evaluating new and existing methodologies of probing the lower atmosphere, Atmos. Meas. Tech., 13, 3855–3872, https://doi.org/10.5194/amt-13-3855-2020, 2020. a, b
Chilson, P. B., Bell, T. M., Brewster, K. A., Britto Hupsel de Azevedo, G., Carr, F. H., Carson, K., Doyle, W., Fiebrich, C. A., Greene, B. R., Grimsley, J. L., Kanneganti, S. T., Martin, J., Moore, A., Palmer, R. D., Pillar-Little, E. A., Salazar-Cerreno, J. L., Segales, A. R., Weber, M. E., Yeary, M., and Droegemeier, K. K.: Moving towards a Network of Autonomous UAS Atmospheric Profiling Stations for Observations in the Earth's Lower Atmosphere: The 3D Mesonet Concept, Sensors, 19, https://doi.org/10.3390/s19122720, 2019. a, b, c
Chilson, P. B., Espinosa, A. R. S., Doyle, W. J., Bell, T. M., Greene, B. R., Martin, J. J., Pillar-Little, E. A., and de Azevedo, G. B. H.: Unmanned Aerial System for Sampling Atmospheric Data, Tech. Rep. US20210214079A1, University of Oklahoma, Norman, OK, patent number: US12084181B2, https://patents.google.com/patent/US12084181B2/en (last access: 22 May 2026), 2021. a, b
Curtis, S., Fair, A., Wistow, J., Val, D. V., and Oven, K.: Impact of extreme weather events and climate change for health and social care systems, Environmental Health, 16, 128, https://doi.org/10.1186/s12940-017-0324-3, 2017. a
Dabberdt, W. F., Schlatter, T. W., Carr, F. H., Friday, E. W. J., Jorgensen, D., Koch, S., Pirone, M., Ralph, F. M., Sun, J., Welsh, P., Wilson, J. W., and Zou, X.: Multifunctional Mesoscale Observing Networks, B. Am. Meteorol. Soc., 86, 961–982, https://doi.org/10.1175/BAMS-86-7-961, 2005. a
de Boer, G., Diehl, C., Jacob, J., Houston, A., Smith, S. W., Chilson, P., Schmale, D. G., Intrieri, J., Pinto, J., Elston, J., Brus, D., Kemppinen, O., Clark, A., Lawrence, D., Bailey, S. C. C., Sama, M. P., Frazier, A., Crick, C., Natalie, V., Pillar-Little, E., Klein, P., Waugh, S., Lundquist, J. K., Barbieri, L., Kral, S. T., Jensen, A. A., Dixon, C., Borenstein, S., Hesselius, D., Human, K., Hall, P., Argrow, B., Thornberry, T., Wright, R., and Kelly, J. T.: Development of Community, Capabilities, and Understanding through Unmanned Aircraft-Based Atmospheric Research: The LAPSE-RATE Campaign, B. Am. Meteorol. Soc., 101, E684–E699, https://doi.org/10.1175/BAMS-D-19-0050.1, 2020a. a
de Boer, G., Lawrence, D., and Doddi, A.: DataHawk2 files from LAPSE-RATE, Version 2.0, Zenodo [data set], https://doi.org/10.5281/zenodo.3891620, 2020b. a
de Boer, G., Borenstein, S., Calmer, R., Cox, C., Rhodes, M., Choate, C., Hamilton, J., Osborn, J., Lawrence, D., Argrow, B., and Intrieri, J.: Measurements from the University of Colorado RAAVEN Uncrewed Aircraft System during ATOMIC, Earth Syst. Sci. Data, 14, 19–31, https://doi.org/10.5194/essd-14-19-2022, 2022. a
de Boer, G., Butterworth, B. J., Elston, J. S., Houston, A., Pillar-Little, E., Argrow, B., Bell, T. M., Chilson, P., Choate, C., Greene, B. R., Islam, A., Martz, R., Rhodes, M., Rico, D., Stachura, M., Lappin, F. M., Segales, A. R., Whyte, S., and Wilson, M.: Evaluation and Intercomparison of Small Uncrewed Aircraft Systems Used for Atmospheric Research, J. Atmos. Ocean. Tech., 41, 127–145, https://doi.org/10.1175/JTECH-D-23-0067.1, 2024. a
Fiebrich, C. A., Ziolkowska, J. R., Chilson, P. B., and Pillar-Little, E. A.: Potential Socioeconomic and Environmental Benefits and Beneficiaries of UAS Atmospheric Profiles from a 3D Mesonet, Weather Clim. Soc., 13, 377–391, https://doi.org/10.1175/WCAS-D-20-0118.1, 2021. a
Flagg, D. D., Doyle, J. D., Holt, T. R., Tyndall, D. P., Amerault, C. M., Burmeister, D., Haack, T., Nachamkin, J. E., Peng, M., and Xu, L.: On the impact of unmanned aerial system observations on numerical weather prediction in the coastal zone, Mon. Weather Rev., 146, 599–622, https://doi.org/10.1175/MWR-D-17-0028.1, 2018. a
Frame, D. J., Rosier, S. M., Noy, I., Harrington, L. J., Carey-Smith, T., Sparrow, S. N., Stone, D. A., and Dean, S. M.: Climate change attribution and the economic costs of extreme weather events: a study on damages from extreme rainfall and drought, Climatic Change, 162, 781–797, https://doi.org/10.1007/s10584-020-02729-y, 2020. a
Geerts, B., Raymond, D. J., Grubišić, V., Davis, C. A., Barth, M. C., Detwiler, A., Klein, P. M., Lee, W.-C., Markowski, P. M., Mullendore, G. L., and Moore, J. A.: Recommendations for In Situ and Remote Sensing Capabilities in Atmospheric Convection and Turbulence, B. Am. Meteorol. Soc., 99, 2463–2470, https://doi.org/10.1175/BAMS-D-17-0310.1, 2018. a
Gill, R. and D'Andrea, R.: Computationally Efficient Force and Moment Models for Propellers in UAV Forward Flight Applications, Drones, 3, https://doi.org/10.3390/drones3040077, 2019. a, b
Goklany, I.: Deaths and death rates from extreme weather events: 1900-2008, Journal of American Physicians and Surgeons, 14, 102–109, 2009. a
Greene, B. R., Segales, A. R., Waugh, S., Duthoit, S., and Chilson, P. B.: Considerations for temperature sensor placement on rotary-wing unmanned aircraft systems, Atmos. Meas. Tech., 11, 5519–5530, https://doi.org/10.5194/amt-11-5519-2018, 2018. a, b, c
Greene, B. R., Segales, A. R., Bell, T. M., Pillar-Little, E. A., and Chilson, P. B.: Environmental and Sensor Integration Influences on Temperature Measurements by Rotary-Wing Unmanned Aircraft Systems, Sensors, 19, https://doi.org/10.3390/s19061470, 2019. a, b
Greene, B. R., Bell, T. M., Pillar-Little, E. A., Segales, A. R., Britto Hupsel de Azevedo, G., Doyle, W., Tripp, D. D., Kanneganti, S. T., and Chilson, P. B.: University of Oklahoma CopterSonde Files from LAPSE-RATE, Version v1, Zenodo [data set], https://doi.org/10.5281/zenodo.3737087, 2020. a
Greene, B. R., Kral, S. T., Chilson, P. B., and Reuder, J.: Gradient-Based Turbulence Estimates from Multicopter Profiles in the Arctic Stable Boundary Layer, Bound.-Lay. Meteorol., 183, 321–353, https://doi.org/10.1007/s10546-022-00693-x, 2022. a
Gregory, P. J., Ingram, J. S. I., and Brklacich, M.: Climate change and food security, Philos. T. Roy. Soc. B, 360, 2139–2148, https://doi.org/10.1098/rstb.2005.1745, 2005. a
Han, J.: From PID to Active Disturbance Rejection Control, IEEE T. Ind. Electron., 56, 900–906, https://doi.org/10.1109/TIE.2008.2011621, 2009. a
Hasan, M., Haque, R., Jahirul, M., Rasul, M., Fattah, I., Hassan, N., and Mofijur, M.: Advancing energy storage: The future trajectory of lithium-ion battery technologies, Journal of Energy Storage, 120, 116511, https://doi.org/10.1016/j.est.2025.116511, 2025. a
Hervo, M., Romanens, G., Martucci, G., Weusthoff, T., and Haefele, A.: Evaluation of an Automatic Meteorological Drone Based on a 6-Month Measurement Campaign, Atmosphere, 14, 1382, https://doi.org/10.3390/atmos14091382, 2023. a
Houston, A. L. and Keeler, J. M.: The Impact of Sensor Response and Airspeed on the Representation of the Convective Boundary Layer and Airmass Boundaries by Small Unmanned Aircraft Systems, J. Atmos. Ocean. Tech., 35, 1687–1699, https://doi.org/10.1175/JTECH-D-18-0019.1, 2018. a
Houston, A. L., Weiss, C. C., Rasmussen, E. N., Coniglio, M. C., Ziegler, C. L., Argrow, B. M., and Frew, E. W.: Targeted Observation by Radars and UAS of Supercells: TORUS, B. Am. Meteorol. Soc., 107, E249–E276, https://doi.org/10.1175/BAMS-D-23-0265.1, 2026. a
Islam, A., Houston, A., Shankar, A., and Detweiler, C.: Design and Evaluation of Sensor Housing for Boundary Layer Profiling Using Multirotors, Sensors (Basel), 19, 2481, https://doi.org/10.3390/s19112481, 2019. a
Itani, K. and De Bernardinis, A.: Review on New-Generation Batteries Technologies: Trends and Future Directions, Energies, 16, https://doi.org/10.3390/en16227530, 2023. a
Jacob, J. D., Chilson, P. B., Houston, A. L., and Smith, S. W.: Considerations for Atmospheric Measurements with Small Unmanned Aircraft Systems, Atmosphere, 9, https://doi.org/10.3390/atmos9070252, 2018. a, b
Jensen, A. A., Stensrud, D. J., and Alaoui, N.: Assimilation of Thermodynamic Information from UAS into Convection-Allowing Forecasts, Mon. Weather Rev., 149, 1091–1108, https://doi.org/10.1175/MWR-D-20-0150.1, 2021. a
Kistner, J., Neuhaus, L., and Wildmann, N.: High-resolution wind speed measurements with quadcopter uncrewed aerial systems: calibration and verification in a wind tunnel with an active grid, Atmos. Meas. Tech., 17, 4941–4955, https://doi.org/10.5194/amt-17-4941-2024, 2024. a
Koch, S. E., Fengler, M., Chilson, P. B., Elmore, K. L., Argrow, B., Andra Jr., D. L., and Lindley, T.: On the Use of Unmanned Aircraft for Sampling Mesoscale Phenomena in the Preconvective Boundary Layer, J. Atmos. Ocean. Tech., 35, 2265–2288, https://doi.org/10.1175/JTECH-D-18-0101.1, 2018. a, b
Kosiba, K. A., Lyza, A. W., Trapp, R. J., Rasmussen, E. N., Parker, M., Biggerstaff, M. I., Nesbitt, S. W., Weiss, C. C., Wurman, J., Knupp, K. R., Coffer, B., Chmielewski, V. C., Dawson, D. T., Bruning, E., Bell, T. M., Coniglio, M. C., Murphy, T. A., French, M., Blind-Doskocil, L., Reinhart, A. E., Wolff, E., Schneider, M. E., Silcott, M., Smith, E., Aikins, J., Wagner, M., Robinson, P., Wilczak, J. M., White, T., Diedrichsen, M. R., Bodine, D., Kumjian, M. R., Waugh, S. M., Alford, A. A., Elmore, K., Kollias, P., and Turner, D. D.: The Propagation, Evolution, and Rotation in Linear Storms (PERiLS) Project, B. Am. Meteorol. Soc., 105, E1768–E1799, https://doi.org/10.1175/BAMS-D-22-0064.1, 2024. a
Kral, S., Reuder, J., Vihma, T., Suomi, I., O'Connor, E., Kouznetsov, R., Wrenger, B., Rautenberg, A., Urbancic, G., Jonassen, M., Båserud, L., Maronga, B., Mayer, S., Lorenz, T., Holtslag, A., Steeneveld, G.-J., Seidl, A., Müller, M., Lindenberg, C., Langohr, C., Voss, H., Bange, J., Hundhausen, M., Hilsheimer, P., and Schygulla, M.: Innovative Strategies for Observations in the Arctic Atmospheric Boundary Layer (ISOBAR) – The Hailuoto 2017 Campaign, Atmosphere, 9, 268, https://doi.org/10.3390/atmos9070268, 2018. a
Lappin, F., Pillar‐Little, E., Segales, A. R., Jordan, A., Medina, I., Otterstatter, L., Puxley, B., Spencer, M., and Smith, E.: TRACER UAS CopterSonde Profiles, ARM user facility [data set], https://doi.org/10.5439/1969004, 2023. a
Lazo, J. K., Lawson, M., Larsen, P. H., and Waldman, D. M.: U.S. Economic Sensitivity to Weather Variability, B. Am. Meteorol. Soc., 92, 709–720, https://doi.org/10.1175/2011BAMS2928.1, 2011. a
Li, S., Yang, J., Chen, W.-H., and Chen, X.: Generalized Extended State Observer Based Control for Systems With Mismatched Uncertainties, IEEE T. Ind. Electron., 59, 4792–4802, 2012. a
Liu, C.: Severe weather in a warming climate, Nature, 544, 422–423, https://doi.org/10.1038/544422a, 2017. a
Markolf, S. A., Hoehne, C., Fraser, A., Chester, M. V., and Underwood, B. S.: Transportation resilience to climate change and extreme weather events – Beyond risk and robustness, Transp. Policy, 74, 174–186, https://doi.org/10.1016/j.tranpol.2018.11.003, 2019. a
McFarquhar, G. M., Smith, E., Pillar-Little, E. A., Brewster, K., Chilson, P. B., Lee, T. R., Waugh, S., Yussouf, N., Wang, X., Xue, M., de Boer, G., Gibbs, J. A., Fiebrich, C., Baker, B., Brotzge, J., Carr, F., Christophersen, H., Fengler, M., Hall, P., Hock, T., Houston, A., Huck, R., Jacob, J., Palmer, R., Quinn, P. K., Wagner, M., Zhang, Y. R., and Hawk, D.: Current and Future Uses of UAS for Improved Forecasts/Warnings and Scientific Studies, B. Am. Meteorol. Soc., 101, E1322–E1328, https://doi.org/10.1175/BAMS-D-20-0015.1, 2020. a
Mirza, M. M. Q.: Climate change and extreme weather events: can developing countries adapt?, Clim. Policy, 3, 233–248, https://doi.org/10.3763/cpol.2003.0330, 2003. a
Murdzek, S. S. and Ladwig, T. T.: The Development of a Regional, High-Resolution OSSE Framework to Study the Impact of Observations from Uncrewed Aircraft Systems on Numerical Weather Prediction, J. Atmos. Ocean. Tech., 42, 207–229, https://doi.org/10.1175/JTECH-D-24-0056.1, 2025. a
National Academies of Sciences, Engineering, and Medicine: Thriving on Our Changing Planet: A Decadal Strategy for Earth Observation from Space, The National Academies Press, Washington, DC, https://doi.org/10.17226/24938, ISBN 978-0-309-46754-4, 2018. a
National Oceanic and Atmospheric Administration (NOAA): Precipitation prediction grand challenge strategic plan, https://www.noaa.gov/sites/default/files/2022-01/PPGC-Strategy_FINAL_2020-1030.pdf (last access: 30 August 2025), 2020. a
National Research Council (NRC): Observing Weather and Climate from the Ground Up: A Nationwide Network of Networks, Natl. Acad. Press, Washington, D.C., https://doi.org/10.17226/12540, 2009. a
National Severe Storm Laboratory (NSSL): MRMS: Multiple Radar/Multiple Sensor, https://www.nssl.noaa.gov/news/factsheets/MRMS_2015.March.16.pdf (last access: 30 August 2025), 2015. a
National Weather Service (NWS): Building a Weather-Ready Nation. 2019-2022 stratigic plan, https://www.weather.gov/media/wrn/NWS_Weather-Ready-Nation_Strategic_Plan_2019-2022.pdf (last access: 30 August 2025), 2019. a
Neumann, P. P. and Bartholmai, M.: Real-time wind estimation on a micro unmanned aerial vehicle using its inertial measurement unit, Sensor Actuat. A-Phys., 235, 300–310, https://doi.org/10.1016/j.sna.2015.09.036, 2015. a
Oue, M., Ryzhkov, A. V., Matrosov, S. Y., Bukovčić, P., and Kollias, P.: Estimating Ice Water Content for Winter Storms from Millimeter-Wavelength Radar Measurements Using a Synthesis of Polarimetric and Dual-Frequency Radar Observations, J. Atmos. Ocean. Tech., 42, 75–90, https://doi.org/10.1175/JTECH-D-23-0143.1, 2025. a
Rosenzweig, C., Iglesias, A., Yang, X. B., Epstein, P. R., and Chivian, E.: Climate Change and Extreme Weather Events; Implications for Food Production, Plant Diseases, and Pests, Global Change and Human Health, 2, 90–104, https://doi.org/10.1023/A:1015086831467, 2001. a
Scheffers, B. R. and Pecl, G.: Persecuting, protecting or ignoring biodiversity under climate change, Nat. Clim. Change, 9, 581–586, https://doi.org/10.1038/s41558-019-0526-5, 2019. a
Segales, A. R.: Design and Implementation of a Novel Multicopter Unmanned Aircraft System for Quantitative Studies of the Atmosphere, PhD thesis, The University of Oklahoma, Norman, OK, USA, https://shareok.org/items/92faae2c-b1bc-4af2-acfe-f3c7cfbb5fcd (last access: 30 August 2025), 2022. a, b, c
Segales, A. R., Greene, B. R., Bell, T. M., Doyle, W., Martin, J. J., Pillar-Little, E. A., and Chilson, P. B.: The CopterSonde: an insight into the development of a smart unmanned aircraft system for atmospheric boundary layer research, Atmos. Meas. Tech., 13, 2833–2848, https://doi.org/10.5194/amt-13-2833-2020, 2020. a, b, c, d, e
Segales, A. R., Chilson, P. B., and Salazar-Cerreño, J. L.: Considerations for improving data quality of thermo-hygrometer sensors on board unmanned aerial systems for planetary boundary layer research, Atmos. Meas. Tech., 15, 2607–2621, https://doi.org/10.5194/amt-15-2607-2022, 2022. a
Segales, A. R., Tridgell, A., Mackay, R., Barker, P., Marchi, L. D., WickedShell, Riseborough, P., Pittenger, T., Jason4short, Kancir, P., Jschall, de Sousa, G. J., Hall, L., Oborne, M., Walser, J., Hickey, P., Lucas, A., Lefebvre, R., Purohit, S. B., Ferreira, F., Katsutoshi, M., de Oliveira Filho, C. M., Staroselskii, G., Morphett, G., Denecke, M., Shamaev, E., Beraud, J., Jehangir, R., Hall, P., Goppert, J., and Vilches, V. M.: oucass/BLISS-ardupilot: BLISSv1.6.9-Copter-4.5.6, Zenodo [code], https://doi.org/10.5281/zenodo.3494655, 2024. a
Shakhatreh, H., Sawalmeh, A. H., Al-Fuqaha, A., Dou, Z., Almaita, E., Khalil, I., Othman, N. S., Khreishah, A., and Guizani, M.: Unmanned Aerial Vehicles (UAVs): A Survey on Civil Applications and Key Research Challenges, IEEE Access, 7, 48572–48634, https://doi.org/10.1109/ACCESS.2019.2909530, 2019. a
Smith, E. N., Bell, T., and Segales, A. R.: PERiLS_2022: CopterSonde WxUAS Profile Data, NSF NCAR Earth Observing Laboratory [data set], https://doi.org/10.26023/V6BM-2N1K-B03, 2024. a
Stevens, B. L., Lewis, F. L., and Johnson, E. N.: Robustness and Multivariable Frequency-Domain Techniques, John Wiley & Sons, Ltd, Chap. 6, 500–583, https://doi.org/10.1002/9781119174882.ch6, ISBN 9781119174882, 2015. a
Tang, J., Jain, K. P., and Mueller, M. W.: QUaRTM: A Quadcopter with Unactuated Rotor Tilting Mechanism capable of faster, more agile, and more efficient flight, Frontiers in Robotics and AI, 9, 1033715, https://doi.org/10.3389/frobt.2022.1033715, 2022. a, b
Wagner, T. J., Klein, P. M., and Turner, D. D.: A New Generation of Ground-Based Mobile Platforms for Active and Passive Profiling of the Boundary Layer, B. Am. Meteorol. Soc., 100, 137–153, https://doi.org/10.1175/BAMS-D-17-0165.1, 2019. a
Webster, P. J.: Improve weather forecasts for the developing world, Nature, 493, 17–19, https://doi.org/10.1038/493017a, 2013. a
Wildmann, N. and Wetz, T.: Towards vertical wind and turbulent flux estimation with multicopter uncrewed aircraft systems, Atmos. Meas. Tech., 15, 5465–5477, https://doi.org/10.5194/amt-15-5465-2022, 2022. a
Wildmann, N., Hofsäß, M., Weimer, F., Joos, A., and Bange, J.: MASC – a small Remotely Piloted Aircraft (RPA) for wind energy research, Adv. Sci. Res., 11, 55–61, https://doi.org/10.5194/asr-11-55-2014, 2014. a
WMO: Plan for a global demonstration project on Uncrewed Aircraft Vehicles (UAVs) use in operational meteorology, https://community.wmo.int/uas-demonstration (last access: 30 August 2025), 2021. a
Zhang, J., Howard, K., Langston, C., Kaney, B., Qi, Y., Tang, L., Grams, H., Wang, Y., Cocks, S., Martinaitis, S., Arthur, A., Cooper, K., Brogden, J., and Kitzmiller, D.: Multi-Radar Multi-Sensor (MRMS) Quantitative Precipitation Estimation: Initial Operating Capabilities, B. Am. Meteorol. Soc., 97, 621–638, https://doi.org/10.1175/BAMS-D-14-00174.1, 2016. a
- Abstract
- Introduction
- CopterSonde UAS Conceptualization
- CopterSonde-SWX – Severe Weather Edition
- Field Operations and Observations
- Conclusions
- Appendix A: CS3D Heading-Dependent Temperature Experiment
- Data availability
- Author contributions
- Competing interests
- Disclaimer
- Acknowledgements
- Financial support
- Review statement
- References