the Creative Commons Attribution 4.0 License.
the Creative Commons Attribution 4.0 License.
 | 11 Jun 2026
Rain gauges and X-band radar hourly comparison under complex orographic conditions in Reunion Island during the passage of the tropical cyclone Batsirai
Ambinintsoa Volatiana Ramanamahefa
Thiruvengadam Padmanabhan
Guillaume Lesage
Joël Van Baelen
The South-West Indian Ocean (SWIO) region is prone to heavy rainfall, particularly during the passage of tropical cyclones. Given the topography of SWIO islands, orography plays an important role in the spatial distribution of precipitation. The ESPOIRS project was designed to investigate such dynamics in Reunion Island, Seychelles, and Madagascar using a mobile X-band radar. Reunion Island served as a testbed to evaluate X-band radar retrieved QPE using specific comparisons between several radar approaches and available rain gauges. This is the first study to use an X-band dual-polarization radar in the SWIO region. Our research focuses on the intense tropical cyclone event Batsirai in Reunion Island and shows the effectiveness of dual-polarization radar when compared to single-polarization radar in mitigating reflectivity attenuation. Both the Hitschfeld and Bordan and the philinear algorithms were employed and evaluated for this purpose. As study encountered challenges related to noisy and low-resolution differential phase (ϕdp) data, the pre-processing steps used to extract reliable ϕdp data from the observed measurements are detailed. Furthermore, two precipitation estimators were tested, R(Z) and R(kdp). Results show that R(Z) is sensitive to the attenuation correction method. Additionally, using the extracted ϕdp, empirical model for R(kdp) for Reunion Island is proposed and discussed. This model provided better results compared to the R(Z) estimates for heavy precipitation, which can be explained by the fact that kdp is directly linked to precipitation concentration and does not require attenuation correction. The findings highlight that the accuracy of the radar QPE is strongly influenced by local topography, which in turn governs local rainfall patterns, while the accuracy of QPE also depends on the type of precipitation.
- Article
(9361 KB) - Full-text XML
- BibTeX
- EndNote


The South-West Indian Ocean (SWIO) islands have a tropical climate and often experience heavy rainfall, especially during the cyclonic season. For example, Reunion Island holds rainfall world records, including most accumulated precipitation in 12, 24 and 72 h during tropical cyclonic events with respective values of 1144, 1825 and 3930 mm (https://meteofrance.com/magazine/meteo-questions/quel-endroit-detient-le-record-mondial-de-pluie, last access: 19 May 2026), due to the orographic effect on precipitation. For this reason, one focus of the ESPOIRS project, standing for “Study of Indian Ocean Precipitating Systems by Radar and Satellites” (“Etudes des Systèmes Précipitant dans l'Océan Indien par Radar et Satellite” in French), is to study orographic precipitation with respect to the contrasting orography of Reunion Island, Seychelles, and Madagascar. Therefore, this study requires data with a high spatial and temporal resolution, as precipitation in mountainous regions varies greatly in space and time (Barros and Arulraj, 2020). To achieve this, a mobile doppler dual-polarization X-band radar with high spatial and temporal resolution was acquired and deployed successively in Reunion Island, Seychelles, and Madagascar.
Although X-band radars are affected by attenuation, they are still an excellent tool to obtain detailed observations (Yang et al., 2023; Antonini et al., 2017). However, quantitative precipitation estimation (QPE) using X-band radar is still in the early stages of development in the SWIO region. This is the first study on radar QPE using dual-polarization X-band radar in this region whose complex terrain makes the study challenging. Currently (2025), in SWIO, only Reunion Island combines two operational S-band radars with a fairly dense network of rain gauges with 6 min and 1 h temporal resolutions. Therefore, for the ESPOIRS project, Reunion Island served as an appropriate testbed to assess the quality of the QPE derived from the ESPOIRS X-band radar.
For this paper, two estimators, R(Z) and R(kdp), were tested for the radar QPE. However, reflectivity (Z) is affected by attenuation caused by liquid clouds and precipitation, especially for the X-band radar (Delrieu et al., 1999), which is more pronounced in tropical regions like SWIO. For example, at a 3 cm wavelength (X-band), echoes located behind a thunderstorm cell with a width of 5–10 km can be approximately 95 % weaker than their strength if the cell had not been present (Fabry, 2017). The literature proposes various methods for correcting attenuation. Generally, correction methods for attenuation of radar reflectivity are based on two principles. The first set of methods is based on single polarization and requires only reflectivity as the input. It uses empirical relationships to calculate the specific attenuation A from reflectivity Z (Jacobi and Heistermann, 2016), such as the methods of Hitschfeld and Bordan (1954), Harrison et al. (2000), and Krämer and Verworn (2009). The advantage of these approaches lies in their ease of implementation, although they heavily depend on proper radar calibration. The second set of methods is based on dual polarization, where attenuation is estimated from the differential phase shift (ϕdp) (Bringi et al., 1990; Testud et al., 2000; Park et al., 2005). This approach provides more relevant rainfall data than the single-polarization method. However, since the radar does not directly measure the real differential phase shift ϕdp, some data pre-processing is required to extract ϕdp from the observed or total differential phase shift (more details in Sect. 2.2.2), which can challenging (Fabry, 2017).
Another method for estimating rainfall intensity without correcting for attenuation is R(kdp). The specific differential phase shift kdp does not depend on the signal amplitude, unlike Z reflectivity, but on the signal phase, and is independent of signal attenuation. Many authors (Figueras i Ventura et al., 2012; Maesaka et al., 2012; Koffi et al., 2014) have demonstrated the advantages of this approach for better estimating rainfall rates during heavy precipitation events. A key challenge in using kdp is that it is difficult to estimate, as it is not directly measured by the radar (Reimel and Kumjian, 2021).
The objective of this paper is twofold. First, it aims to evaluate the effectiveness of the single-polarization method (Hitschfeld and Bordan, 1954) alongside dual-polarization correction methods, specifically the philinear method (Bringi et al., 1990), for correcting reflectivity Z attenuation. This evaluation seeks to highlight the strengths and limitations of these methods. Second, it aims to achieve accurate precipitation estimates using both R(Z) and R(kdp) estimators by considering the impact of the terrain on each rain gauge location and the type of precipitation (stratiform or convective) on the radar quantitative precipitation estimation (QPE).
The paper is structured as follows. Section 2 provides a comprehensive description of the dataset, outlines data pre-processing, details the two methods used for reflectivity attenuation correction, namely the Hitschfeld and Bordan (1954) method and the philinear method (Bringi et al., 1990), and details the estimation of R(kdp) specific to Reunion Island. Section 3 compares the radar-based quantitative precipitation estimates (QPE) with ground-based rain gauge measurements and discusses the findings. Finally, Sect. 4 presents the conclusions and perspectives of this study.
2.1 Study area and data
In the initial phase of the ESPOIRS project, a doppler dual-polarization X-band radar was deployed in Reunion Island ahead of the campaigns in Seychelles and Madagascar. Quality control of radar data was conducted in Reunion, where Météo France has set up an extensive network of rain gauges with a high temporal resolution of 6 min and 1 h. As the project focuses mainly on heavy precipitation, this study was carried out with data collected during the intense cyclone Batsirai, which spanned from 1 to 4 February 2022, a period when continuous radar and rain gauges data were available. The total number of volume scans is 576.
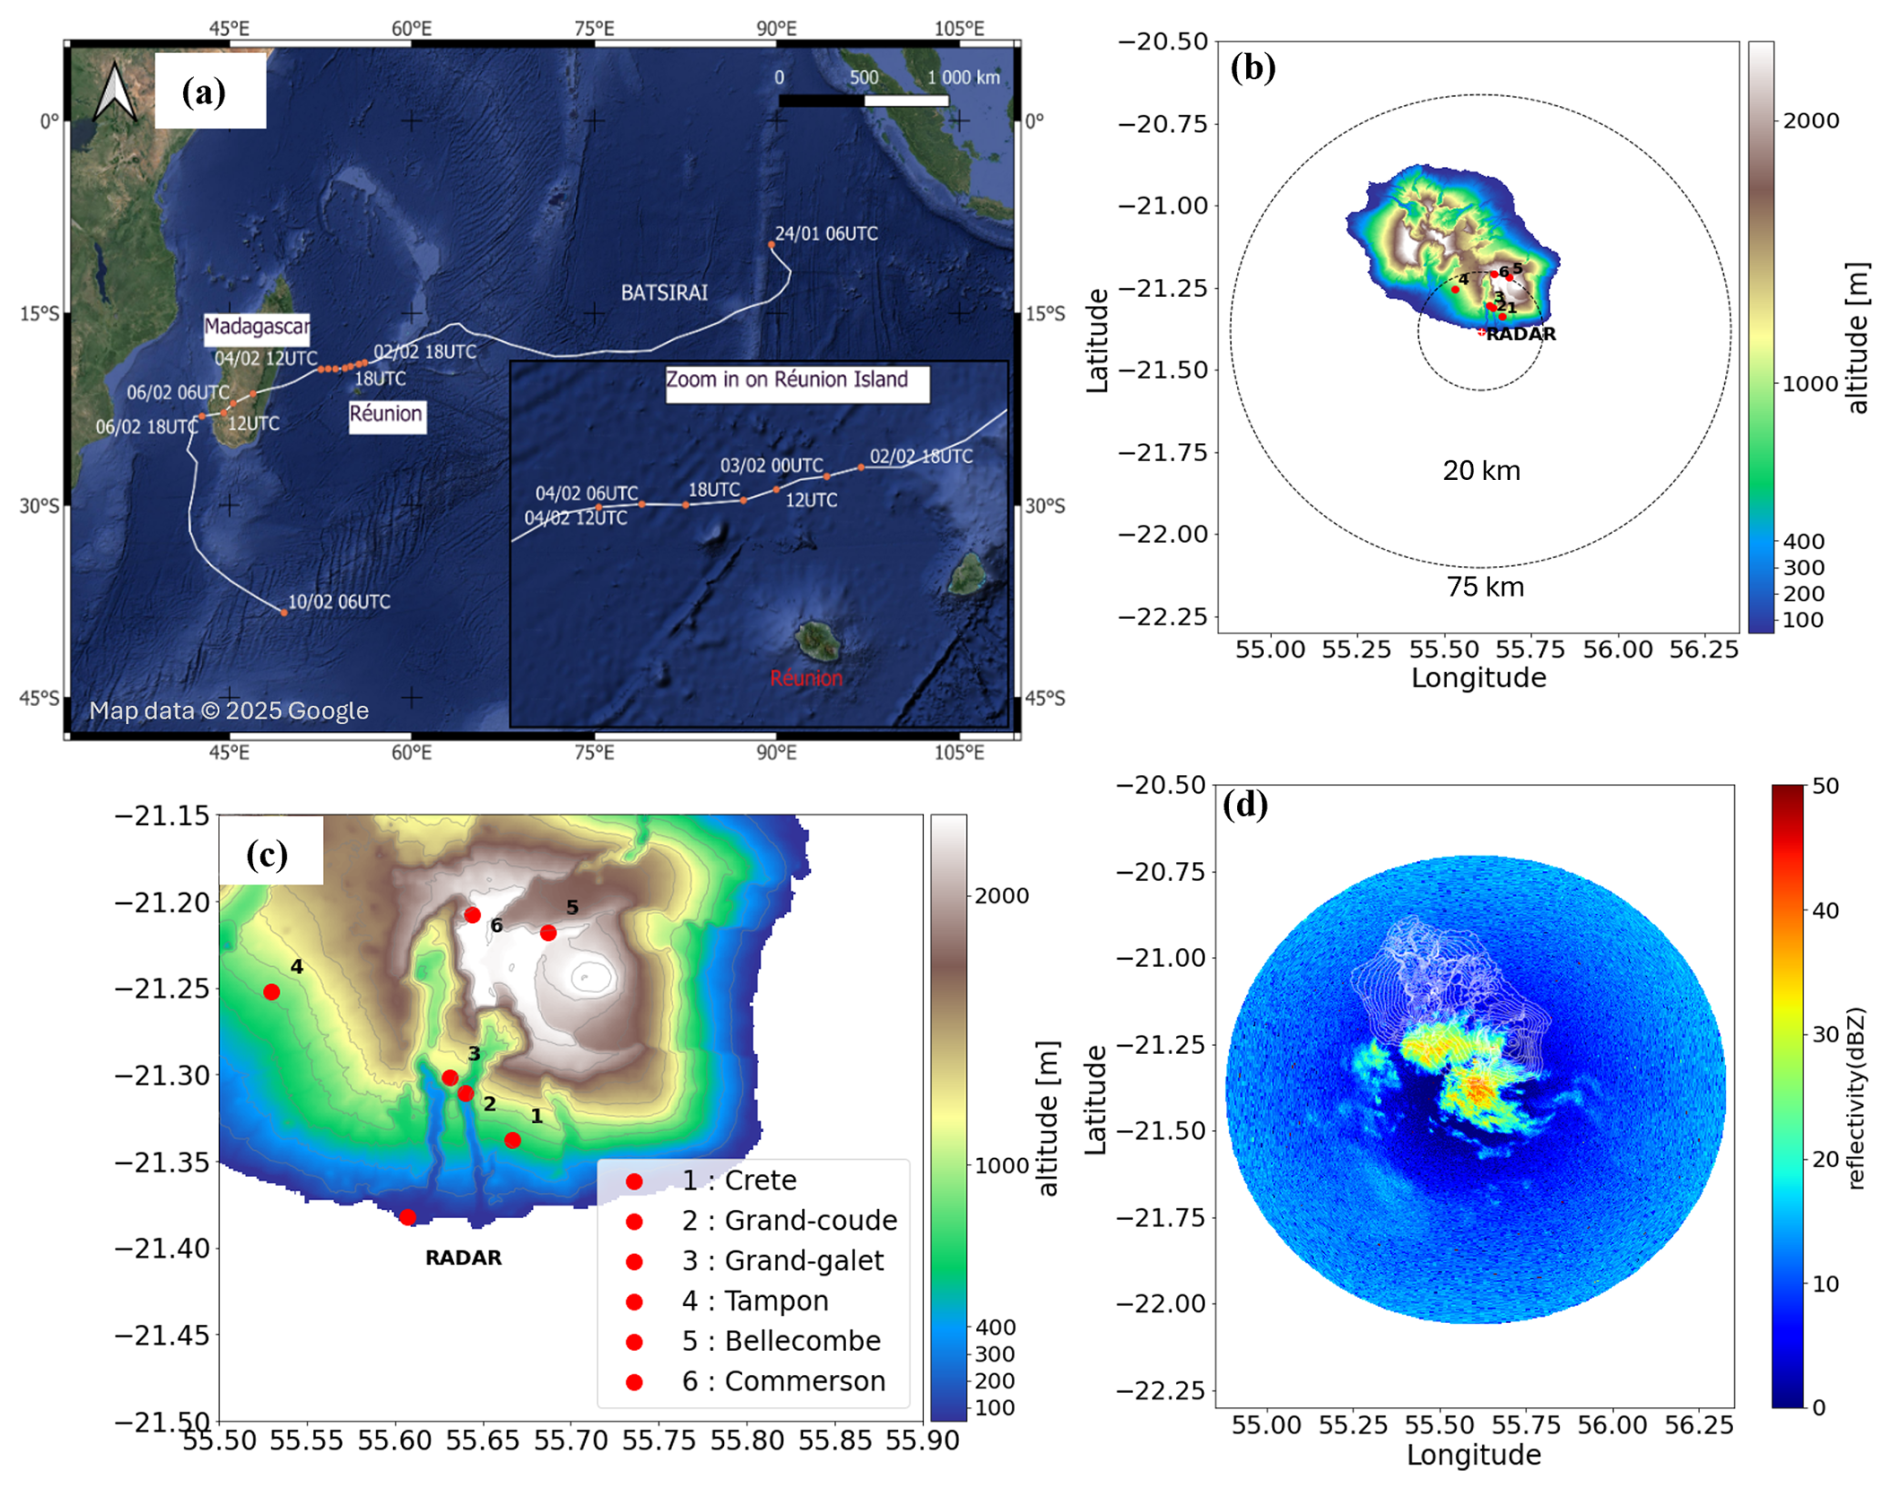
Figure 1(a) Location of the South-West Indian Ocean and track of the tropical cyclone Batsirai (TC); (b) digital elevation model of Réunion Island showing the radar site and nearby rain gauges, the 75 km radar range, and the 20 km radius within which the radar beam is the closest (vertically) to the rain gauges. (c) Zoom over the study area. (d) PPI of raw reflectivity at 11° elevation, observed at 19:00 UTC on 3 February 2025 (Additional example of PPIs are provided in Appendix A).
Figure 1a shows the track of Tropical Cyclone Batsirai, while Fig. 1d illustrates an example of a PPI of raw reflectivity at 11° elevation during Batsirai's passage close to Réunion Island. Additional examples of PPIs with filtered reflectivity data are provided in Appendix A.
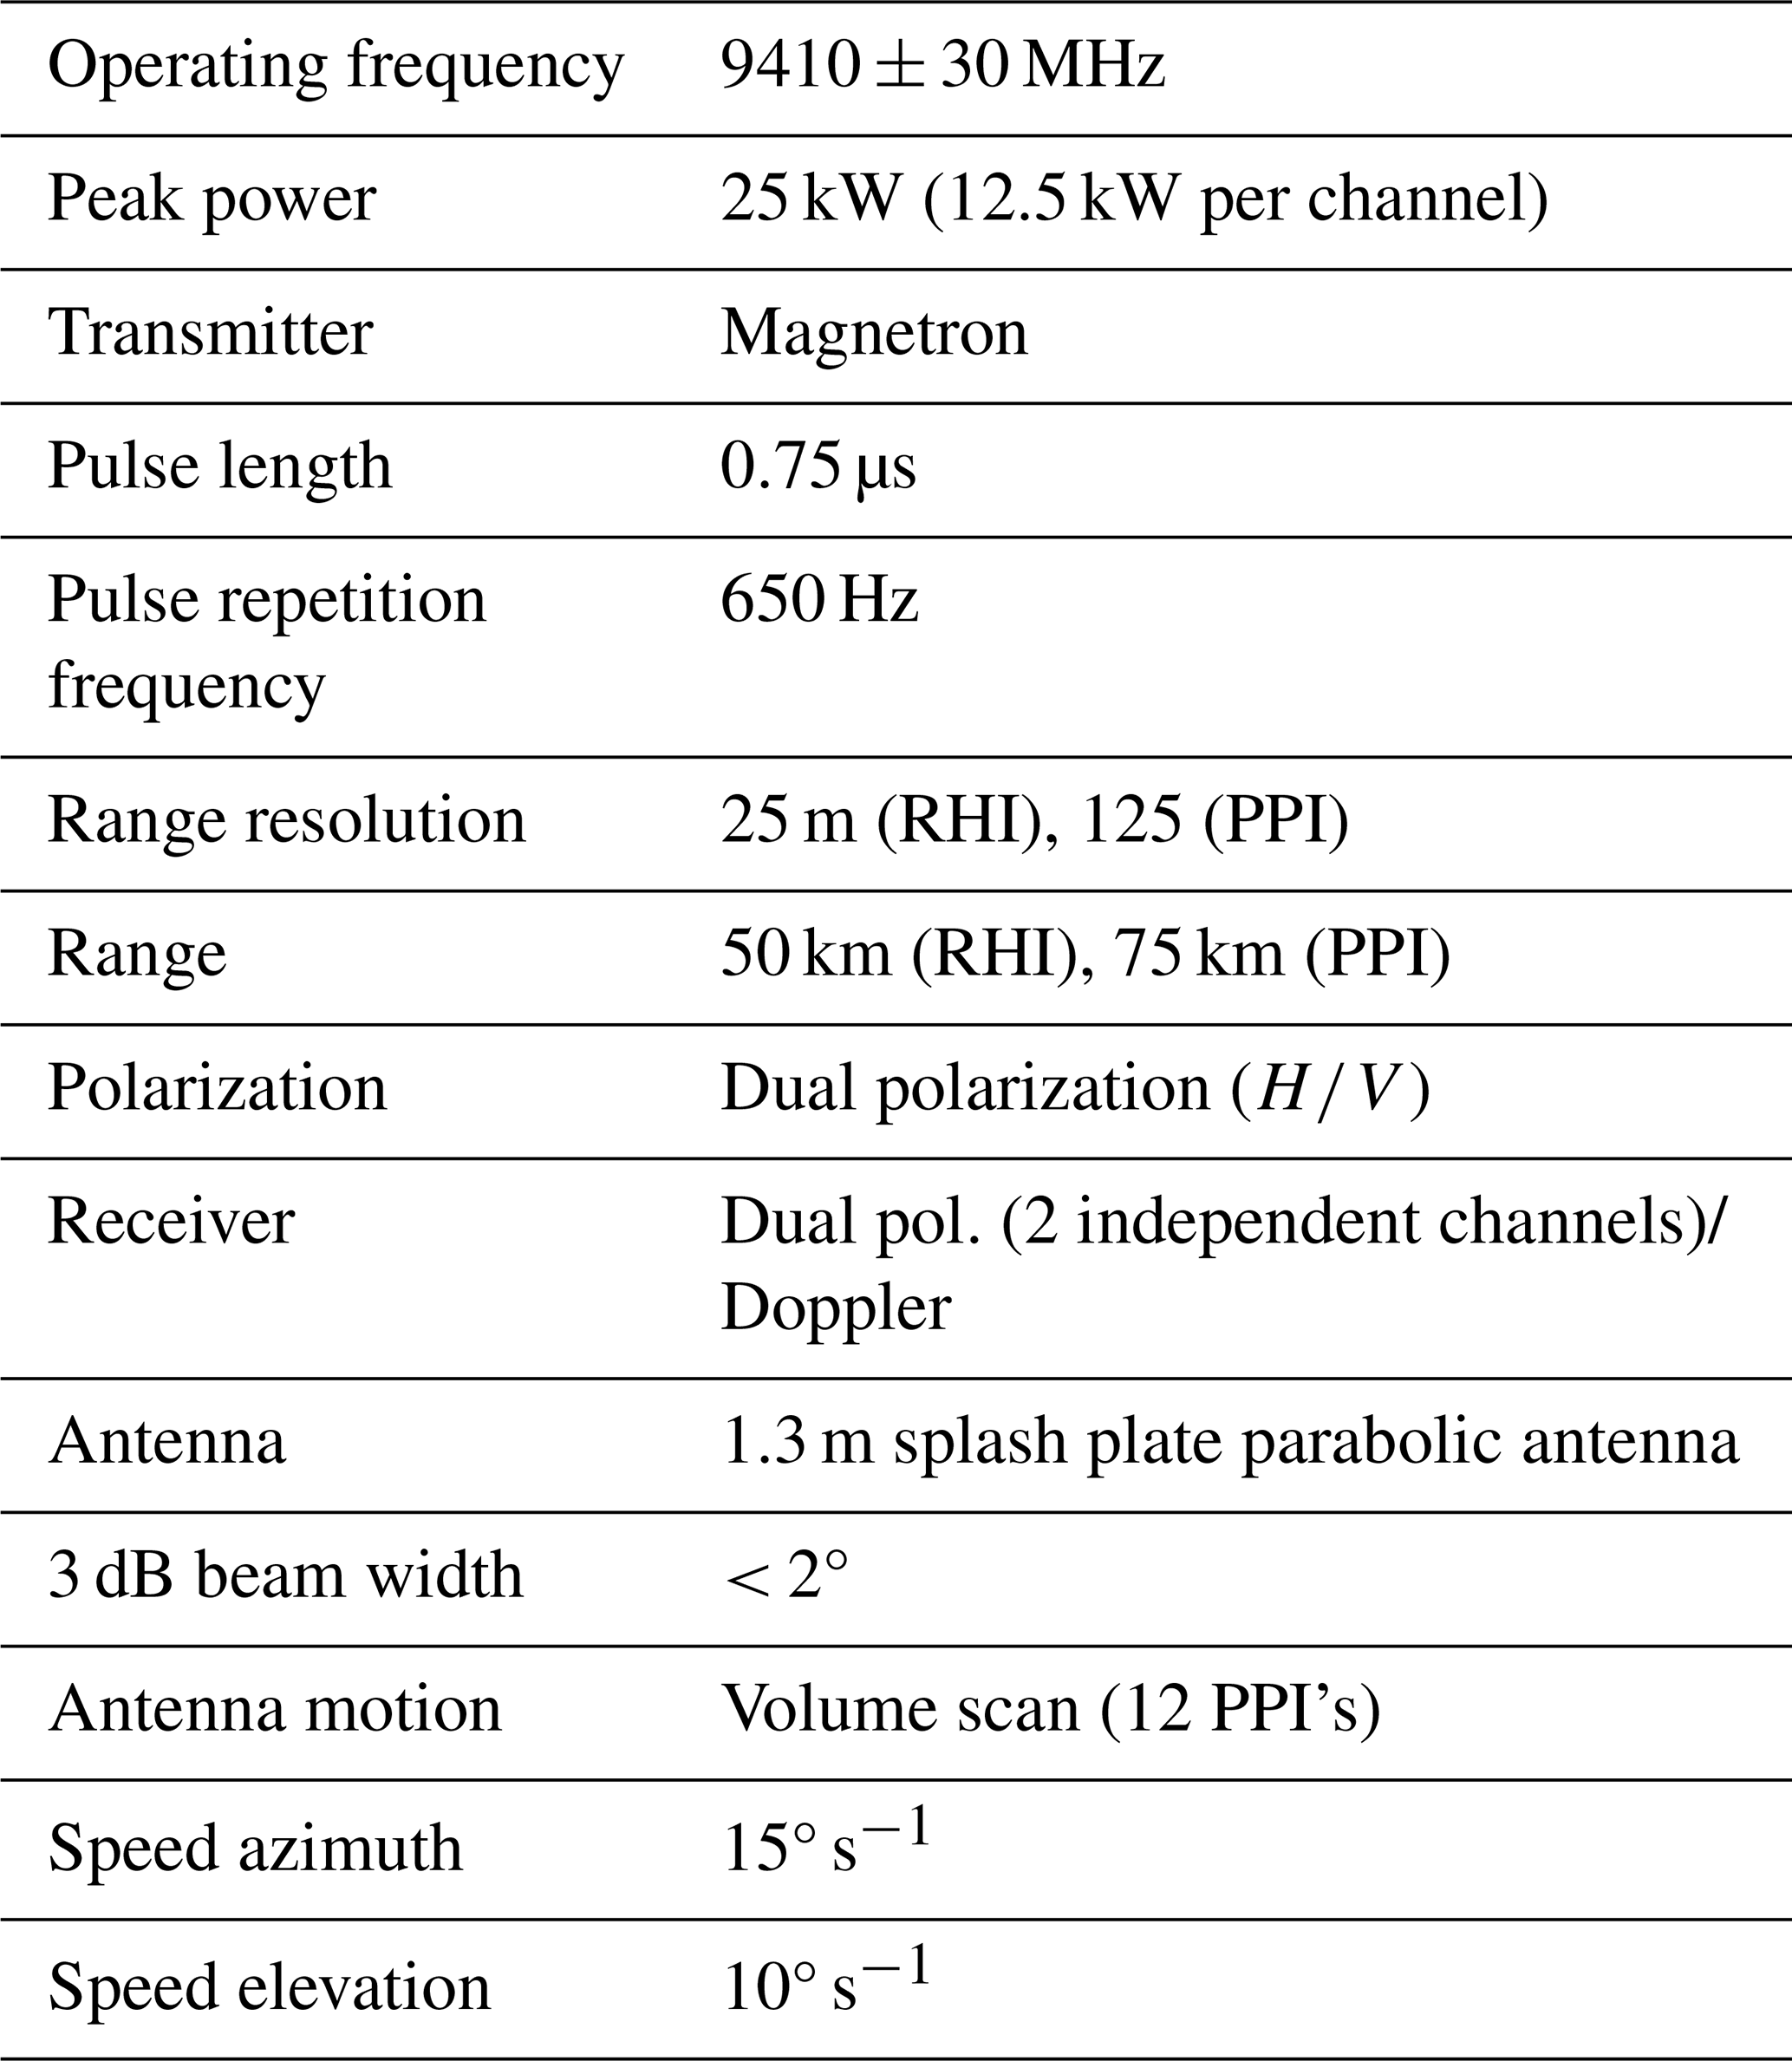
The radar was located in Saint-Joseph in the south of Reunion Island (Fig. 1b and c), at 20 m above sea level, with a maximum range set at 75 km. The radar performed 360-degree azimuthal scans along 12 constant elevation angles at 1.0, 2.2, 3.3, 4.4, 7, 9, 11, 15, 19, 21, 25, and 29°, with a range gate resolution of 125 m. The complete set of scans was repeated at 10 min intervals. Table 1 lists the main characteristics of the radar.
Table 1Characteristics of the ESPOIRS radar and radar configuration during the TC Batsirai.
Six rain gauges were chosen to validate the radar data (Fig. 1b and c), because they were located within the radar's field of view and provided continuous data recordings. The closest (i.e., lowest elevation) unobstructed radar beam to each rain gauge was selected to compare the rain gauge measurements with the corresponding radar estimate (Fig. 2).
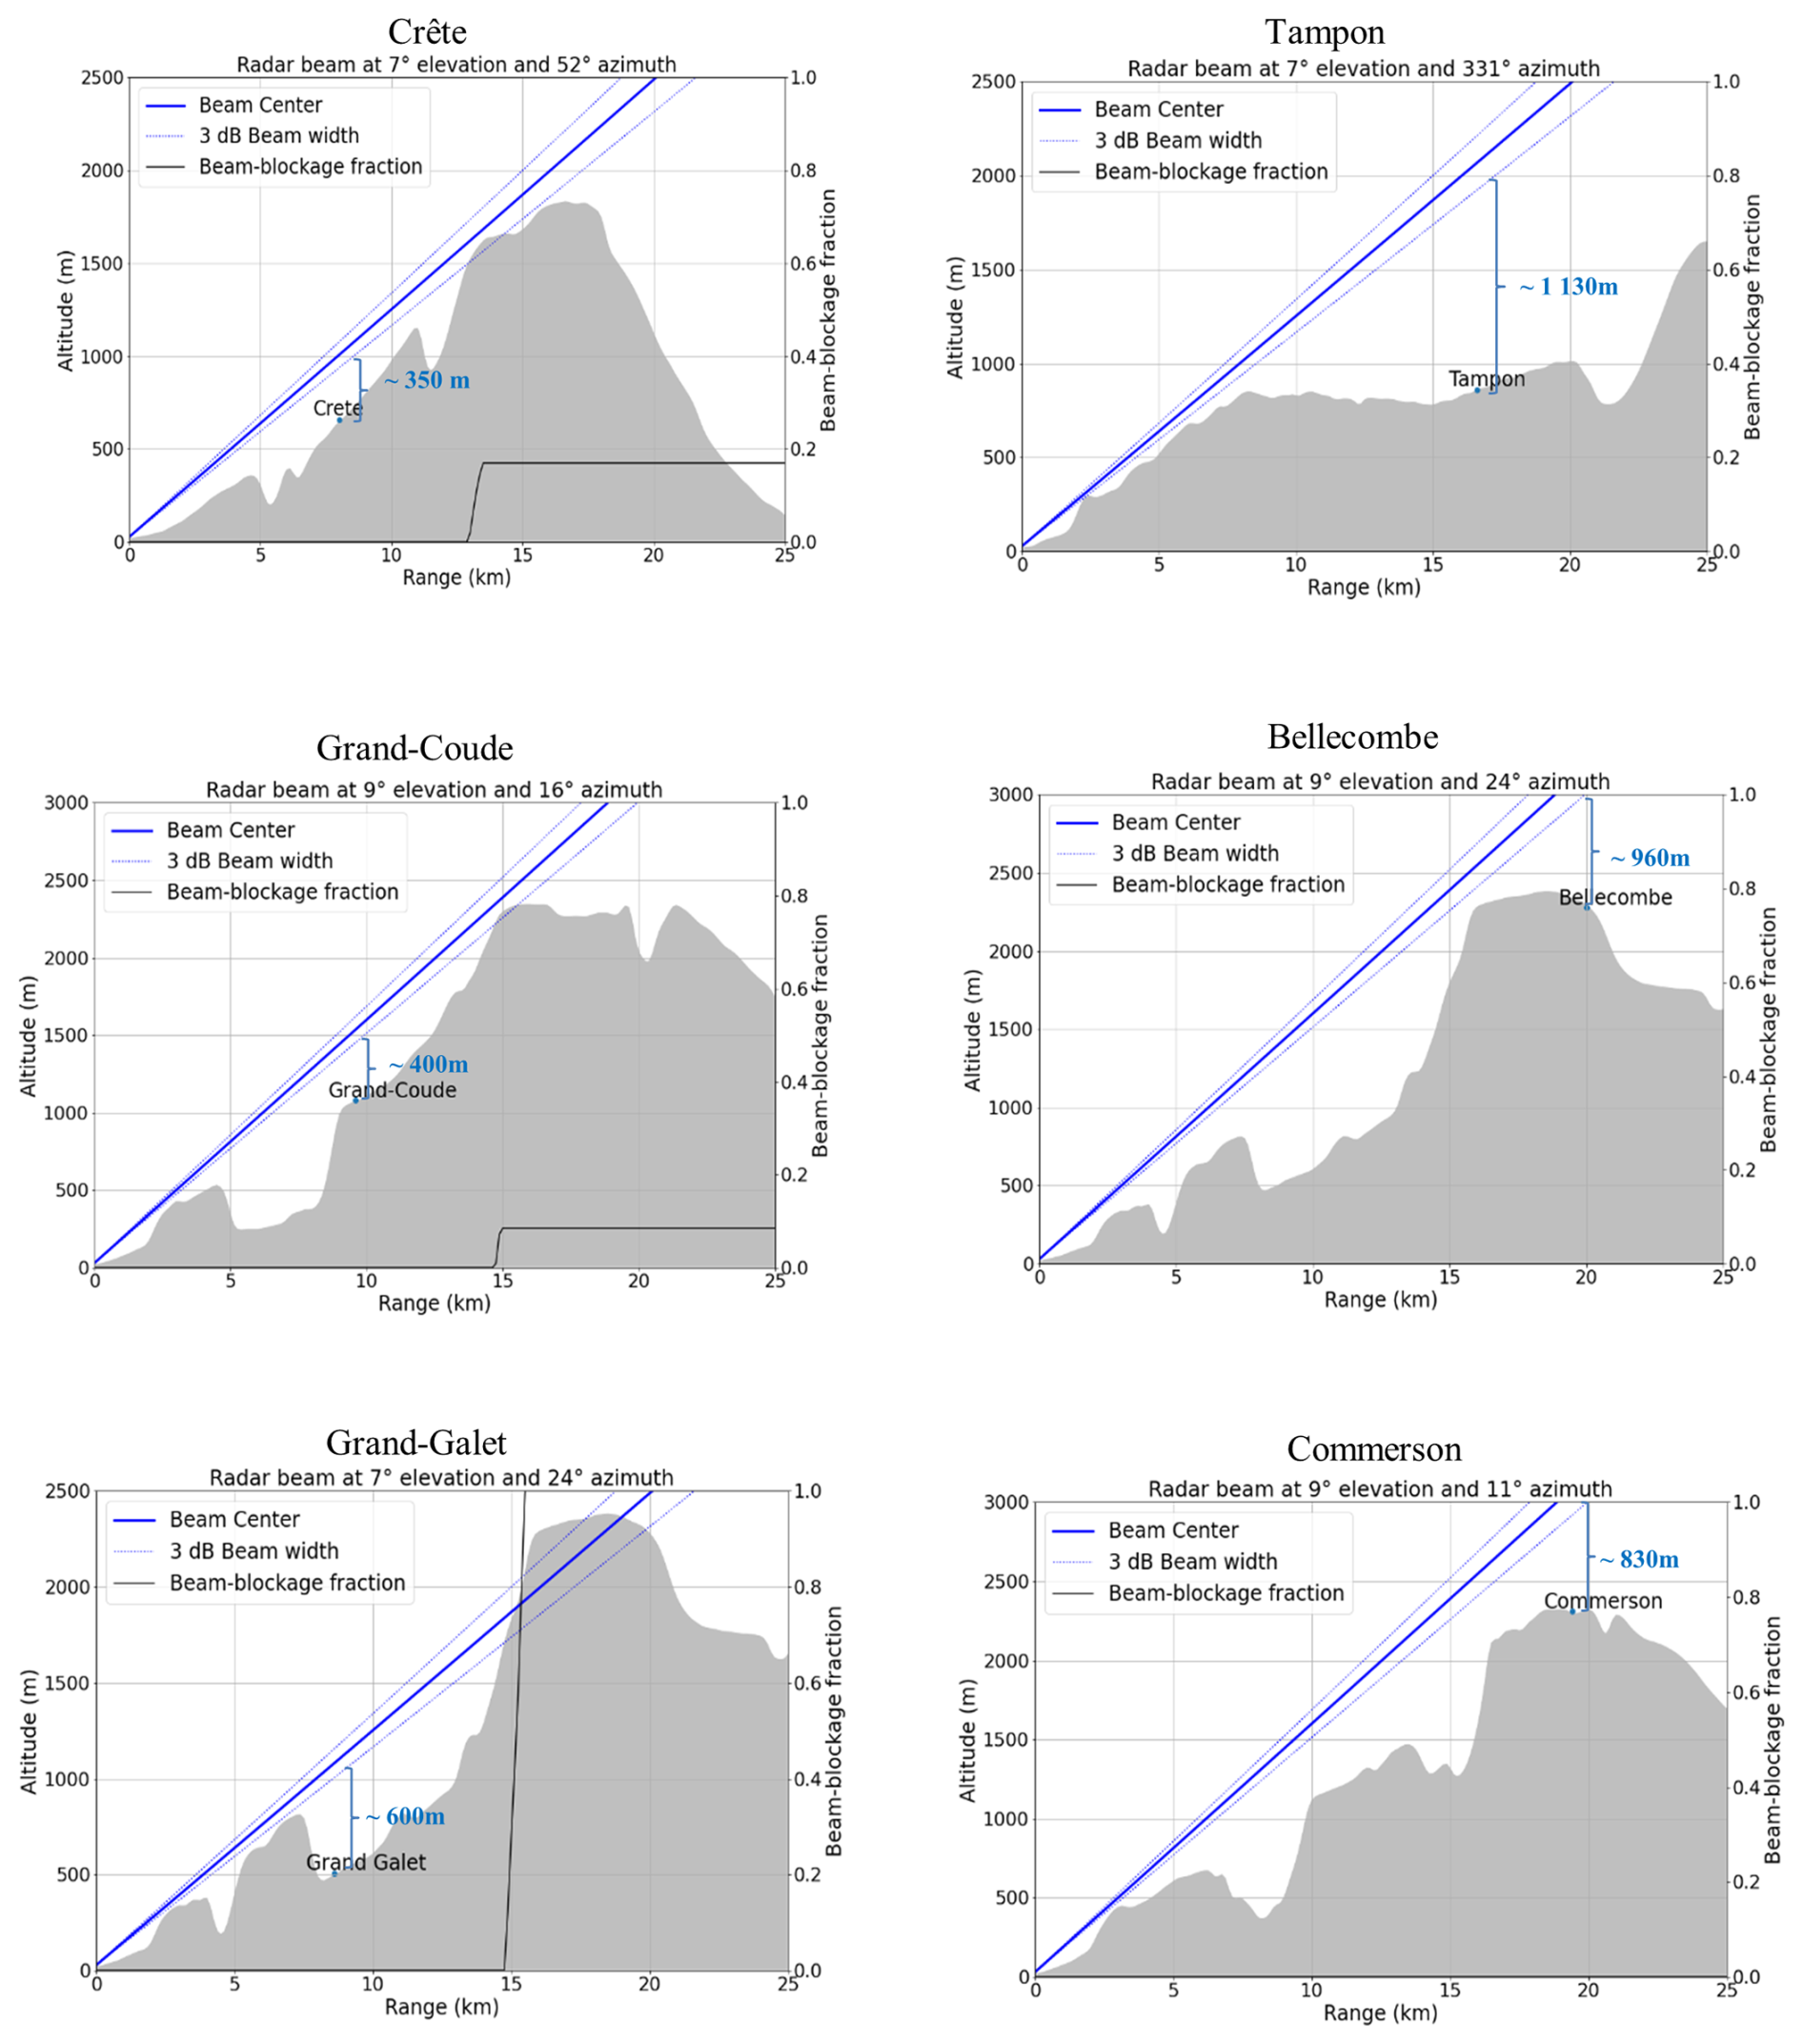
Figure 2 below presents the characteristics of the selected rain gauges based on their location with respect to the radar location and the selected radar beams, revealing two distinct groups of rain gauges:
-
Group 1: rain gauges located within 15 km of the radar with a vertical distance between the radar beam and rain gauge of less than or equal to 600 m, including Crete, Grand-Coude, and Grand-Galet.
-
Group 2: rain gauges located at distances greater than 15 km from the radar, with a vertical distance exceeding 800 m between the radar beam and rain gauge, including Tampon, Commerson, and Bellecombe.
2.2 Radar data processing
The processing applied to radar data is detailed in this section and summarized in Fig. 3.
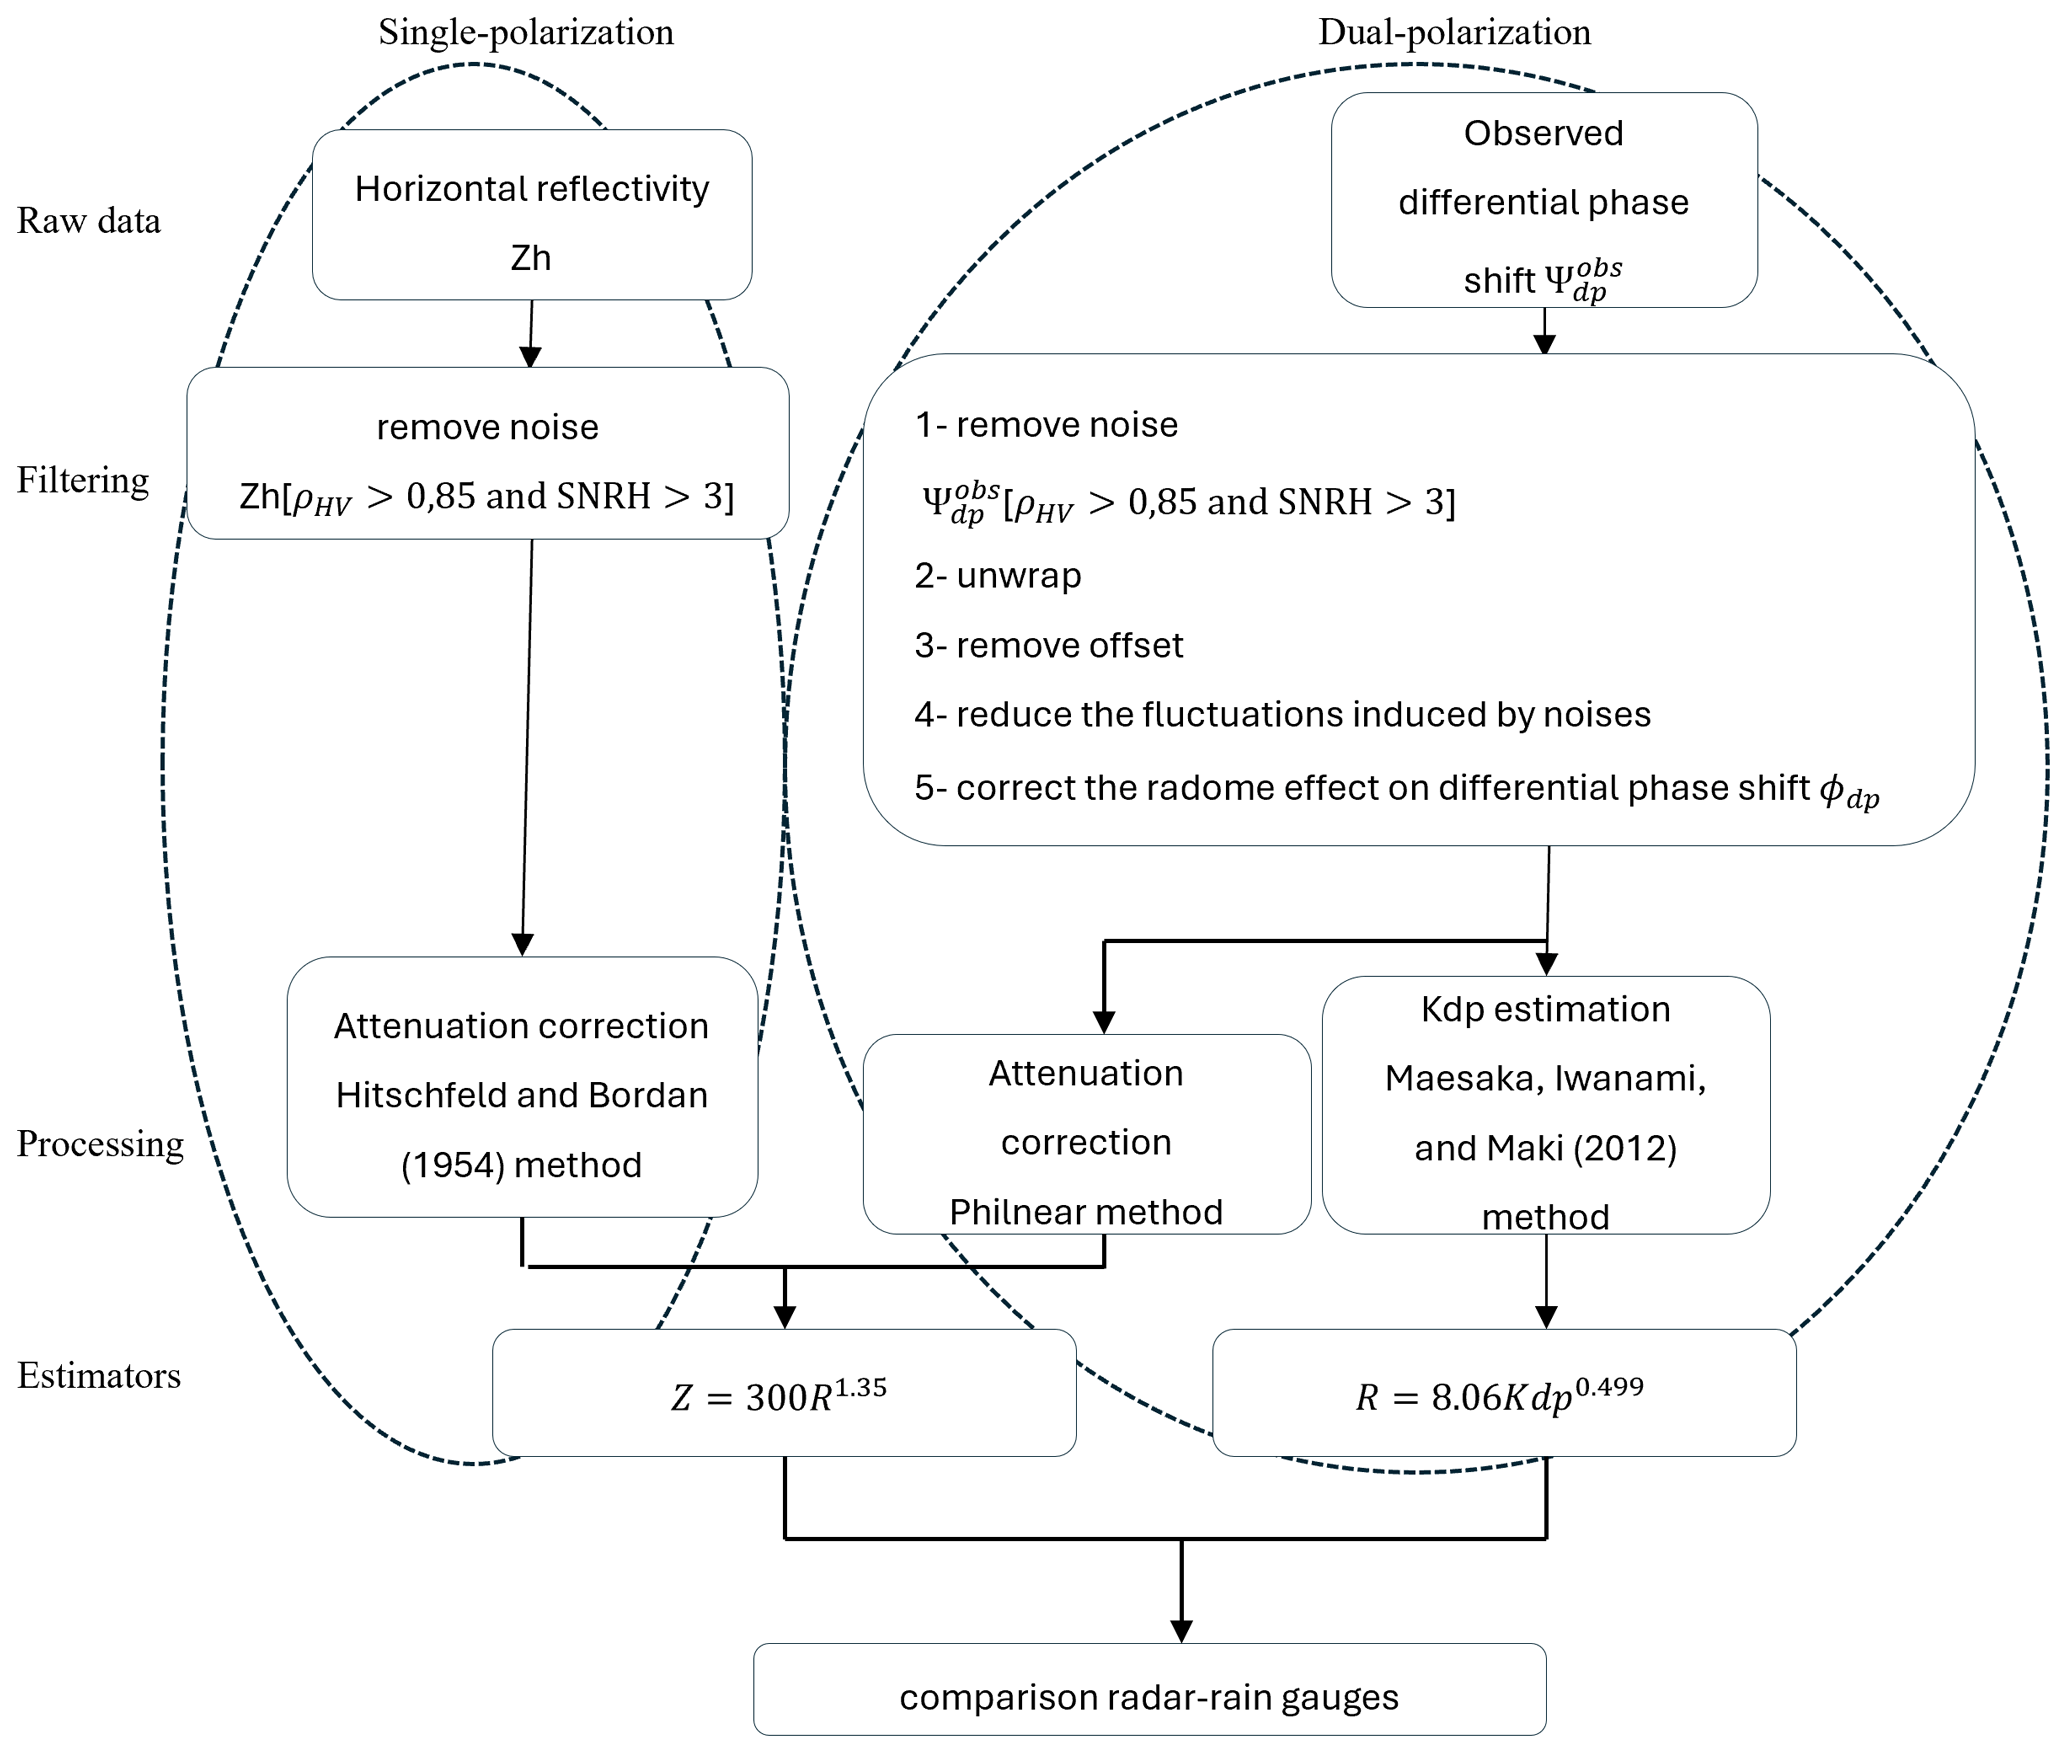
In the first processing step, all non-meteorological signals were removed using two filters. The first filter consists of keeping signals with copolar correlation coefficient ρHV values greater than 0.85. This simple but efficient tool for data quality control is an easy way to remove non-meteorological echoes, since in most precipitation regions, ρHV values typically exceed 0.8 (Rauber and Nesbitt, 2018). The second filter involves using a horizontal signal-to-noise ratio (SNRH) greater than 3, a threshold value recommended by our radar manufacturer “Gamic” to suppress noisy data; higher values indicate better data quality.
In the second processing step, the attenuation of reflectivity Z was corrected by employing one of two algorithms: (1) an algorithm based on single polarization proposed by Hitschfeld and Bordan (1954), with the advantage of its ease of implementation as detailed in Sect. 2.2.1; and (2) an algorithm based on dual polarization, known as the philinear method, which uses the differential phase ϕdp and requires pre-processing, as detailed in Sect. 2.2.2 below. The respective performances of these two algorithms were compared with rain gauge measurements using the Z–R relationship, (Koffi et al., 2014) used by Météo France for Réunion Island. This relation is derived from tropical cyclones observations (Jorgenses and Wills, 1981), with Z corrected for attenuation. An additional estimator was used to derive the radar QPE: R=8.06kdp0.49, calculated from our radar observations and detailed in Sect. 2.2.3 below.
In addition to R(Z) and R(kdp), many studies have demonstrated the effectiveness of multi-parameter polarimetric rain rate estimators, such as R(KDP,ZDR) or (e.g., Matrosov et al., 2002; Illingworth, 2005; Figueras I Ventura et al., 2012; Koffi et al., 2014; Li et al., 2023). However, estimators involving ZDR require accurate calibration of the radar system. Two main sources of bias can significantly affect ZDR:
- i.
the transmission and reception chains, especially uncertainties in the relative attenuation or gain between the two polarimetric channels, and
- ii.
near-radome effects and the radome itself (Sugier and Tabary, 2006; Thiruvengadam et al., 2025).
Even a small bias of 0.2 dB in ZDR can lead to an overestimation/underestimation of rainfall by about 15 % (Figueras I Ventura et al., 2012; Zeyong et al., 2019), making the reliability of such estimators highly dependent on calibration quality.
Calibration methods exist in the literature, including approach based on the intrinsic properties of meteorological targets observed at high elevation angles (near 90° in PPI mode), where ZDR values close to 0 dB are expected (Gorgucci et al., 1999). However, such high-elevation PPI scans were not available during the first campaign in La Réunion, as the system was still in a testbed phase.
Given these constraints and to avoid potential errors associated with poorly calibrated ZDR. This study relied exclusively on R(Z) and R(kdp) estimators. Nevertheless, this choice is further supported by previous studies showing that R(Z) performs better in light to moderate rainfall, while R(kdp) is more robust in heavy rainfall conditions (Koffi et al., 2014).
In this study, we also explored the influence of precipitation type on the radar QPE. Two classes of precipitation were therefore defined: the first relates specifically to stratiform precipitation, while the second includes all precipitation occurring during the study period by combining convective and stratiform precipitation.
According to the literature (Fabry and Zawadzki, 1995; Matrosov, 2021), stratiform rain is associated with the bright band. In tropical regions, stratiform rain often originates from old convective cells (Houze, 1997). The turbulence and vertical motion of convective rain inhibit the formation of a bright band (Ghada et al., 2022), which thus becomes a marker of stratiform rain. In our precipitation classification methodology, the identification of stratiform rain is based on the detection of the bright band in the maxdisplay plots. Maxdisplay shows the maximum value of the radar reflectivity along the vertical column.
The bright band can be recognized by a circular region with elevated reflectivity values, observed prominently in both the maximum reflectivity values around the radar and the maximum vertical cross-sections of the maxdisplay plots. Its presence signifies the occurrence of stratiform precipitation during the corresponding time step. As the bright band occurs only during the early morning of 3 February, the identification of stratiform precipitation was performed manually.
The agreement between radar-based QPE and rain gauge measurements was evaluated using the normalized bias (NB) and correlation coefficient (corr).
where R and G represent hourly rainfall observed by the radar and rain gauge, respectively, while and denote the average.
2.2.1 Attenuation correction based on the single-polarization algorithm: Hitschfeld and Bordan (1954) method
To correct the attenuation of reflectivity (Z) due to precipitation, the Hitschfeld and Bordan (1954) method (HB method) was one of the first to pioneer forward gate-by-gate procedures for attenuation correction. They used an empirical relationship between specific attenuation A [dB km−1] and reflectivity Z [mm6 m−3], represented as: where c = 0.000149 and d = 0.757 at X-band radar (Berne and Uijlenhoet, 2006). Additional information on the values of c and d is provided in Appendix B. To correct the power loss of signals received at the ith range location, they used reflectivity measurements at the previous (i−1)th range locations by accumulating the specific attenuation A of each gate. This accumulation is referred to as Path-Integrated Attenuation (PIA). PIAi in gate i is expressed as follows:
where Δr represents the gate length, N is the number of the gate.
Corrected reflectivity Zcorr,i (dB) in any range gate i is obtained by adding the corresponding PIA to the uncorrected reflectivity:
2.2.2 Attenuation correction based on polarimetric method: Philinear method
In this approach, PIA is estimated using the differential propagation phase shift ϕDP (Eq. 5). Bringi et al. (1990) demonstrated that the attenuation experienced by propagating electromagnetic waves is directly proportional to the differential propagation phase, serving as the fundamental physical principle behind attenuation correction in dual-polarization radar.
Equation (5) is a simple method, commonly used in operational radars such as Météo-France (Figueras i Ventura et al., 2012).
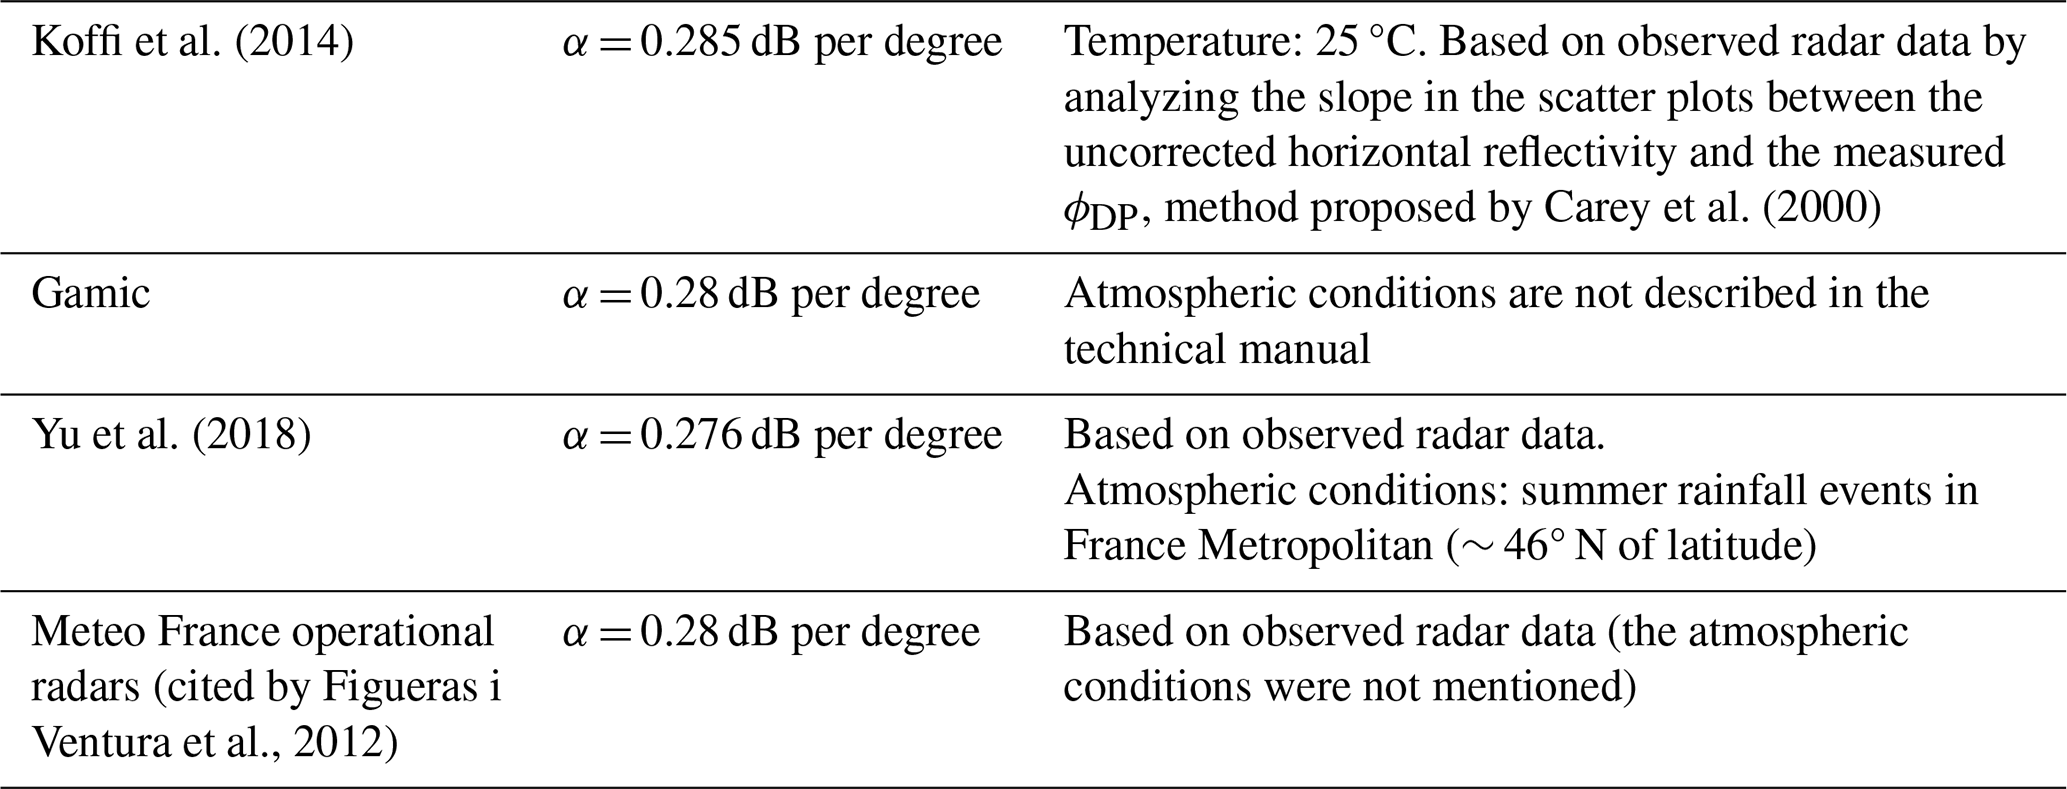
ϕDP is immune to attenuation as long as the return power is above the noise power (Bringi and Chandrasekar, 2001) and is unaffected by radar calibration (Bringi et al., 1990). According to Park et al. (2005), α in Eq. (5) depends on the air temperature and drop shape. However, for radar frequencies above 9 GHz, temperature does not heavily affect attenuation, so ignoring the temperature effects leads to only a minor increase in the error (Jameson, 1992). In the tropical region of West Africa, α=0.285 dB per degree, a value calculated from observed radar data (Koffi et al., 2014). Météo France's operational setup uses α=0.28 dB per degree, while our radar manufacturer Gamic applies the same coefficient to the X-band radar. Additionally, Yu et al. (2018) found α=0.276 dB per degree, provides the best fit to minimize the bias in Z as a function of ϕDP Therefore, in this study, we set α=0.28 dB per degree. Table 2 illustrates the atmospheric conditions under which the cited α values were derived.
Differential phase shift ϕdp pre-processing
The radar does not directly measure ϕDP; instead, it measures the total differential phase shift expressed as:
Where term 1 corresponds to the differential phase shift, term 2 to the backscattering copolar differential phase due to Mie scattering, term 3 to the system differential phase offset, and term 4 to the standard deviation of the observation caused by the system fluctuation errors. In addition, factors such as partial beam blockage due to orographic effects can contribute to the existing uncertainty of the differential phase shift (Figueras i Ventura et al., 2012).
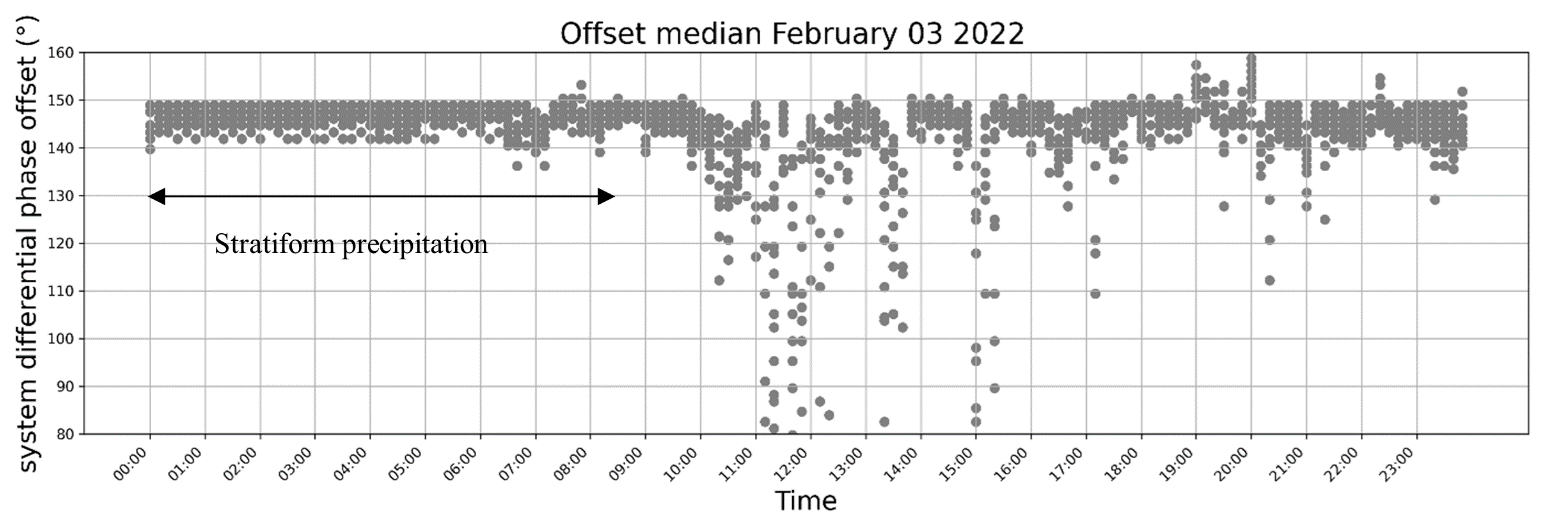
Figure 4Median of system differential phase offset for each scan and timestep on 3 February 2022 the period when the TC was close to Reunion Island (∼ 190 km from the north coast). During this period two types of precipitation were identified, stratiform precipitation from 00:00 to 08:40 UTC then the precipitation became heavy and characterized by convective rain.
Equation (6) reveals that the observed exhibits several perturbation factors that necessitate pre-processing to estimate ϕdp according to the five steps below:
-
Noise in impacts the accuracy of the estimated ϕdp. To address this issue, an additional filter was applied as follows. Initially, data are centred around 0 by removing the median of the data for the scan.
Then, gradients are computed in both directions (azimuth and radius) to identify and eliminate data with high gradient values in both directions, as a high gradient value around a data point indicates noise. Finally, isolated pixels are removed from the dataset. For details, this filter removes abnormally noises from ϕdp measurements. First the differential phase shift is normalized to [−180°, 180°] to avoid phase-wrapping artifacts. Then, Horizontal (range) and vertical (azimuth) gradients are computed,and pixels with gradients exceeding five times the standard deviation of the gradient field are flagged (so called strong gradient). A spatial consistency check is then applied: pixels are removed only if they and at least two neighboring pixels (left, right, above and below) all show strong gradients. This approach eliminates noise clusters.
-
can also experience folding in the event of heavy precipitation and appears when the phase shift exceeds 360° between the two measured polarizations (Rauber and Nesbitt, 2018). Moreover, the system differential phase offset contributes to this folding, leading to an increase in . In our dataset, this folding mostly occurred as the TC approached Reunion Island.
-
The differential phase system offset is calculated and removed. In theory, ϕdp should start at 0° and increase with precipitation. To estimate , the first precipitation from the radar is determined. Our radar manufacturer Gamic proposed an algorithm to determine , which requires data with rain in the vicinity of the radar. This involves finding segments of precipitation close to the radar along each radius and calculating the median of for each segment, corresponding to the first non-noisy values of ϕdp in a ray. This process is iterated for each file to ensure a consistent offset value for all the data. In other words, the final value of is a single median value of from several files. It is supposed to be constant regardless of the precipitation type, although it may vary between different sites (Frech, 2013). Figure 4 shows the offset values for each dataset and for each scan. The aim is to illustrate whether changes depending on the situation.
Figure 4 illustrates that can vary with time. This variation related to the type of precipitation. For instance, in the early morning until 08:40 UTC, the bright band was visible, indicating the presence of stratiform precipitation. During this period, the offset value remained relatively stable. However, after 08:40 UTC, the bright band disappeared, with the precipitation becoming heavier with strong convective cells, resulting in variations in the offset value. Therefore, taking a single value of for all the different cases can lead to errors in the attenuation correction. Figueras i Ventura et al. (2012) pointed out that errors in can lead to under- or overestimations of PIA, thus requiring a correction of the system's differential phase on a ray-by-ray basis. We thus tested a ray-by-ray method to improve the estimation using Py-ART, an open-source library (Helmus and Collis, 2016). Figure 5 shows the corresponding ray-by-ray dependency, calculated from volume scans (PPIs) collected between 1 and 4 February 2022. An example of PPI illustrating the azimuthal dependence of is provided in Appendix C.
The large box plot shown in Fig. 5 indicates high variability in the offset values, highlighting that using a single offset for all volume is not appropriate.
-
To attenuate the fluctuations of caused by noises and a significant δco (Carey et al., 2000) associated with drop diameters above 2.5 mm for the X-band radar (Trömel et al., 2013), the data were smoothed using a double-window smoothing technique available from the Py-ART library.
-
After these processes (noises suppression, phase unwrapping, and removal of the differential phase system offset), an additional issue was identified: a persistent spurious signal along specific rays in ϕdp. This anomaly is alleged to arise from the four radome joints (Figueras i Ventura et al., 2012). To mitigate this anomaly, we implemented the method developed by Thiruvengadam et al. (2025). They use an algorithm based on the Discrete Fourier Transform to address the spatial variability bias observed in differential phase measurement. They revealed that the metallic threads connecting the radome panels introduce these biases.
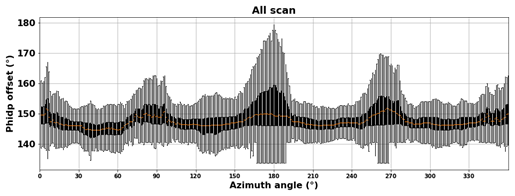
Figure 5Boxplot of the system offset for all PPI volumes during the study period (1–4 February 2022), illustrating the azimuthal dependence of the offset. The orange line indicates the median, the black box spans the first (Q1) and third (Q3) quartiles, and the grey whiskers extend from Q1 − 1.5 × IQR to Q3 + 1.5 × IQR, where IQR = Q3 − Q1.
Finally, Fig. 6 illustrates an example of the estimated differential phase ϕdp (black) from the total differential phase shift (blue).
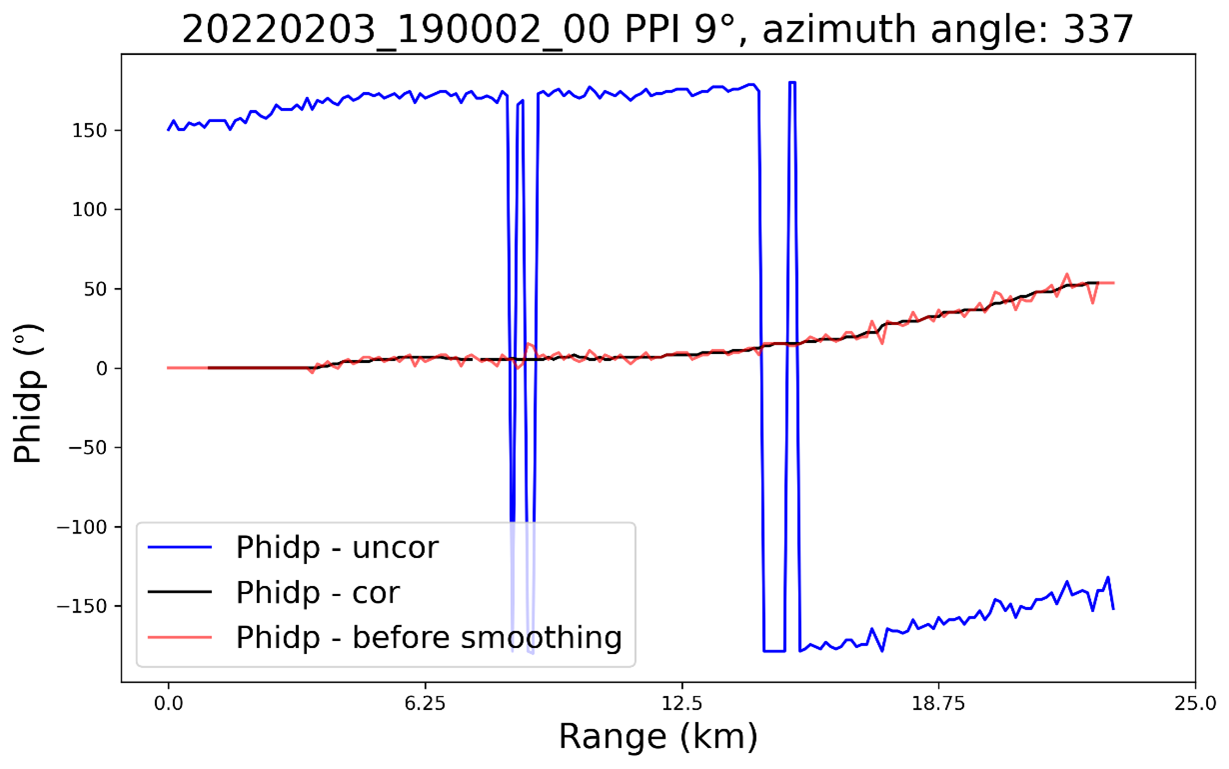
Figure 6Raw or total differential phase (blue), corrected differential phase ϕdp (black) and differential phase ϕdp before smoothing (red), the “x” in the figure indicates the azimuth where the differential phase system offset is located (meeting the criteria described in Sect. 2.2.2) – data from PPI 9° scan, azimuth angle 337 on 3 February 2022 at 19:00 UTC (Appendix C: example of a PPI showing differential phase before and after correction).
2.2.3 kdp and R(kdp) estimation
The specific differential phase kdp is not directly measured by radar; instead, it is derived from ϕdp. The literature details numerous methods for calculating kdp such as Vulpiani et al. (2012), Maesaka et al. (2012), Giangrande et al. (2013), and Schneebeli et al. (2014) methods, with each method having strengths and weaknesses. Users should therefore choose the method best suited to their data (Reimel and Kumjian, 2021). In this study, we used the Maesaka et al. (2012) method, which estimates non-negative kdp and manages significant kdp fluctuations in the case of weak rainfall, especially during stratiform precipitation.
After calculating kdp, the aim is to use it to estimate precipitation based on the relationship , where both a and b are specific and depend on radar wavelength. Since these coefficients have not yet been determined for the SWIO region, especially for Tropical Cyclone cases, this study derives a and b from radar observations collected between 1 and 4 February 2022, following the procedure described below.
Rain-gauge data have a temporal resolution of 6 min, whereas radar kdp estimates are available every 10 min. To ensure a consistent comparison, both datasets were aggregated to a common 30 min temporal resolution. A 30 min interval was retained only when valid measurements were available for both rainfall and kdp.
Because kdp values close to zero may correspond either to light precipitation or to unreliable estimates, only strictly positive kdp values were considered. Any interval containing missing or non-positive kdp values was discarded. After applying these filters and separating the data into training and test sets, only 82 samples met the quality criteria and were included in the analysis. Although the sample size is limited, a least-squares fitting approach was applied, yielding the relationship , as shown in Fig. 7.
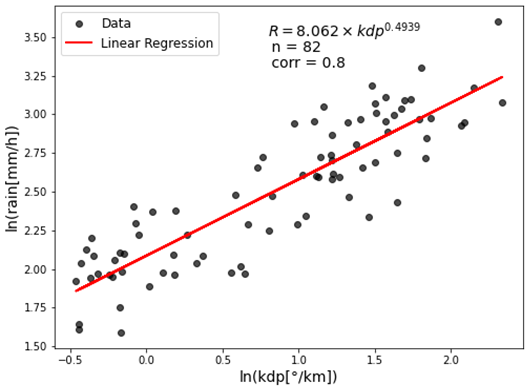
Ryzhkov and Zrnic (2019) reported that for X-band radar the coefficient “a” typically ranges from 14 to 20 and the exponent “b” from 0.73 to 0.85. The coefficients derived in the present study fall outside these ranges. This discrepancy can be explained by the distinct drop size distribution (DSD) characteristics of tropical cyclones compared to climatological rainfall. With ten years of DSD data from a ground-based optical disdrometer, Unuma et al. (2025) demonstrated that the coefficients of R(kdp) relationships are highly sensitive to DSD characteristics, and R(kdp) coefficients vary significantly by precipitation regime. However, they estimated the R(kdp) coefficients for C-band radar, which differ from those for X-band radar.
For tropical cyclone DSD, Tokay et al. (2008) revealed that tropical cyclone precipitation is characterized by: (i) high concentrations of small to midsize raindrops; (ii) relatively few large raindrops, which rarely exceed 4 mm in diameter; and (iii) elevated drop number concentrations for a given reflectivity.
The specific differential phase kdp is strongly influenced by both raindrop size and number concentration (Timothy et al., 1999). In particular, higher drop concentrations lead to larger kdp values for a given rainfall rate.
Accordingly, the R(kdp) relationship obtained in this study can be interpreted as follows. The lower coefficient “a” (8.062 compared to 14–20) reflects higher drop concentrations producing larger kdp values during tropical cyclone conditions. The lower exponent “b” (0.49 compared to 0.73–0.85) indicates a weaker power-law dependence, suggesting reduced sensitivity of rainfall rate to changes in kdp, which may be associated with the more uniform DSD characteristics of tropical cyclone precipitation.
Unfortunately, in Southern Reunion, no representative disdrometer measurements are available within our study area, hence, only rain gauges data are available for use.
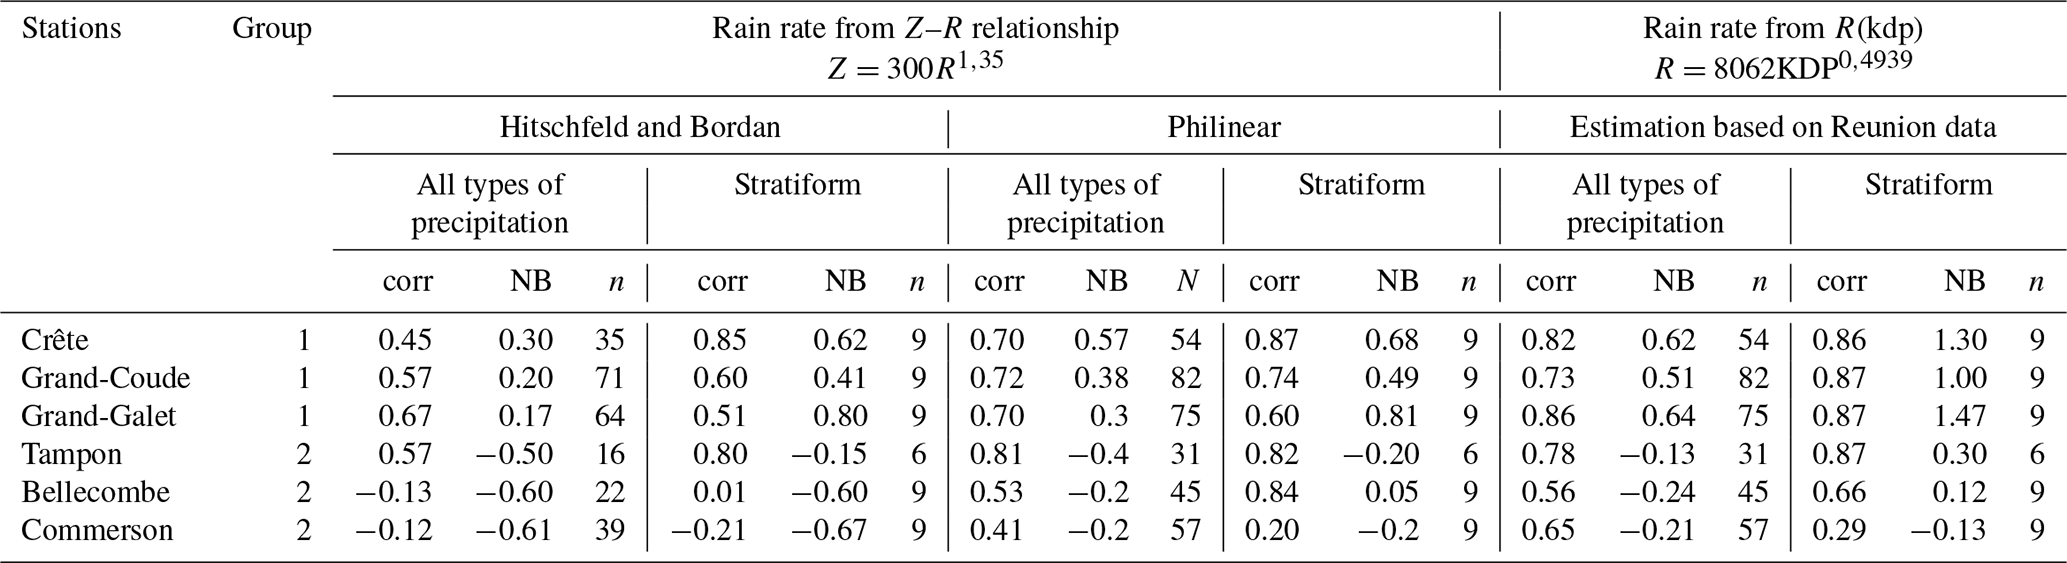
Table 3 presents the hourly comparison between rain gauge and radar derived precipitation. It also shows the correlation coefficient (corr) between the rain gauges and radar precipitation estimates, as well as the NB for each rain gauge location, each precipitation type, and each precipitation estimator R(Z) and R(kdp); n denotes the number of samples.
Table 3Global scores for radar quantitative precipitation estimation: hourly rain rate comparison.
The R(Z) relationship used in this study is based on the formulation for tropical cyclones established by Jorgensen and Willis (1982) and is currently applied operationally by weather radars in Réunion Island. Consequently, the relationship Z=300R1.35 was directly applied to our dataset.
In contrast, the R(kdp) relationship depends on the radar wavelength (X-band radar is new in Reunion Island) and on the precipitation regime, which is influenced by the drop size distribution (DSD), as discussed in Sect. 2.2.3. Tropical cyclones represent a specific DSDs that differ from climatological datasets (Tokay et al., 2008). For these reasons, the R(kdp) coefficients were derived directly from the present dataset. Further details are provided in Sect. 2.2.3.
Additionally, Fig. 8 provides an overall visualization of the radar QPE results. Subsequently, Sect. 3.1 and 3.2 present the overall results for the R(Z) and R(kdp) estimators. Section 3.3 further discusses the influence of precipitation type and orography on the radar QPE.
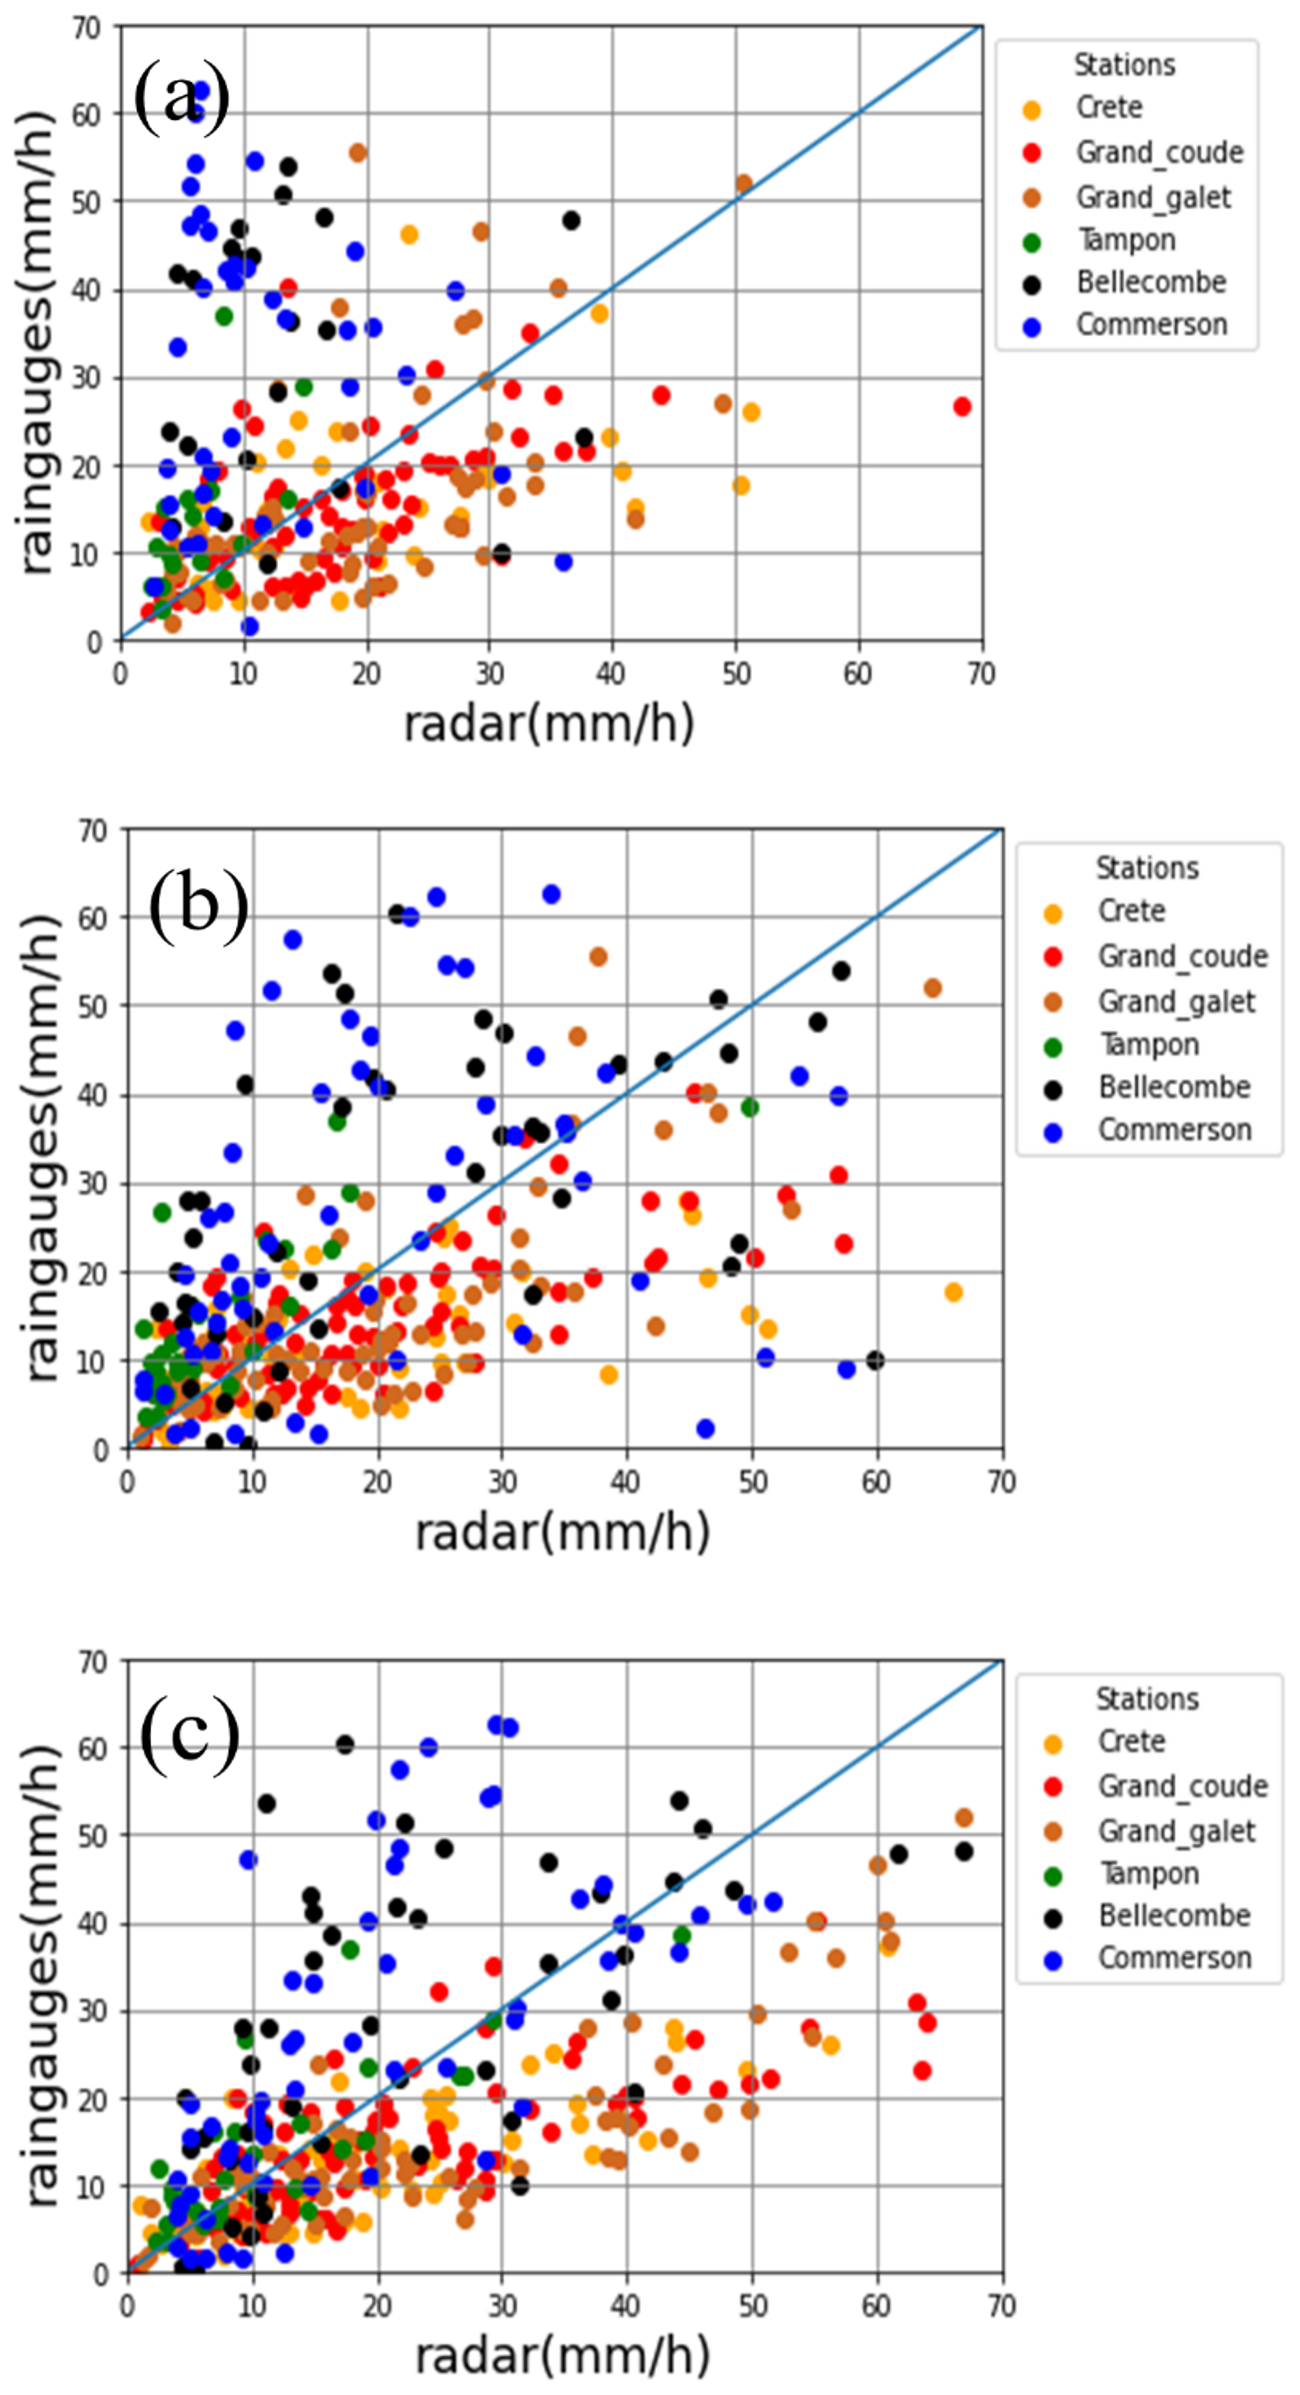
Figure 8Radar quantitative precipitation estimation using (a) R(Z) estimator and Hitschfeld and Bordan attenuation correction; (b) R(Z) estimator and philinear attenuation correction; (c) R(kdp) estimator.
3.1 R(Z) estimator
In this section, the interpretation focuses solely on the “all precipitation” types mentioned in Table 3, as the sample “n” is sufficiently large.
According to Table 3, for all stations, the HB method showed a lower correlation coefficient than the philinear method, particularly for stations located more than 19 km from the radar, such as Bellecombe and Commerson (group 2). At these distant stations, the HB method exhibited correlation coefficient close to zero, suggesting the absence of link between the radar rainfall estimates and rain gauge measurements.
The NB reveals that for the rain gauges located less than 15 km from the radar (group 1) such as Crete, Grand-Coude and Grand-Galet, both methods (HB and philinear) exhibit a positive NB, indicating a slight overestimation by the radar. Conversely, for stations located further from the radar (group 2) such as Tampon, Bellecombe, and Commerson, the NB is negative, indicating the radar's underestimation of precipitation. This underestimation is more pronounced for the HB method compared to the philinear method. For instance, for Commerson, the NB is −0.6 with the HB method and becomes −0.2 with the philinear method.
To summarize, the results show that the philinear method improves attenuation correction compared to the HB method. This improvement is due to the fact that the HB method relies solely on reflectivity as the algorithm input. Reflectivity is sensitive to attenuation, radar calibration errors, and the presence of non-rain scatter. Hitschfeld and Bordan (1954) emphasized that even a minor error in the radar calibration could result in significant inaccuracy in the rain rate measurements, particularly at 3 cm wavelength. These limitations negatively impact the rainfall estimation (Jacobi and Heistermann, 2016). However, the use of the differential propagation phase shift directly related to path-integrated attenuation (PIA) as in the method helps to overcome these uncertainties (Zrnić and Ryzhkov, 1996), as ϕdp is immune to partial beam blockage, radar calibration, and ground clutter.
However, attenuation is not the only factor influencing rainfall estimates derived from the Z–R relationship. The Z–R relation used in this study, adopted from Jorgenses and Wills (1981), was originally derived from hurricane observations and is implicitly representative of both stratiform and convective rainfall regimes, typical of tropical cyclones rain (Houze, 1977). Nevertheless, under tropical cyclone conditions ( in the outer rainbands in this case), rainfall is often characterized by high concentrations of small-to-medium drops and relatively fewer large drops (Wu et al., 2021; Radhakrishna, 2022). Deviations from the drop size distributions (DSDs) underlying the Z–R relationship of Jorgenses and Wills (1981) can therefore lead to biased rainfall estimates.
Jorgensen and Willis (1982) themselves highlighted limitations of this relationship, noting that it exhibits less scatter near the surface than at higher altitudes (around 1500 m). At higher altitudes, their measurements are above the cloud base, where a larger number of small droplets get transported through updrafts. This process introduces larger variability in the Z–R relationship.
Our results are in line with their findings. At low-altitude stations (Group 1), the Z–R relationship performs better, as the observed DSDs are closer to the climatological assumptions embedded in the Z=300R1.35 formulation. In contrast, performance degrades at high-altitude stations (Group 2; Bellecombe and Commerson), where two main mechanisms may explain this discrepancy:
-
First, these stations are located on mountain peaks and are therefore strongly influenced by orographic precipitation processes. Singh et al. (2024) have demonstrated that in both orographic and convective rainfall, microphysical processes such as collisional drop breakup are frequent due to enhanced turbulence, strong vertical motions, and frequent drop–drop interactions. These processes reshape the DSD and lead to significant deviations from standard Z–R relationships. Notably, Singh et al. (2024) also show that the occurrence of equilibrium DSDs decreases with increasing rain rate, meaning that at high rain rates, the DSD is least likely to match the assumptions embedded in climatological Z–R relationship.
-
Second, at high altitudes stations (above 2000 m), the radar's sampling volume may lie within or just above the cloud base, where updrafts actively sort droplets by size, preferentially transporting the smallest ones upward. As a result, the DSD sampled by the radar differs from that observed at the ground by rain gauges.
Thus, the degraded performance of the Z–R relationship arises from a combination of factors: (1) the intrinsic limitations of Z–R relationships above the cloud base, (2) orographic microphysical processes that influence DSD, and (3) the limited number of large drops needed to trigger the D6 sensitivity of reflectivity. These conditions may systematically cause the Z–R estimator to underestimate rain rates at high-altitude gauge locations (Bellecombe and Commerson).
3.2 R(kdp) estimator
In this section, the interpretation focuses exclusively on the class “all types of precipitation” due to the sufficient number of samples.
For stations close to the radar (Group 1), the correlation coefficient ranges from 0.73 to 0.86, indicating good agreement between radar QPE and rain gauge measurements. However, the positive NB values (0.51 to 0.64) show that the radar tends to overestimate rainfall at short distances.
For stations located further from the radar (Group 2), the correlation increases (0.56 to 0.78) compared to R(Z) estimation. However, the correlation remains significant. In this case, the negative NB values (−0.27 to −0.11) but close to zero indicate a slight underestimation of rainfall by the radar at larger ranges.
Overall, the results show a better performance of R(kdp) compared to R(Z) for stations located more than 15 km from the radar (group 2), particularly during heavy rainfall (median value > 20 mm h−1, where the radar beam is located far from the ground station, at approximately 1 km above the ground) (Fig. 9). The results are consistent with those of previous studies showing that kdp-based estimators are more reliable for intense precipitation, as they are less affected by attenuation (e.g., Figueras i Ventura et al., 2012; Koffi et al., 2014; Schneebeli et al., 2014).
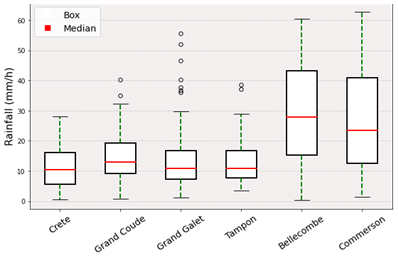
Figure 9Boxplot of hourly precipitation measured by rain gauges during the study period from 1 to 4 February 2022. The box extend from the 25th to the 75th percentiles, and whiskers extend 1.5 times the interquartile range.
In addition, unlike reflectivity, which is proportional to the sixth moment of the drop size distribution (∝D6) and is therefore highly sensitive to large drops, kdp scales approximately with the fourth moment (∝D4). As a result, kdp is less dominated by a few large drops and is more closely related to drop concentration and liquid water content.
Under tropical-cyclone conditions, particularly at the outer rain bands where very high concentrations of small-to-medium drops are often observed, so kdp can become large even when Z remains only moderate. This provides a physical explanation for why the derived R(kdp) relationship performs better for heavy rain (Bellecombe and Commerson) than the borrowed Z–R relation in this event. Furthermore, warm-rain processes below the freezing level, including coalescence and breakup, play an important role in shaping these DSD characteristics (Thurai et al., 2020; Yang et al., 2025). The present R(kdp) relation should therefore be viewed as event-specific, reflecting the microphysical conditions sampled during this tropical cyclone rather than a universally transferable X-band relation.
3.3 Influence of precipitation types and orographic effects on the radar QPE
According to Table 3, “stratiform precipitation” has a better correlation with raingauge than “all types of precipitation” regardless of the distance between the rain gauges and the radar or estimator used. One hypothesis is that stratiform precipitation is associated with horizontally homogeneous rain (Sánchez-Diezma et al., 2000) and low turbulence, which explains the presence of the bright band. Thus, despite the vertical separation between the radar beam and the rain gauges on the ground, and without considering microphysical processes like evaporation, the precipitation measured within the radar beam at altitude has similar characteristics as the rain drop reaching the rain gauges. The drop size distribution at this altitude will be similar as on the ground.
As illustrated in Fig. 10, a bright band may sometimes appear in certain regions (Fig. 10a) or be disrupted above others (Fig. 10b), especially at higher altitudes. Ding et al. (2014) revealed that precipitation types are significantly influenced by altitude. Terrain and intense wind associated to the tropical cyclone cause air to flow over the mountains (Yu and Cheng, 2008), which leads to produce more liquid water cloud (Lee et al., 2018) enhancing precipitation in higher elevation. Hence, the intensification of precipitation at higher altitudes, together with high winds near the mountain summit, may explain why at Commerson, located at 2310 m above sea level, the correlation coefficient is lower, even during stratiform rain. Nevertheless, we should bear in mind that the limited number of stratiform precipitation samples limits the conclusions that can be drawn from the latter analysis.
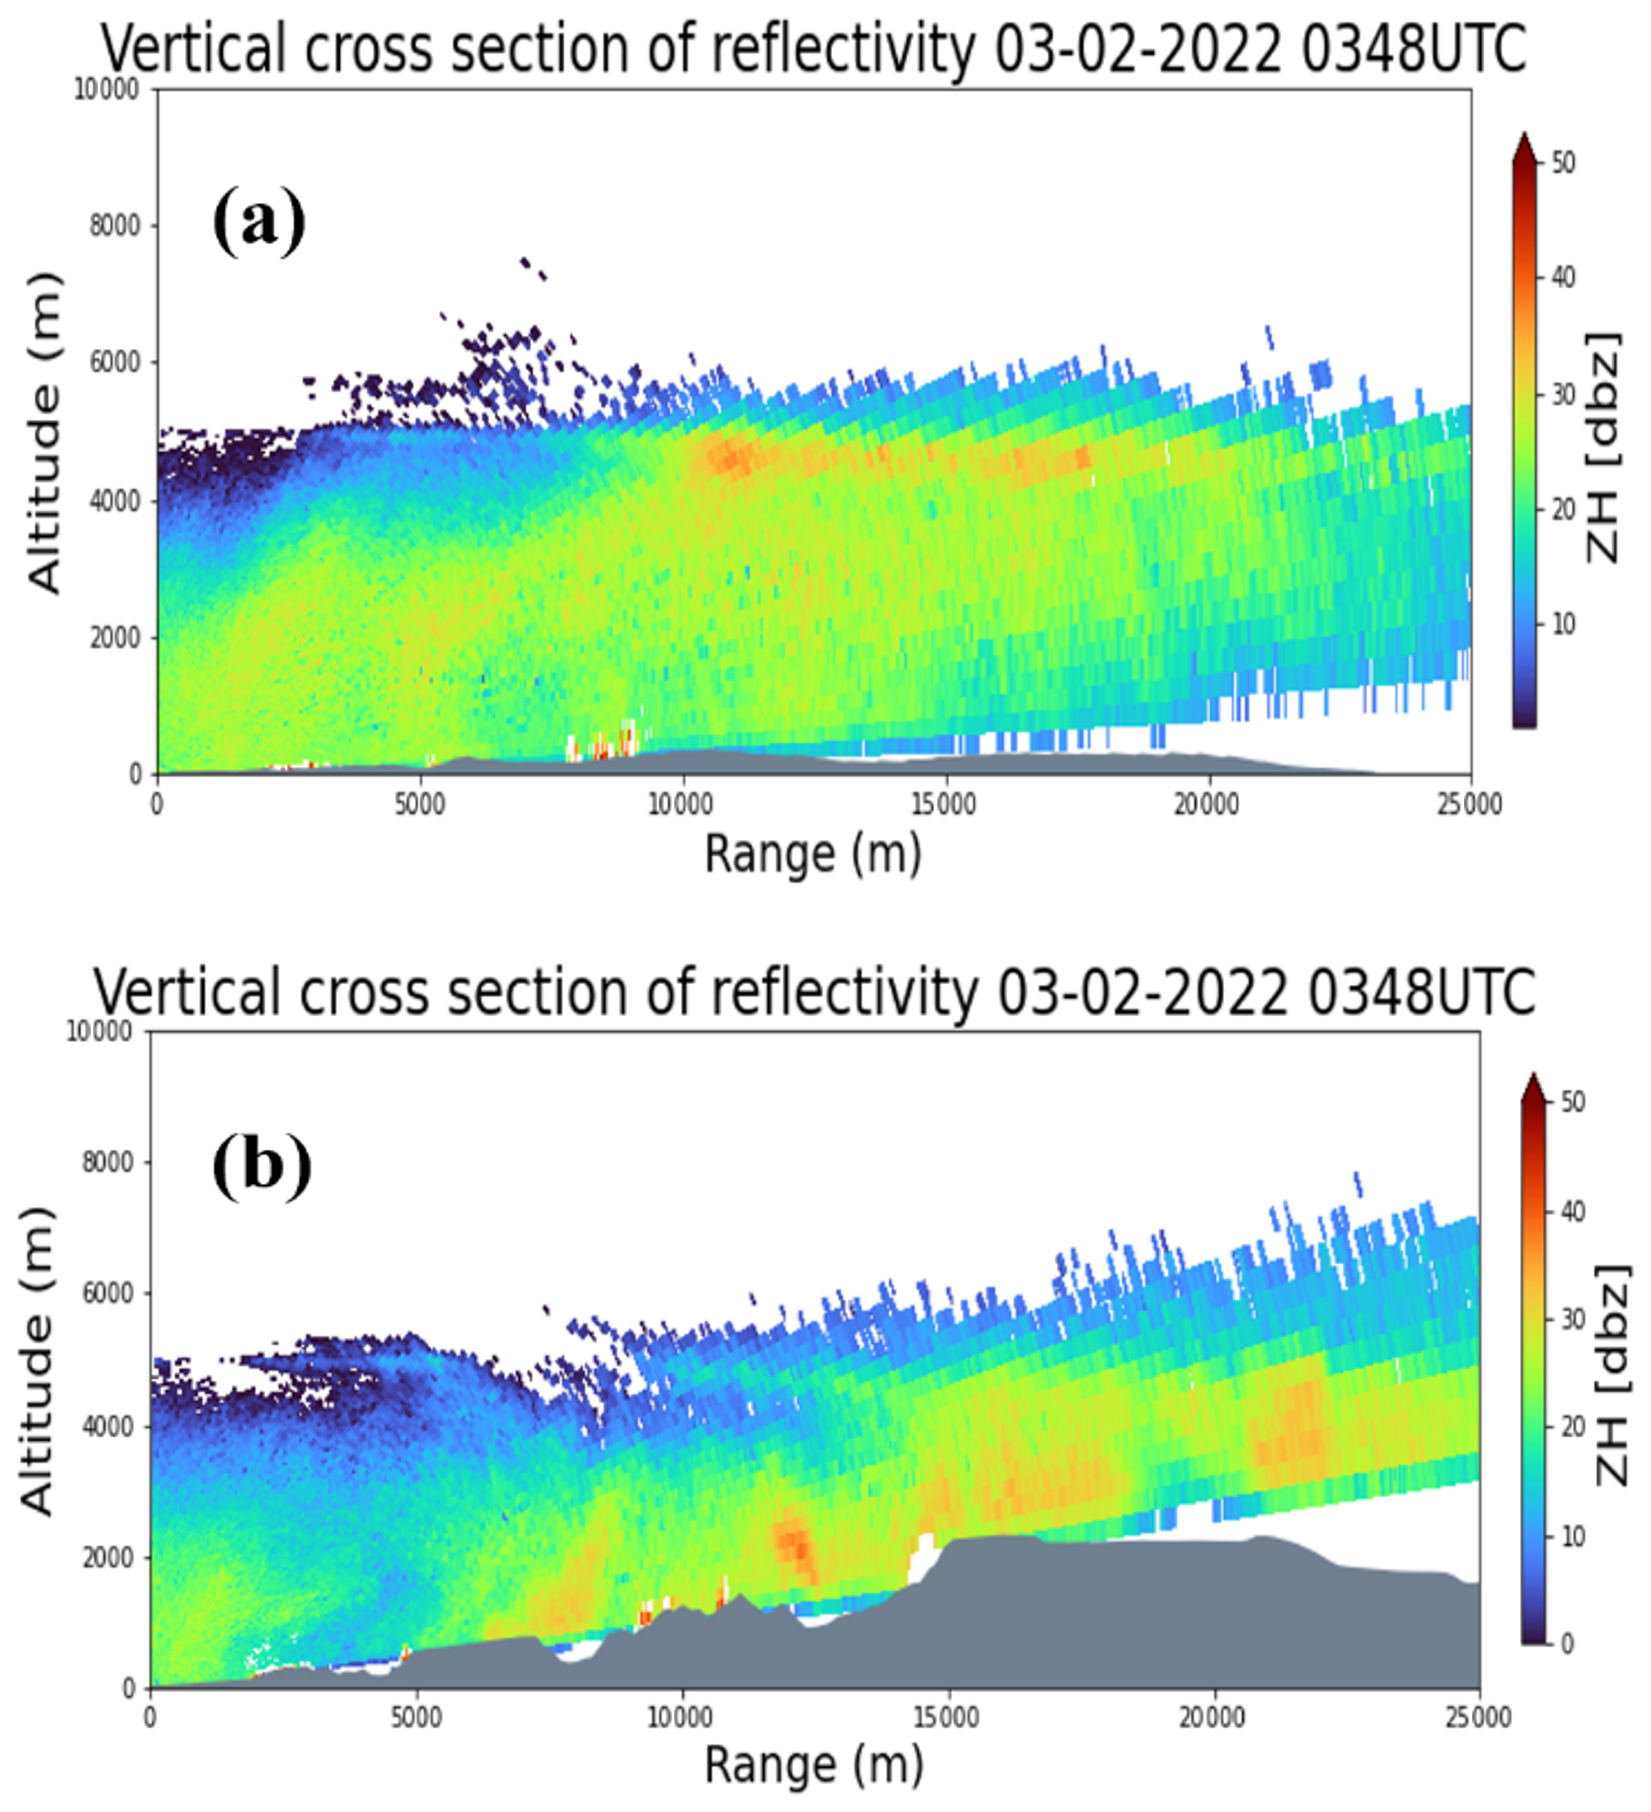
Figure 10Vertical cross section of reflectivity on 2 February 2022, at 03:48 UTC: (a) towards the coastal region (RHI at 76° of azimuth), showing a bright band at about 5 km altitude; (b) towards the mountains (RHI at 28° of azimuth), showing areas of increased reflectivity as the rain evolves with the altitude towards the ridges of salient orographic features.
To summarize, the comparison between the rain gauge measurements and the radar QPE can be classified as follows:
-
Group 1 (including Crete, Grand-Coude, and Grand-Galet), vertically close to the radar beam (less than 600 m) and horizontally close to the radar (less than 10 km). As these stations are located close to the coast and at a middle altitude, rainfall intensity is relatively lower, with a median value of around 10 mm h−1. At these stations, all estimators (i.e., R(Z) and R(kdp) show higher correlation coefficients, but an overestimation for R(kdp) (greater than 0.5 NB). The impact of attenuation is less significant due to their location. Furthermore, the estimation of kdp is particularly difficult at low rain rates. As kdp is the range derivative of the differential phase, small phase shifts associated with weak precipitation result in a noisy kdp signal.
-
Group 2 (including Commerson, Bellecombe, and Tampon), located far from the radar beam at a distance exceeding 15 km, with the vertical distance separating the radar beam and the rain gauge being greater than 800 m. Although Tampon is in the same class as Bellecombe and Commerson, its results are different, as the radar QPE at Tampon is more closely correlated with the rain gauge observations. Tampon experiences a lower median precipitation rate that is approximately half that of Commerson and Bellecombe, as depicted in Fig. 9. As a result, because of the heavy rainfall, the scores for Bellecombe and Commerson are lower than the Tampon rain gauge scores. The radar signal is strongly attenuated, which explains why only the R(kdp) estimator works satisfactorily for these two stations.
For Réunion Island, using a single rainfall estimator is not appropriate due to changes in precipitation regime caused by local intensification associated with orography. As a result, a hybrid rainfall estimation approach is proposed, using R(Z) for weakly attenuated rainfall and R(kdp) for heavy precipitation, particularly for rainfall rates exceeding 20 mm h−1 and at greater distances from the radar.
Overall, various processes contribute to the disparity between the radar QPE and the rain gauge measurements, mainly due to the different sampling approaches of the two observations. The radar QPE provides real coverage over large volumes, while rain gauges measure precipitation at specific points on the ground. However, this difference in sampling can introduce inconsistencies. Radar, for instance, samples a broader area but is affected by various factors like beam height and attenuation, while gauges give precise readings at ground level.
Furthermore, the drop size distribution may exhibit significant differences on the ground and at higher altitudes due to microphysical processes linked to the precipitation system dynamics and orography. Two factors may contribute to this disparity. First, under the influence of horizontal wind, the drops detected by the radar just above the rain gauges may not reach the ground where the rain gauges are situated and may instead fall far away, due to high wind. Second, several microphysical phenomena can alter the drop size distribution, including coalescence, evaporation, and bursting of drops before they hit the ground. This discrepancy between the drop size distribution at altitudes and at ground level can impact the accuracy of precipitation estimates. Drop size distribution is one source of uncertainty in the radar QPE (Rosenfeld and Ulbrich, 2003). The values of the a and b coefficients in the R(Z) relationship are based on different factors such as the type of precipitation (convective or stratiform) and the physical processes that influence the drop size distribution (Zeng et al., 2021).
Although rain gauge measurements are considered to be the “ground truth” for precipitation, they may also have associated errors (Dhiram and Wang, 2016), notably in high wind conditions.
The ESPOIRS project aims to investigate the interaction of intense precipitating systems with orography across different SWIO islands. As part of this project, an X-band radar was initially set up for just under a year in Reunion Island. Hence, quality control of the radar data was conducted using the available network of rain gauges from Météo France, which have high temporal resolution that allows for the comparison of quantitative precipitation estimates from radar with the rain gauge measurements. This comparison was carried out during the passage of Tropical Cyclone Batsirai near Réunion Island, as this period was the only one during the radar test bed in Réunion that provided continuous and homogeneous observations with constant temporal and spatial resolution. Tropical Cyclone Batsirai lasted for 4 days and provided valuable insights into the use of X-band radar for the study of precipitation systems. The radar QPE was determined using two estimators: R(Z) and R(kdp).
The results indicate that the differences between Z–R and R(kdp) cannot be explained by attenuation effects alone, but also reflect DSD variability under tropical-cyclone conditions and the local environment. The derived R(kdp) relation is therefore specific to the microphysical and sampling conditions of this event and cannot be generalized.
To correct reflectivity (Z) of attenuation, two methods based on single and dual polarization were tested: the Hitschfeld and Bordan (1954) method and the philinear method, respectively. It was observed that the HB method has difficulty in correcting attenuation in the case of intense precipitation (median value exceeding 10 mm h−1) and at a distance greater than 15 km from the radar. In this case, the radar tends to underestimate precipitation. The radar QPE is thus weakly correlated with rain gauge measurements. Using the philinear method, the results are better, regardless of whether the stations are located near or far from the radar. As a result, the philinear method was chosen to correct the attenuation of reflectivity Z for our entire dataset. However, under intense precipitation conditions, exceeding 20 mm h−1 of the median value, the accuracy of R(Z) estimates becomes constrained (Group 2). Hence, R(kdp) was tested to estimate precipitation, thus significantly improving the results when compared to R(Z). These rain gauges are located more than 19 km from the radar and are associated with heavy rainfall reaching up to 60 mm h−1, together with strong wind gusts of up to 159 km h−1. This improvement is due to the independence of kdp regarding attenuation. It also reflects the specific characteristics of the drop size distribution (DSD) during this event.
The discrepancies between radar-estimated rainfall rates and rain gauge measurements can be explained by the following factors:
-
The different altitudes of the rain gauges and radar beams can have a considerable effect. The precipitation measured by the radar situated above the rain gauges may not reach the rain gauges. This means that the drop size distribution of rainfall cannot be the same at ground level as it is at the altitude where the radar sampled it. Note that R(Z) and R(kdp) relationships are influenced by the drop size distribution.
-
The relationships used to correct attenuation and estimate rain rates depend on several parameters, including rain drop size distribution, radar frequency, and even ambient temperature. In our case, we only have information about radar frequency, which forces us to rely on empirical values from the literature, thereby limiting the precision of our radar QPE.
The complex terrain of Reunion Island adds significant interest to this study. The unique characteristics of each station, whether situated in a valley or on top of a mountain, influence the precipitation dynamics and thus play a significant role in the differences observed with the radar QPE. Furthermore, the type of precipitation, whether stratiform or not, influences the radar QPE. However, the limited sample size of the rain event prevented us from further investigating this aspect.
One limitation of this study is that the kdp-based rainfall estimator R(kdp) was derived from a limited number of available samples. Nevertheless, this result opens promising research perspectives for developing tropical-cyclone-specific R(kdp) relationships for X-band radar, based on disdrometer observations and T-matrix scattering simulations. These theoretical calculations, using TC-specific drop size distributions, would provide an independent assessment of kdp behaviour.
This study highlighted the importance of X-band polarimetric radars for estimating precipitation during cyclonic events in Reunion Island, thus showing X-band polarized weather radars to be a useful tool to investigate and monitor precipitation in the SWIO island territories. The data processing techniques developed in this research will be extended to the Seychelles and Madagascar datasets.
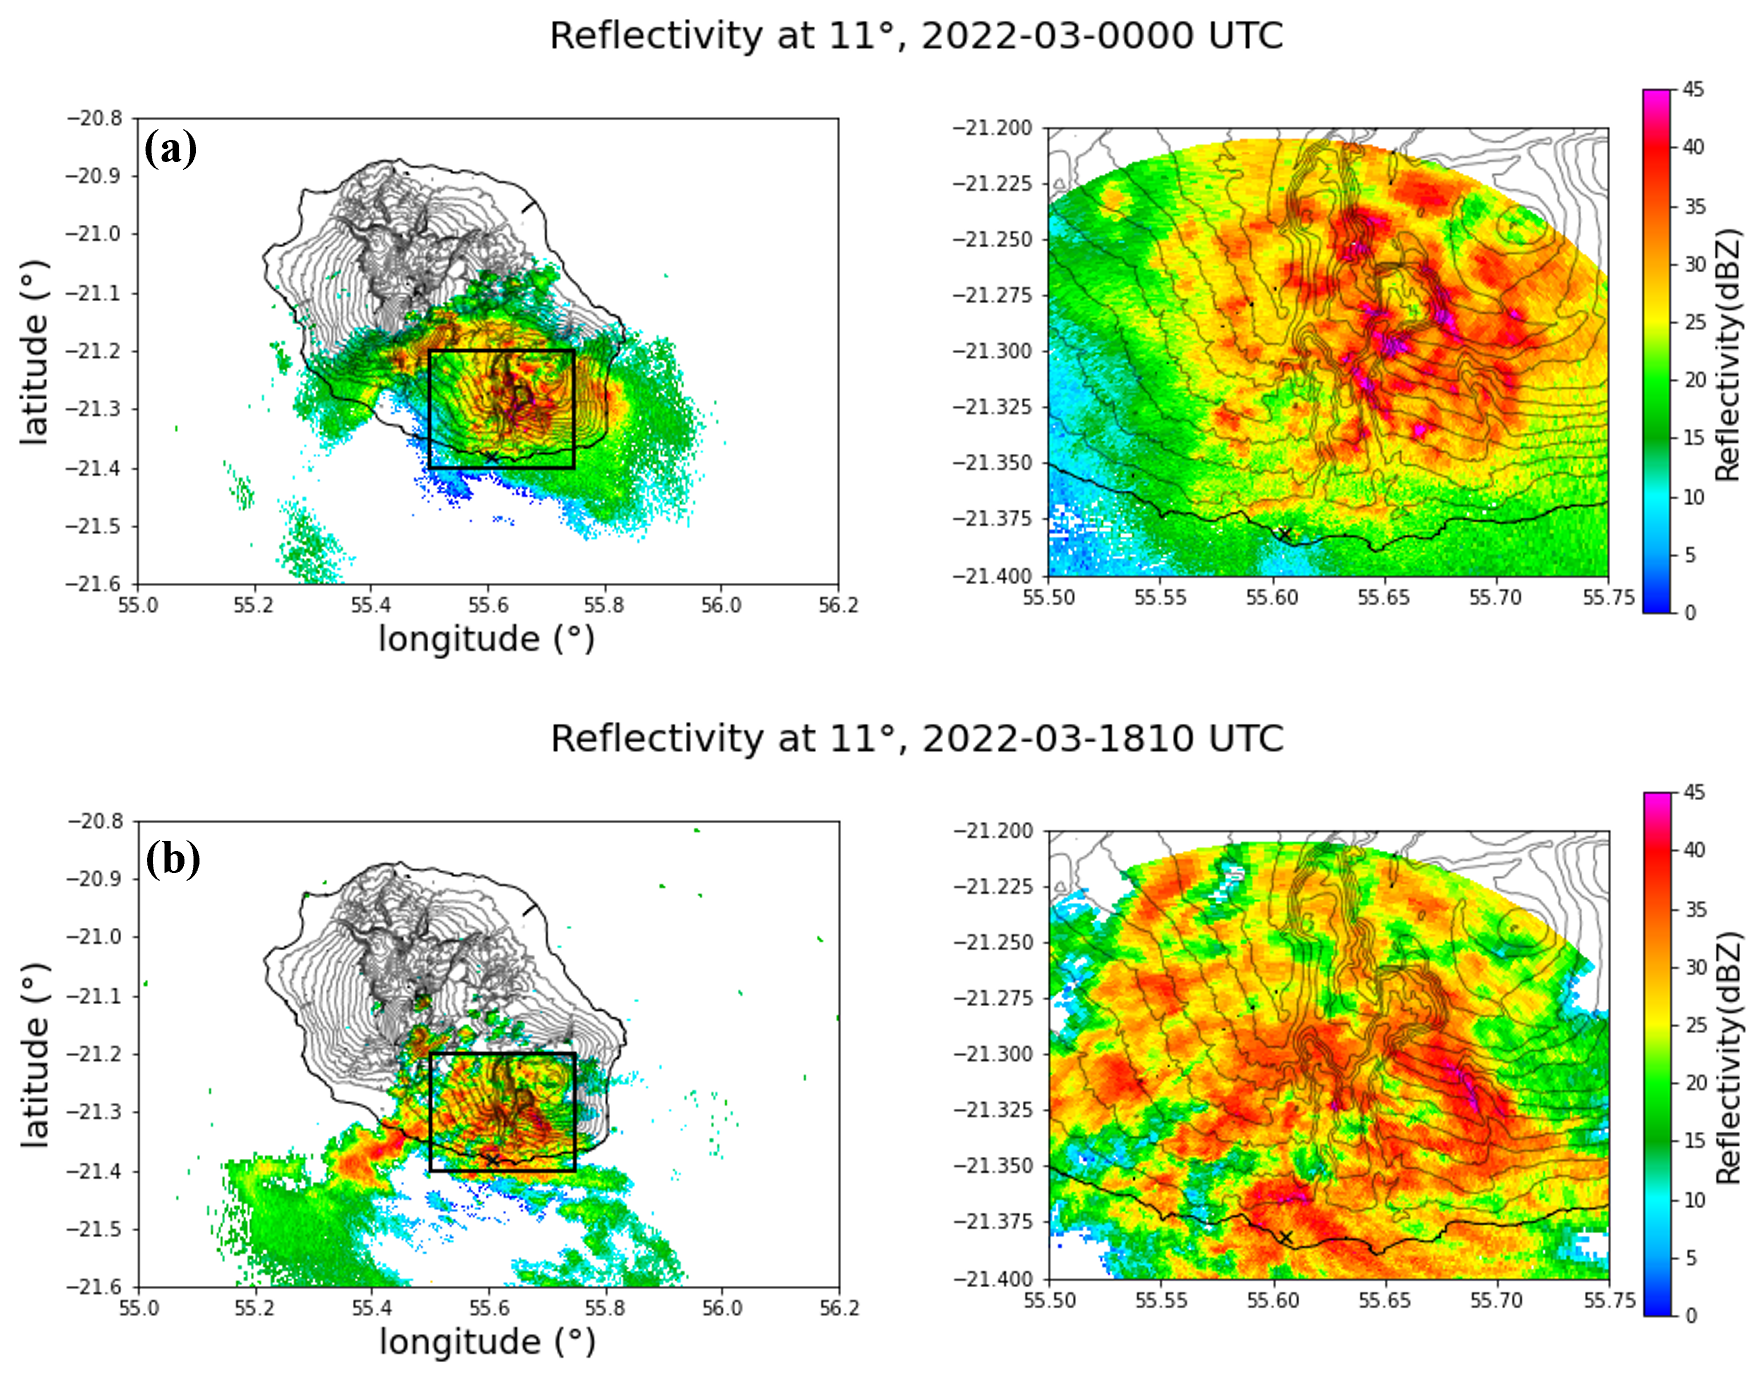
Figure A1(a) PPI reflectivity at 11° elevation when the TC center was located off the northeast coast of Réunion Island (00:00 UTC, 3 February 2022). The panel on the right shows a zoom over southwestern Réunion within a 20 km radius. (b) Same as panel (a), but when the TC canter was located off the northwest coast of Réunion Island (18:10 UTC, 3 February 2022).
The parameters a and b, relating specific attenuation (A) to reflectivity (Z), were taken from Tridon (2011, p. 125), first paragraph, where they report α = 112 000 and β = 1.32, originally from Berne and Uijlenhoet (2006).
The relationship between reflectivity factor Z [mm6 m−3] and specific attenuation A [dB km−1] is written as
From Eq. (B1):
Hitschfeld and Bordan (1954) express the specific attenuation as a power law of the form:
By comparing Eqs. (B2) and (B3), the coefficients a and b are expressed as:
Since β = 1.32 and α = 112 000 as mentioned above:
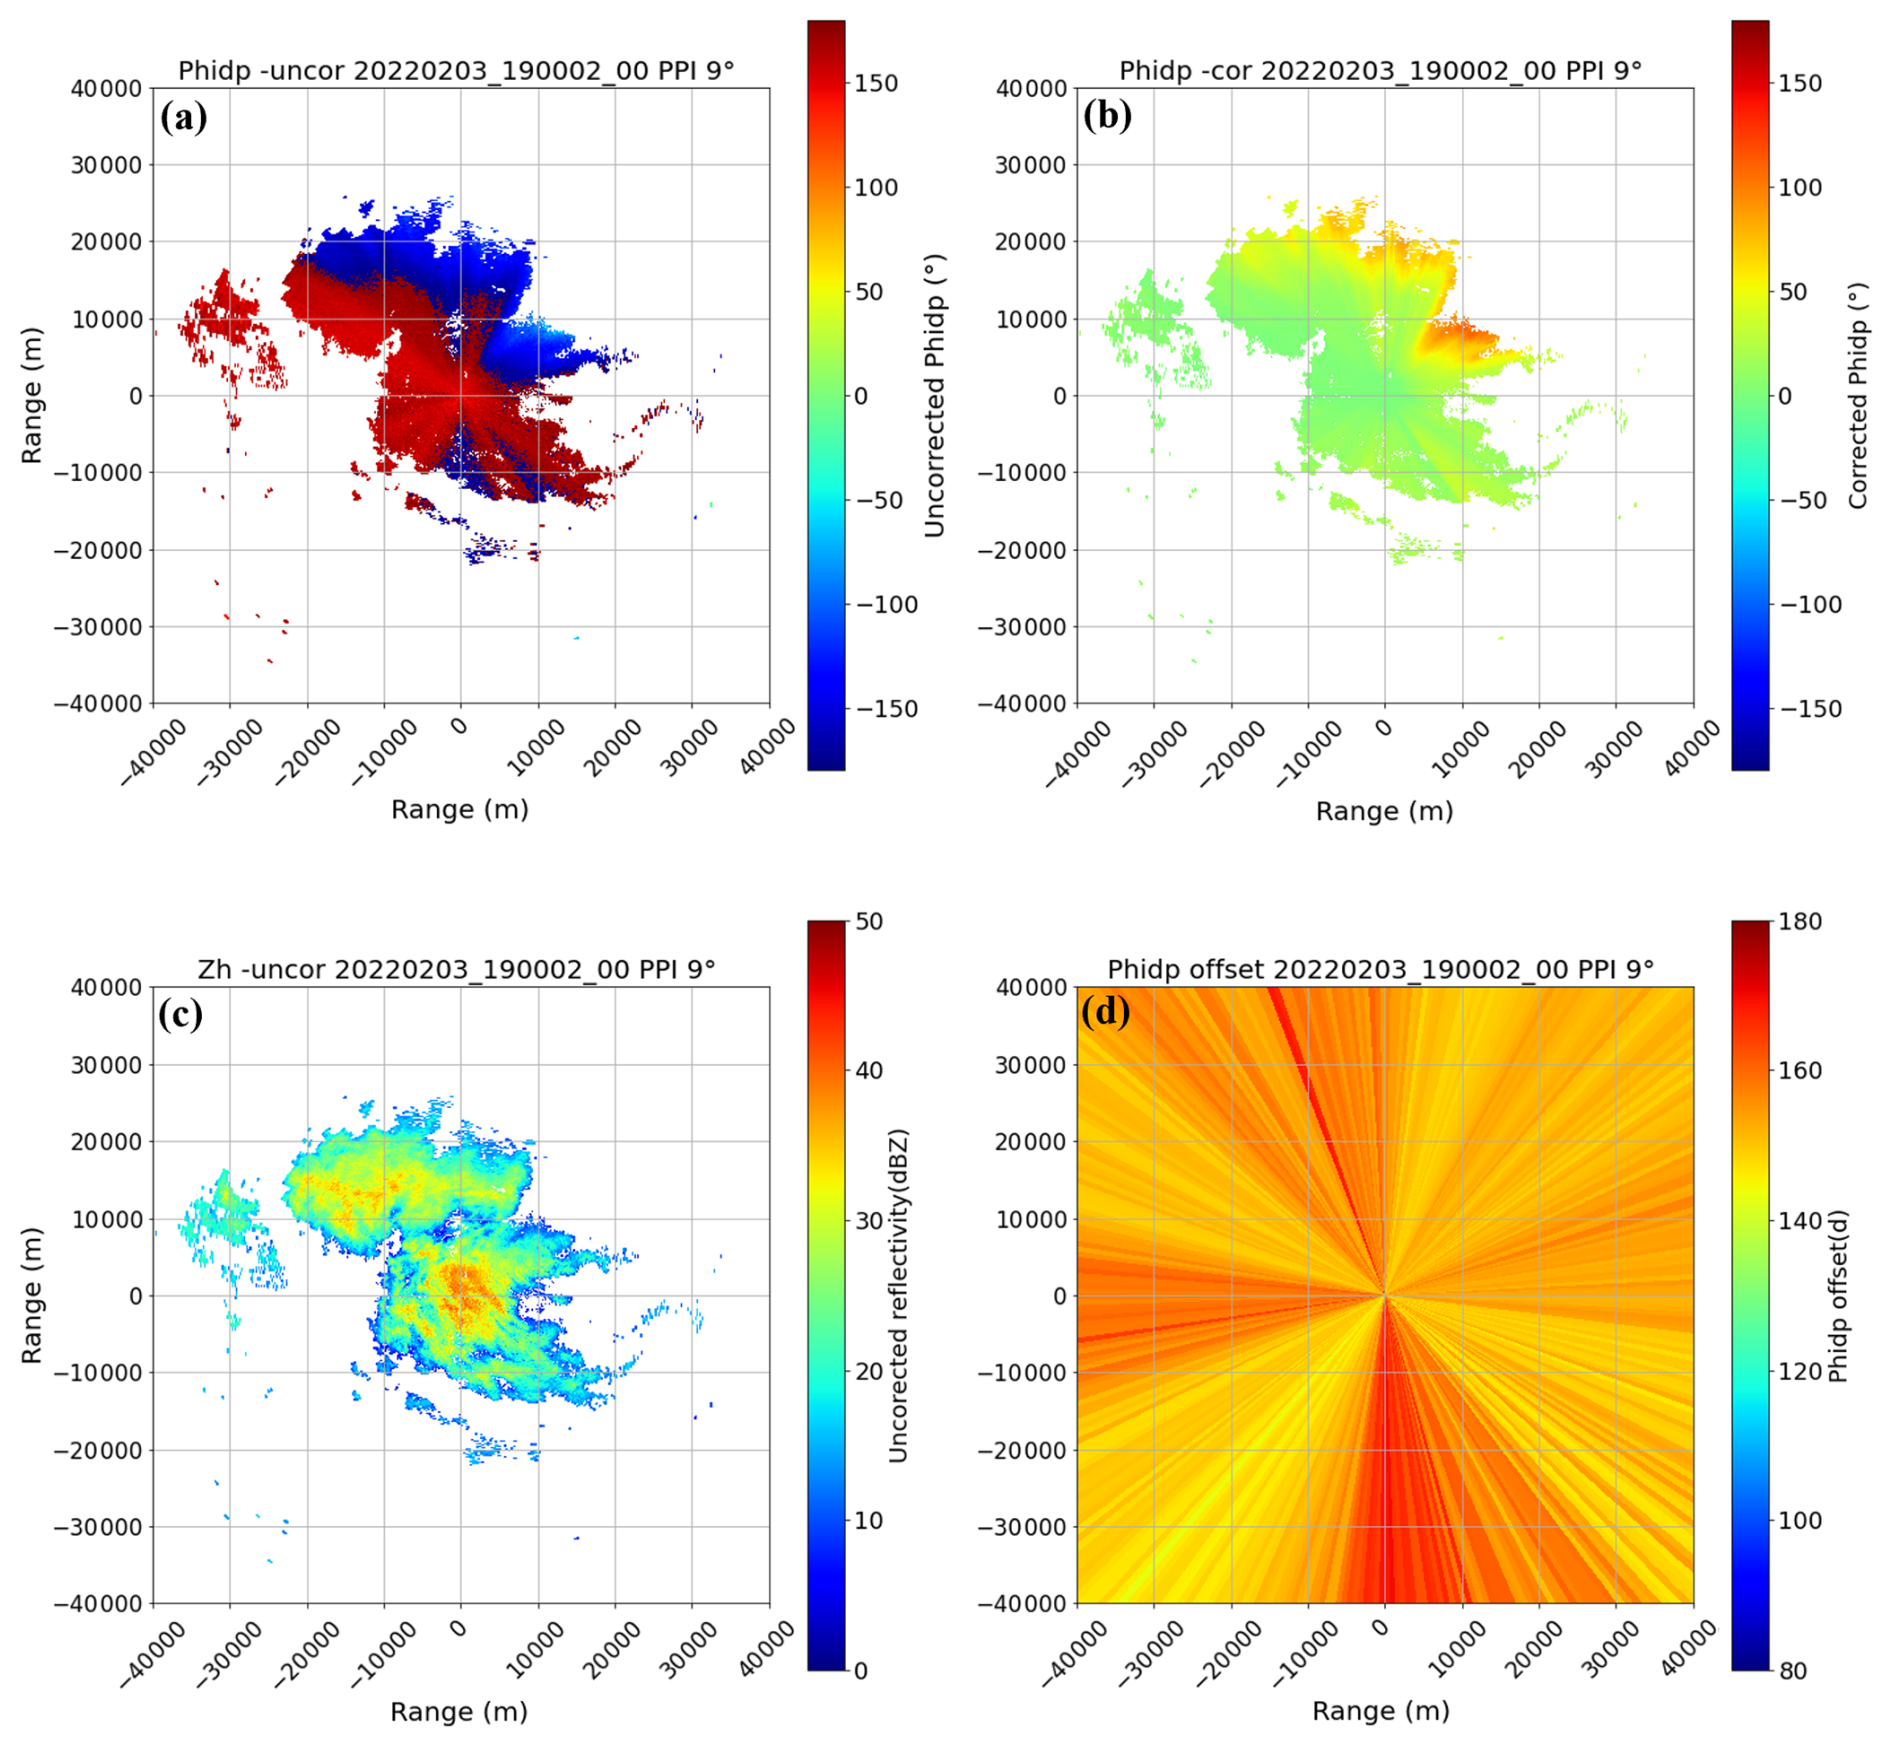
Figure C1PPI at an elevation of 9° at 19:00 UTC on 3 February 2022: (a) raw differential phase shift, (b) corrected ΦDP (using the procedure described in this article), (c) raw reflectivity, and (d) system offset illustrating its variation along the azimuth.
The code is available upon request from the authors.
All radar data are available at https://geosur.osureunion.fr/thredds/catalog/researchprogram/espoirs/1-Saint_Joseph/RADAR/Data/az-vol-75-0125-1to25deg-2022-01/2022/02/catalog.html (last access: 23 May 2026). For information on the rain gauge data, please send requests to ambinintsoa.ramanamahefa@univ-reunion.fr or visit the Météo France website https://portail-api.meteofrance.fr/web/fr/api/DonneesPubliquesObservation (last access: 23 May 2026).
AVR wrote the paper, implemented the methodology and conducted the data analysis. TP, GL, and JVB contributed to the implementation of the methodology and revised the paper. JVB led the ESPOIRS project and radar field deployments.
The contact author has declared that none of the authors has any competing interests.
Publisher's note: Copernicus Publications remains neutral with regard to jurisdictional claims made in the text, published maps, institutional affiliations, or any other geographical representation in this paper. The authors bear the ultimate responsibility for providing appropriate place names. Views expressed in the text are those of the authors and do not necessarily reflect the views of the publisher.
The ESPOIRS research project is led by LACy and the authors want to thanks all the members of the laboratory who contributed to the project deployment efforts.
We express our gratitude to Dr. Nan Yu for sharing valuable insights during the discussion on Kdp processing and attenuation correction. Additionally, we would like to thank Gamic for providing us with the algorithm to determine the system differential phase shift, as well as Météo France for providing rain gauge data.
This research has been supported in the framework of the INTERREG V ESPOIRS project funded by the European Union (FEDER program – GURDTI/20201589-0021087), Réunion Region, SGAR-Réunion, French State (CPER), and University of La Réunion.
Furthermore, AVR's thesis received financial support from the Réunion Region and the European Union – European Regional Development Fund (ERDF) within the framework of the INTERREG European Operational Programme – 2021–2027.
This paper was edited by S. Joseph Munchak and reviewed by David Dufton and two anonymous referees.
Antonini, A., Melani, S., Corongiu, M., Romanelli, S., Mazza, A., Ortolani, A., and Gozzini, B.: On the Implementation of a Regional X-Band Weather Radar Network, Atmosphere, 8, 25, https://doi.org/10.3390/atmos8020025, 2017.
Barros, A. P. and Arulraj, M.: Remote Sensing of Orographic Precipitation, in: Satellite Precipitation Measurement: Volume 2, edited by: Levizzani, V., Kidd, C., Kirschbaum, D. B., Kummerow, C. D., Nakamura, K., and Turk, F. J., Springer International Publishing, Cham, 559–582, https://doi.org/10.1007/978-3-030-35798-6_6, 2020.
Berne, A. and Uijlenhoet, R.: Quantitative analysis of X-band weather radar attenuation correction accuracy, Nat. Hazards Earth Syst. Sci., 6, 419–425, https://doi.org/10.5194/nhess-6-419-2006, 2006.
Bringi, V. N. and Chandrasekar, V.: Polarimetric Doppler Weather Radar: Principles and Applications, Cambridge University Press, 666 pp., ISBN 0-521-62384-7, 2001.
Bringi, V. N., Chandrasekar, V., Balakrishnan, N., and Zrnić, D. S.: An Examination of Propagation Effects in Rainfall on Radar Measurements at Microwave Frequencies, J. Atmos. Ocean. Technol., 7, 829–840, https://doi.org/10.1175/1520-0426(1990)007<0829:AEOPEI>2.0.CO;2, 1990.
Carey, L. D., Rutledge, S. A., Ahijevych, D. A., and Keenan, T. D.: Correcting Propagation Effects in C-Band Polarimetric Radar Observations of Tropical Convection Using Differential Propagation Phase, J. Appl. Meteorol. Climatol., 39, 1405–1433, https://doi.org/10.1175/1520-0450(2000)039<1405:CPEICB>2.0.CO;2, 2000.
Delrieu, G., Hucke, L., and Creutin, J. D.: Attenuation in Rain for X- and C-Band Weather Radar Systems: Sensitivity with respect to the Drop Size Distribution, J. Appl. Meteorol., 38, 57–68, https://doi.org/10.1175/1520-0450(1999)038<0057:AIRFXA>2.0.CO;2, 1999.
Dhiram, K. and Wang, Z.: Evaluation on Radar Reflectivity-Rainfall Rate (Z-R) Relationships for Guyana, Atmos. Clim. Sci., 6, 489–499, https://doi.org/10.4236/acs.2016.64039, 2016.
Ding, B., Yang, K., Qin, J., Wang, L., Chen, Y., and He, X.: The dependence of precipitation types on surface elevation and meteorological conditions and its parameterization, J. Hydrol., 513, 154–163, https://doi.org/10.1016/j.jhydrol.2014.03.038, 2014.
Fabry, F.: Radar meteorology: principles and practice, Cambridge University Press, Cambridge, 256 pp., ISBN 978-1-108-46039-2, 2017.
Fabry, F. and Zawadzki, I.: Long-Term Radar Observations of the Melting Layer of Precipitation and Their Interpretation, J. Atmos. Sci., 52, 838–851, https://doi.org/10.1175/1520-0469(1995)052<0838:LTROOT>2.0.CO;2, 1995.
Figueras i Ventura, J., Boumahmoud, A.-A., Fradon, B., Dupuy, P., and Tabary, P.: Long-term monitoring of French polarimetric radar data quality and evaluation of several polarimetric quantitative precipitation estimators in ideal conditions for operational implementation at C-band, Q. J. R. Meteorol. Soc., 138, 2212–2228, https://doi.org/10.1002/qj.1934, 2012.
Frech, M.: Monitoring the data quality of the new polarimetric weather radar network of the German Meteorological Service, Ext. Abstr. 9B3 AMS Radar Conf., https://www.researchgate.net/doi/10.13140/RG.2.1.2639.4328 (last access: 23 May 2026), 2013.
Ghada, W., Casellas, E., Herbinger, J., Garcia-Benadí, A., Bothmann, L., Estrella, N., Bech, J., and Menzel, A.: Stratiform and Convective Rain Classification Using Machine Learning Models and Micro Rain Radar, Remote Sens., 14, 4563, https://doi.org/10.3390/rs14184563, 2022.
Giangrande, S. E., McGraw, R., and Lei, L.: An Application of Linear Programming to Polarimetric Radar Differential Phase Processing, J. Atmos. Ocean. Technol., 30, 1716–1729, https://doi.org/10.1175/JTECH-D-12-00147.1, 2013.
Gorgucci, E., Scarchilli, G., and Chandrasekar, V.: A procedure to calibrate multiparameter weather radar using properties of the rain medium, IEEE Trans. Geosci. Remote Sens., 37, 269–276, https://doi.org/10.1109/36.739161, 1999.
Harrison, D. L., Driscoll, S. J., and Kitchen, M.: Improving precipitation estimates from weather radar using quality control and correction techniques, Meteorl. Appl., 7, 135–144, https://doi.org/10.1017/S1350482700001468, 2000.
Helmus, J. J. and Collis, S. M.: The Python ARM Radar Toolkit (Py-ART), a Library for Working with Weather Radar Data in the Python Programming Language, J. Open Res. Softw., 4, 25, https://doi.org/10.5334/jors.119, 2016.
Hitschfeld, W. and Bordan, J.: Errors Inherent In The Radar Measurement Of Rainfall At Attenuating Wavelengths, J. Atmos. Sci., 11, 58–67, https://doi.org/10.1175/1520-0469(1954)011<0058:EIITRM>2.0.CO;2, 1954.
Houze, R. A.: Structure and Dynamics of a Tropical Squall–Line System, Mon. Weather Rev., 105, 1540–1567, https://doi.org/10.1175/1520-0493(1977)105<1540:SADOAT>2.0.CO;2, 1977.
Houze, R. A.: Stratiform Precipitation in Regions of Convection: A Meteorological Paradox?, Bull. Am. Meteorol. Soc., 78, 2179–2196, https://doi.org/10.1175/1520-0477(1997)078<2179:SPIROC>2.0.CO;2, 1997.
Illingworth, A. J.: The estimation of moderate rain rates with operational polarisation radar, 32nd Conference on Radar Meteorology, https://meetings.copernicus.org/www.cosis.net/abstracts/EGU06/02770/EGU06-J-02770.pdf (last access: 23 May 2026), 2005.
Jacobi, S. and Heistermann, M.: Benchmarking attenuation correction procedures for six years of single-polarized C-band weather radar observations in South-West Germany, Geomat. Nat. Hazards Risk, 7, 1785–1799, https://doi.org/10.1080/19475705.2016.1155080, 2016.
Jameson, A. R.: The Effect of Temperature on Attenuation-Correction Schemes in Rain Using Polarization Propagation Differential Phase Shift, J. Appl. Meteorol. Climatol., 31, 1106–1118, https://doi.org/10.1175/1520-0450(1992)031<1106:TEOTOA>2.0.CO;2, 1992.
Jorgensen, D. P. and Willis, P. T.: A Z-R Relationship for Hurricanes, J. Appl. Meteorol., 21, 356–366, https://doi.org/10.1175/1520-0450(1982)021<0356:AZRRFH>2.0.CO;2, 1982.
Koffi, A. K., Gosset, M., Zahiri, E.-P., Ochou, A. D., Kacou, M., Cazenave, F., and Assamoi, P.: Evaluation of X-band polarimetric radar estimation of rainfall and rain drop size distribution parameters in West Africa, Atmos. Res., 143, 438–461, https://doi.org/10.1016/j.atmosres.2014.03.009, 2014.
Krämer, S. and Verworn, H.-R.: Improved radar data processing algorithms for quantitative rainfall estimation in real time, Water Sci. Technol., 60, 175–184, https://doi.org/10.2166/wst.2009.282, 2009.
Lee, J.-T., Ko, K.-Y., Lee, D.-I., You, C.-H., and Liou, Y.-C.: Enhancement of orographic precipitation in Jeju Island during the passage of Typhoon Khanun (2012), Atmos. Res., 201, 58–71, https://doi.org/10.1016/j.atmosres.2017.10.013, 2018.
Li, H., Moisseev, D., Luo, Y., Liu, L., Ruan, Z., Cui, L., and Bao, X.: Assessing specific differential phase (KDP)-based quantitative precipitation estimation for the record- breaking rainfall over Zhengzhou city on 20 July 2021, Hydrol. Earth Syst. Sci., 27, 1033–1046, https://doi.org/10.5194/hess-27-1033-2023, 2023.
Maesaka, T., Iwanami, K., and Maki, M.: Non-negative KDP Estimation by Monotone Increasing ΦDP Assumption below Melting Layer, 7th European Conference on Radar in Meteorology and Hydrology, http://www.meteo.fr/cic/meetings/2012/ERAD/extended_abs/QPE_233_ext_abs.pdf (last access: 24 May 2026), 2012.
Matrosov, S. Y.: Distinguishing between Warm and Stratiform Rain Using Polarimetric Radar Measurements, Remote Sens., 13, 214, https://doi.org/10.3390/rs13020214, 2021.
Matrosov, S. Y., Clark, K. A., Martner, B. E., and Tokay, A.: X-band polarimetric radar measurements of rainfall, J. Appl. Meteorol., 41, 941–952, 2002.
Park, S.-G., Bringi, V. N., Chandrasekar, V., Maki, M., and Iwanami, K.: Correction of Radar Reflectivity and Differential Reflectivity for Rain Attenuation at X Band. Part I: Theoretical and Empirical Basis, J. Atmos. Ocean. Technol., 22, 1621–1632, https://doi.org/10.1175/JTECH1803.1, 2005.
Radhakrishna, B.: Raindrop size distribution (DSD) during the passage of tropical cyclone Nivar: effect of measuring principle and wind on DSDs and retrieved rain integral and polarimetric parameters from impact and laser disdrometers, Atmos. Meas. Tech., 15, 6705–6722, https://doi.org/10.5194/amt-15-6705-2022, 2022.
Rauber, R. M. and Nesbitt, S. W.: Radar meteorology: a first course, 1st edn., John Wiley & Sons, Hoboken, NJ, ISBN 978-1-118-43262-4, 2018.
Reimel, K. J. and Kumjian, M.: Evaluation of KDP Estimation Algorithm Performance in Rain Using a Known-Truth Framework, J. Atmos. Ocean. Technol., 38, 587–605, https://doi.org/10.1175/JTECH-D-20-0060.1, 2021.
Rosenfeld, D. and Ulbrich, C. W.: Cloud Microphysical Properties, Processes, and Rainfall Estimation Opportunities, Meteorol. Monogr., 30, 237–258, https://doi.org/10.1175/0065-9401(2003)030<0237:CMPPAR>2.0.CO;2, 2003.
Ryzhkov, A. V. and Zrnic, D. S.: Polarimetric Measurements of Precipitation, in: Radar Polarimetry for Weather Observations, Springer International Publishing, Cham, 373–433, https://doi.org/10.1007/978-3-030-05093-1_10, 2019.
Sánchez-Diezma, R., Zawadzki, I., and Sempere-Torres, D.: Identification of the bright band through the analysis of volumetric radar data, J. Geophys. Res.-Atmos., 105, 2225–2236, https://doi.org/10.1029/1999JD900310, 2000.
Schneebeli, M., Grazioli, J., and Berne, A.: Improved Estimation of the Specific Differential Phase Shift Using a Compilation of Kalman Filter Ensembles, IEEE Trans. Geosci. Remote Sens., 52, 5137–5149, https://doi.org/10.1109/TGRS.2013.2287017, 2014.
Singh, N., Das, S., Sahoo, U. K., Kundu, S. S., and Chakraborty, S.: On collisional drop breakup in orographic rain, Atmos. Res., 300, 107232, https://doi.org/10.1016/j.atmosres.2024.107232, 2024.
Sugier, J. and Tabary, P.: Evaluation of dual polarization technology at C-band for operational weather radars as part of the EUMETNET OPERA programme, Fourth European Conference on Radar in Meteorology and Hydrology-ERAD, 2006.
Testud, J., Le Bouar, E., Obligis, E., and Ali-Mehenni, M.: The Rain Profiling Algorithm Applied to Polarimetric Weather Radar, J. Atmos. Ocean. Technol., 17, 332–356, https://doi.org/10.1175/1520-0426(2000)017<0332:TRPAAT>2.0.CO;2, 2000.
Thiruvengadam, P., Lesage, G., Ramanamahefa, A. V., and Van Baelen, J.: Mitigating radome-induced bias in X-band weather radar polarimetric moments using an adaptive discrete Fourier transform algorithm, Atmos. Meas. Tech., 18, 1185–1191, https://doi.org/10.5194/amt-18-1185-2025, 2025.
Thurai, M., Bringi, V. N., Wolff, D. B., Marks, D. A., and Pabla, C. S.: Drop Size Distribution Measurements in Outer Rainbands of Hurricane Dorian at the NASA Wallops Precipitation-Research Facility, Atmosphere, 11, 578, https://doi.org/10.3390/atmos11060578, 2020.
Timothy, K. I., Iguchi, T., Ohsaki, Y., Horie, H., Hanado, H., and Kumagai, H.: Test of the Specific Differential Propagation Phase Shift (KDP) Technique for Rain-Rate Estimation with a Ku-Band Rain Radar, J. Atmos. Ocean. Technol., 16, 1077–1091, https://doi.org/10.1175/1520-0426(1999)016<1077:TOTSDP>2.0.CO;2, 1999.
Tokay, A., Bashor, P. G., Habib, E., and Kasparis, T.: Raindrop Size Distribution Measurements in Tropical Cyclones, Mon. Weather Rev., 136, 1669–1685, https://doi.org/10.1175/2007MWR2122.1, 2008.
Tridon, F.: Mesure des précipitations à l'aide d'un radar en bande X non-cohérent à haute résolution et d'un radar en bande K à visée verticale. Application à l'étude de la variabilité des précipitations lors de la campagne COPS, 199, https://theses.hal.science/tel-00777843 (last access: 24 May 2026), 2011.
Trömel, S., Kumjian, M. R., Ryzhkov, A. V., Simmer, C., and Diederich, M.: Backscatter Differential Phase – Estimation and Variability, J. Appl. Meteorol. Climatol., 52, 2529–2548, https://doi.org/10.1175/JAMC-D-13-0124.1, 2013.
Unuma, T., Yamauchi, H., Kato, T., Umehara, A., Hashimoto, A., Adachi, A., and Nagumo, N.: Characteristics of Raindrop Size Distribution Using 10-year Disdrometer Data in Eastern Japan, J. Meteorol. Soc. Jpn. Ser II, 103, 219–232, https://doi.org/10.2151/jmsj.2025-011, 2025.
Vulpiani, G., Montopoli, M., Passeri, L. D., Gioia, A. G., Giordano, P., and Marzano, F. S.: On the Use of Dual-Polarized C-Band Radar for Operational Rainfall Retrieval in Mountainous Areas, J. Appl. Meteorol. Climatol., 51, 405–425, https://doi.org/10.1175/JAMC-D-10-05024.1, 2012.
Wu, D., Zhang, F., Chen, X., Ryzhkov, A., Zhao, K., Kumjian, M. R., Chen, X., and Chan, P.-W.: Evaluation of microphysics schemes in tropical cyclones using polarimetric radar observations: Convective precipitation in an outer rainband, Mon. Weather Rev., 149, 1055–1068, 2021.
Yang, Q., Feng, Y., Guan, L., Wu, W., Wang, S., and Li, Q.: X-Band Radar Attenuation Correction Method Based on LightGBM Algorithm, Remote Sens., 15, 864, https://doi.org/10.3390/rs15030864, 2023.
Yang, S., Du, Y., Han, B., Wu, C., and Kong, H.: Microphysical Characteristics of Tropical Cyclone Choiwan (2021) Outer Rainbands Derived From Polarimetric Radar Observations on a Research Vessel, Geophys. Res. Lett., 52, e2024GL112557, https://doi.org/10.1029/2024GL112557, 2025.
Yu, C.-K. and Cheng, L.-W.: Radar Observations of Intense Orographic Precipitation Associated with Typhoon Xangsane (2000), Mon. Weather Rev., 136, 497–521, https://doi.org/10.1175/2007MWR2129.1, 2008.
Yu, N., Gaussiat, N., and Tabary, P.: Polarimetric X-band weather radars for quantitative precipitation estimation in mountainous regions, Q. J. R. Meteorol. Soc., 144, 2603–2619, https://doi.org/10.1002/qj.3366, 2018.
Zeng, Z., Wang, D., and Chen, Y.: An investigation of convective features and Z–R relationships for a local extreme precipitation event, Atmos. Res., 250, 105372, https://doi.org/10.1016/j.atmosres.2020.105372, 2021.
Zeyong, G., Zhaoping, S., Jia, G., Feifei, L., and Zhichao, B.: A Method for Calibrating Zdr by Using Light Rain Echo in Volume Scan Data, in: 2019 International Conference on Meteorology Observations (ICMO), 1–3, https://doi.org/10.1109/ICMO49322.2019.9025914, 2019.
Zrnić, D. S. and Ryzhkov, A.: Advantages of Rain Measurements Using Specific Differential Phase, J. Atmos. Ocean. Technol., 13, 454–464, https://doi.org/10.1175/1520-0426(1996)013<0454:AORMUS>2.0.CO;2, 1996.