the Creative Commons Attribution 4.0 License.
the Creative Commons Attribution 4.0 License.
 | 19 Jan 2026
Hygroscopic growth characteristics of anthropogenic aerosols over central China revealed by lidar observations
Dongzhe Jing
Zhenping Yin
Detlef Müller
Kaiming Huang
Lidar-derived particle backscatter coefficient is commonly used to assess air pollution levels; however, hygroscopic growth can amplify particle backscatter and hinder accurate assessment of particle concentration. This study investigated the hygroscopic growth characteristics of urban anthropogenic aerosols in Wuhan (30.5° N, 114.4° E), central China, using ground-based 532 nm polarization lidar observations during 2010–2024. A total of 192 cases were identified based on the following criteria: (1) the presence of a layer thicker than 300 m; (2) a lidar-derived backscatter coefficient that increases monotonically with simultaneously-measured relative humidity (RH) from radiosonde, and (3) limited variations in key meteorological parameters, including water vapor mixing ratio, potential temperature, and wind speed and direction. Using the Hänel parameterization method, the hygroscopic growth parameter γ was estimated as 0.62 (±0.24), corresponding to a backscatter coefficient enhancement factor of 2.36 at 85 % RH. No evident differences in γ were observed between the boundary layer (0.63 ± 0.25) and free troposphere (0.60 ± 0.24). The annual mean γ increased from 0.49 in 2015 to 0.63 in 2017 and stabilized within 0.6–0.7 after 2018, closely following the evolution of the annual mean NO2-to-SO2 concentration ratio. The minimum seasonal average γ occurred in winter (0.56), while the maximum was observed in autumn (0.64). These results provide a comprehensive characterization of the long-term and seasonal hygroscopicity of pollutants over central China, enhancing our understanding of the influence of hygroscopic growth on lidar-observed particle backscatter coefficients and offering valuable insights for urban air pollution control strategies.
- Article
(3315 KB) - Full-text XML
- BibTeX
- EndNote


Atmospheric aerosols impact global climate directly by scattering or absorbing solar radiation (Liu and Matsui, 2021), and indirectly via aerosol-cloud interactions by acting as cloud condensation nuclei (CCN) or ice-nucleating particles (INP) (Rosenfeld et al., 2014; He et al., 2021, 2022). In the atmosphere, soluble aerosols can take up water vapor under high relative humidity (RH) conditions, causing them to grow in size through so-called hygroscopic growth (Hänel, 1976). This process alters aerosols' optical and microphysical properties, thus changing their impact on climate. Ji et al. (2025) found that the aerosol infrared radiation effect in the Arctic is 1.45 W m−2 under dry atmospheric conditions, which increases 7-fold when RH is between 60 %–80 % and even up to 20 times when RH exceeds 80 %. In addition, aerosol hygroscopicity plays a vital role in activating cloud droplets, with activation efficiencies of 0 %–34 % for low hygroscopicity particles and 57 %–83 % for high hygroscopicity particles, respectively (Väisänen et al., 2016). Furthermore, in urban environments, when aerosols take up water vapor and grow, the atmospheric visibility could significantly reduce, leading to severe haze events (Liu et al., 2013; Chen et al., 2019). Aerosol hygroscopicity also affects the deposition efficiency in the respiratory tract and influences human health (Sorooshian et al., 2012).
The hygroscopic enhancement factor f(RH) quantitatively describes aerosol hygroscopicity, defined as the ratio of the particle scatter or backscatter coefficient (Granados-Muñoz et al., 2015; Zhang et al., 2024) or particle diameter (Zieger et al., 2013) at a given RH to the corresponding values under dry conditions (typically ∼ 40 %) (Hänel, 1976; Titos et al., 2016). To determine this factor, in-situ measurements commonly use humidified nephelometers (Zieger et al., 2010, 2013) and humidified tandem differential mobility analyzer (HTDMA) (Deshmukh et al., 2025; Yu et al., 2025). These instruments first dry the collected aerosol samples and then re-humidify them to a target RH, enabling comparisons of scatter coefficients or particle diameters under dry versus humid conditions. This approach provides general insights into the hygroscopicity of different aerosol types. However, this process can be affected by particle sampling losses (Titos et al., 2016) and by variations in aerosol size or scatter coefficient (e.g., deliquescent aerosols, Zieger et al., 2016). In addition, accurately determining hygroscopic enhancement factors at RH above 90 % remains challenging for both nephelometers and HTDMA (Lv et al., 2017).
In addition to in situ measurements, lidar also has the capability to measure aerosol hygroscopicity, a technique first demonstrated by Ferrare et al. (1998). From then on, lidar-based experiments have been widely used to derive the hygroscopic particle backscatter coefficient enhancement factor fβ(RH), (Granados-Muñoz et al., 2015; Haarig et al., 2017, 2025; Sicard et al., 2022; Miri et al., 2024; Veselovskii et al., 2025; Zhang et al., 2025), defined as the ratio of the particle backscatter coefficient at a given RH to that under dry conditions (e.g., 40 %). Unlike in situ measurements, lidar observations provide hight-resolved particle backscatter coefficient with high vertical resolution, and thus, enable the estimation of aerosol hygroscopicity under real atmospheric environments and within the entire atmospheric column, instead of in controlled laboratory settings. However, lidar-based studies of aerosol hygroscopic growth require simultaneous profiles of meteorological parameters as input (Granados-Muñoz et al., 2015); as a result, most existing lidar studies have focused on individual case analyses rather than long-term monitoring. At our observatory in Wuhan (30.5° N, 114.4° E), a megacity in central China, continuous (24/7 and regardless of bad weather conditions), long-term (except for the time of hardware maintenance) lidar observations have been conducted since 2010 (Yin et al., 2021; He et al., 2024; Jing et al., 2024, 2025). This dataset, spanning more than a decade, provides a solid basis for a statistical analysis of the hygroscopicity growth characteristic of urban anthropogenic aerosols.
Due to the rapid urbanization and industrialization in China since the early 21st century, high aerosol loading and complex pollutants have attracted increasing attention (Xie et al., 2016). In response, the Chinese government has implemented a series of emission control policies. Our earlier study showed that annual variations in the anthropogenic aerosol optical depth (AOD) at 532 nm over Wuhan during the past 15 years can be divided into two stages: a rapid decline with a rate of −0.068 yr−1 from 2010 to 2017, followed by a fluctuation period from 2018 to 2024 (Jing et al., 2025). These findings highlight that emission control policies were highly effective in the first stage, whereas their impact weakened in the second stage. We also identified an imbalance in SO2 and NO2 emission reductions, with the NO2-to-SO2 concentration ratio rising sharply from 1.8 in 2014 to 5.3 in 2017 (Jing et al., 2025). This shift likely promoted the formation of secondary aerosols (e.g., particulate nitrate) and partly explained the cessation of the declining trend in the second stage (Liu et al., 2018). Therefore, it is essential to investigate how aerosol hygroscopicity responds to changes in pollutant components, for interpreting the long-term AOD patterns.
In this study, we statistically analyze the hygroscopic growth characteristics of anthropogenic aerosols from 2010 to 2024 using ground-based polarization lidar observations over Wuhan, together with associated radiosonde and reanalysis meteorological data. This paper is organized as follows. Section 2 briefly describes the adopted instruments and data processing methods. Section 3 presents a case study illustrating the identification of aerosol hygroscopic growth cases and the estimation of the hygroscopic growth parameter. Section 4 offers a statistical analysis of the hygroscopic growth parameter γ for anthropogenic aerosols over Wuhan. The last section summarizes the main findings and presents the conclusions.
2.1 Study area
Wuhan (30.5° N, 114.4° E) is a major industrial city in central China with a population of over 13 million, producing abundant urban anthropogenic emissions from sources such as vehicle exhaust and industrial fossil fuel combustion (Zhang et al., 2015a). The city lies in the subtropical monsoon region and experiences four distinctive seasons. In winter, the northeast monsoon brings cold, relatively dry weather (Wu and Wang, 2002). Frequent temperature inversions in the lower troposphere suppress vertical convection and often lead to severe air pollution (Zhang et al., 2021). In summer, the southeast and southwest monsoons cause high temperatures and heavy rainfall, creating favorable conditions for pollution dispersion (Ding et al., 2015). Spring and autumn are the transition phases between these two regimes. Additionally, regional air mass transport also plays a significant role in aerosol loading over Wuhan. In spring and winter, mineral dust from deserts in north and northwest China as well as in Mongolia is frequently long-range transported to Wuhan (He and Yi, 2015; Jing et al., 2024). In summer and autumn, agricultural biomass burning in neighboring provinces sometimes contributes to the poor air quality and severe haze events over Wuhan (Zhang et al., 2014; Jing et al., 2025).
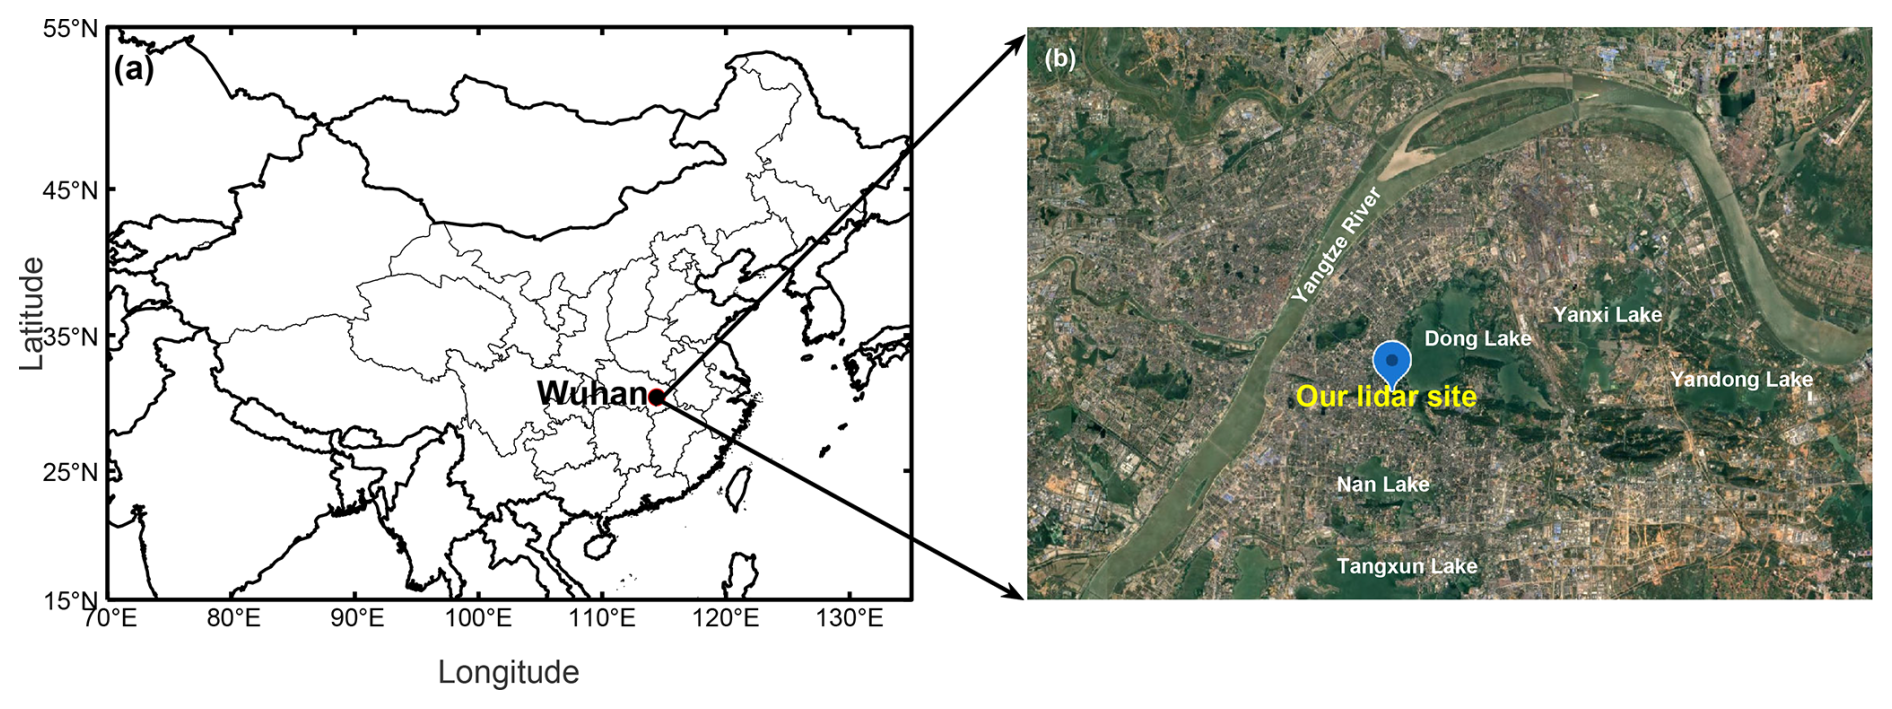
Figure 1Location of Wuhan and our lidar site (Map data © 2025 Google).
Among the major aerosol types in Wuhan, mineral dust is generally considered hydrophobic. In contrast, all the non-dust components are classified as anthropogenic aerosols, which exhibit varying degrees of hygroscopicity due to the inclusion of water-soluble inorganic ions and organic matter. Our lidar site is located in central Wuhan, an area surrounded by an extensive water network (the Yangtze River and numerous urban lakes; Fig. 1), which creates a humid atmospheric environment that facilitates aerosol water uptake. Therefore, particle hygroscopic growth may contribute to the lidar-derived particle backscatter coefficients. In this study, all lidar-derived aerosol optical properties discussed, including the particle backscatter coefficient, extinction coefficient, and AOD, are attributed exclusively to anthropogenic aerosols.
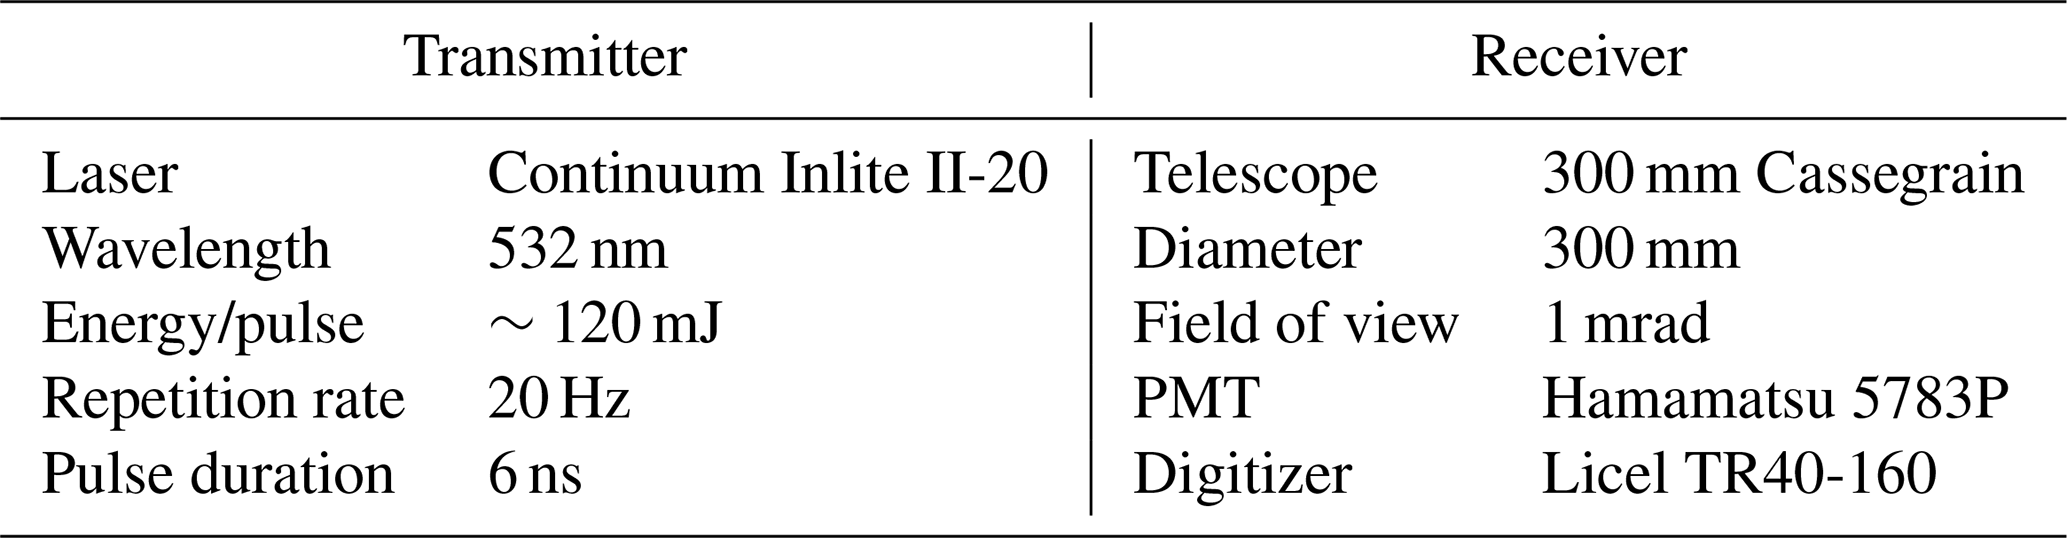
Table 1Specifications of the polarization lidar system at Wuhan University (He et al., 2024).
2.2 Polarization lidar and data processing
Height-resolved aerosol optical properties over Wuhan have been observed using a 532 nm ground-based polarization lidar since October 2010 (Yin et al., 2021; He et al., 2024; Jing et al., 2024, 2025). Detailed specifications of the lidar system were provided in Kong and Yi (2015). In 2017, a transparent waterproof window was installed on top of the lidar container, enabling uninterrupted lidar operations regardless of rainy or snowy weather conditions (Yi et al., 2021). Raw data are stored with a time resolution of 1 min and a vertical resolution of 30 m. The lowermost height with complete field-of-view (FOV) observation is 0.3 km. Specifications of the polarization lidar system are listed in Table 1.
The volume depolarization ratio δv (VDR) is defined as the ratio of perpendicular- to parallel-oriented signals, multiplied by the gain ratio between the two polarized channels, and is used to derive the particle depolarization ratio δp (PDR) (Freudenthaler et al., 2009). The particle backscatter coefficient βp and particle extinction coefficient αp are retrieved using the Fernald method (Fernald, 1984), assuming a fixed lidar ratio of 50 sr (Wang et al., 2016). In addition, the non-dust particle backscatter coefficient βnd is calculated using the polarization-lidar photometer networking (POLIPHON) method as follows (Tesche et al., 2009; Mamouri and Ansmann, 2014):
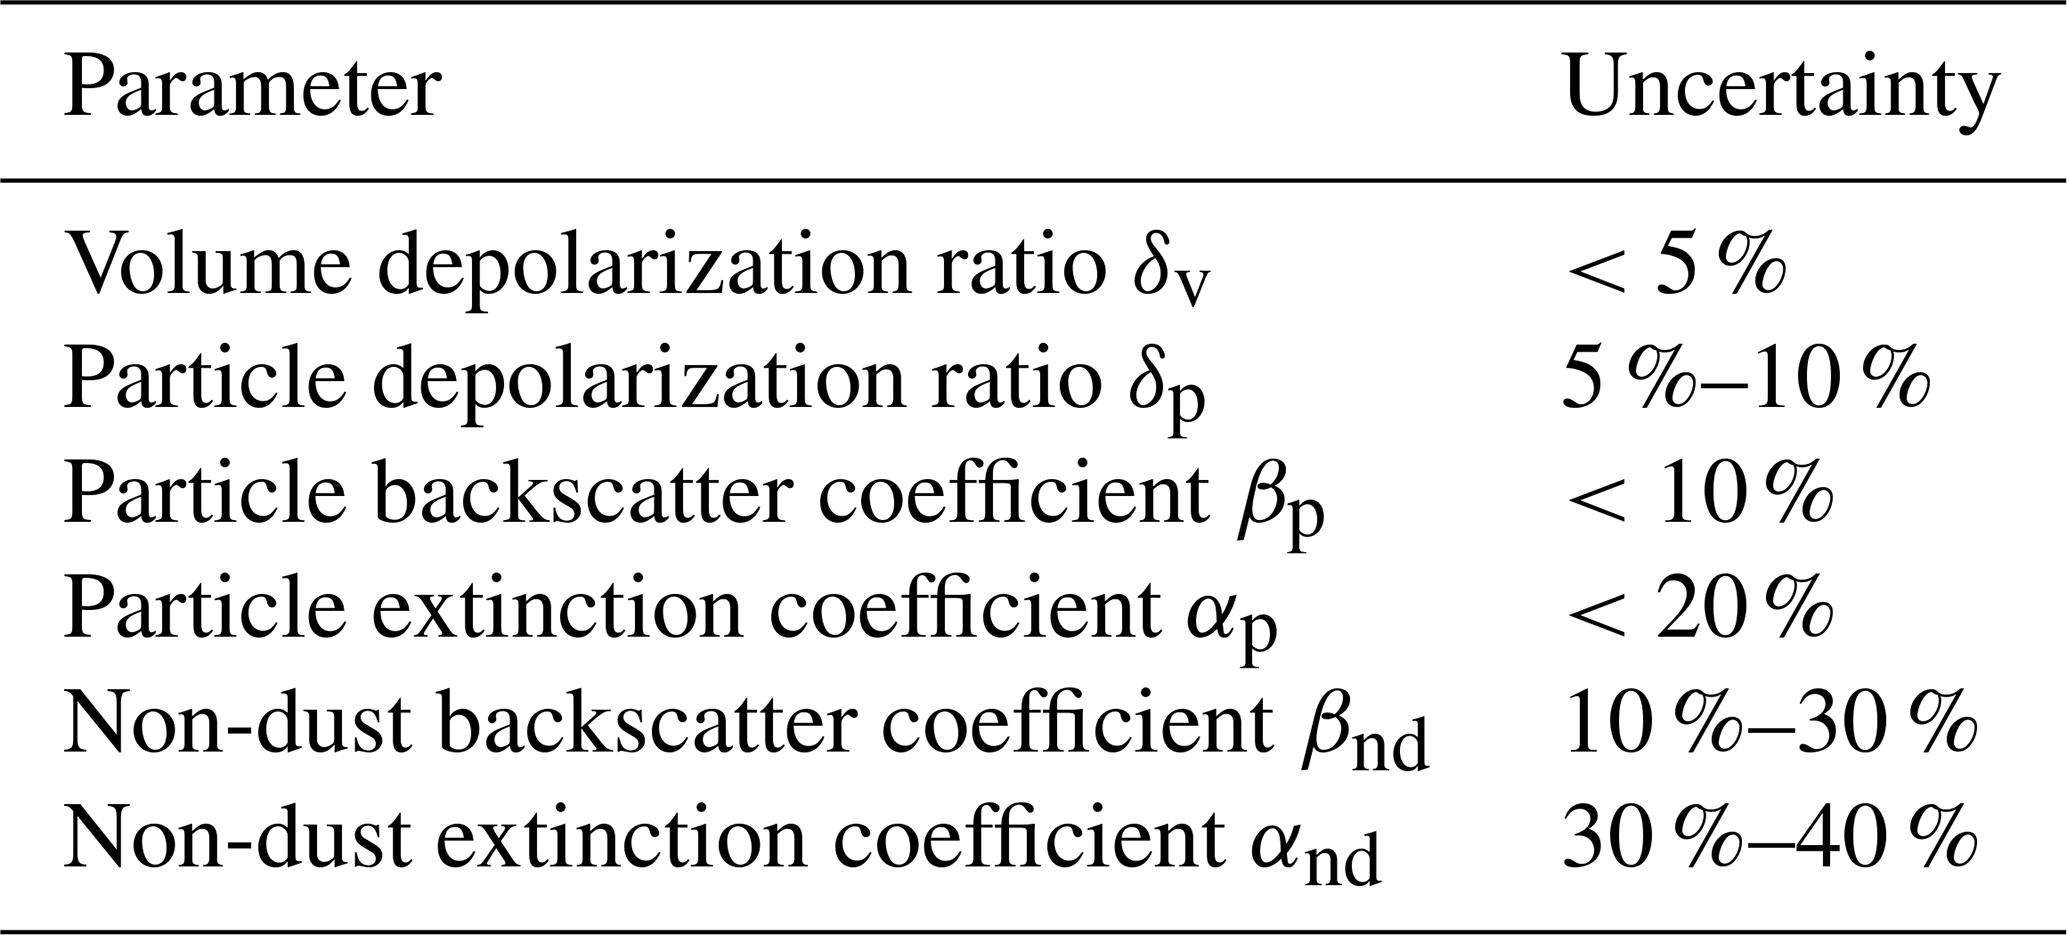
where z represents the altitude; δd=0.31 and δnd=0.05 are the particle depolarization ratios for dust and non-dust, respectively. For each profile, we set βnd(z)=βp(z) if δp(z)<δnd and βnd(z)=0 if δp(z)>δd (Mamouri and Ansmann, 2014). As noted in the previous section, the non-dust component primarily corresponds to anthropogenic aerosols over Wuhan; thus, βnd and αnd represent the optical properties of anthropogenic aerosols. Table 2 lists the uncertainties in the lidar-derived aerosol optical property parameters.
Table 2Estimated uncertainties of the lidar-derived optical properties at 532 nm (Jing et al., 2025).
Cloud-free profiles with signal accumulation times of 30–80 min are obtained using a cloud screening algorithm (Yin et al., 2021). For each cloud-free profile, the particle backscatter coefficient (i.e., total, dust, and non-dust components), and both volume and particle depolarization ratios are retrieved. We utilize the same methodology as Yin et al. (2021) and extend the aerosol profiles to September 2024 (Jing et al., 2025). A total of 24 910 cloud-free profiles are identified from 2139 observational days between October 2010 and September 2024. To avoid potential contamination from severe haze or fog, cloud-free profiles containing one or more vertical bins with extinction coefficients exceeding 1.5 km−1 are excluded. In total, 676 (2.7 % of all) cloud-free profiles are removed from the analysis. This mature dataset is used to further investigate hygroscopic growth.
2.3 HYSPLIT model
The Hybrid Single Particle Lagrangian Integrated Trajectory (HYSPLIT), developed by the National Oceanic and Atmospheric Administration Air Resources Laboratory (NOAA ARL), was used to simulate both forward and backward air mass trajectories (HYSPLIT, 2025). These simulations are driven by meteorological field data from the GDAS archive (Kanamitsu, 1989) and require initialization parameters such as start time, altitude, and geographical location (Draxler and Rolph, 2003; Stein et al., 2015). In this study, three backward trajectories arriving at Wuhan at different altitudes were simulated to trace the potential origins of aerosols at those altitudes.
2.4 Radiosonde data
Two radiosonde launches were conducted daily at 08:00 local time (LT) and 20:00 LT, at 30.6° N, 114.1° E, approximately 24 km away from our lidar site. The sondes measured vertical profiles of temperature, pressure, relative humidity (RH), water vapor mixing ratio, and wind speed/direction from the surface to up to ∼ 30 km altitude. The measurement error for temperature is less than 1 °C, and the uncertainty in RH is below 5 % when the temperature exceeds −10 °C (Nash et al., 2011). The potential temperature θ is defined as (Bolton, 1980):
where T is the temperature (K), P is the atmospheric pressure (hPa), and P0 is the reference pressure of 1000 hPa. In this study, radiosonde data were interpolated to match the corresponding altitude bins of the lidar profiles using a cubic spline interpolation method. This interpolation ensured consistent alignment between radiosonde and lidar measurements, facilitating our analysis of aerosol hygroscopic growth.
2.5 ERA5 reanalysis data
The European Center for Medium-Range Weather Forecasts (ECMWF) reanalysis version 5 (ERA5) (Copernicus Climate Change Service, 2025) provides global atmospheric reanalysis data from January 1940 onward. ERA5 combines model outputs with worldwide observations into a globally consistent and physically constrained dataset (Hersbach et al., 2020). It offers hourly estimates of atmospheric, land, and oceanic climate variables. The boundary layer height (BLH) is the depth of the boundary layer (BL) directly affected by dynamic, thermal, and other surface interactions (Peng et al., 2023). Above the BL is the free troposphere (FT), where aerosols primarily originate from non-local sources (Bourgeois et al., 2018). In this study, ERA5 hourly BLH data (Hersbach et al., 2023) for Wuhan were used to distinguish respective hygroscopic growth cases occurring in the BL and FT. Considering the presence of an aerosol residual layer, the diurnal maximum BLH from ERA5 was adopted as the boundary between the BL and FT.
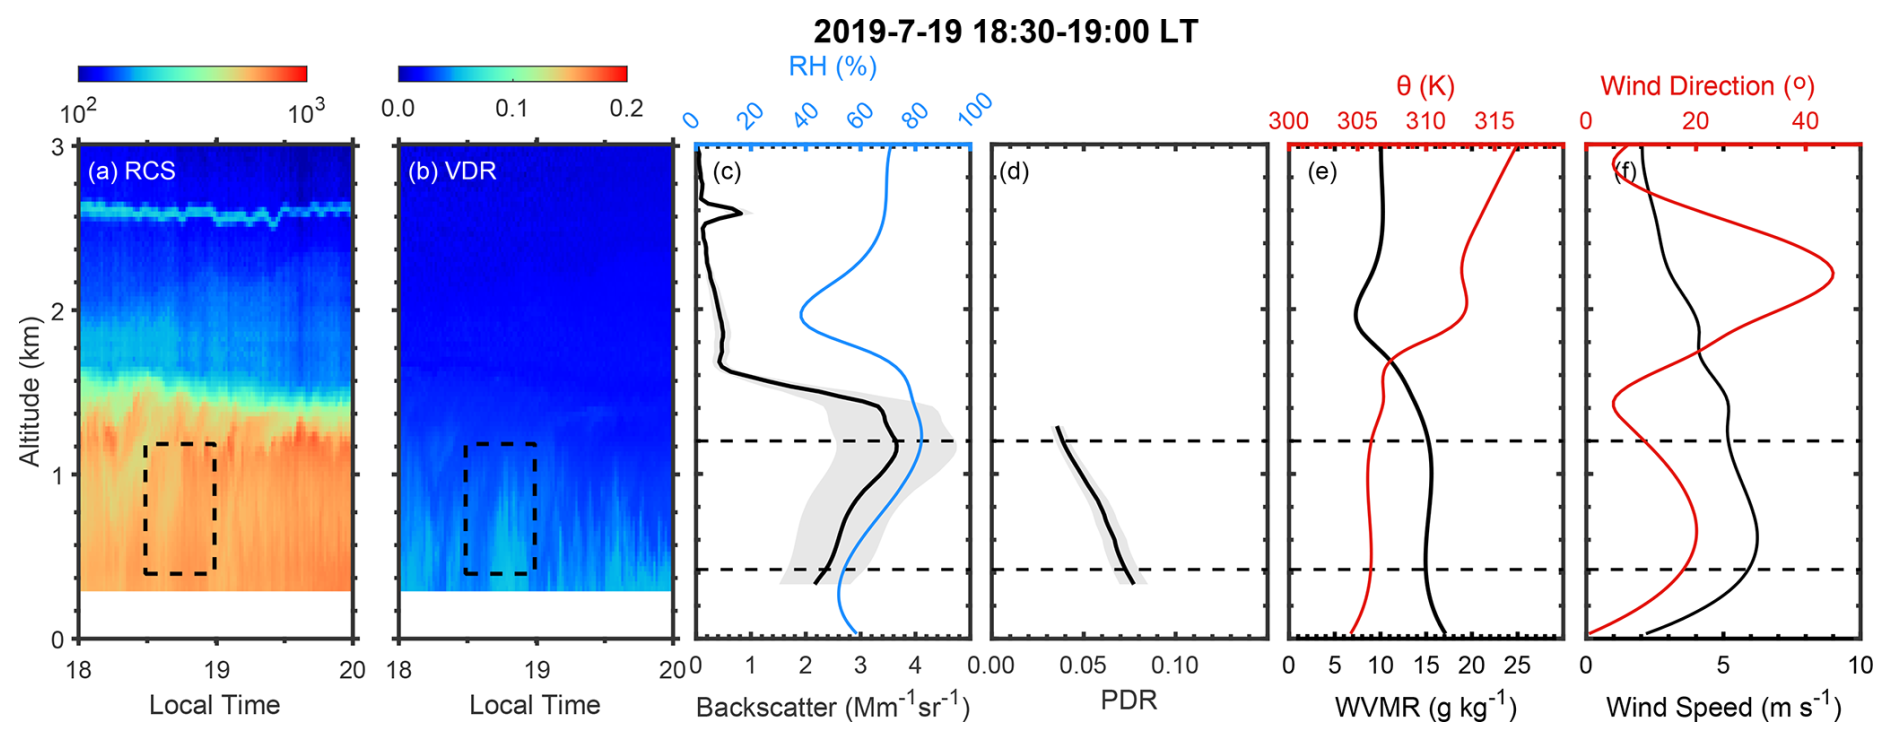
Figure 2Time-height contour plots of (a) range-corrected signal (RCS) and (b) volume depolarization ratio (VDR) measured by polarization lidar over Wuhan at 18:00–20:00 local time (LT) on 19 July 2019. Profiles of (c) backscatter coefficient and relative humidity (RH), (d) particle depolarization ratio (PDR), (e) water vapor mixing ratio (WVMR) and potential temperature, (f) wind speed and direction. The lidar-derived profiles in (c) and (d) are obtained during 18:30–19:00 LT. All the meteorological parameter profiles are obtained from the radiosonde launched at around 20:00 LT on the same day. The grey-shaded areas around the lidar profiles in (c) and (d) denote the uncertainty of lidar-derived optical properties.
Veselovskii et al. (2009) established a methodology to quantitatively estimate aerosol hygroscopicity from lidar measurements under conditions of increasing particle backscatter coefficient with altitude and a constant water vapor mixing ratio, which has been applied and refined in subsequent studies (Granados-Muñoz et al., 2015; Navas-Guzmán et al., 2019; Sicard et al., 2022). In this study, dust and non-dust (anthropogenic) aerosols are assumed to be externally mixed, with their optical properties considered relatively independent. Accordingly, the variation of the anthropogenic particle backscatter coefficient βnd with RH can be analyzed separately. The particle backscatter coefficient enhancement factor fβ (RH) is defined as the ratio of particle backscatter coefficient at a given RH to that under dry conditions (Hänel, 1976):
Lidar-derived cloud-free profiles within 2 h before or after the radiosonde launches (around 08:00 or 20:00 LT) were selected (Sicard et al., 2022). To estimate fβ(RH), we identified the aerosol layers exceeding 300 m thickness and fulfilling the criterion that βnd increase monotonically with simultaneously measured radiosonde RH within the layer. The analysis was limited to altitudes below 7 km. The minimum βnd within an identified aerosol layer was required to exceed 0.5 Mm−1 sr−1 to reduce interference from low signal-to-noise ratios. In addition, the maximum variations in radiosonde meteorological parameters within the identified aerosol layer were constrained as follows to ensure analysis under well-mixed atmospheric conditions (Sicard et al., 2022):
-
Δ water vapor mixing ratio (WVMR) <2 g kg−1;
-
Δ potential temperature (θ) <2 K;
-
Δ wind speed (WS) <2 m s−1;
-
Δ wind direction (WD) <15°.
These criteria ensure that the observed increase in βnd was solely due to particle growth through hygroscopic water uptake, rather than additional emissions or changes in aerosol composition (Granados-Muñoz et al., 2015).
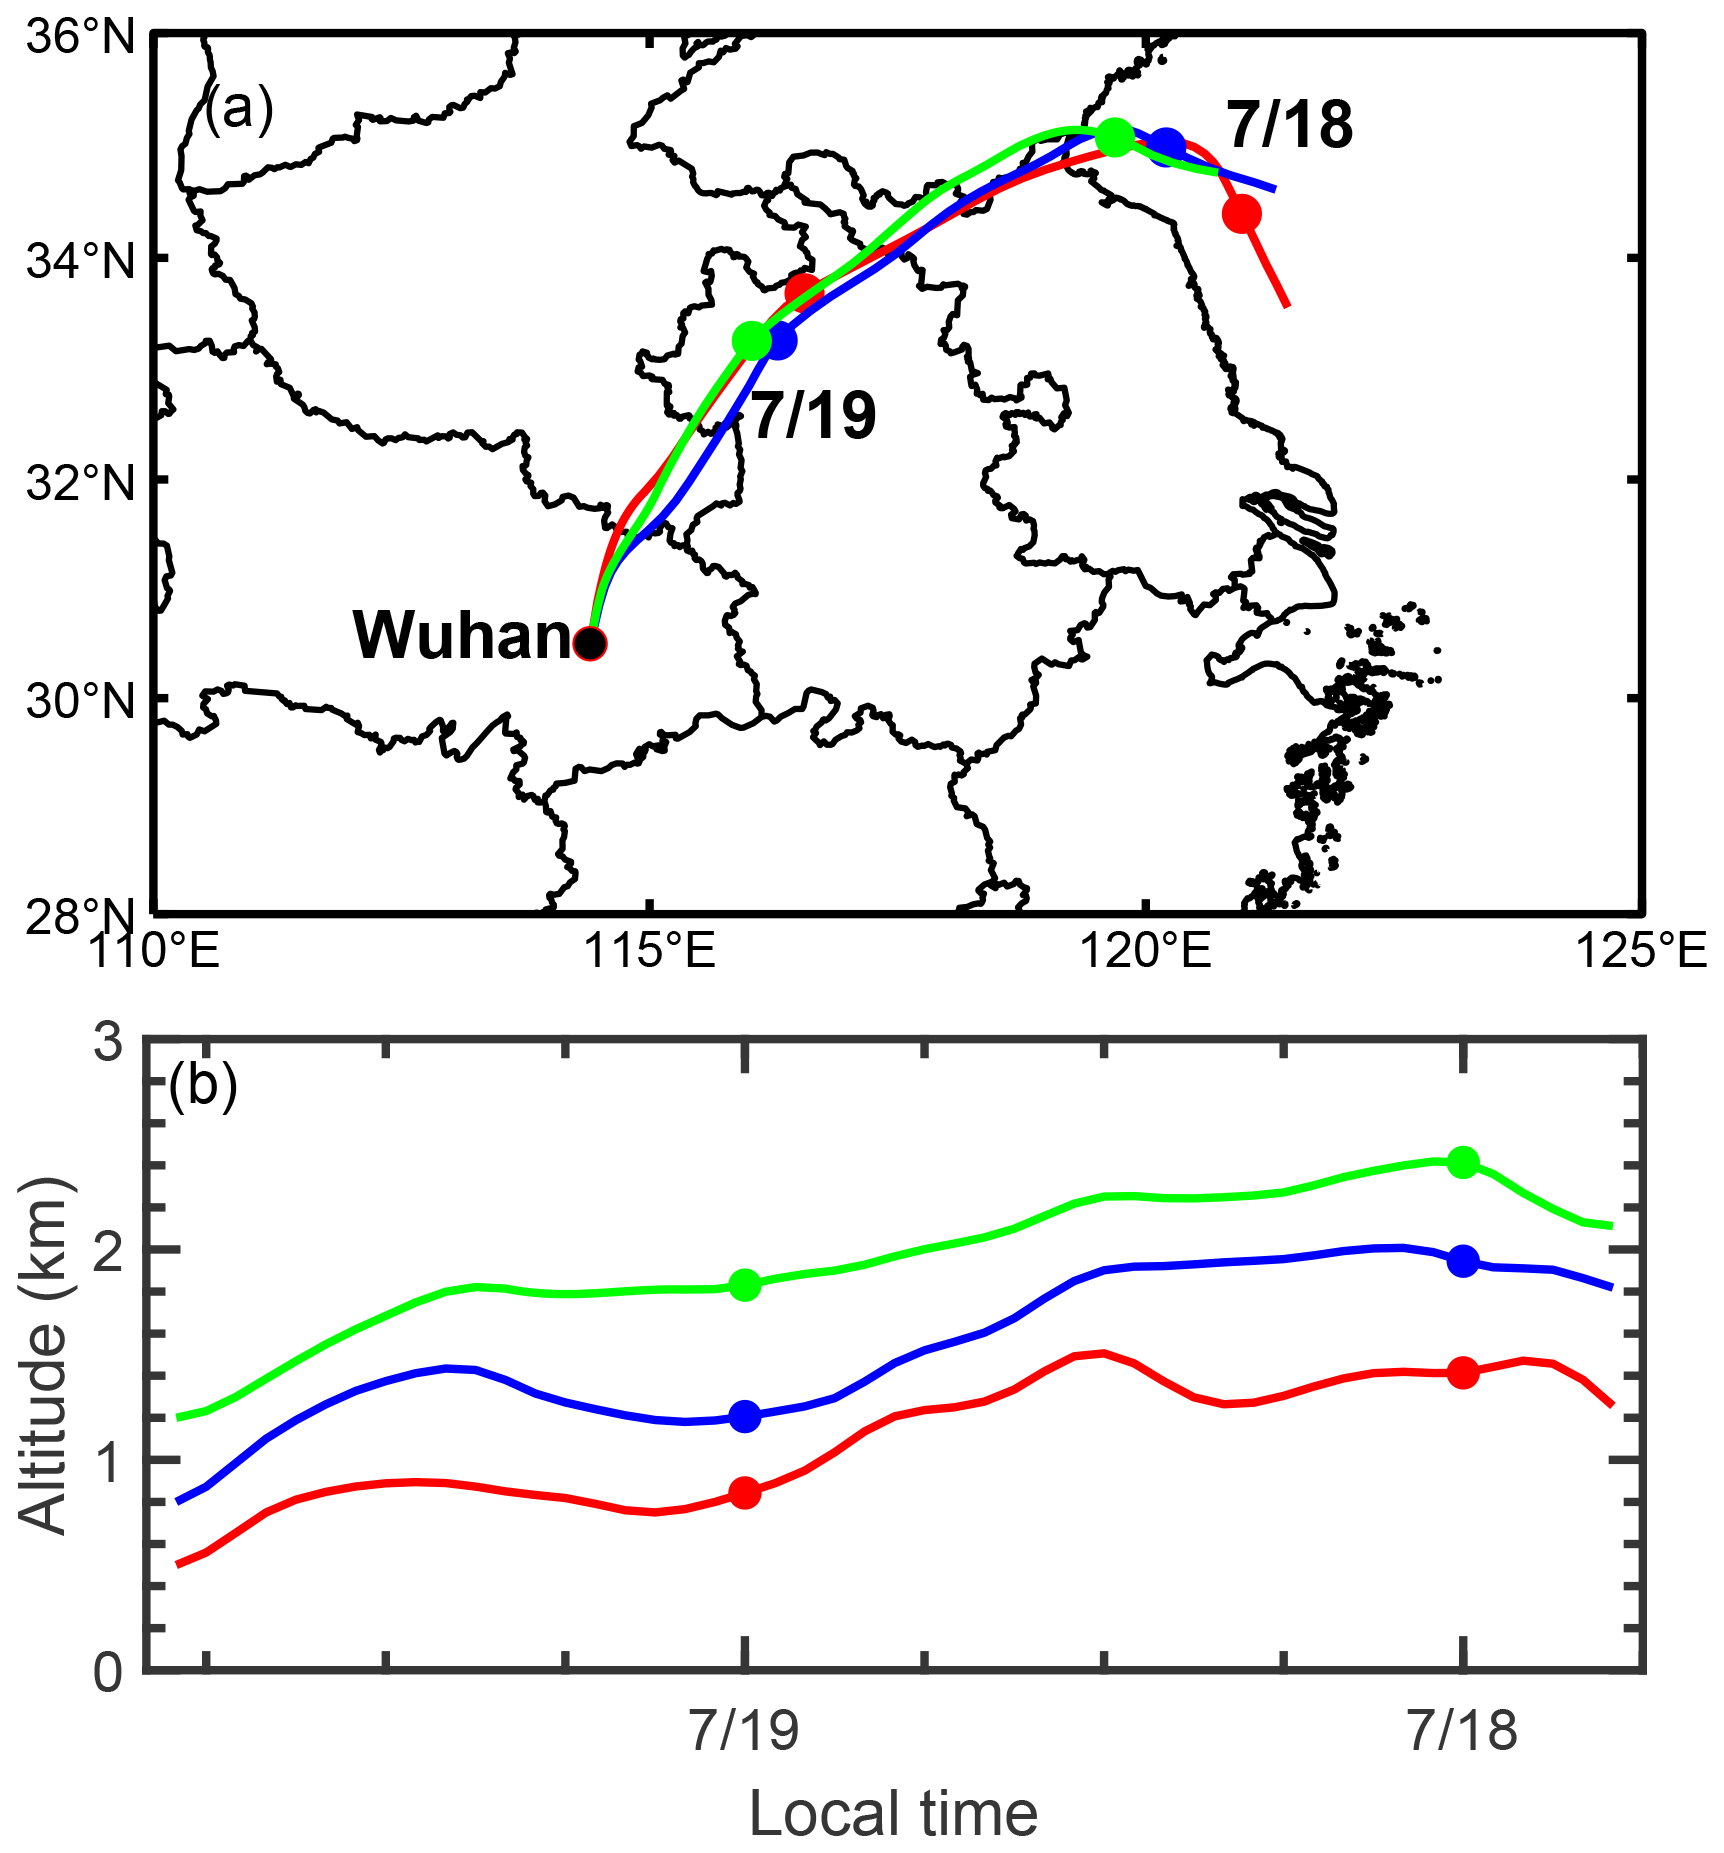
Figure 3HYSPLIT three two-day backward trajectories starting from Wuhan (30.5° N, 114.4° E) at 19:00 LT on 19 July 2019 at altitudes of 0.5, 0.8, and 1.2 km. The solid dots represent 00:00 LT for each day.
Figure 2 shows an aerosol hygroscopic growth case observed at 18:30–19:00 LT on 19 July 2019. As altitude increased from 0.4 to 1.2 km, βnd rose from 2.4 to 3.6 Mm−1 sr−1, while RH increased from 54 % to 82 %. In contrast, the PDR gradually decreased from 0.07 to 0.04, indicating that the particles became more spherical due to water uptake (Miri et al., 2024). The maximum variations in WVMR, θ, WS, and WD were 0.64 g kg−1, 0.28 K, 1.06 m s−1, and 9.49°, respectively, reflecting a homogeneous aerosol layer under well-mixed atmospheric conditions. Three two-day backward trajectories, initialized at 19:00 LT on 19 July at altitudes of 0.5, 0.8, and 1.2 km, all traced back to the coastal region northeast of Wuhan (Fig. 3), suggesting a similar aerosol source across these altitudes. This case is therefore considered representative of the hygroscopic growth behavior of anthropogenic aerosols over Wuhan.
For the selected case, the particle backscatter coefficient enhancement factors fβ (RH) for each altitude bin were calculated using Eq. (3), with a minimum RH (RHmin) of 54 %, as shown by the black dots in Fig. 4. To obtain fβ (RH) for any RH >RHmin, parameterization of the relationship between fβ (RH) and RH is required. Titos et al. (2016) evaluated 11 parameterization fitting methods based on nephelometer measurements and found that, for ambient aerosols, the differences among fitting curves were small, with most showing good agreement with measurements. Among them, the Hänel parameterization has been proved to be feasible and is now widely applied to estimate aerosol hygroscopic growth using lidar and radiosonde data (Veselovskii et al., 2009; Granados-Muñoz et al., 2015; Pérez-Ramirez et al., 2021; Sicard et al., 2022). To ensure comparability, we adopted the Hänel parameterization to fit fβ-Hänel(RH) starting from RHmin as given by Hänel (1976):
where γ is the hygroscopic growth parameter that characterizes aerosol hygroscopicity. In this case, the fitting yielded an R-square of 0.99, indicating excellent agreement with the observations (black line in Fig. 4). The derived γ value of 0.48 suggests that the particles are moderately hygroscopic, typical of urban pollution (Bedoya-Velázquez et al., 2018). This result further indicates that although the trajectory traced back to coastal regions, marine aerosols (e.g., sea salt) have been largely removed by sedimentation, leaving an extremely limited influence of sea salt in Wuhan.
Although γ is independent of RHmin, fβ-Hänel(RH) depends on the specific RHmin chosen in each case. To ensure comparability and consistency, we define fref(RH) as the particle backscatter coefficient enhancement factor referenced to a unified RH value (RHref). Both fref(RH) and its parameterized fitting fref-Hänel(RH) can be extrapolated from fβ(RH) and fβ-Hänel(RH) using the following equations (Sicard et al., 2022):
where RHref=40 %. For RH<40 %, fref(RH) was set to 1. This assumption may underestimate fref(RH) by up to 25 % for highly hygroscopic aerosols (γ>1), and by 10 %–15 % for moderately hygroscopic aerosols (γ<0.5) (Titos et al., 2016). Moreover, the uncertainty in the particle backscatter coefficient enhancement factor can reach 38 % at RH >95 % (Adam et al., 2012). The resulting fref-Hänel(RH) is shown in Fig. 4 by the blue dashed curve. At RH =85 %, fref-Hänel(RH) is 1.93, indicating that the backscatter coefficient increases by a factor of 1.93 compared to dry conditions as RH increases from 40 % to 85 %.
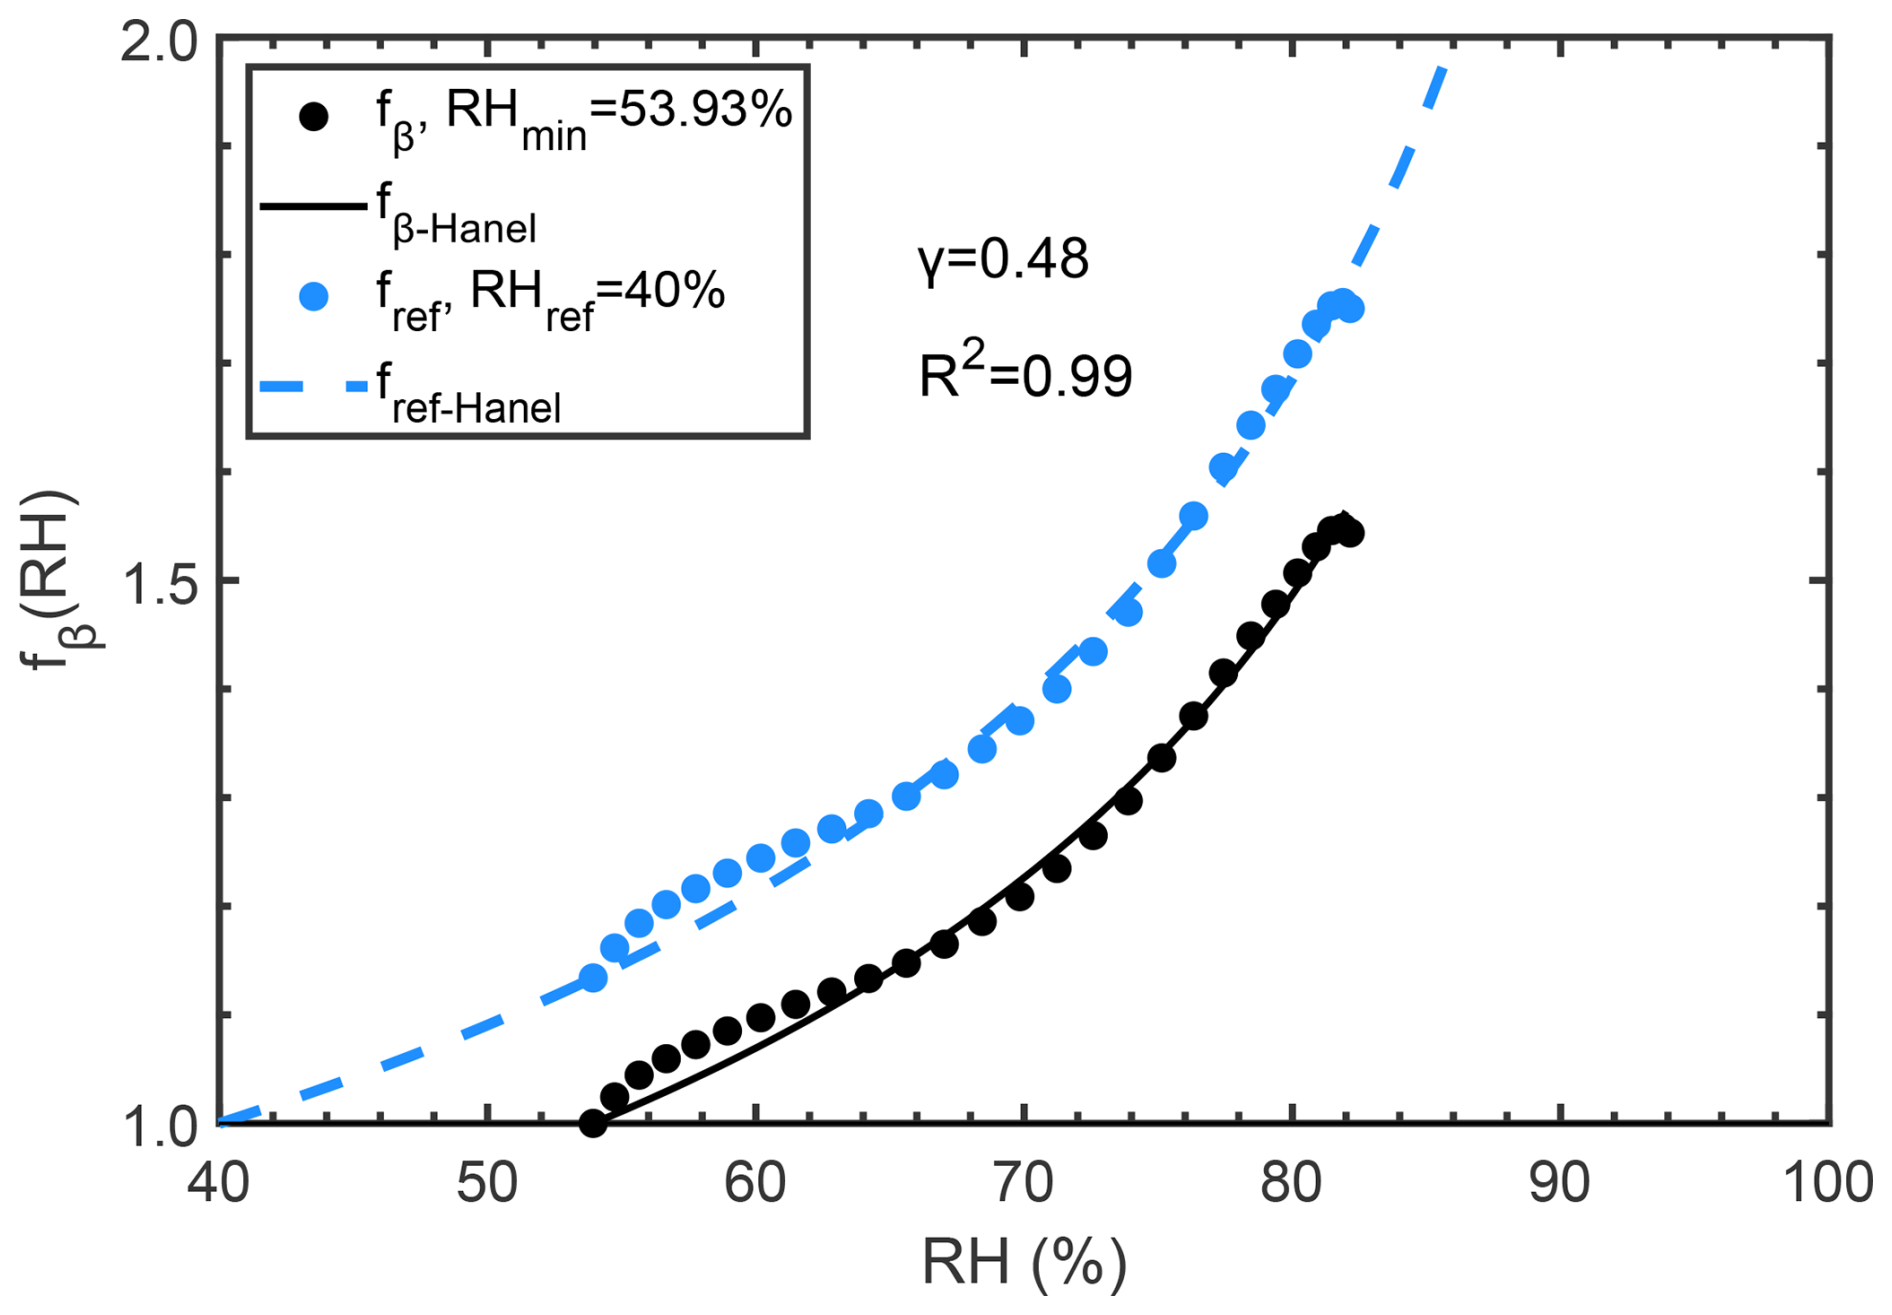
Figure 4The particle backscatter coefficient enhancement factors between RH values of 54 % and 82 % (black dots) and the corresponding Hänel fit (black line). The extrapolated particle backscatter coefficient enhancement factors and Hänel fit referenced to RHref=40 % are also shown (blue dots and dashed line).
In this study, only anthropogenic aerosols were considered, while the influence of natural aerosols, such as mineral dust or sea salt, was excluded. Hygroscopic growth parameters for mineral dust are known to be very low, with γ values of 0.20 at 355 nm and 0.12 at 1064 nm (Navas-Guzmán et al., 2019). For marine aerosols, γ has been estimated as 1.49 for pure sea salt (Haarig et al., 2017) and 1.1 for a mixture of sulfate and sea salt (Granados-Muñoz et al., 2015). As Wuhan is an inland city far from the ocean, the impact of marine aerosols is minimal; therefore, cases with γ<0.2 or γ>1.1 were treated as outliers and excluded from the analysis.
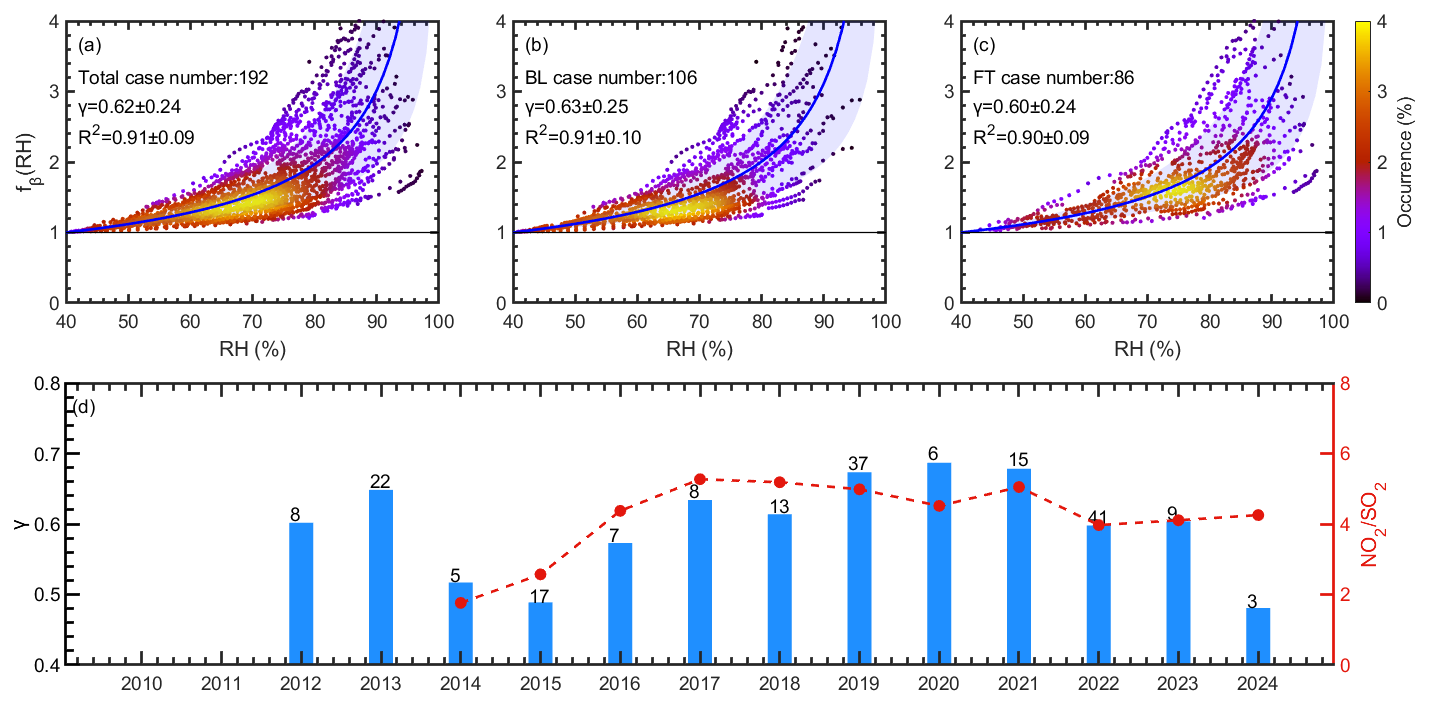
Figure 5Probability density distribution of the particle backscatter coefficient enhancement factors (RHref=40 %) of (a) 192 selected hygroscopic growth cases describing the aerosol conditions in the low and middle troposphere (0–7 km); (b) 106 cases in the boundary layer; (c) 86 cases in the free troposphere during 2010–2024. The Hänel fits (blue solid line) were calculated with the mean hygroscopic growth parameter γ=0.62. The shaded area represents the standard deviation of the Hänel fit line. (d) Bar plot of the annual mean γ during 2010–2024. The case number for each year is presented at the top of each bar. The red dashed line represents the evolution of the annual mean NO2-to-SO2 concentration ratio during 2014–2024 (Jing et al., 2025).
4.1 Statistics of hygroscopic growth parameter
Figure 5 presents the probability density distribution of the particle backscatter coefficient enhancement factor fref(RH) for 192 identified cases from lidar observations during 2010–2024. The average R2 value of 0.91 indicates a good fit with the Hänel parameterization for most cases. The average γ value was 0.62 ± 0.24, represented by the blue curve and shaded area, corresponding to fref-Hänel(85 %) of 2.36, with a range of 1.69–3.29 when including the standard deviation. The γ value in the BL (0.63 ± 0.25) was comparable to that in the FT (0.60 ± 0.24). The mean RH in the lower and middle troposphere was 71.2 ± 12.5 % (68.4 ± 12.0 % in the BL and 75.3 ± 12.1 % in the FT), corresponding to the highest probability density area (in yellow). This suggests that most hygroscopic growth of urban anthropogenic aerosols in Wuhan occurred under high RH conditions of around 60 %–80 %. The particle backscatter coefficient enhancement factor fref-Hänel(85 %) exhibited a broad distribution from 1.32 to 4.53, corresponding to γ values of 0.20–1.09, likely reflecting the diverse hygroscopicity properties of urban particles in Wuhan. Rapid urbanization over the past decades has exposed the city to numerous pollutants, including various water-soluble inorganic ions, elemental carbon, and organic matter, etc. (Zhang et al., 2015a). Both chemical composition and particle size significantly influence aerosol hygroscopicity characteristics (Zieger et al., 2010, 2013), resulting in a variety of hygroscopic aerosol types.
In the previous section, dust and anthropogenic aerosols are assumed to be externally mixed. However, the internally mixing conditions are unavoidable for East Asian dust events (Xu et al., 2020), which may lead to misclassification of “coated dust” as “anthropogenic” by the POLIPHON method. To assess the potential influence of internally mixed dust, a sensitivity analysis was conducted. Given that the δp during dust events over Wuhan varies between 0.1 and 0.3 (Jing et al., 2024), the threshold value for pure dust δd (in Eq. 1) was reduced to lower values of 0.10–0.25, thereby making the extraction of “anthropogenic aerosols” more conservative. As a result, the γ increases only slightly by 0.02 (0.62 to 0.64). Moreover, approximately 54.7 % cases in this study show no dust interference, and for the remaining cases the dust optical depth (DOD) does not exceed 0.05. It can be concluded that the error introduced by potential misclassification is limited.
The annual mean γ from 2010–2024 is presented in Fig. 5d, with the number of identified cases for each year indicated at the top of each bar. The annual mean γ generally ranged from 0.5 to 0.7. Notably, the annual mean γ sharply increased from 0.49 in 2015 to 0.63 in 2017, and stabilized high between 0.6 and 0.7 after 2018. The evolution of the annual mean NO2-to-SO2 concentration ratio in Wuhan from 2014 to 2024 is also presented in figure 5d (red dashed broken line), which closely follows the trend of γ. The NO2-to-SO2 concentration ratio increased sharply from 1.8 in 2014 to 5.3 in 2017, and varied between 4 and 6 during 2018–2024, suggesting that the disparity in emission control measures for these two gaseous precursors, i.e., favoring more particulate nitrate formation, likely contributes to the increase in γ after 2017. Chen et al. (2019) reported that a higher nitrate fraction in an aerosol mixture enhances aerosol hygroscopicity under the same RH conditions. In addition, our previous study showed that the anthropogenic AOD at 532 nm over Wuhan declined during 2010–2017 due to strict emissions control policies, but this downward trend ceased from 2018 onwards (Jing et al., 2025). The relatively higher γ values post-2017 result in a larger backscatter coefficient enhancement factor, indicating that AOD values after 2017 contain more contributions from hygroscopic growth effect, which partly offsets the effectiveness of emission control policies.
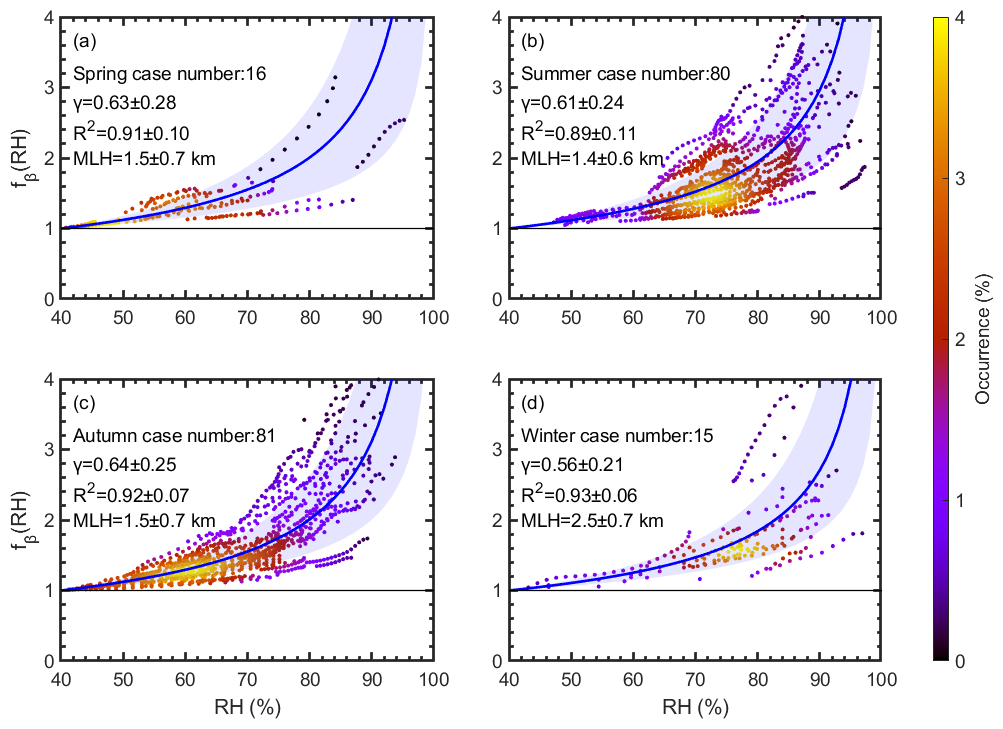
Figure 6Probability density distribution of the particle backscatter coefficient enhancement factors (RHref=40 %) of selected hygroscopic growth cases in (a) spring, (b) summer, (c) autumn, and (d) winter. The Hänel fits (blue solid curve) were calculated with the mean hygroscopic growth parameter γ for each season. The shaded areas represent the standard deviation of Hänel fits.
Figure 6 presents the seasonal variation of the particle backscatter coefficient enhancement factors, derived from the 192 identified cases. Seasons are defined as spring (March–April–May), summer (June–July–August), autumn (September–October–November), and winter (December–January–February). Most cases occurred in summer (80) and autumn (81), as dust is commonly present in spring and winter (Jing et al., 2024) and was therefore excluded from the analysis. There is no significant seasonal difference in γ, with a maximum of 0.64 in autumn and a minimum of 0.56 in winter, corresponding to fref-Hänel(85 %) values of 2.43 and 2.17, respectively, i.e., a difference of approximately 11 %. Urban pollutants emitted from human activities do not vary substantially with seasons, except for nitrate, which shows the highest fraction in PM2.5 during winter (Zhang et al., 2015a).
To explain why the fraction of nitrate in Wuhan is the highest in winter, while γ is the lowest (0.56), the mean layer heights (MLH) for cases in the four seasons are presented in Fig. 6. The MLH in winter is 2.5 km, higher than the 1.4–1.5 km observed in other seasons, likely due to frequent dust intrusions below 1.5 km in winter (Jing et al., 2024). However, anthropogenic aerosols in winter are usually concentrated below 1.5 km (Jing et al., 2025). Therefore, the winter analyzed here represents hygroscopic growth effect at higher altitudes in the free troposphere, where the atmosphere is relatively clean, rather than surface-level pollution. Chen et al. (2019) reported an extremely low γ of 0.1 under clean conditions, revealing that the hygroscopicity of clean air is lower than that of polluted air. Similarly, Sicard et al. (2022) found only slight seasonal variation in γ values in Barcelona, with a maximum of 0.58 in summer and a minimum of 0.53 in autumn. They interpreted this season-independent γ as recirculation layers of pollutants above the BL, caused by strong insolation, weak synoptic forcing, sea breezes, and mountain-induced winds (Pérez et al., 2004).
Table 3 summarizes hygroscopic growth parameters from this study in Wuhan and from the existing literature measured elsewhere. A variety of aerosol mixtures was examined, with γ values varying from 0.24 for mixtures dominated by hydrophobic particles, such as dust, to 1.1 for highly hygroscopic aerosols (e.g., marine aerosols and inorganic salts). To analyze the causes of the lidar-observed aerosol hygroscopic growth, many studies indirectly inferred the aerosol composition through backward trajectories and optical properties (e.g., Ångström exponent, complex refractive index, depolarization ratio) (Veselovskii et al., 2009; Granados-Muñoz et al., 2015; Sicard et al., 2022; Haarig et al., 2025). Miri et al. (2024) introduced fluorescence capacity, which was not affected by water vapor, to distinguish aerosol components (with biological aerosols exhibiting higher fluorescence, and pure dust or urban aerosols demonstrating lower fluorescence). Ground-based aerosol chemical speciation monitor (ACSM) was also used to explain the hygroscopic growth behavior of aerosols through ground-level chemical composition analysis (Lv et al., 2017; Bedoya-Velásquez et al., 2018; Chen et al., 2019; Wu et al., 2020). Pérez-Ramirez et al. (2021) provided the first airborne in situ measurements for chemical composition determination, confirming that sulfates and water-soluble organic carbon are the main contributors to the aerosol hygroscopic growth observed by lidar, with γ values of 0.38–0.39. In addition, Laly et al. (2025) combined lidar-based hygroscopic growth estimation with chemical species data from the Copernicus atmospheric monitoring service (CAMS), showing that γ was significantly higher in regional pollution cases affected by sea salt (0.87 and 1.52) compared with those without sea salt influence (0.30–0.75).
The γ value from this study (0.62 ± 0.24) is slightly higher than that reported by Sicard et al. (2022) (0.55 ± 0.23), who conducted a statistical analysis of hygroscopic growth parameters for local/regional pollutants and sea salt aerosols without dust interference in Barcelona, Spain. Several factors may explain this difference. First, although sea salt was not considered in the present study, we speculate that the diverse inorganic salts emitted from extensive human activities in Wuhan probably contributed significantly to the observed strong hygroscopicity. Liu et al. (2014) found that the fractions of ammonium, nitrates, and sulfate are strongly correlated with aerosol hygroscopicity. Similarly, He et al. (2016) identified a region of high hygroscopic growth in Eastern China, corresponding to large-scale industrial districts with substantial emissions of inorganic salts, such as sulfates and nitrates. Wu et al. (2020) also measured a γ value of 1.14 for fine-mode inorganic salts in urban pollution over Beijing. Second, both Sicard et al. (2022) and this study are based on lidar observations within two hours before and after the radiosonde launches (00:00 and 12:00 UTC). During this period, Barcelona corresponds to noon or midnight (UTC+1 in winter and UTC+2 during daylight saving time). In contrast, Wuhan (UTC+8) experienced the morning and evening rush hours, which contribute substantially to traffic emitted NO2. Zhang and Cao (2015b) found two NO2 emission peaks in Chinese megacities (Beijing, Shanghai, and Guangzhou, which have traffic patterns similar to Wuhan) between 07:00–10:00 and 19:00–22:00 local time. As discussed previously, higher NO2 emissions favor the formation of hygroscopic nitrate particles, contributing to the larger γ values observed in Wuhan.
Table 3Comparisons of the 532 nm lidar-estimated hygroscopic growth parameter γ at RHref=40 %, obtained using the Hänel fitting method for pollutants or aerosol mixtures. The results from this study alongside those reported in previous studies are provided.
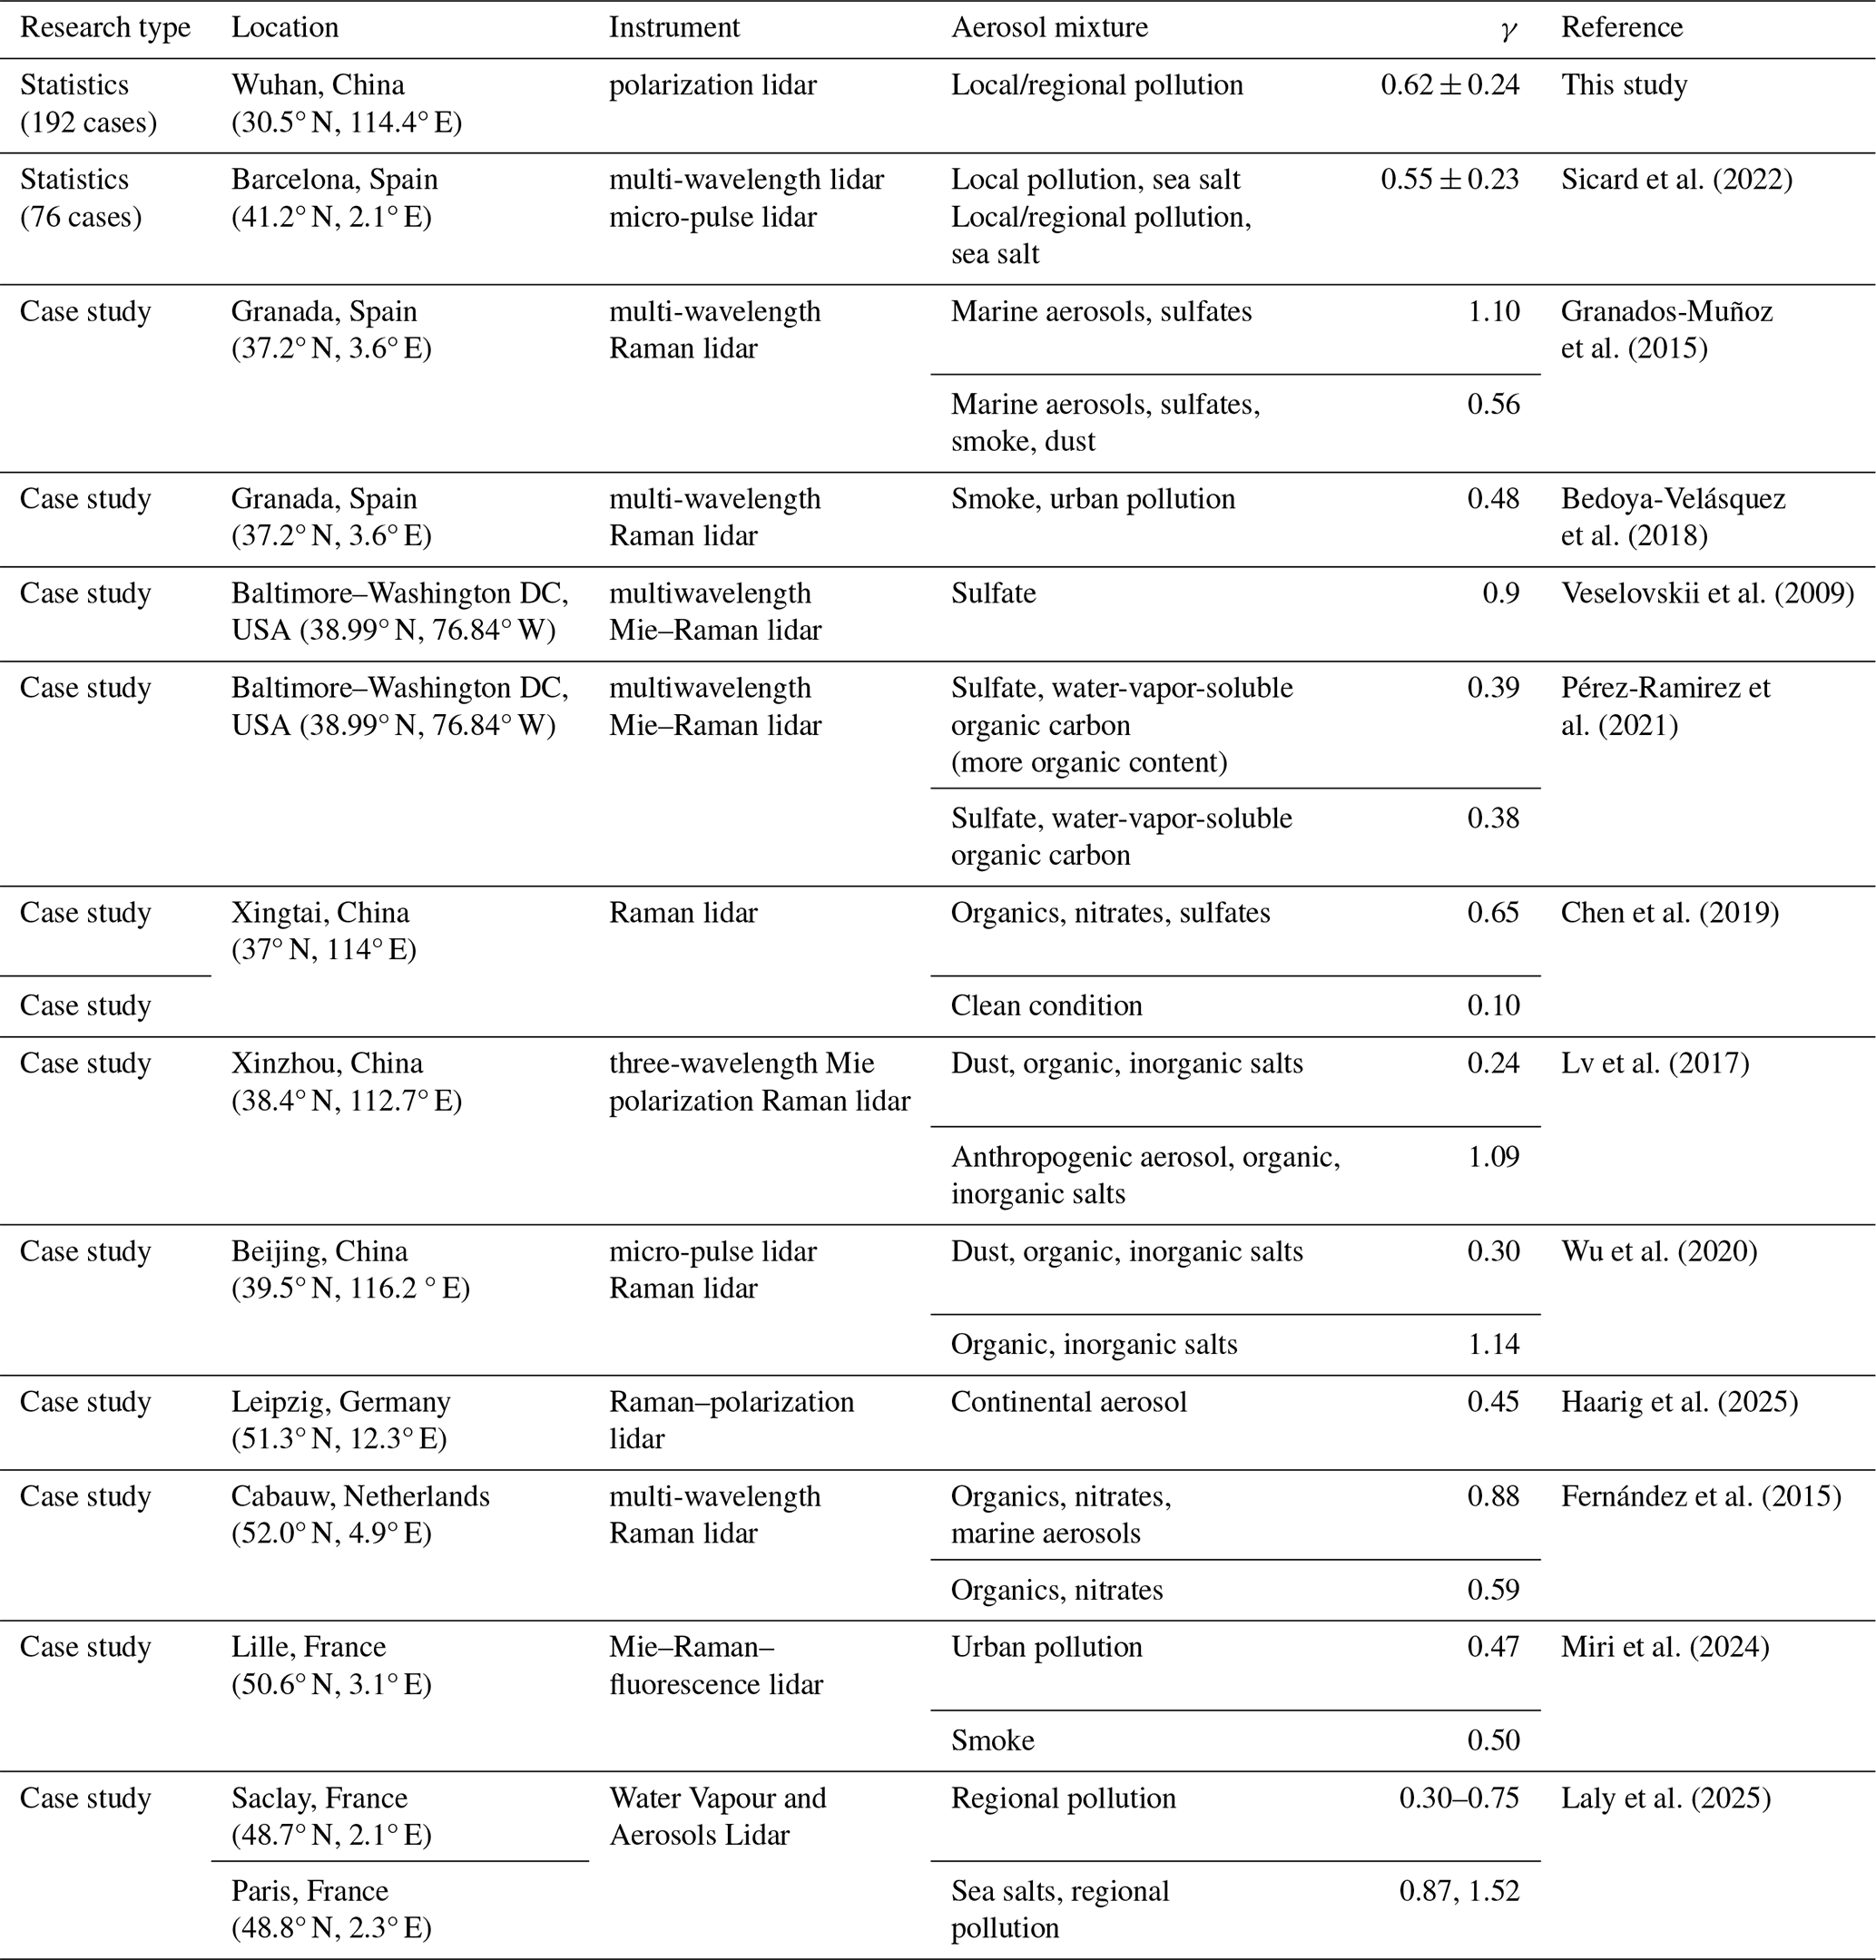
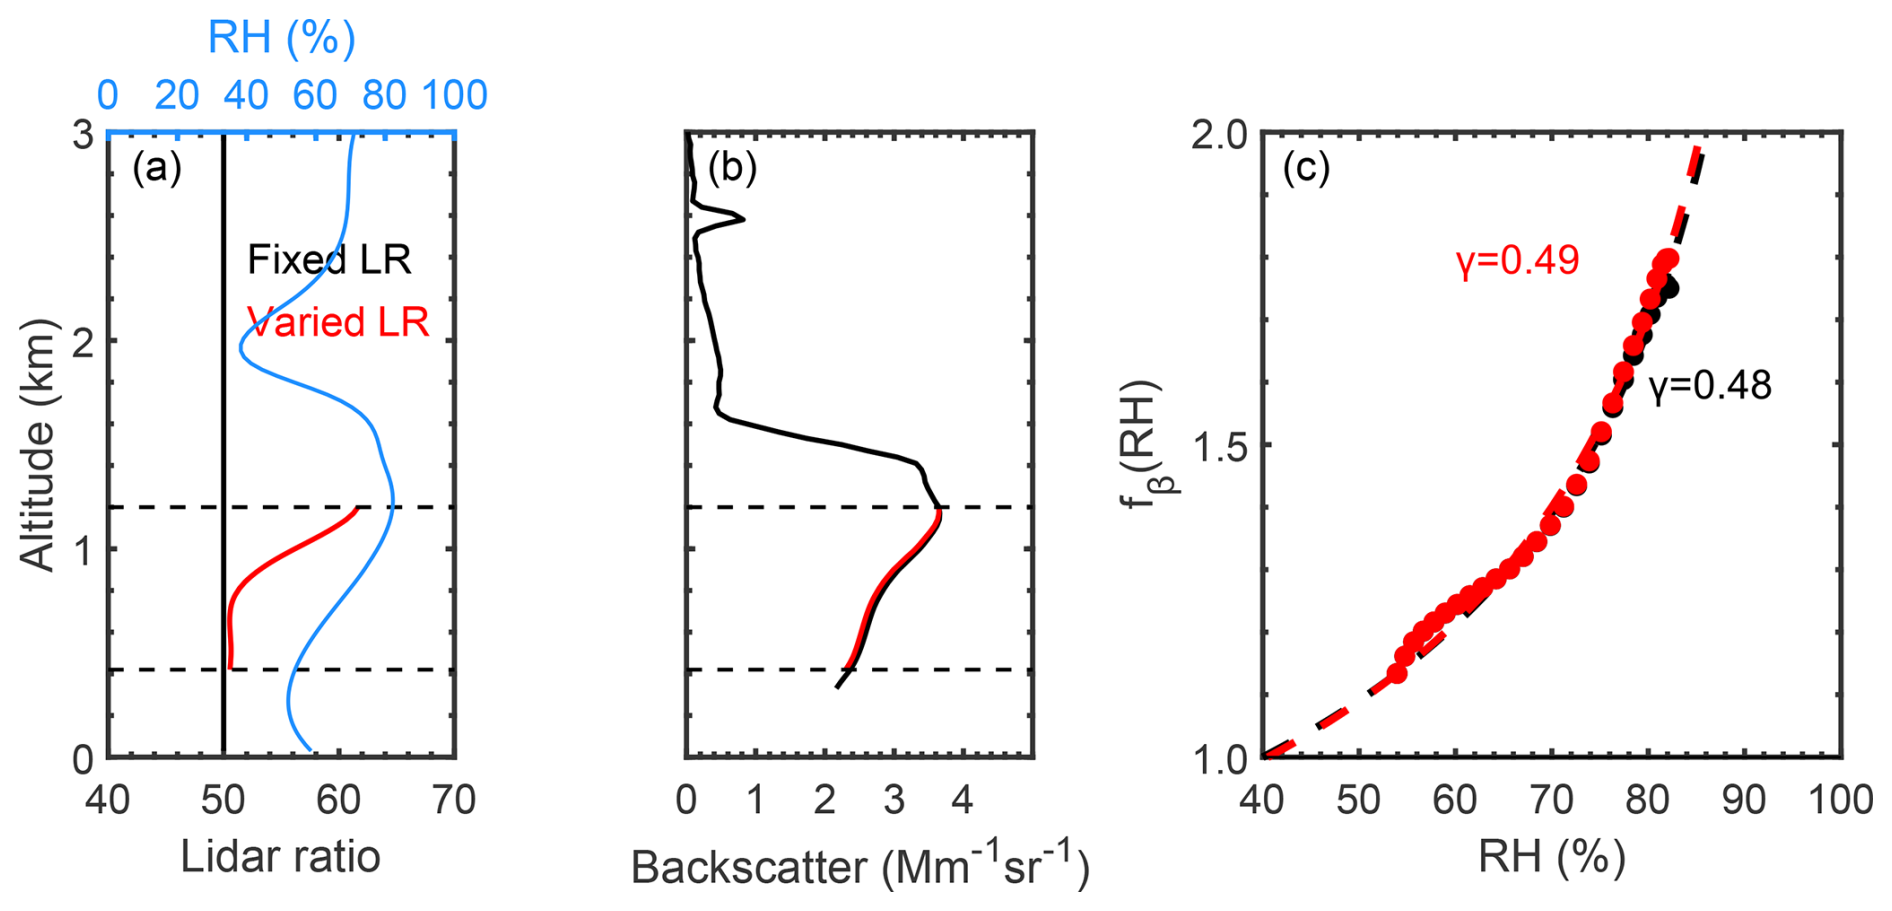
Figure 7A case to illustrate the difference of hygroscopic parameter γ between using a fixed LR and a variable LR over Wuhan at 18:30–19:00 LT on 19 July 2019. Profiles of (a) lidar ratio and RH, (b) backscatter coefficient; (c) the particle backscatter coefficient enhancement factors calculated by the Hänel method are presented. The black and red lines represent profiles derived by a fixed LR of 50 sr and variable LR, respectively.
4.2 The uncertainty introduced by assuming a fixed lidar ratio
In Sect. 2, the backscatter coefficient βp is retrieved by the Fernald method with a fixed lidar ratio (LR) of 50 sr (Fernald, 1984). However, the hygroscopic growth process can lead to an increase in LR under high RH conditions in previous studies: Veselovskii et al. (2025) found that during the hygroscopic growth, the extinction increases more rapidly than the backscatter; Haarig et al. (2025) estimated the LR enhancement factor of 1.43 when RH =90 %. While the polarization lidar cannot measure the LR for specific cases like the Raman lidar. Zhao et al. (2017) have estimated a relational expression between LR and RH through 532 nm micro-pulsed lidar and Mie model:
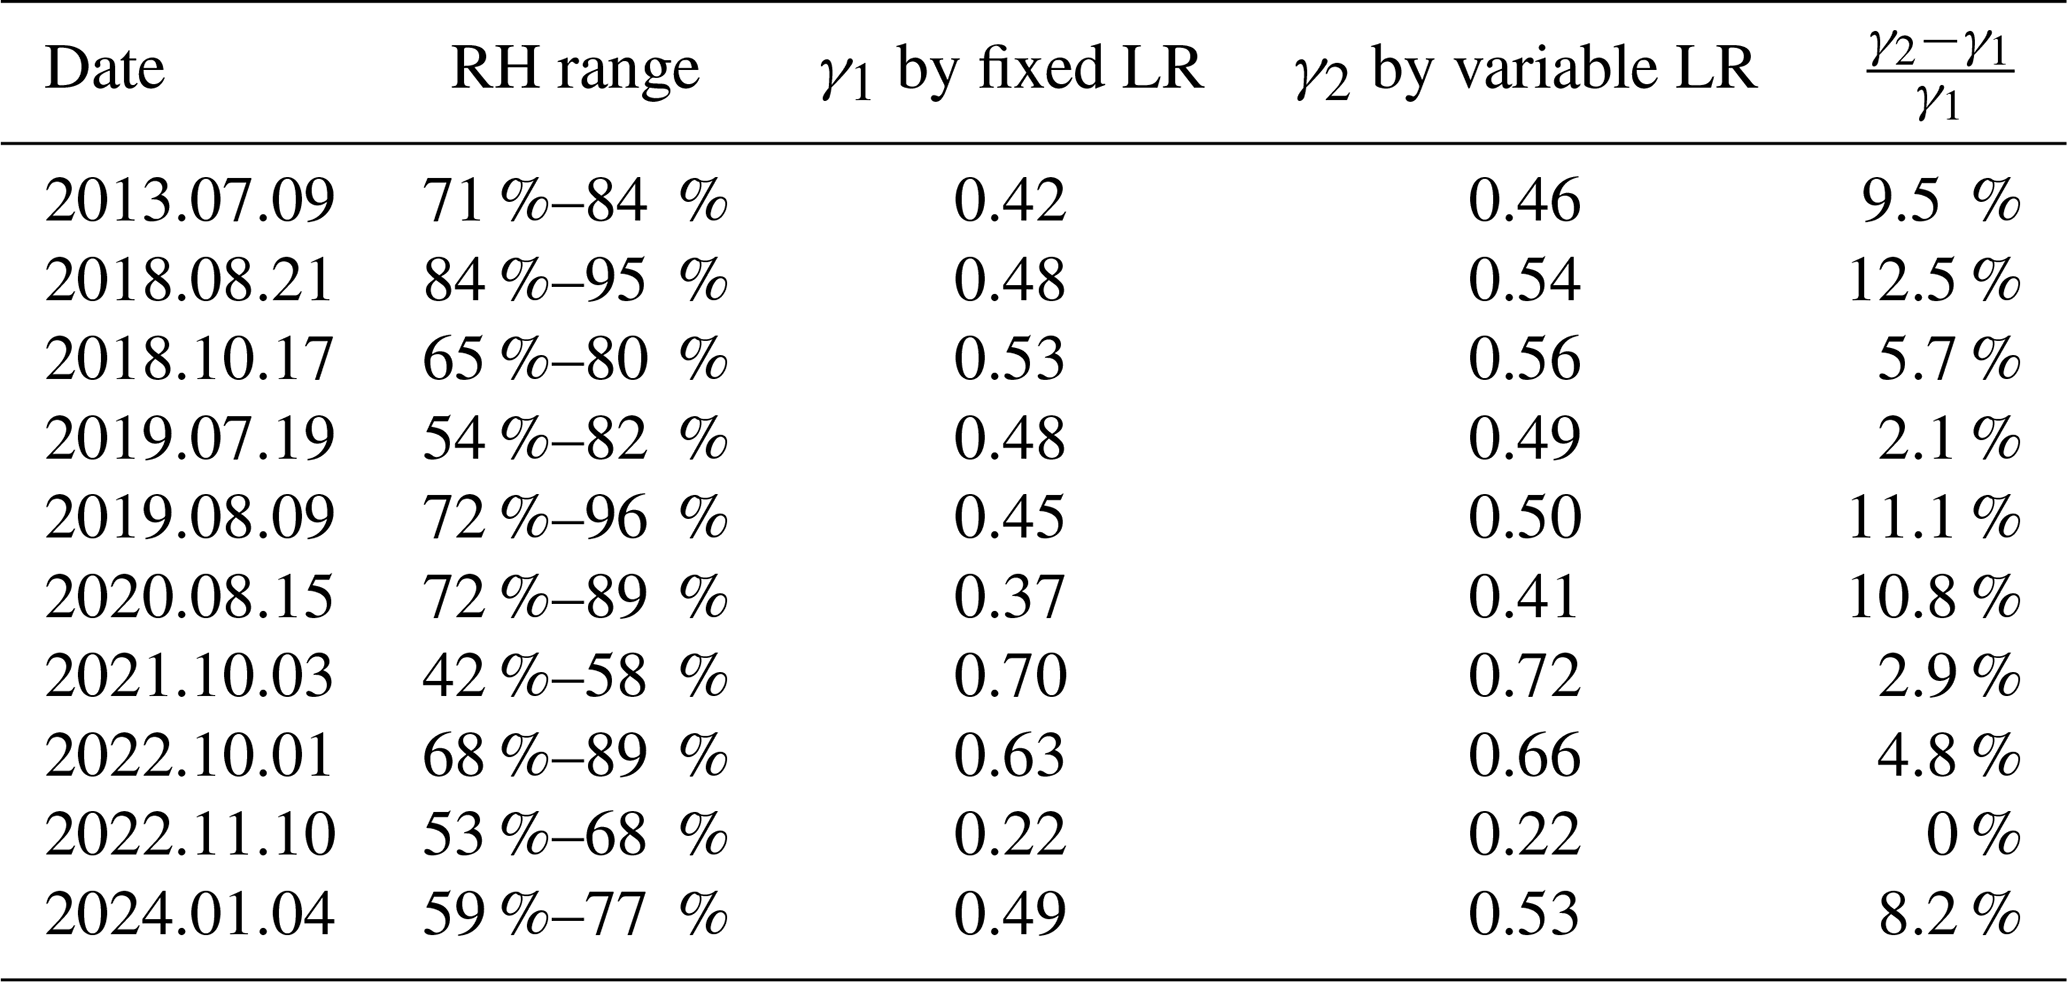
where LRdry represents the LR under dry conditions. The fixed LR of 50 sr represents an average value derived from combined lidar and sun photometer measurements in the ambient troposphere (Takamura et al., 1994). Based on radiosonde data, the average RH in the lower troposphere over Wuhan is approximately 40 %–70 % (Guo et al., 2023). Accordingly, LRdry=47 sr in Eq. (7) was set, such that an LR of 50 sr corresponds to RH values of approximately 50 %–55 %. It should be mentioned that our analysis focuses on the variation of LR within the identified particle-hygroscopic-growth layers. Taking the case from 19 July 2019, presented in Sect. 3 as an example, Fig. 7 illustrates the influence of variable LR on hygroscopic parameter γ. The LR increases with rising RH, and the derived backscatter coefficient (in red curve) shows a slight deviation from the original profile (in black curve). The derived γ increases by 2.1 % from 0.48 to 0.49. Furthermore, Table 4 summarizes 10 cases covering RH ranges of 40 %–100 %. The variable LR generally causes an increase in γ of <10 %, with the largest increase up to 12.5 % under high RH conditions. The uncertainty introduced by assuming a fixed LR becomes more pronounced under higher RH conditions.
Table 4Comparisons of hygroscopic growth parameter γ: fixed LR versus variable LR.
In this study, we analyzed the statistical characteristics of the hygroscopic growth parameter γ over Wuhan during 2010–2024. The dataset is based on 532 nm ground-based polarization lidar observations, meteorological data from radiosonde measurements, and ERA5 reanalysis. Simultaneous lidar-derived particle backscatter coefficients and radiosonde RH profiles were matched, and the use of meteorological parameters allowed the application of stringent constraints to the dataset. This approach identified 192 suitable cases for our analysis. The Hänel parameterization method was employed to estimate the hygroscopic growth parameter γ. A representative case observed on 19 July 2019 is presented to illustrate the methodology for identifying hygroscopic growth cases and estimating the hygroscopic growth parameter γ. In this case, γ was 0.48, suggesting moderately hygroscopic particles, typical of urban pollution. The corresponding fref-Hänel(85 %) value was 1.93, showing that the backscatter coefficient increases by a factor of 1.93 as RH rose from 40 % (dry condition) to 85 %.
For the statistical characteristics, the average and standard deviations of γ were 0.62 ± 0.24, corresponding to an fref-Hänel(85 %) value of 2.36, with a range of 1.69–3.29 when incorporating the standard deviation. All identified cases were classified by altitudes into the boundary layer and free troposphere clusters. No significant difference in γ was observed between the BL (0.63 ± 0.25) and FT (0.60 ± 0.24). The hygroscopic growth of anthropogenic aerosols in Wuhan generally occurred under high RH conditions around 60 %–80 %. The annual mean γ increased sharply from 0.49 in 2015 to 0.63 in 2017 and stabilized between 0.6 and 0.7 after 2018. This trend closely matches the evolution of the annual mean NO2-to-SO2 concentration ratio, which rose from 1.8 in 2014 to 5.3 in 2017 and was situated between 4 and 6 after 2018. These results indicate that the presence of nitrates in the aerosol mixture enhanced hygroscopicity under similar RH conditions (Chen et al., 2019). Regarding seasonal variation, most cases occurred in summer (80) and autumn (81). The seasonal average γ showed minimal variation, with a minimum in winter (0.56) and a maximum in autumn (0.64), corresponding to fref-Hänel(85 %) values of 2.17 and 2.43, respectively, i.e., a difference of approximately 11 %. The lower γ (0.56) in winter is due to the higher MLH of 2.4 km compared with other seasons, indicating that the winter analyzed cases reflect hygroscopic growth effect of relatively clean aerosols at higher altitudes rather than severe surface-level pollution. Finally, we tried to estimate the error introduced by a fixed LR. The incorporation of variable LR generally causes an increase in γ of <10 %, with the largest increase reaching up to 12.5 % under high RH conditions.
Leveraging long-term polarization lidar observations, we characterize the hygroscopicity of local/regional pollutants over Wuhan. The hygroscopic growth parameter in this study demonstrates how RH amplifies lidar-derived backscatter coefficients and implies the potential influence on long-term AOD variation. In our previous work (Jing et al., 2025), long-term lidar observations over Wuhan from 2010 to 2024 revealed a two-stage evolution of anthropogenic aerosols: a rapid decline from 2010 to 2017, followed by a fluctuating period during 2018–2024. The larger γ values after 2017 may have amplified the hygroscopic growth effect on the backscatter coefficient, and thus also the integrated AOD, which may partially offset the efforts of emission control policies and contribute to the cessation of the AOD decline post-2018. Furthermore, AOD is a major source of uncertainty in estimates of direct aerosol radiative forcing (DARF) (Elsey et al., 2024); in future work, we will assess the influence of particle hygroscopic growth on DARF. However, polarization lidar cannot distinguish aerosol chemical composition in urban environments. To better assess the hygroscopic parameter γ for specific aerosol types, it would be beneficial to combine HYSPLIT trajectory simulations, chemical analysis instruments, satellite data, and Raman lidar observations. In addition, radiosondes are launched approximately 24 km away from our lidar site at 08:00 and 20:00 LT, limiting the availability of co-located and simultaneous meteorological data (He et al., 2023). Raman lidar can provide real-time and co-located, height-resolved measurements of temperature and RH (Liu et al., 2019; Dawson et al., 2020; Pan et al., 2020; Yi et al., 2021), enabling a more accurate analysis of aerosol hygroscopicity property over Wuhan.
ERA5 reanalysis data can be obtained from https://doi.org/10.24381/cds.adbb2d47 (Copernicus Climate Change Service, Climate Data Store, 2025). The radiosonde data can be obtained from https://weather.uwyo.edu/upperair/sounding.shtml (University of Wyoming Atmospheric Science Radiosonde Archive, 2025). The HYSPLIT model is available at https://www.arl.noaa.gov (HYSPLIT, 2025). Lidar data used to generate the results of this paper are available from the authors upon request (e-mail: yf@whu.edu.cn).
YH, DJ, and ZY analyzed the data and wrote the manuscript. ZY, DM, and KH participated in scientific discussions and reviewed and proofread the manuscript. YH and FY conceived the research and acquired the research funding. FY led the study.
The contact author has declared that none of the authors has any competing interests.
Publisher's note: Copernicus Publications remains neutral with regard to jurisdictional claims made in the text, published maps, institutional affiliations, or any other geographical representation in this paper. The authors bear the ultimate responsibility for providing appropriate place names. Views expressed in the text are those of the authors and do not necessarily reflect the views of the publisher.
The authors thank the colleagues who participated in the operation of the lidar system at our site. We also acknowledge the European Centre for Medium-Range Weather Forecasts (ECMWF) for ERA5 reanalysis data, the University of Wyoming for radiosonde data, and the National Oceanic and Atmospheric Administration (NOAA) Air Resources Laboratory (ARL) for the HYSPLIT model.
This work was supported by the National Natural Science Foundation of China (grant nos. 42575138, 42005101, 42575141, and 42205130), Hubei Provincial Special Project for Central Government Guidance on Local Science and Technology Development (2025CFC003), and the Meridian Space Weather Monitoring Project (China).
This paper was edited by Daniel Perez-Ramirez and reviewed by two anonymous referees.
Adam, M., Putaud, J. P., Martins dos Santos, S., Dell'Acqua, A., and Gruening, C.: Aerosol hygroscopicity at a regional background site (Ispra) in Northern Italy, Atmos. Chem. Phys., 12, 5703–5717, https://doi.org/10.5194/acp-12-5703-2012, 2012.
Bedoya-Velásquez, A. E., Navas-Guzmán, F., Granados-Muñoz, M. J., Titos, G., Román, R., Casquero-Vera, J. A., Ortiz-Amezcua, P., Benavent-Oltra, J. A., de Arruda Moreira, G., Montilla-Rosero, E., Hoyos, C. D., Artiñano, B., Coz, E., Olmo-Reyes, F. J., Alados-Arboledas, L., and Guerrero-Rascado, J. L.: Hygroscopic growth study in the framework of EARLINET during the SLOPE I campaign: synergy of remote sensing and in situ instrumentation, Atmos. Chem. Phys., 18, 7001–7017, https://doi.org/10.5194/acp-18-7001-2018, 2018.
Bolton, D.: The computation of equivalent potential temperature, Mon. Weather. Rev., 108, 1046–1053, https://doi.org/10.1175/1520-0493(1980)108<1046:TCOEPT>2.0.CO;2, 1980.
Bourgeois, Q., Ekman, A. M. L., Renard, J.-B., Krejci, R., Devasthale, A., Bender, F. A.-M., Riipinen, I., Berthet, G., and Tackett, J. L.: How much of the global aerosol optical depth is found in the boundary layer and free troposphere?, Atmos. Chem. Phys., 18, 7709–7720, https://doi.org/10.5194/acp-18-7709-2018, 2018.
Chen, J., Li, Z., Lv, M., Wang, Y., Wang, W., Zhang, Y., Wang, H., Yan, X., Sun, Y., and Cribb, M.: Aerosol hygroscopic growth, contributing factors, and impact on haze events in a severely polluted region in northern China, Atmos. Chem. Phys., 19, 1327–1342, https://doi.org/10.5194/acp-19-1327-2019, 2019.
Copernicus Climate Change Service, Climate Data Store: ERA5 hourly data on single levels from 1940 to present, Copernicus Climate Change Service (C3S) Climate Data Store (CDS), [data set], https://doi.org/10.24381/cds.adbb2d47, 2025.
Dawson, K. W., Ferrare, R. A., Moore, R. H., Clayton, M. B., Thorsen, T. J., and Eloranta, E. W.: Ambient aerosol hygroscopic growth from combined Raman lidar and HSRL, J. Geophys. Res.-Atmos., 125, e2019JD031708, https://doi.org/10.1029/2019JD031708, 2020.
Deshmukh, S., Poulain, L., Wehner, B., Henning, S., Petit, J.-E., Fombelle, P., Favez, O., Herrmann, H., and Pöhlker, M.: External particle mixing influences hygroscopicity in a sub-urban area, Atmos. Chem. Phys., 25, 741–758, https://doi.org/10.5194/acp-25-741-2025, 2025.
Ding, L., Zhao, W., Huang, Y., Cheng, S., and Liu, C.: Research on the coupling coordination relationship between urbanization and the air environment: A case study of the area of Wuhan, Atmosphere, 6, 1539–1558, https://doi.org/10.3390/atmos6101539, 2015.
Draxler, R. and Rolph, G.: HYSPLIT (Hybrid Single-Particle Lagrangian Integrated Trajectory) Model, Air Resources Laboratory, NOAA, Silver Spring, Md, USA, https://www.ready.noaa.gov/HYSPLIT.php (last access: 12 April 2025), 2003.
Elsey, J., Bellouin, N., and Ryder, C.: Sensitivity of global direct aerosol shortwave radiative forcing to uncertainties in aerosol optical properties, Atmos. Chem. Phys., 24, 4065–4081, https://doi.org/10.5194/acp-24-4065-2024, 2024.
Fernald, F. G.: Analysis of atmospheric lidar observations: some comments, Appl. Opt., 23, 652–653, https://doi.org/10.1364/AO.23.000652, 1984.
Fernández, A. J., Apituley, A., Veselovskii, I., Suvorina, A., Henzing, J., Pujadas, M., and Artíñano, B.: Study of aerosol hygroscopic events over the Cabauw experimental site for atmospheric research (CESAR) using the multi-wavelength Raman lidar Caeli, Atmos. Environ., 120, 484–498, https://doi.org/10.1016/j.atmosenv.2015.08.079, 2015.
Ferrare, R. A., Melfi, S. H., Whiteman, D. N., Evans, K. D., Poellot, M., and Kaufman, Y. J.: Raman lidar measurements of aerosol extinction and backscattering: 2. Derivation of aerosol real refractive index, single-scattering albedo, and humidification factor using Raman lidar and aircraft size distribution measurements, J. Geophys. Res. Atmos., 10, 19673–19689, https://doi.org/10.1029/98JD01647, 1998.
Freudenthaler, V., Esselborn, M., Wiegner, M., Heese, B., Tesche, M., Ansmann, A., Müller, D., Althausen, D., Wirth, M., Fix, A., Ehret, G., Knippertz, P., Toledano, C., Gasteiger, J., Garhammer, M., and Seefeldner, M.: Depolarization ratio profiling at several wavelengths in pure Saharan dust during SAMUM2006, Tellus B, 61, 165–179, https://doi.org/10.1111/j.1600-0889.2008.00396.x, 2009.
Granados-Muñoz, M. J., Navas-Guzmán, F., Bravo-Aranda, J. A., Guerrero-Rascado, J. L., Lyamani, H., Valenzuela, A., Titos, G., Fernández-Gálvez, J., and Alados-Arboledas, L.: Hygroscopic growth of atmospheric aerosol particles based on active remote sensing and radiosounding measurements: selected cases in southeastern Spain, Atmos. Meas. Tech., 8, 705–718, https://doi.org/10.5194/amt-8-705-2015, 2015.
Guo, X., Huang, K., Fang, J., Zhang, Z., Cao, R., and Yi, F.: Seasonal and Diurnal Changes of Air Temperature and Water Vapor Observed with a Microwave Radiometer in Wuhan, China, Remote Sens., 15, 5422, https://doi.org/10.3390/rs15225422, 2023.
Haarig, M., Ansmann, A., Gasteiger, J., Kandler, K., Althausen, D., Baars, H., Radenz, M., and Farrell, D. A.: Dry versus wet marine particle optical properties: RH dependence of depolarization ratio, backscatter, and extinction from multiwavelength lidar measurements during SALTRACE, Atmos. Chem. Phys., 17, 14199–14217, https://doi.org/10.5194/acp-17-14199-2017, 2017.
Haarig, M., Engelmann, R., Baars, H., Gast, B., Althausen, D., and Ansmann, A.: Discussion of the spectral slope of the lidar ratio between 355 and 1064 nm from multiwavelength Raman lidar observations, Atmos. Chem. Phys., 25, 7741–7763, https://doi.org/10.5194/acp-25-7741-2025, 2025.
Hänel, G.: The properties of atmospheric aerosol particles as functions of the relative humidity at thermodynamic equilibrium with the surrounding moist air, in: Advances in Geophysics, edited by: Landsberg, H. E. and Mieghem, J. V., Elsevier, 73–188, 1976.
He, Q., Zhou, G., Geng, F., Gao, W., and Yu, W.: Spatial distribution of aerosol hygroscopicity and its effect on PM2.5 retrieval in East China, Atmos. Res., 170, 161–167, https://doi.org/10.1016/j.atmosres.2015.11.011, 2016.
He, Y. and Yi, F.: Dust aerosols detected using a ground-based polarization lidar and CALIPSO over Wuhan (30.5 ° N, 114.4 ° E), China. Adv. Meteorol., 2015, 536762, https://doi.org/10.1155/2015/536762, 2015.
He, Y., Yi, F., Yi, Y., Liu, F., and Zhang, Y.: Heterogeneous nucleation of midlevel cloud layer influenced by transported Asian dust over Wuhan (30.5°N, 114.4°E), China, J. Geophys. Res.-Atmos., 126, e2020JD033394, https://doi.org/10.1029/2020JD033394, 2021.
He, Y., Yi, F., Liu, F., Yin, Z., and Zhou, J.: Ice nucleation of cirrus clouds related to the transported dust layer observed by ground-based lidars over Wuhan, China. Adv. Atmos. Sci. 39, 2071–2086, https://doi.org/10.1007/s00376-021-1192-x, 2022.
He, Y., Jing, D., Liu, Q., Liu, F., and Yi, F.: Atmospheric refraction delay toward millimeter-level lunar laser ranging: Correcting the temperature-induced error with real-time and Co-located lidar measurements, J. Geophys. Res. Atmos, 128, e2023JD039579, https://doi.org/10.1029/2023JD039579, 2023.
He, Y., Jing, D., Yin, Z., Ohneiser, K., and Yi, F.: Long-term (2010–2021) lidar observations of stratospheric aerosols in Wuhan, China, Atmos. Chem. Phys., 24, 11431–11450, https://doi.org/10.5194/acp-24-11431-2024, 2024.
Hersbach, H., Bell, B., Berrisford, P., Hirahara, S., Horányi, A., Muñoz-Sabater, J., Nicolas, J., Peubey, C., Radu, R., Schepers, D., Simmons, A., Soci, C., Abdalla, S., Abellan, X., Balsamo, G., Bechtold, P., Biavati, G., Bidlot, J., Bonavita, M., De Chiara, G., Dahlgren, P., Dee, D., Diamantakis, M., Dragani, R., Flemming, J., Forbes, R., Fuentes, M., Geer, A., Haimberger, L., Healy, S., Hogan, R.J., Hólm, E., Janisková, M., Keeley, S., Laloyaux, P., Lopez, P., Lupu, C., Radnoti, G., de Rosnay, P., Rozum, I., Vamborg, F., Villaume, S., and Thépaut, J.-N.: The ERA5 global reanalysis, Q. J. Roy. Meteor. Soc., 146, 1999–2049, https://doi.org/10.1002/qj.3803, 2020.
Hersbach, H., Bell, B., Berrisford, P., Biavati, G., Horányi, A., Muñoz Sabater, J., Nicolas, J., Peubey, C., Radu, R., Rozum, I., Schepers, D., Simmons, A., Soci, C., Dee, D., and Thépaut, J.-N.: ERA5 hourly data on single levels from 1940 to present, Copernicus Climate Change Service (C3S) Climate Data Store (CDS) [data set], https://doi.org/10.24381/cds.adbb2d47, 2023.
HYSPLIT: Hybrid Single Particle Lagrangian Integrated Trajectory, NOAA, https://www.arl.noaa.gov/ (last access: 2 May 2025), 2025.
Ji, D., Palm, M., Buschmann, M., Ebell, K., Maturilli, M., Sun, X., and Notholt, J.: Hygroscopic aerosols amplify longwave downward radiation in the Arctic, Atmos. Chem. Phys., 25, 3889–3904, https://doi.org/10.5194/acp-25-3889-2025, 2025.
Jing, D., He, Y., Yin, Z., Liu, F., and Yi, F.: Long-term characteristics of dust aerosols over central China from 2010 to 2020 observed with polarization lidar, Atmos. Res., 297, 107129, https://doi.org/10.1016/j.atmosres.2023.107129, 2024.
Jing, D., He, Y., Yin, Z., Huang, K., Liu, F., and Yi, F.: Evolution of tropospheric aerosols over central China during 2010–2024 as observed by lidar, Atmos. Chem. Phys., 25, 17047–17067, https://doi.org/10.5194/acp-25-17047-2025, 2025.
Kanamitsu, M.: Description of the NMC global data assimilation and forecast system, Weather Forecast., 4, 335–342, https://doi.org/10.1175/1520-0434(1989)004<0335:DOTNGD>2.0.CO;2, 1989.
Kong, W. and Yi, F.: Convective boundary layer evolution from lidar backscatter and its relationship with surface aerosol concentration at a location of a central China megacity, J. Geophys. Res.-Atmos., 120, 7928–7940, https://doi.org/10.1002/2015JD023248, 2015.
Laly, F., Chazette, P., Totems, J., Crenn, V., Ledur, D., and Marpillat, A.: How does humidity affect lidar-derived aerosol optical properties, and how do they compare with CAMS?, Atmos. Meas. Tech., 18, 7629–7649, https://doi.org/10.5194/amt-18-7629-2025, 2025.
Liu, X., Gu, J., Li, Y., Cheng, Y., Qu, Y., Han, T., Wang, J., Tian, H., Chen, J., and Zhang, Y.: Increase of aerosol scattering by hygroscopic growth: Observation, modeling, and implications on visibility, Atmos. Res., 132, 91–101, https://doi.org/10.1016/j.atmosres.2013.04.007, 2013.
Liu, H. J., Zhao, C. S., Nekat, B., Ma, N., Wiedensohler, A., van Pinxteren, D., Spindler, G., Müller, K., and Herrmann, H.: Aerosol hygroscopicity derived from size-segregated chemical composition and its parameterization in the North China Plain, Atmos. Chem. Phys., 14, 2525–2539, https://doi.org/10.5194/acp-14-2525-2014, 2014.
Liu, M. and Matsui, H.: Aerosol radiative forcings induced by substantial changes in anthropogenic emissions in China from 2008 to 2016, Atmos. Chem. Phys., 21, 5965–5982, https://doi.org/10.5194/acp-21-5965-2021, 2021.
Liu, M., Huang, X., Song, Y., Xu, T., Wang, S., Wu, Z., Hu, M., Zhang, L., Zhang, Q., Pan, Y., Liu, X., and Zhu, T.: Rapid SO2 emission reductions significantly increase tropospheric ammonia concentrations over the North China Plain, Atmos. Chem. Phys., 18, 17933–17943, https://doi.org/10.5194/acp-18-17933-2018, 2018.
Liu, F., Yi, F., Zhang, Y., and Yi, Y.: Double-receiver-based pure rotational Raman LiDAR for measuring atmospheric temperature at altitudes between near ground and up to 35 km, IEEE Trans. Geosci. Remote Sens., 57, 10301–10309, https://doi.org/10.1109/TGRS.2019.2933461, 2019.
Lv, M., Liu, D., Li, Z. Q., Mao, J. T., Sun, Y. L., Wang, Z. Z., Wang, Y. J., and Xie, C. B.: Hygroscopic growth of atmospheric aerosol particles based on lidar, radiosonde, and in situ measurements: Case studies from the Xinzhou field campaign, J. Quant. Spectrosc. Ra., 188, 60–70, https://doi.org/10.1016/j.jqsrt.2015.12.029, 2017.
Mamouri, R. E. and Ansmann, A.: Fine and coarse dust separation with polarization lidar, Atmos. Meas. Tech., 7, 3717–3735, https://doi.org/10.5194/amt-7-3717-2014, 2014.
Miri, R., Pujol, O., Hu, Q., Goloub, P., Veselovskii, I., Podvin, T., and Ducos, F.: Innovative aerosol hygroscopic growth study from Mie–Raman–fluorescence lidar and microwave radiometer synergy, Atmos. Meas. Tech., 17, 3367–3375, https://doi.org/10.5194/amt-17-3367-2024, 2024.
Nash, J., Oakley, T., Vömel, H., and Li, W.: WMO Intercomparison of High Quality Radiosonde Systems, Yangjiang, China, 107, Geneva, Switzerland: World Meteorological Organization, Instruments and Observing Methods, https://library.wmo.int/idurl/4/50499 (last access: 19 January 2026), 2011.
Navas-Guzmán, F., Martucci, G., Collaud Coen, M., Granados-Muñoz, M. J., Hervo, M., Sicard, M., and Haefele, A.: Characterization of aerosol hygroscopicity using Raman lidar measurements at the EARLINET station of Payerne, Atmos. Chem. Phys., 19, 11651–11668, https://doi.org/10.5194/acp-19-11651-2019, 2019.
Pan, X., Yi, F., Liu, F., Zhang, Y., and Yan, Y.: Diurnal temperature variations in the lower troposphere as measured by an all-day-operational pure rotational Raman lidar, Appl. Opt., 59, 8688–8696, https://doi.org/10.1364/AO.394484, 2020.
Peng, S., Yang, Q., Shupe, M. D., Xi, X., Han, B., Chen, D., Dahlke, S., and Liu, C.: The characteristics of atmospheric boundary layer height over the Arctic Ocean during MOSAiC, Atmos. Chem. Phys., 23, 8683–8703, https://doi.org/10.5194/acp-23-8683-2023, 2023.
Pérez, C., Sicard, M., Jorba, O., Comerón, A., and Baldasano, J. M.: Summertime re-circulations of air pollutants over the northeastern Iberian coast observed from systematic EARLINET lidar measurements in Barcelona, Atmos. Environ., 38, 3983–4000, https://doi.org/10.1016/j.atmosenv.2004.04.010, 2004.
Pérez-Ramírez, D., Whiteman, D. N., Veselovskii, I., Ferrare, R., Titos, G., Granados-Muñoz, M. J., Sánchez-Hernández, G., and Navas-Guzmán, F.: Spatiotemporal changes in aerosol properties by hygroscopic growth and impacts on radiative forcing and heating rates during DISCOVER-AQ 2011, Atmos. Chem. Phys., 21, 12021–12048, https://doi.org/10.5194/acp-21-12021-2021, 2021.
Rosenfeld, D., Andreae, M.O., Asmi, A., Chin, M., de Leeuw, G., Donovan, D.P., Kahn, R., Kinne, S., Kivekäs, N., Kulmala, M., Lau, W., Schmidt, K. S., Suni, T., Wagner, T., Wild, M., and Quaas, J.: Global observations of aerosol-cloud- precipitation-climate interactions, Rev. Geophys., 52, 750–808, https://doi.org/10.1002/2013RG000441, 2014.
Sicard, M., Fortunato dos Santos Oliveira, D. C., Muñoz-Porcar, C., Gil-Díaz, C., Comerón, A., Rodríguez-Gómez, A., and Dios Otín, F.: Measurement report: Spectral and statistical analysis of aerosol hygroscopic growth from multi-wavelength lidar measurements in Barcelona, Spain, Atmos. Chem. Phys., 22, 7681–7697, https://doi.org/10.5194/acp-22-7681-2022, 2022.
Sorooshian, A., Csavina, J., Shingler, T., Dey, S., Brechtel, F. J., Sáez, A. E., and Betterton, E. A.: Hygroscopic and chemical properties of aerosols collected near a copper smelter: implications for public and environmental health, Environ. Sci. Tech., 46, 9473–9480, https://doi.org/10.1021/es302275k, 2012.
Stein, A. F., Draxler, R. R., Rolph, G. D., Stunder, B. J., Cohen, M. D., and Ngan, F.: NOAA's HYSPLIT atmospheric transport and dispersion modeling system, B. Am. Meteorol. Soc., 96, 2059–2077, https://doi.org/10.1175/BAMS-D-14-00110.1, 2015.
Takamura, T., Sasano, Y., and Hayasaka, T.: Tropospheric aerosol optical properties derived from lidar, sun photometer, and optical particle counter measurements, Appl. Opt., 33, 7132–7140, https://doi.org/10.1364/AO.33.007132, 1994.
Tesche, M., Ansmann, A., Müller, D., Althausen, D., Engelmann, R., Freudenthaler, V., and Groß, S.: Vertically resolved separation of dust and smoke over Cape Verde using multiwavelength Raman and polarization lidars during Saharan mineral dust experiment 2008, J. Geophys. Res., 114, D13202, https://doi.org/10.1029/2009JD011862, 2009.
Titos, G., Cazorla, A., Zieger, P., Andrews, E., Lyamani, H., Granados-Muñoz, M. J., Olmo, F. J., and Alados-Arboledas, L.: Effect of hygroscopic growth on the aerosol light-scattering coef?cient: A review of measurements, techniques and error sources, Atmos. Environ., 141, 494–507, https://doi.org/10.1016/j.atmosenv.2016.07.021, 2016.
University of Wyoming Atmospheric Science Radiosonde Archive: Radiosonde data, https://weather.uwyo.edu/upperair/sounding.shtml (last access: 25 December 2025), 2025.
Väisänen, O., Ruuskanen, A., Ylisirniö, A., Miettinen, P., Portin, H., Hao, L., Leskinen, A., Komppula, M., Romakkaniemi, S., Lehtinen, K. E. J., and Virtanen, A.: In-cloud measurements highlight the role of aerosol hygroscopicity in cloud droplet formation, Atmos. Chem. Phys., 16, 10385–10398, https://doi.org/10.5194/acp-16-10385-2016, 2016.
Veselovskii, I., Whiteman, D. N., Kolgotin, A., Andrews, E., and Korenskii, M.: Demonstration of aerosol property profiling by multiwavelength lidar under varying relative humidity conditions, J. Atmos. Ocean. Tech., 26, 1543–1557, https://doi.org/10.1175/2009JTECHA1254.1, 2009.
Veselovskii, I., Hu, Q., Goloub, P., Podvin, T., Dubois, G., Kolgotin, A., and Korenskii, M.: Impact of water uptake on fluorescence of atmospheric aerosols: insights from Mie–Raman–fluorescence lidar measurements, Atmos. Meas. Tech., 18, 6039–6051, https://doi.org/10.5194/amt-18-6039-2025, 2025.
Wang, W., Gong, W., Mao, F., Pan, Z., and Liu, B.: Measurement and study of lidar ratio by using a Raman lidar in central China, Int. J. Environ. Res. Pub. Health., 13, 508, https://doi.org/10.3390/ijerph13050508, 2016.
Wu, B. and Wang, J.: Winter Arctic oscillation, Siberian High and East Asian winter monsoon, Geophys. Res. Lett., 29, 3–1, https://doi.org/10.1029/2002GL015373, 2002.
Wu, T., Li, Z., Chen, J., Wang, Y., Wu, H., Jin, X., Liang, C., Li, S., Wang, W., and Cribb, M.: Hygroscopicity of different types of aerosol particles: Case studies using multi-instrument data in megacity Beijing, China, Remote Sens., 12, 785, https://doi.org/10.3390/rs12050785, 2020.
Xie, R., Sabel, C.E., Lu, X., Zhu, W., Kan, H., Nielsen, C. P., and Wang, H.: Long-term trend and spatial pattern of PM2.5 induced premature mortality in China, Environ. Int., 97, 180–186, https://doi.org/10.1016/j.envint.2016.09.003, 2016.
Xu, L., Fukushima, S., Sobanska, S., Murata, K., Naganuma, A., Liu, L., Wang, Y., Niu, H., Shi, Z., Kojima, T., Zhang, D., and Li, W.: Tracing the evolution of morphology and mixing state of soot particles along with the movement of an Asian dust storm, Atmos. Chem. Phys., 20, 14321–14332, https://doi.org/10.5194/acp-20-14321-2020, 2020.
Yi, Y., Yi, F., Liu, F., Zhang, Y., Yu, C., and He, Y.: Microphysical process of precipitating hydrometeors from warm-front mid-level stratiform clouds revealed by ground-based lidar observations, Atmos. Chem. Phys., 21, 17649–17664, https://doi.org/10.5194/acp-21-17649-2021, 2021.
Yin, Z., Yi, F., Liu, F., He, Y., Zhang, Y., Yu, C., and Zhang, Y.: Long-term variations of aerosol optical properties over Wuhan with polarization lidar, Atmos. Environ., 259, 118508, https://doi.org/10.1016/j.atmosenv.2021.118508, 2021.
Yu, A., Shen, X., Ma, Q., Lu, J., Hu, X., Zhang, Y., Liu, Q., Liang, L., Liu, L., Liu, S., Tong, H., Che, H., Zhang, X., and Sun, J.: Size-resolved hygroscopicity and volatility properties of ambient urban aerosol particles measured by a volatility hygroscopicity tandem differential mobility analyzer system in Beijing, Atmos. Chem. Phys., 25, 3389–3412, https://doi.org/10.5194/acp-25-3389-2025, 2025.
Zhang, M., Ma, Y., Gong, W., and Zhu, Z: Aerosol optical properties of a haze episode in Wuhan based on ground-based and satellite observations, Atmosphere, 5, 699–719, https://doi.org/10.3390/atmos5040699, 2014.
Zhang, F., Wang, Z., Cheng, H., Lv, X., Gong, W., Wang, X., and Zhang, G.: Seasonal variations and chemical characteristics of PM2.5 in Wuhan, central China, Sci. Total Environ., 518–519, 97–105, https://doi.org/10.1016/j.scitotenv.2015.02.054, 2015a.
Zhang, Y. L. and Cao, F.: Fine particulate matter (PM2.5) in China at a city level, Sci. Rep., 5, 14884, https://doi.org/10.1038/srep14884, 2015b.
Zhang, Y., Zhang, Y., Yu, C., and Yi, F.: Evolution of aerosols in the atmospheric boundary layer and elevated layers during a severe, persistent haze episode in a central China megacity, Atmosphere, 12, 152, https://doi.org/10.3390/atmos12020152, 2021.
Zhang, L., Segal-Rozenhaimer, M., Che, H., Dang, C., Sun, J., Kuang, Y., Formenti, P., and Howell, S. G.: Aerosol hygroscopicity over the southeast Atlantic Ocean during the biomass burning season – Part 1: From the perspective of scattering enhancement, Atmos. Chem. Phys., 24, 13849–13864, https://doi.org/10.5194/acp-24-13849-2024, 2024.
Zhang, B., Fan G., Zhang, T., and Xiang, Y.: Detection of aerosol hygroscopic growth in Tibetan Plateau by LiDAR, Laser Infrared, 55, 215–225, https://doi.org/10.3969/j.issn.1001-5078.2025.009, 2025.
Zhao, G., Zhao, C., Kuang, Y., Tao, J., Tan, W., Bian, Y., Li, J., and Li, C.: Impact of aerosol hygroscopic growth on retrieving aerosol extinction coefficient profiles from elastic-backscatter lidar signals, Atmos. Chem. Phys., 17, 12133–12143, https://doi.org/10.5194/acp-17-12133-2017, 2017.
Zieger, P., Fierz-Schmidhauser, R., Gysel, M., Ström, J., Henne, S., Yttri, K. E., Baltensperger, U., and Weingartner, E.: Effects of relative humidity on aerosol light scattering in the Arctic, Atmos. Chem. Phys., 10, 3875–3890, https://doi.org/10.5194/acp-10-3875-2010, 2010.
Zieger, P., Fierz-Schmidhauser, R., Weingartner, E., and Baltensperger, U.: Effects of relative humidity on aerosol light scattering: results from different European sites, Atmos. Chem. Phys., 13, 10609–10631, https://doi.org/10.5194/acp-13-10609-2013, 2013.
Zieger, P., Väisänen, O., Corbin, J. C., Partridge, D. G., Bastelberger, S., Mousavi-Fard, M., Rosati, B., Gysel, M., Krieger, U. K., Leck, C., Nenes, A., Piipinen, I., Virtanen, A., and Salter, M. E.: Revising the hygroscopicity of inorganic sea salt particles, Nat. Commun., 8, 15883, https://doi.org/10.1038/ncomms15883, 2016.