
the Creative Commons Attribution 4.0 License.
the Creative Commons Attribution 4.0 License.
 | 09 Jul 2026
Comparison of particle number concentrations measured with AQ Urban sensors in two different environments in Helsinki, Finland
Kimmo Teinilä
Teemu Lepistö
Jarkko V. Niemi
Harri Portin
Anssi Julkunen
Anu Kousa
Joel Kuula
Hanna E. Manninen
Pasi Aalto
Tuukka Petäjä
Topi Rönkkö
Erkka Saukko
Hilkka Timonen
The use of a diffusion charger based AQ Urban sensors to monitor particle number concentrations was investigated in Helsinki metropolitan area. The comparisons between the AQ Urban sensors and traditional butanol CPCs were made at a heavily trafficked street canyon (Traffic Supersite) and at an urban background site (UB Supersite) in 2022. The agreement with the measured particle number concentrations within different AQ Urban units was good. Comparison of the AQ Urban sensor with the two CPCs showed that AQ Urban sensors should be suitable to measure concentration of particles approx. larger than 10 nm in highly trafficked areas. The long-term agreement between AQ Urban sensors and CPCs was also investigated in the two different environments between 1 January and 15 August 2022. Overall, the correlation between AQ Urban sensors and the CPCs was good at both sites (r being 0.93 and 0.89, respectively). The increased concentration of particles smaller than 10 nm and long-range transported pollution affected the accuracy of AQ Urban sensors. Despite this downside of the method, the correlation between the AQ Urban sensor and the CPCs was good during the whole measurement period, indicating that the sensor is well suitable for long-term particle number concentration monitoring in urban environments in Finland. However, the observed effect of bi-modal particle size distribution suggests that the performance of diffusion charger-based sensors may vary in different geographic regions depending on the regional background concentrations of accumulation mode particles which should be considered when applying the method in different locations.
- Article
(2072 KB) - Full-text XML
-
Supplement
(2414 KB) - BibTeX
- EndNote


Exposures to particulate pollutants can cause serious health problems (Atkinson et al., 2014), and exposures to increased levels of particulate pollutants have been estimated to cause 3.3 million premature deaths per year on the global scale (Lelieveld et al., 2015). Fine particles (<2.5 µm) can be transported deep into the human respiratory tract (Zanobetti et al., 2014) and especially ultrafine particles (Dp<0.1 µm) can enter even deeper into the respiratory tract (Schraufnagel, 2020). Especially in heavily trafficked environments, like street canyons, the concentration of ultrafine particles can increase significantly causing adverse health effects (Pirjola et al., 2017; Rönkkö and Timonen, 2019; Trechera et al., 2023). For example, Hänninen et al. (2025) suggested that ultrafine particles would be the most significant air pollutant regarding premature deaths in Europe in 2023. In general, however, the health effects of ultrafine particles are not completely understood yet (Vallabani et al., 2023).
The main anthropogenic sources of fine particle pollution in Helsinki metropolitan area are direct vehicular emissions, road dust and residential wood burning (Aurela et al., 2015; Carbone et al., 2014; Järvi et al., 2008; Saarikoski et al., 2008; Savadkoohi et al., 2023). In addition, long-range and regional transport increase the concentration of particulate matter in Helsinki metropolitan area (Niemi et al., 2009, 2005, 2004). Secondary aerosol formation during transportation increases the size of these particles e.g. (Harni et al., 2023). Particle number concentration (PNC) typically increases in heavily trafficked areas in Helsinki metropolitan area e.g. morning and afternoon rush hours. Trapping of pollutants in the boundary layer during cold days also increases PNC. In contrast to regional or long-range transported particles, the increased PNC in heavily trafficked areas is connected to small particle size (Pirjola et al., 2017; Rönkkö et al., 2017). The highest PNC in Helsinki Metropolitan area is typically measured near highways, heavily trafficked streets or at airports (Lepistö et al., 2023).
Due to the harmful health effects of ultrafine particles, WHO has recommended the monitoring of PNC (WHO, 2021). WHO also recommended that the minimum lower limit of particle size should be at least 10 nm for monitoring measurements (WHO, 2021). According to Directive (EU) 2024/2881, PNC monitoring is regulated at rural and urban background supersites and at “hotspot” sites with high ultrafine particle (UFP) concentrations. This same directive states that the lower limit of the PNC measurements should be 10 nm, which corresponds to the lower particle size of the CEN standard for outdoor butanol CPC measurements (EN 16976:2024).
Outdoor PNC measurements are typically performed using butanol CPC instruments which are widely used also in laboratories. As PNC has typically high spatial and temporal variation, continuous measurements of PNC by utilizing a wide measurement network could be beneficial especially in big cities. CPC measurements are costly (due to instrument purchase and servicing), and maintaining the system is time-consuming, requiring regular maintenance and frequent butanol refills. Due to the above reasons, the PNC monitoring networks based on CPCs are still quite rare. Measuring devices based on diffusion charging could be useful if the coverage of indicative PNC measurements is wanted to be increased. In earlier studies the PNC measured with diffusion-based instruments has been found to be in the range ±50 % (Todea et al., 2017) and in the range ±30 (Asbach et al., 2024) when comparing to traditional butanol CPCs.
In Helsinki Metropolitan area, diffusion charger-based instruments, (AQ™ Urban sensors Pegasor Oy, Finland) are used at eight measurement stations to continuously monitor PNC concentration. In addition, these sensors measure the lung-deposited surface area (LDSA) concentration of particles e.g. Kuula et al. (2020), Since the AQ Urban sensor measurement technique differs from the traditionally used CPCs, we investigate the suitability of AQ Urban for PNC measurements in different urban environments. In this paper we compare the PNC measured with the AQ Urban sensors and CPCs at two sites in Helsinki metropolitan area during 7.5 month measurement period. In addition to this a comparison measurement with seven AQ Urban sensors and two CPCs were made during 6 week measurement period. The study aims to gain better understanding of the potential and challenges of AQ Urban, and diffusion charger-based sensors in general, in long-term PNC monitoring.
The 7.5 month measurement period was conducted at two sites in Helsinki Metropolitan area between 1 January and 15 August 2022. The measurement sites were Traffic Supersite and Urban Background Supersite (UB Supersite) in Helsinki. PNC measured with the AQ Urban sensors were compared to those measured with the CPCs during the measurement period at the two sites. In addition, a 6 week comparison measurement with 7 different AQ Urban sensors were made at the Traffic Supersite between 30 August and 19 September 2022.
The Traffic Supersite station is an urban measurement station operated by the Helsinki Region Environmental Services Authority (HSY), located in a street canyon on the street Mäkelänkatu (60.19654° N, 24.95172° E) in Helsinki. The Traffic Supersite station monitors continuously urban air quality with measurements of particulate and gaseous components. The measurement station is markedly affected by motor vehicle emissions since it is a street canyon, consisting of six lanes (Hietikko et al., 2018). More detailed descriptions of the site and its air flow patterns are found in (Barreira et al., 2021; Hietikko et al., 2018; Kuuluvainen et al., 2018).
The Urban Background Supersite (UB Supersite, 60.20306° N, 24.96103° E) is the SMEAR III station located in Kumpula campus area (Järvi et al., 2009). The effect of local traffic is quite low at the UB Supersite compared to the Traffic Supersite because of the markedly longer distance to the main road (approximately 150 m from the station with a daily traffic load of approximately 50 000 vehicles). The UB Supersite is affected by residential wood combustion during the winter months (Järvi et al., 2008). At the UB Supersite particle physical and chemical properties and trace gases are continuously measured.
PNC was measured at the Traffic Supersite and at the UB Supersite with diffusion charger-based AQ Urban (Pegasor, Finland) sensors. At both sites the lower limit of particle size was adjusted to be 10 nm, while the larger particle detection size of the instrument was ∼600 nm (Kuula et al., 2019; Rostedt et al., 2014). The AQ Urban sensor measures the escaping current of charged particles. The measured escape current of the AQ Urban sensor closely matches the lung deposited surface area of particles and is reported in addition to particle number. The AQ Urban sensor determines count median diameter (CMD) indirectly by measuring the electrical current produced when particles are diffusion-charged. The determination of CMD is based on the calibration of the instrument and the assumption that the aerosol size distribution is lognormal. The instrument estimate the count median diameter (CMD) by continuously stepping between a low and variable, high voltage settings; the median particle size is determined by the cutoff voltage of the half-maximum signal compared to the low cutoff signal. Using this mean particle diameter and assuming a lognormal particle size distribution with fixed standard deviation the instrument calculates the PNC (Janka and Saukko, 2017). The temperature of the AQ Urban sensors was set to be 40 °C above the ambient temperature.
PNC was measured also with CPC instruments at both sites. At the Traffic Supersite the used CPC was an A20 (Airmodus Ltd.) with a cut-size (Dp50) 5.4 nm and at the UB Supersite the used instrument was a CPC model 3756 (TSI) with a cut-size (Dp50) 7 nm. A dilution was used before the CPC at the Traffic Supersite during the measurements to get reliable results also during periods of high PNC at the site.
During two three-week periods between 30 August and 10 October 2022, a total of seven AQ Urban sensors were installed at the Traffic Supersite. One AQ Urban sensor was chosen as a reference instrument (Ref) since it was located at the Traffic Supersite during the whole six-week period. In addition to the reference instrument six other AQ Urban sensors were used (1–6). Three sensors during the first three weeks (1–3, 30 August–19 September) and another three during the last three weeks (4–6, 19 September–10 October). During these periods PNC was measured also by using two CPCs with different cut-sizes. The CPCs were an Airmodus A20 CPC with a cut-size 5.4 nm and an Airmodus A20 CPC with a cut-size 10 nm. A dilution was used for both CPCs at the Traffic Supersite during the six-week comparison period.
Particle number size distribution was measured at both stations with a Differential Mobility Particle sizer (DMPS) using a Vienna type Differential Mobility Analyzers. At the Traffic Supersite an Airmodus A20 model CPC was used in the DMPS system and sample was dried using a silica gel dryer. At the UB Supersite the Twin DMPS had TSI model 3772 and 3756 CPCs with a 50 cm long Tropos Nafion dryer. At the Traffic Supersite the measured particle size range was between ∼10 and ∼800 nm and at the UB Supersite it was between 3 and ∼800 nm.
The accuracy of Airmodus A20 CPC is <10 % up to PNC 30 000 p cm−3 and for the TSI 3756 CPC the accuracy is about 5 % when the total particle concentration is below 50 000 p cm−3 (based on the manufacturer information). The accuracy of the DMPS-CPC system is about ±10 %. The changes in the instrument flow rates were mainly caused by the changes in air pressure. The dilution at the Traffic Supersite was applied using a bridge dilution. The uncertainty of the bridge diluter was determined to be 2 % in a laboratory test. In long-term field measurements, however, the bridge diluter may be prone to contamination, and, hence, the dilution ratio may not be constant throughout the measurements. This change in the dilution ratio was determined after the measurement, and the measurement data was corrected using a moving correction for the dilution. If estimating the propagation error using a maximum 10 % error for CPC and 10 % error for the bridge diluter,the total uncertainty is around 15 %.
The flow rates of the CPCs were constantly checked, together with draining of butanol to avoid interference of condensed water. For DMPS, the silica gel was changed regularly, and the flow rate was adjusted if the deviation was >1 %. The CPCs and DMPS-CPC systems were placed inside the measurement station, so the instruments were in stable condition (e.g., temperature and relative humidity). Hence, it can be assumed that the temperature and relative humidity of the samples entering the CPCs and DMPS-CPC were quite constant during the measurements. The AQ Urban sensors, on the other hand, were placed outside the container, but theor sample temperature was set to be 40 °C above the ambient temperature, so especially RH should not have affected measured PNC.The effect of regional and long-range transport of particulate matter to Helsinki metropolitan area can be seen by the elevated PM2.5 and BC concentrations measured at an Rural background site located in Luukki (60.3143° N, 24.6846° E). Luukki air quality measurement station is operated by the HSY and is a Helsinki metropolitan area rural background station situated in clean background area 20 km from the Traffic Supersite. At the Rural background site, no major local pollution sources are nearby and the increased concentrations of PM2.5 and BC are mainly due to long range or regional transport of particulate matter. The concentrations of PM2.5 and BC at Luukki measurement station were measured using the Fidas 200 (Palas GmbH) and Multi-Angle Absorption Photometer (MAAP, Thermo Electron Corporation) instruments. The further discussion is based on hourly-averaged data if not otherwise mentioned.
3.1 Comparison of particle number concentrations between AQ Urban sensors and CPCs
The boxplots of hourly-averaged PNC (particles cm−3) measured with the different AQ sensors during the two instrument comparison periods are shown in Fig. 1. The outliers corresponding to high measured PNC are omitted from boxplots in order to make their layout clearer. The linear regression between the PNC measured with different AQ Urban sensors (1–6) to the reference AQ Urban sensors are shown in Fig. S1 in the Supplement. The Pearson correlation coefficient (r) is 0.99 for all other AQ Urban sensors except for AQ Urban sensor 4 which had slightly lower correlation coefficient (r=0.97). This is probably due to few outliers in the data set which can be seen in the correlation plot in Fig. S1d. The slope of the linear regression of the measured PNC between AQ Urban sensors against the reference AQ Urban sensor varied between 1.0 and 1.06. The offset of the linear regression was negative or positive depending on the AQ Urban sensor, but it was low compared to the measured PNC. The agreement of PNC measured with different AQ Urban sensors can be concluded to be very good, which can be seen also from the time series in Fig. S2 in the Supplement.
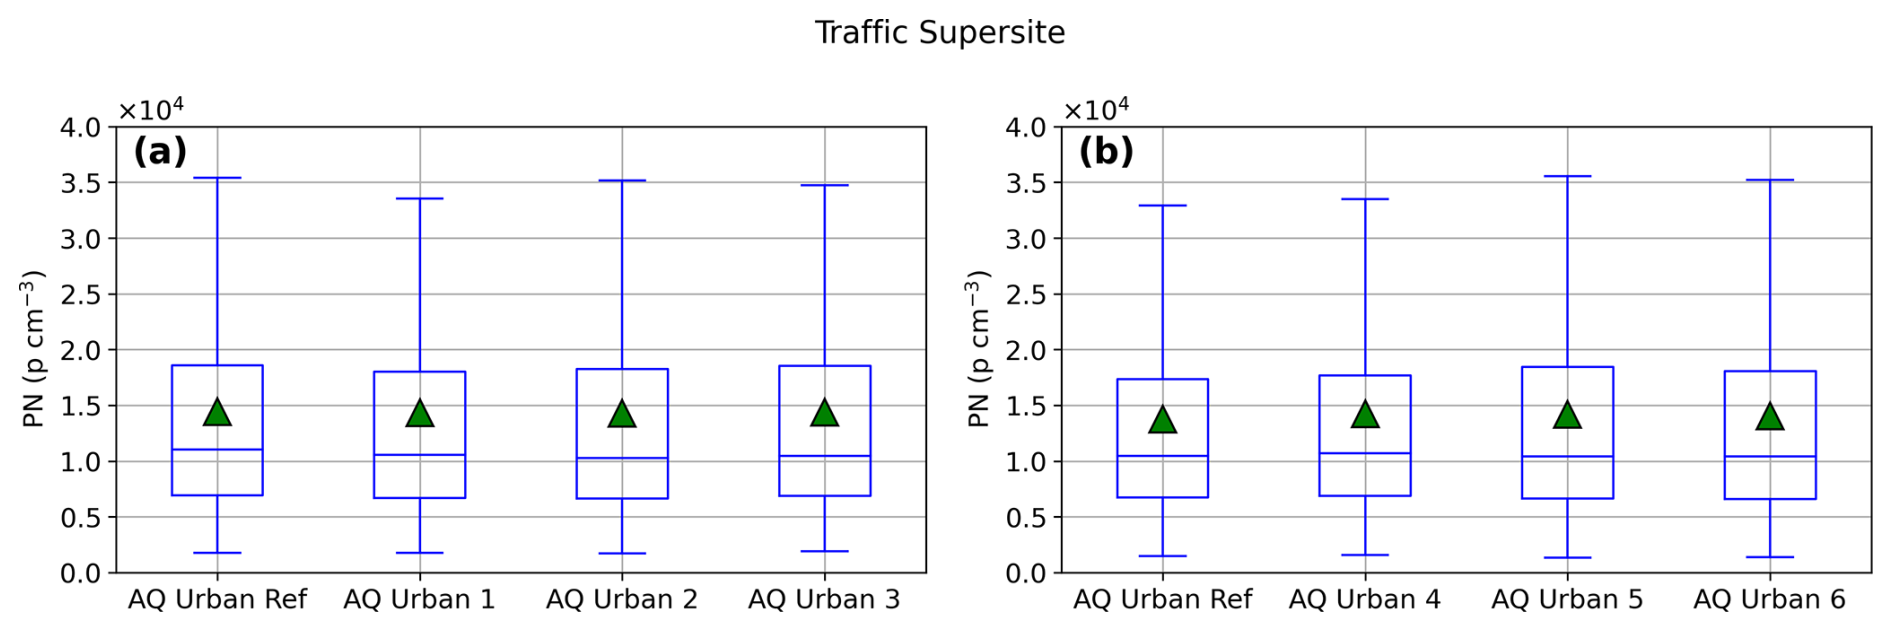
Figure 1Comparison of hourly-averaged PNC measured with seven different AQ Urban sensors at the Traffic Supersite during the first (a) and second (b) 3 week comparison period. The median is the horizontal line within the box, and the green triangle is the mean value. The box spans from the first to the third quartile, and the whiskers extend to 1.5 times the interquartile range. The outliers corresponding to high PNC are not shown in the figure.
During the instrument comparison period, PNC were measured at the Traffic Supersite also with two Airmodus A20 CPCs having different cut-sizes of 5.4 and 10 nm (Fig. 2). The measured hourly-averaged PNC with the reference AQ Urban sensor agreed more closely to that measured with the CPC having a cut-off size of 10 nm compared to that having a cut-off size of 5.4 nm. This is expected since 10 nm is the lower estimated detection limit of the AQ Urban sensor. The correlation coefficients (r) between the measured PNC with the reference AQ Urban sensor and the CPCs having a cut-off diameter of 5.4 and 10 nm were 0.98 and 0.97 respectively (Fig. S3a and b in the Supplement). The slope of CPCs having cut-off diameters 5.4 and 10 nm respect to AQ Urban sensors were 1.36 and 0.73 respectively (Fig. S3a and b). The lower particle number concentrations measured with the AQ Urban compared to the CPC with the cut-off size 5.4 nm is due to the different lower detection limits of these two instruments. Especially in the vicinity of heavily trafficked streets the concentration of particles below 10 nm can expect to be high (e.g. Belkacem et al., 2020; Choi et al., 2014; Rönkkö and Timonen, 2019) and has been measured to be significant also at the Traffic Supersite (Hietikko et al., 2018; Teinilä et al., 2024). The lower slope of the linear regression with the CPC with cut-off size of 10 nm and to AQ Urban sensor detects the charge fraction of particles below 10 nm (Fig. S3c).
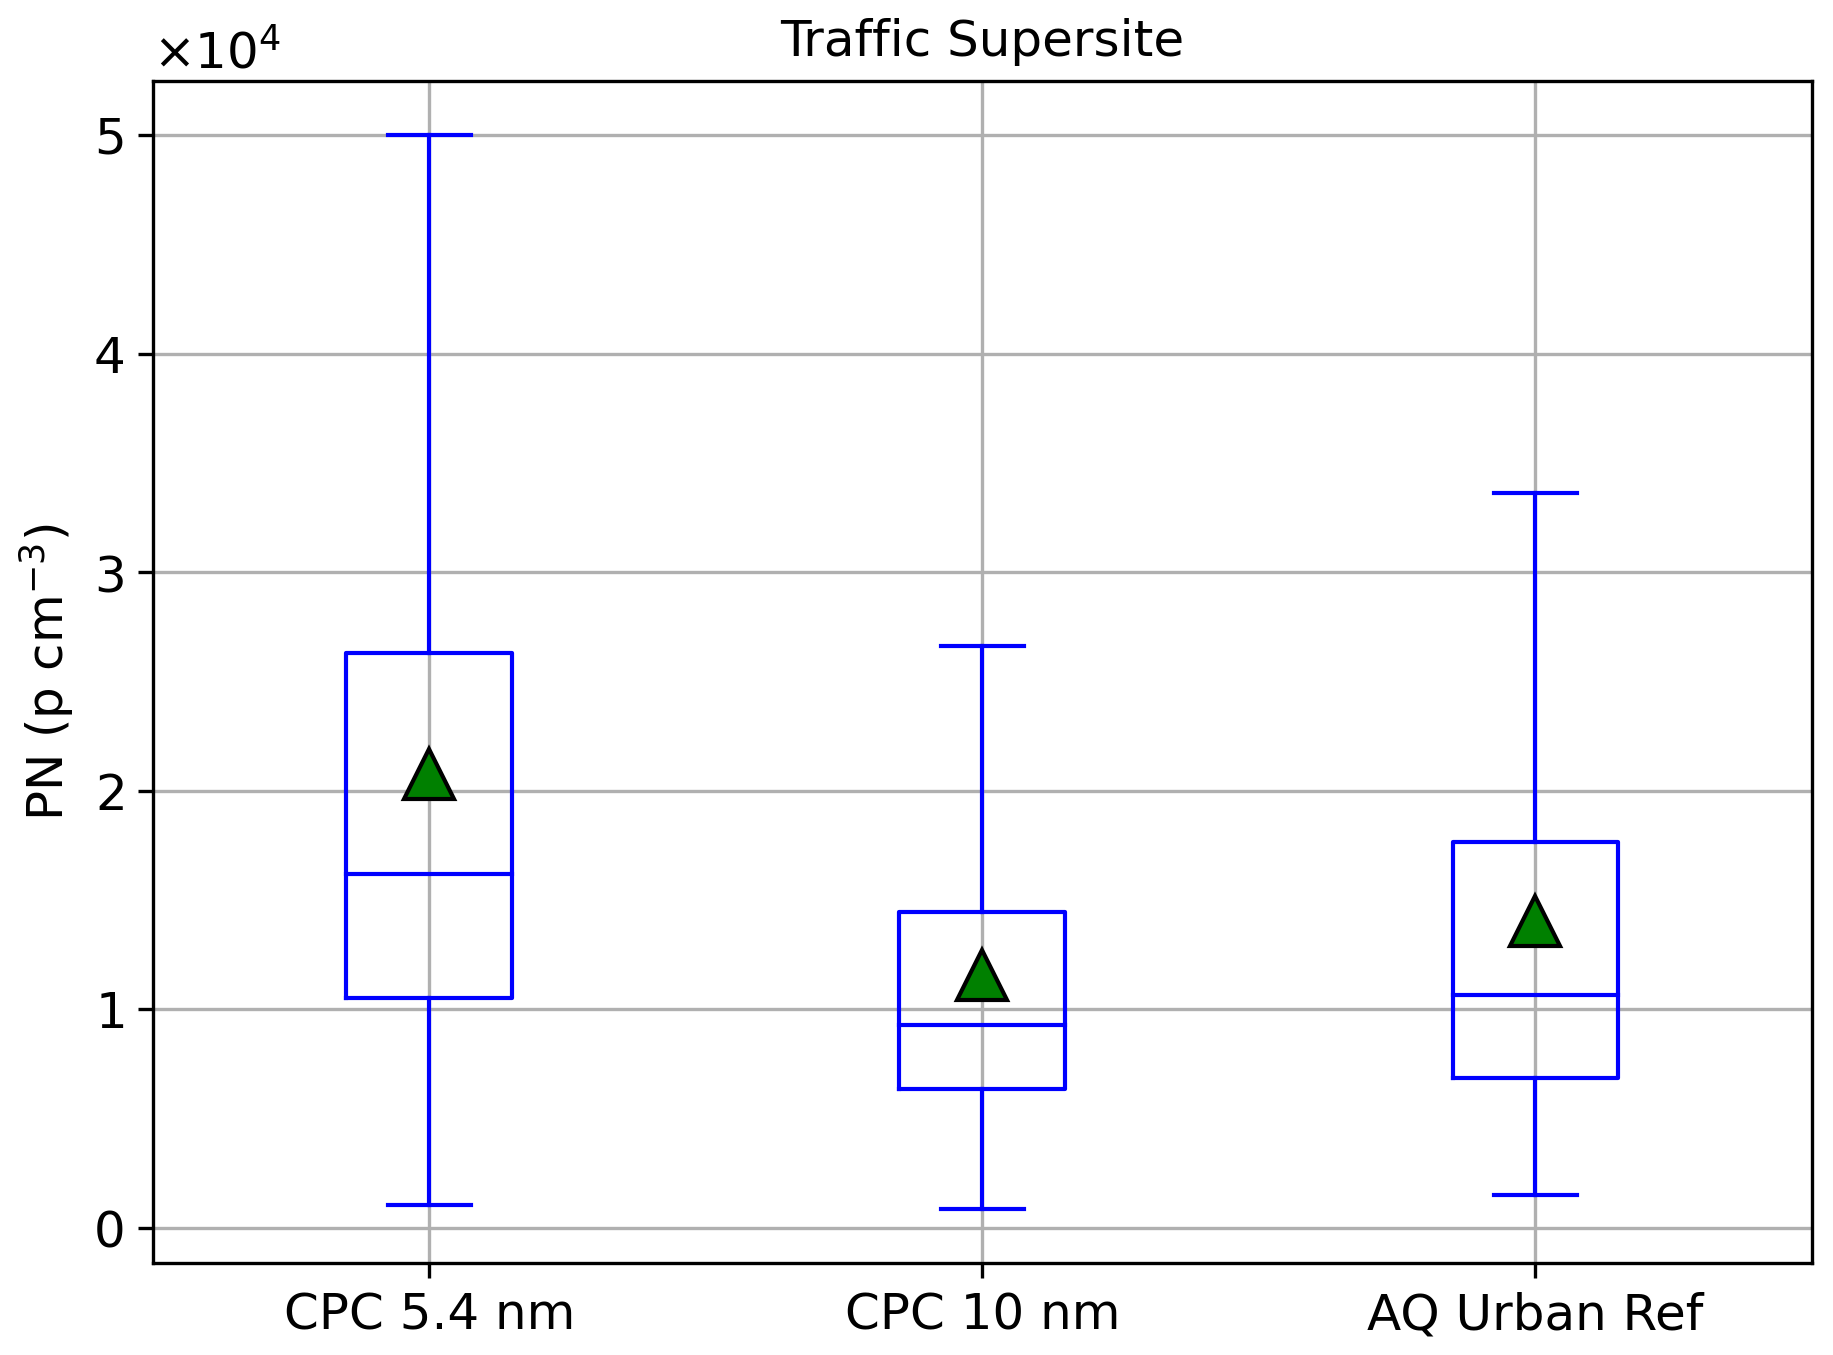
Figure 2Comparison of hourly-averaged PNC measured with the reference AQ Urban sensor and two CPCs with different cut sizes at the Traffic Supersite during the 6 week period. The median is the horizontal line within the box, and the green triangle is the mean value. The box spans from the first to the third quartile, and the whiskers extend to 1.5 times the interquartile range. The outliers corresponding to high PNC are not shown in the figure.
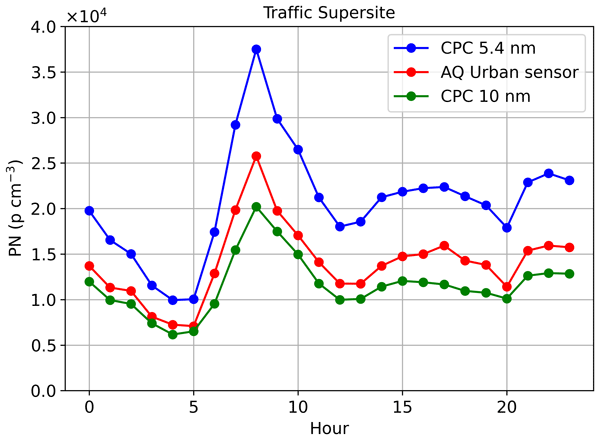
The hourly diurnal variations of PNC measured with two CPCs with different cut sizes and the reference AQ Urban sensor during the comparison period are shown in Fig. 3a and the differences in the measured PNC in Fig. 3b. The diurnal patterns of the measured PNC with the different instruments are identical although the measured PNC are different showing that they all observe the contribution of traffic on the PNC Especially, during the morning rush hours, the PNC increased at the Traffic Supersite (Fig. 3a). The higher PNC during the morning rush hour was likely related to the more efficient dilution and mixing of pollutants during afternoon. Also, the lanes of traffic towards the city center were closer to the measurement station, which may emphasize the effects of morning rush hour when people are heading towards city centre. The evidence of the existence of particles below 10 nm can be seen when comparing the two CPCs during the rush hours. Also, the slope of the measured PNC between the CPC with cut-off size 5.4 nm with respect to the CPC with cut-off size 10 nm was 1.80 (Fig. S3c). The AQ Urban sensor measured higher PNC compared to the CPC with the cut-off size 10 nm during the rush hours. This result further supports the idea that the lower detection limit of AQ Urban sensor was less than 10 nm. However, it is also possible that the AQ Urban sensor estimated the count median diameter (CMD) erroneously (see the discussion in the next chapter).
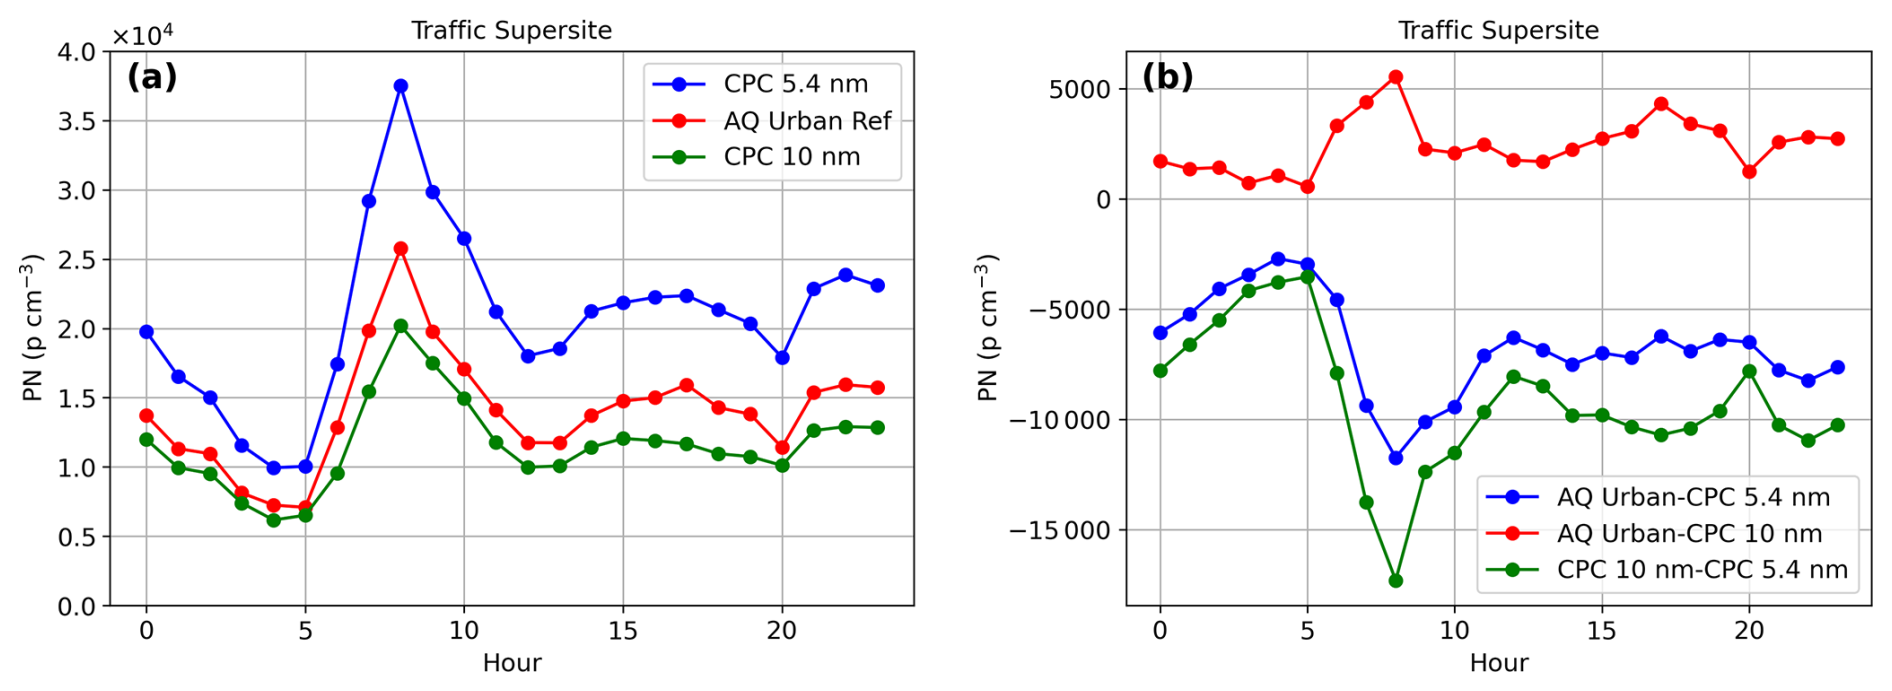
Figure 3Hourly diurnal variation of the measured PNC (a) and the PNC difference (b) measured with two CPCs having different cut-size and the reference AQ Urban sensor during the 6 week comparison period at the Traffic Supersite.
3.2 Particle number concentrations measured in two different environments in Helsinki
The PNC measured with the AQ Urban sensor and the CPCs in two different urban environments (Traffic Supersite and UB Supersite) were compared between 1 January and 15 August 2022. At the UB Supersite the average PNC measured with the AQ Urban sensor was like that measured with the CPC having a cut-off size 7 nm (Fig. 4). At the Traffic Supersite the measured PNC with the AQ Urban sensor were lower compared to those measured with the CPC having a cut-off size 5.4 nm which was observed also during the six-week comparison period.
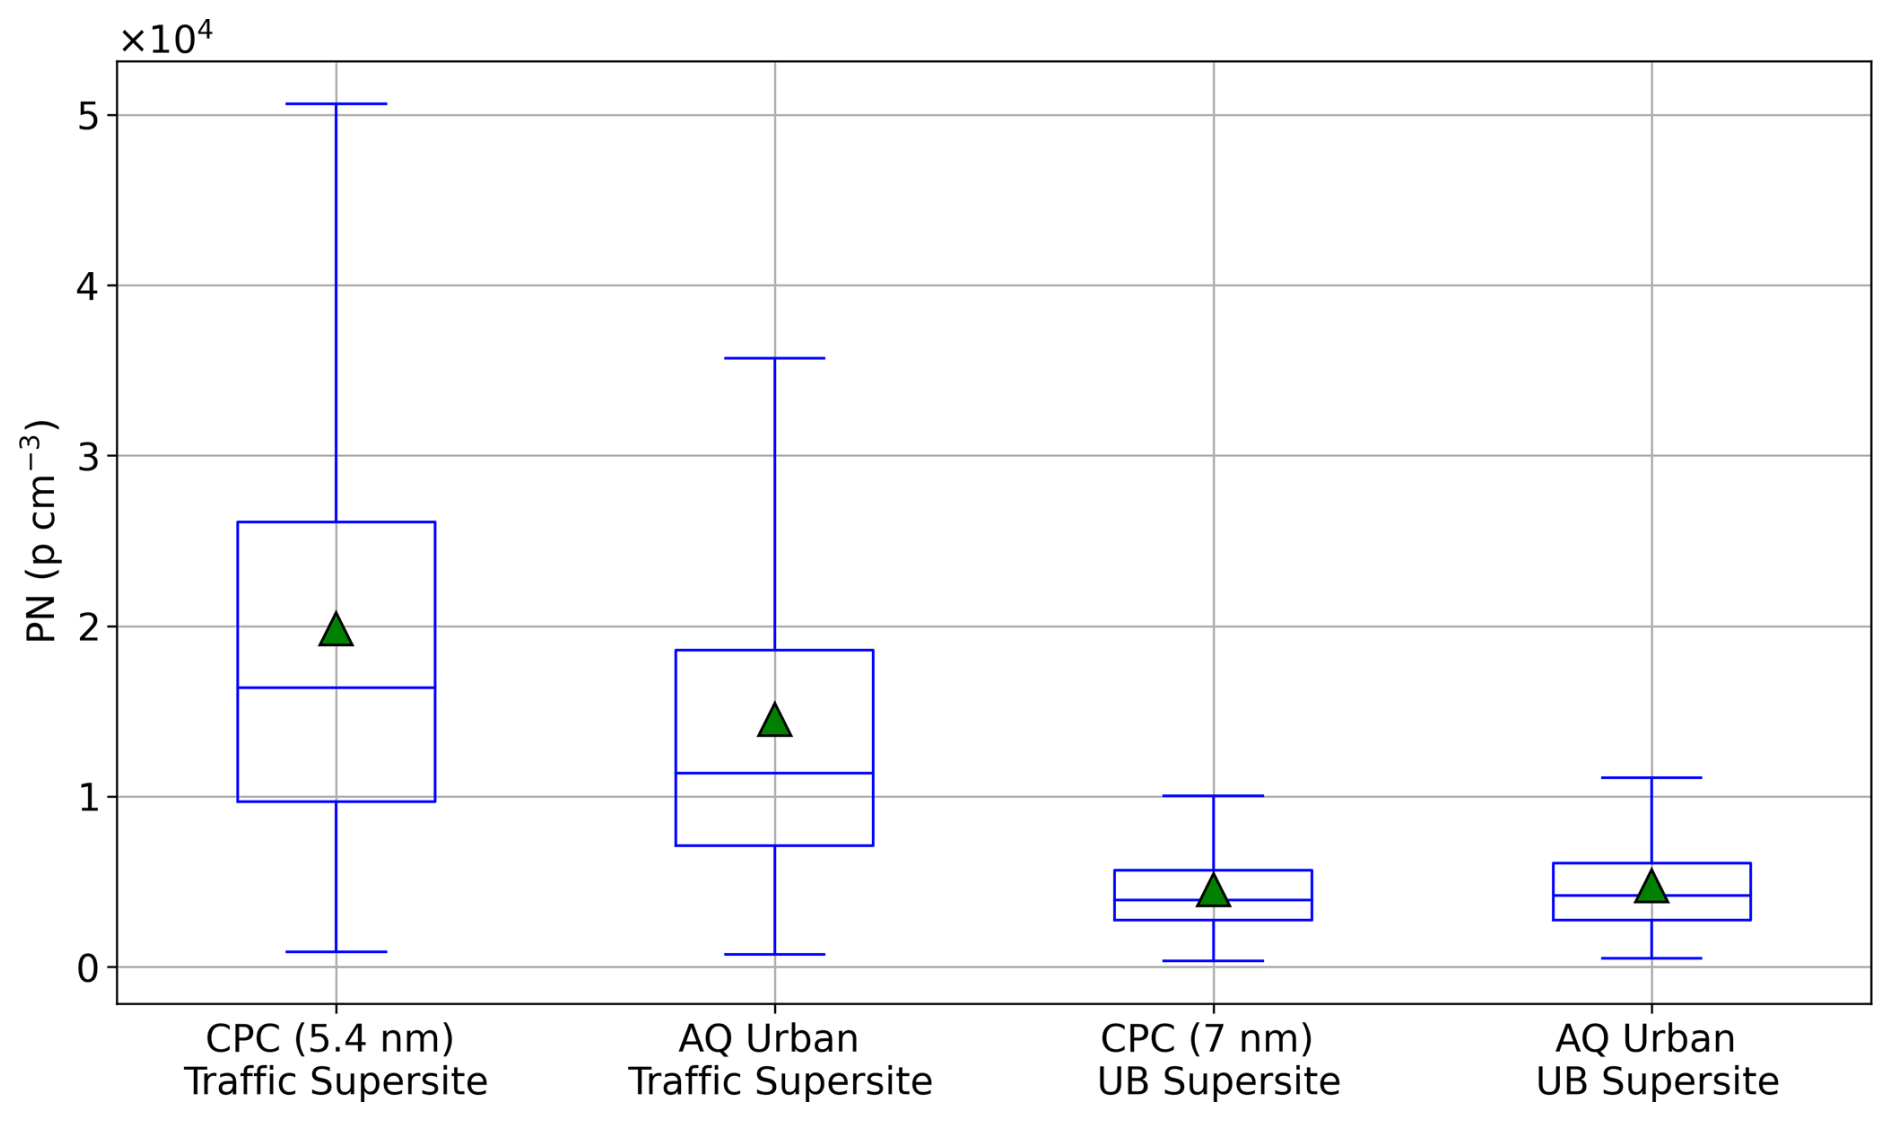
Figure 4Comparison of hourly-averaged PNC measured with the AQ Urban and CPCs at the Traffic Supersite and at the UB Supersite during the 7.5 month measurement period. The cut-off size of the CPC at the Urban traffic site was 5.4 nm and at the Urban background site 7 nm. The median is the horizontal line within the box, and the green triangle is the mean value. The box spans from the first to the third quartile, and the whiskers extend to 1.5 times the interquartile range. The outliers corresponding to measured high PNC are not shown in the figure.
The hourly diurnal variation of the PNC measured with the AQ Urban sensors and the CPCs at both sites are shown in Fig. 5a and the difference of the measured PNC between the AQ Urban sensors and the CPCs in Fig. 5b.
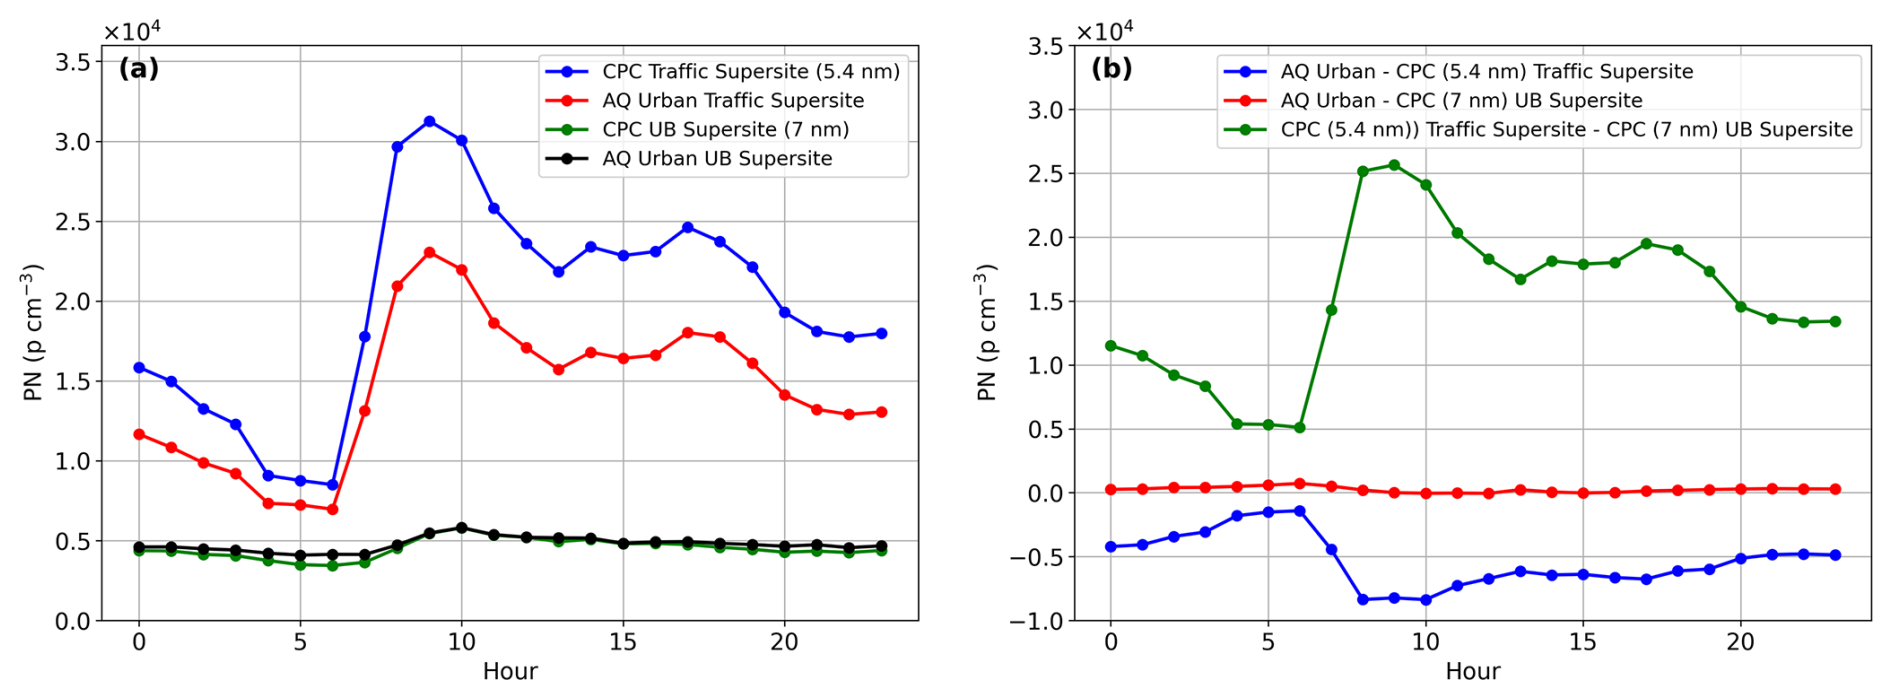
Figure 5Hourly diurnal variation of measured PNC at the Traffic Supersite and at the UB Supersite with the AQ Urban sensors and the CPCs (a) and the difference of the measured PNC (b) during the 7.5 month measurement period. Notice the different cut-sizes of the CPCs.
At the UB Supersite the difference in the measured PNC with the AQ Urban sensor and CPC is close to zero throughout the day. At the Traffic Supersite this difference is negative throughout the day, and the difference starts to increase when the morning rush hour starts as was observed at the Traffic Supersite also during the comparison period. The difference in the cut-off size of the CPCs at these two sites was only 1.6 nm so it probably cannot explain the markedly higher differences of the two instruments. The observed difference is likely connected to the different concentrations and particle size distributions between these sites. This idea is supported by the hourly-averaged particle number size distributions in Fig. S4 in the Supplement which show that at the Traffic Supersite the PNC for particles<30 nm increase during the morning rush hour. The DMPS data below 10 nm is not available from the Traffic Supersite, but the shape of the size distributions indicates an increasing trend of PNC also below 10 nm size (Fig. S4a). On the other hand, the PNC shows decreasing trend during all hours at the UB Supersite for particles<10 nm (Fig. S4b). The size distribution results suggest that particles<10 nm do not considerably contribute at the UB Supersite. Hence, the much lower concentration of particles below 10 nm at the UB Supersite is probably the main reason for the better agreement between AQ Urban and the CPC in terms of average concentration.
The linear correlations of the measured PNC with the AQ Urban sensors and the CPCs at the Traffic Supersite and at the UB Supersite are shown in Fig. 6, where the data set was divided based on the median of the Rural background site PM2.5 concentration into two data sets; and . The linear correlations of the measured PNC with the AQ Urban sensor containing the whole data set (not divided) are shown in Fig. S5 in the Supplement. The slope of the linear regression was slightly higher (1.23, r=0.94) compared to the whole data set (1.17, r=0.93, Fig. S5) at the Traffic Supersite when PM2.5 concentration at the Rural background site was elevated and lower (1.09, r=0.93) when its concentration was low. At the UB Supersite the slope of the linear regression was same for the whole data set (0.83, r=0.89, Fig. S5) and for the data set where the low Rural background site PM2.5 points were discarded (r=0.86). However, when discarding the data points with high PM2.5 concentration at the Rural background site, the slope increased from 0.83–0.93 together with increasing correlation coefficient (r) which increased from 0.86–0.96. These results suggest that the PNC measurement of the AQ Urban was affected by the regional background PM2.5 concentrations. This idea is supported also by the colored scatter plots in Fig. S6 in the Supplement (and Fig. S5a and c), where the slope of this linear correlation seemed to be dependent on the PM2.5 concentration measured at the Rural background site. The daily-averaged time series of PM2.5 in Fig. S6 shows that the periods of elevated PM2.5 concentrations are typically seen at all sites, indicating either regional or long-range transportation. During the winter BC concentration at the Rural background site increases simultaneously with the PM2.5 concentration.
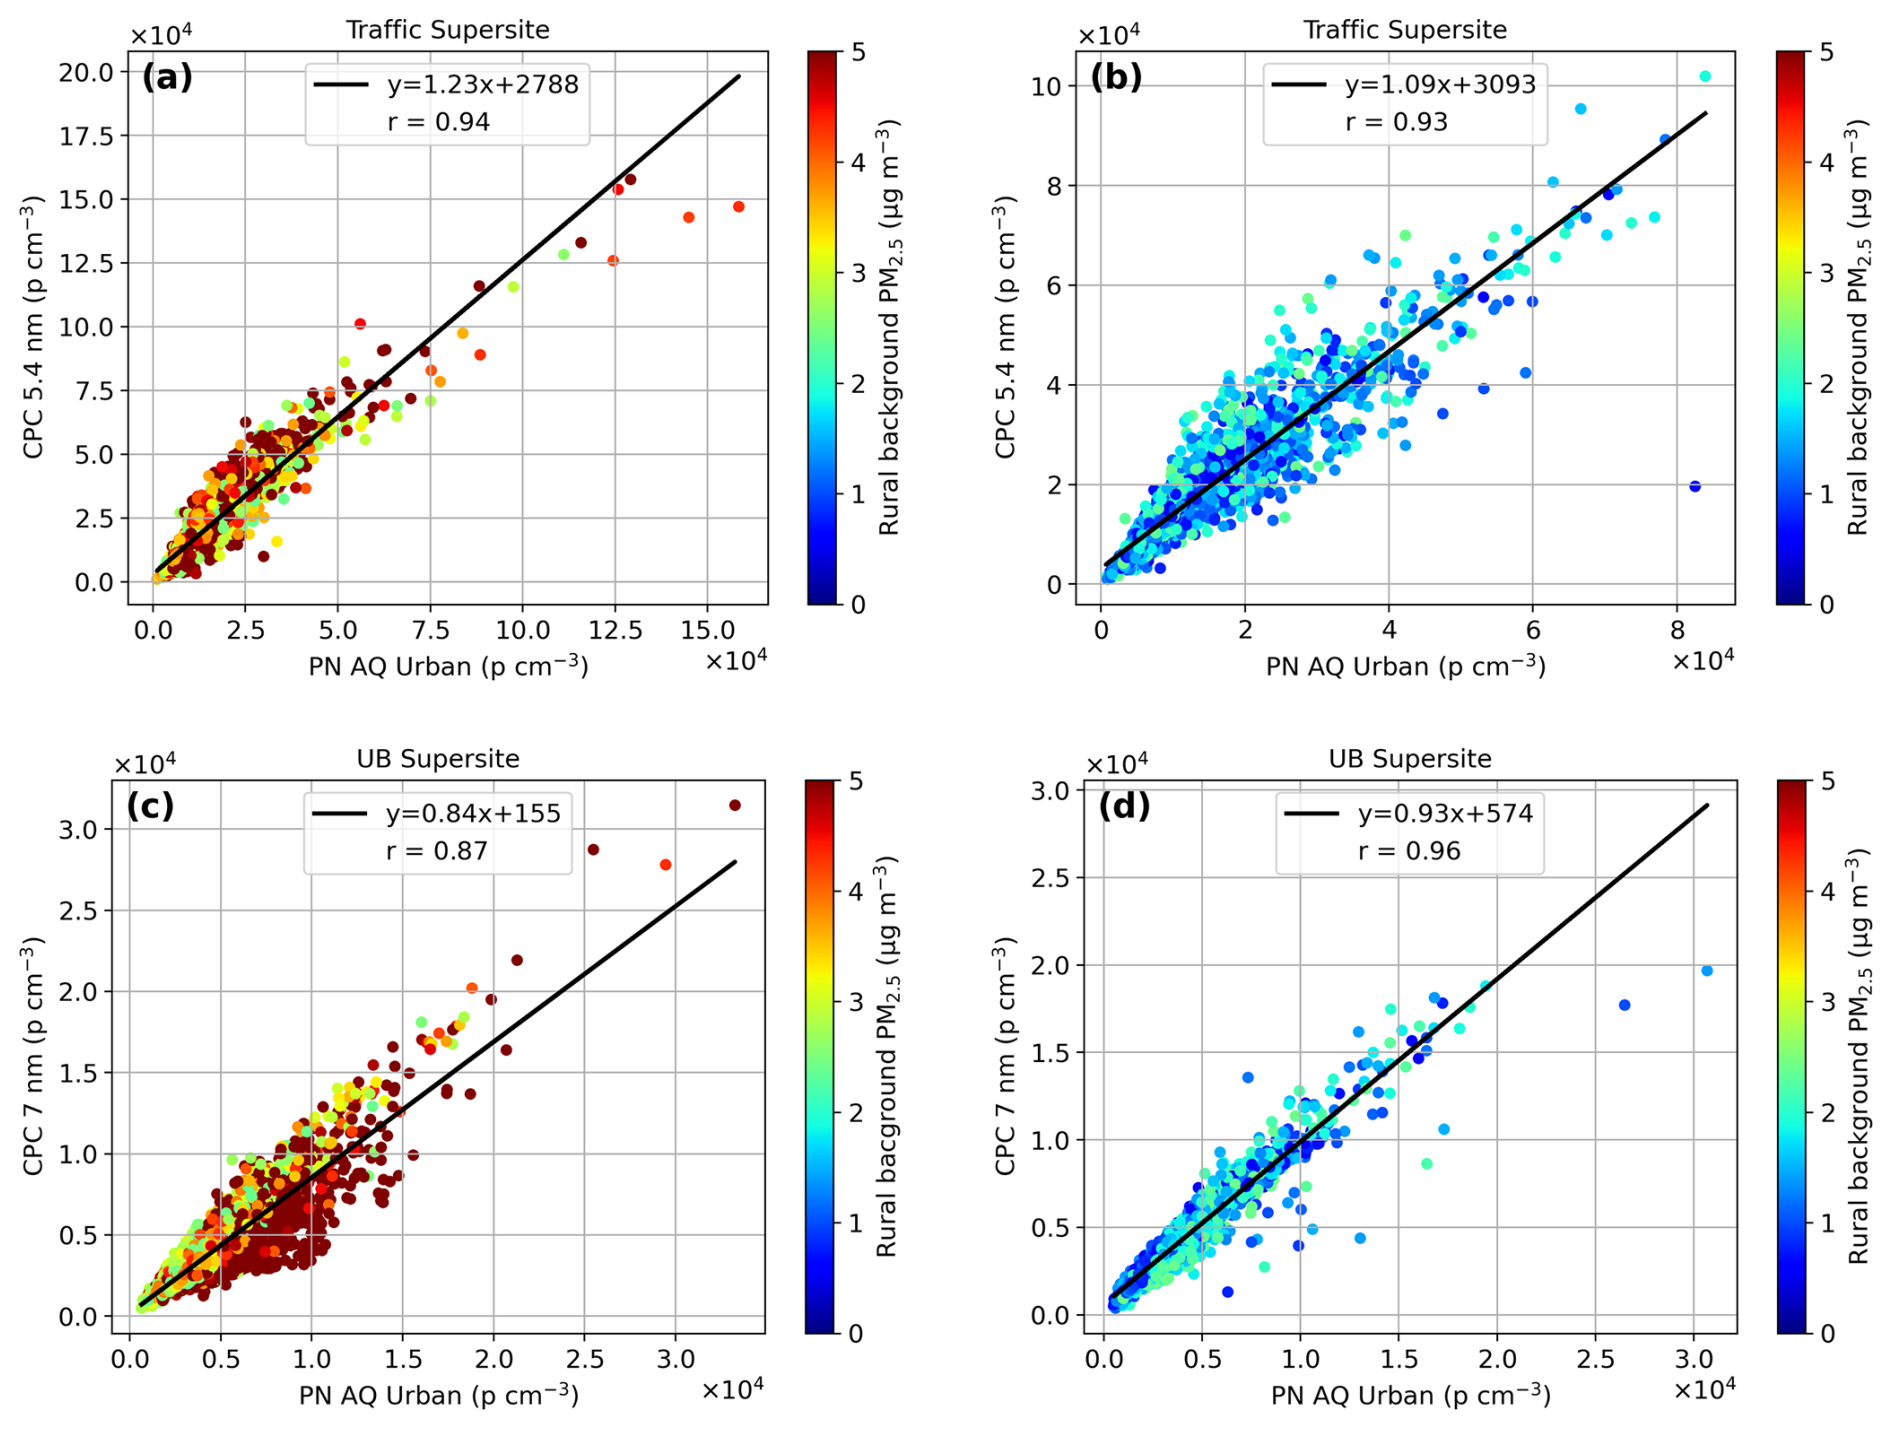
Figure 6Linear correlation of hourly-averaged particle number concentrations measured with the AQ Urban sensor and CPC at the Traffic Supersite and at the UB supersite during high (a, c) and low (b, d) PM2.5 concentrations at the Rural background site during the 7.5 month measurement period. The color of the markers indicates PM2.5 concentration at the Rural background site.
In Fig. S5b and d, the scatter plots, colored by the measured concentrations of NOx at the same sites where the PNC were measured, are shown. At the Traffic Supersite higher PNC were measured together with high NOx concentrations due to their common source (motor vehicle emissions, Fig. S5b). However, the linear correlation of PNC measured with the AQ Urban sensor and CPC was similar despite the varying NOx concentrations at least at the Traffic Supersite (Fig. S5a).
The results in Figs. 6 and S5 show the agreement with the measured PNC between AQ Urban sensors and CPCs seem to be near unity when discarding the periods with regional or long-range transport (high PM2.5 at the Rural background site). The transported particles are aged and have larger sizes, and they mix externally with the traffic related ultrafine particles forming bimodal particle size distribution, potentially affecting the performance of the AQ Urban. Interestingly, however, the effect of increased regional PM2.5 seems to be different at the Traffic Supersite (increased PM2.5 increased the slope) compared to the UB Supersite (increased PM2.5 decreased the slope). The following paragraphs discuss the effect of particle size distribution and PM2.5 concentration on the measured PNC with AQ Urban sensor in more detail.
The monthly-averaged particle size distributions in Fig. 7a and b show that the size distributions shifted towards larger particle size during the measurement period and the bimodal structure of the particle size distribution became clearer. The mean particle size increased towards the summer months, which can be seen also when looking the daily-averaged time series in Fig. S6, where the count median diameter from the AQ Urban sensor and the mean particle diameter calculated from the DMPS data increased toward the summer months. Like the effect of PM2.5 in Figs. 6 and S5, the increased bimodality and mean particle diameter affected the ratio of the PNC measured with the CPCs and the AQ Urban sensors (Fig. S6). However, the ratio between CPCs and AQ Urbans increased at the Traffic Supersite and decreased at the UB Supersite. In general, it is not clear why the particle size increases during summer months. The possible reason may be the growth of particles due to more favorable secondary aerosol formation via oxidation of organic matter from motor vehicle exhaust during summer months (e.g. Ahlm et al., 2012; Gentner et al., 2017, 2012). During the summer months the increased solar radiation, increased water content (Fig. S7 in the Supplement) and increased concentrations of biogenic organic matter may be another explanation for this growth (e.g. Srivastava et al., 2022).
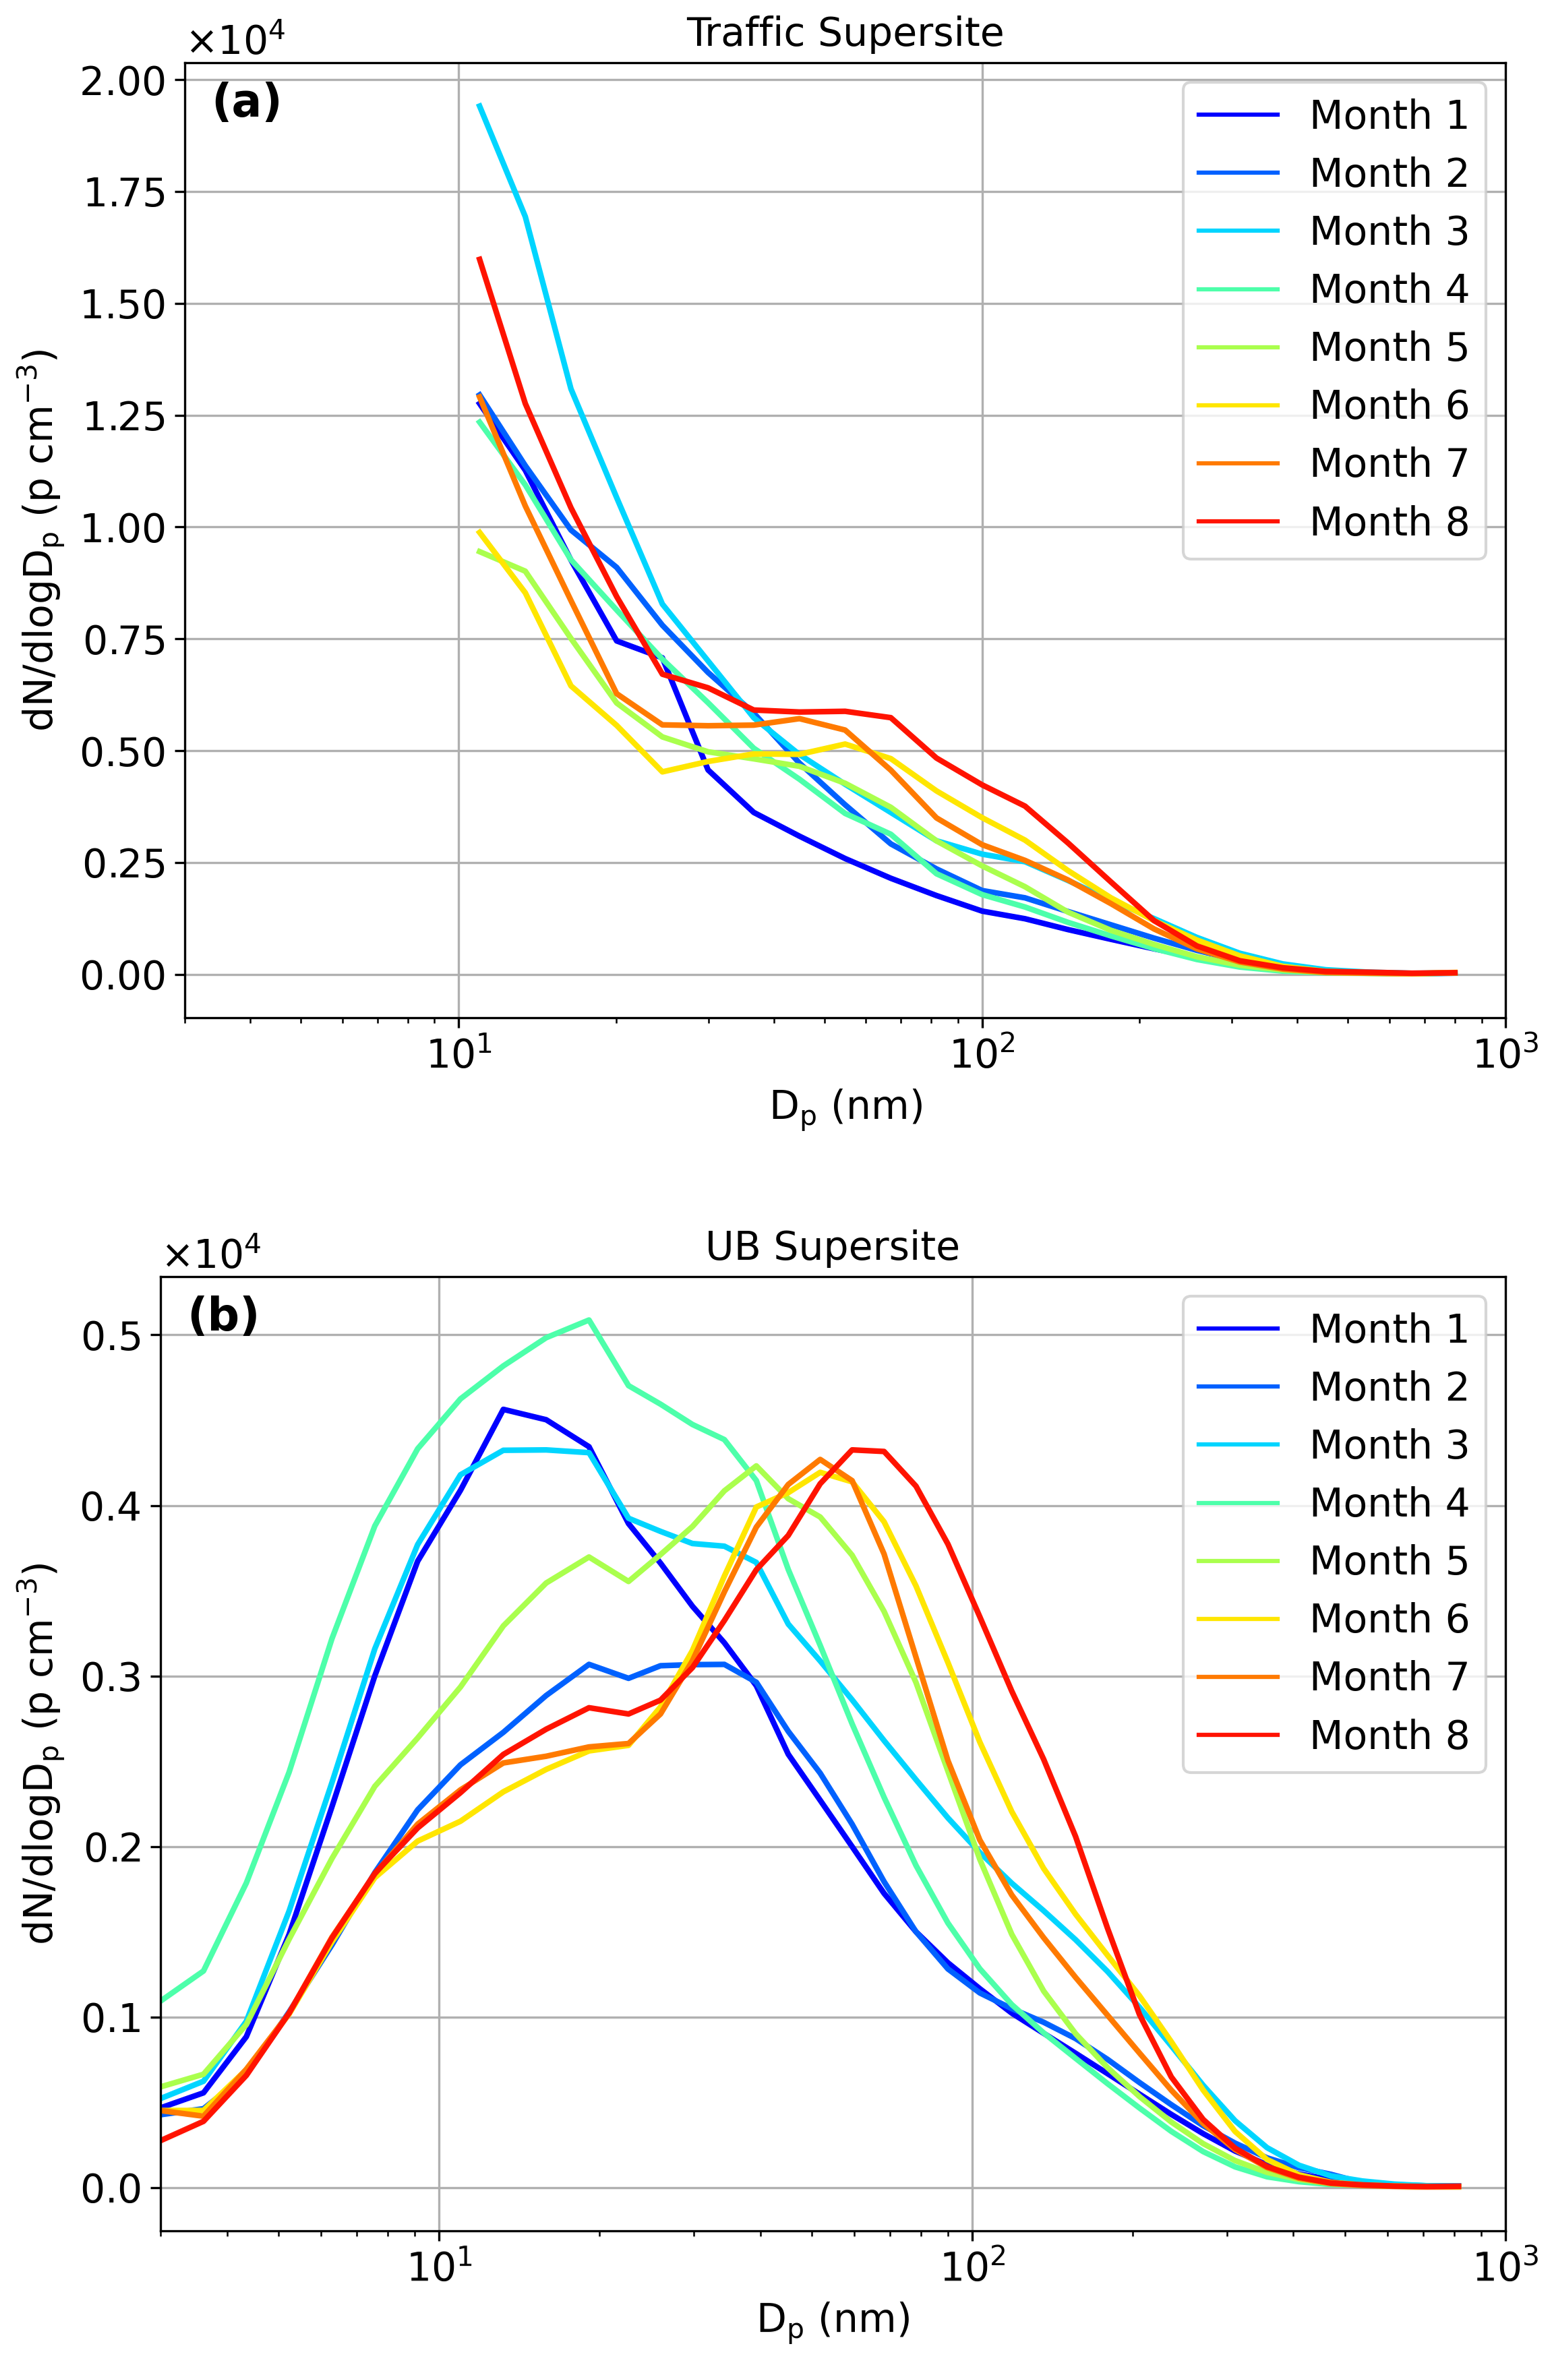
Figure 7Monthly-averaged particle number size distributions measured with DMPS at the Traffic Supersite (a) and at the UB Supersite (b) during the 7.5 month measurement period.
Results on the effects of regional PM2.5 (Figs. 6 and S5) and the seasonality (Figs. 7 and S8 in the Supplement) both suggest that the effect of bimodal particle size distribution on the performance of AQ Urban is different. This finding could be explained by the varying particle characteristics at these microenvironments. At the Traffic Supersite the PNC was constantly high due to the road traffic. During the regional and long-range transport periods the observed particle size distribution was not anymore unimodal due to the external mixing of traffic-related and regional and long-range transported particles. The AQ Urban sensor estimates the count median diameter using the assumption that the particle size distribution is unimodal. Therefore, the increased regional background concentration causes an increase in the estimated count median diameter, which reduces the conversion factor used to convert the electric current to PNC. The increased accumulation mode, however, does not considerably affect the total PNC, which is still dominated by particles smaller than 20 nm (Fig. 7a). Hence, even though the accumulation mode particles also affect the electric current measured by the AQ Urban, the decreased conversion factor due to the increased estimated CMD, causes the sensor to underestimate the PNC at the highly trafficked site.
At the UB Supersite the effect of traffic was low compared to traffic supersite, and the particle size distribution was constantly concentrated on larger particle sizes (Fig. 7b). When particle size distribution was shifted to even larger particle sizes (during summer or pollution transportation event) the AQ Urban sensor measures higher electric current. The maximum limit of the estimated count median diameter of the AQ Urban sensor is ∼100 nm but during the regional or long-range transport periods, the size of the particles contributing the most to the measured electric current may be above this limit, and so the AQ Urban sensor overestimates PNC.
In Fig. S9 in the Supplement, comparison of measured PNC distributions between AQ Urban sensors and CPCs having different cut-off sizes are shown during the measurement period (Fig. S9a and b) at both sites. At the UB Supersite where the CPC cut-off size was 7 nm the measured PNC distributions between AQ Urban sensor and CPC showed good agreement. At the Traffic Supersite there was clearly underestimation of PNC with AQ Urban sensor when particle concentrations were higher, due to the higher fraction of ultrafine particles (below 10 nm) and due to the lower cut-off size of the used CPC. It seems also that some overestimation of PNC was seen when concentrations were low. During low PNC concentrations, the uncertainties related to bimodal size distribution could be more evident, explaining this result. Figure S9c and d show the comparison of measured PNC distributions between AQ Urban sensor and the CPC having a cut-off size 10 nm as well as comparison between the two CPCs with different cut-off sizes during the 6 week comparison period at the Traffic Supersite.
Overall, the effect of bimodal size distribution on the AQ Urban measurement is important to consider when conducting measurements in varying urban environments and geographic regions. As seen in the results, the performance of AQ Urban in the PNC measurement was mainly very good in our measurements. However, the regional particle concentration, thus, the accumulation mode of particles, was typically very low, which seemed to be especially suitable for the performance of AQ Urban. It should be noted that the uncertainty caused by the bimodal size distribution could be much more significant in locations where regional background concentrations are higher, like Central/Eastern Europe or India (Sebastian et al., 2022; Trechera et al., 2023). Also, some particle sources, like residential wood combustion, can considerably contribute to concentrations of particles larger than 100 nm (Harni et al., 2023; Kalkavouras et al., 2024) potentially causing similar challenges as the increased regional background concentration. In general, it's, however, worth noting that the measurement principle of AQ Urban is rather like other diffusion charger-based PNC sensors, like the Partector 2 (Asbach et al., 2024). The challenge of bimodal size distribution has also been observed earlier when considering the LDSA measurement of the diffusion charger-based sensors (Lepistö et al., 2024). Hence, it is justifiable to think that the challenge related to bimodal size distribution could be relevant for other diffusion-charger based PNC sensors as well.
We investigated the possibility of using AQ Urban sensors in urban air quality monitoring to obtain PNC. The comparisons were made at two different sites, at a heavily trafficked street canyon (Traffic Supersite) and at an urban background site (UB Supersite) in 2022. First, the agreement between different AQ Urban units were investigated in two three-week lasting campaigns (30 August and 10 October 2022) in the Traffic Supersite: the agreement with the measured particle number concentrations within total of seven different AQ Urban sensors was good (Pearson r: 0.97–0.99, linear fit slopes: 1.0–1.06), showing that results with different AQ Urban units are well comparable in general. During this comparison period, the PNC measured with a reference AQ Urban sensor were also compared to those measured with two CPCs having cut-off sizes 5.4 and 10 nm. On average, the PNC measured with the AQ Urban sensor were slightly higher than those measured with the CPC having a cut-off size 10 nm. The relative difference was, however, low compared to the measured PNC. Also, the correlation between the reference AQ Urban sensor and the 5.4 and 10 nm CPCs were 0.98 and 0.97, respectively. These findings show that AQ Urban sensors should be well-suitable to measure the concentration of particles approx. larger than 10 nm in highly trafficked areas.
The long-term agreement between AQ Urban sensors and CPCs was also investigated at the Traffic Supersite and UB Supersite (1 January and 15 August 2022). Overall, the correlation between AQ Urban sensors and the CPCs was good at both sites (r being 0.93 and 0.89, respectively), even though the cut-off sizes of the CPC at these two sites were different (5.4 and 7 nm) compared to the lower limit of AQ Urban sensors (approx. 10 nm). The difference between AQ Urban sensors and the CPCs increased especially during traffic rush hours at the Traffic Supersite. This result can, however, be explained because of the increased emissions of particles smaller than 10 nm from traffic which are not detected with the AQ Urban sensor. On the other hand, it was noted that especially long-range transported (LRT) pollution episodes as well as time of the year can affect the accuracy of AQ Urban sensors. This result can be explained by the bi-modal particle size number distributions observed especially during the LRT-episodes and summer, because AQ Urban sensor estimates the count median diameter of particles assuming that the particle number size distribution is unimodal. Hence, the conversion from the detected electric current into PNC cannot accurately estimate the size of the detected particles, causing uncertainty in the measurement. Despite this downside of the method, it should be noted that the correlation between the AQ Urban sensor and the CPCs was good during the whole measurement period, indicating that the sensor is well-suitable for long-term particle number concentration monitoring in Helsinki.
Overall, the results show that AQ Urban sensor was well suitable to measure the number concentration of particles approximately larger than 10 nm in two different urban environments in Helsinki, Finland. The result is interesting regarding the EU's new air quality directive (2024) which requires particle number (>10 nm) concentration monitoring at pollution hotspots. The results show that diffusion charger-based measurement of PNC should be well-suitable for urban air quality monitoring, enabling more-dense sensor monitoring network than CPC methodology. For example, the sensors could be utilized to estimate potential hotspots for the measurements required by the directive. Still, it should be noted that further validation of diffusion charger-based particle number measurements is needed. Even though the challenges caused by bi-modal particle number size distributions in this study were rather minimal, it needs to be considered that Finland has very clean air in terms of regional pollution (e.g., PM2.5). Hence, the challenges caused by bi-modal particle number size distribution could be much more significant in locations with higher regional pollution, i.e., higher accumulation mode of particles. Thus, further studies of the performance of diffusion charger-based particle number sensors from different locations would be valuable for further conclusions.
Data available on request.
The supplement related to this article is available online at https://doi.org/10.5194/amt-19-4505-2026-supplement.
TL, JVN, TR, ES and HT participated the conceptualization; KT, TL, JVN, TR, ES and HT wrote the original manuscript draft; KT, JVN, HP, AJ and PA participated the data curation; KT and JVN participated the data visualization; JVN, HP, AJ and PA participated the investigation; JVN, HEM, TP, TR and HT participated the funding acquisition: All authors participated in the interpretation of the results, manuscript review and editing.
The contact author has declared that none of the authors has any competing interests.
Publisher's note: Copernicus Publications remains neutral with regard to jurisdictional claims made in the text, published maps, institutional affiliations, or any other geographical representation in this paper. The authors bear the ultimate responsibility for providing appropriate place names. Views expressed in the text are those of the authors and do not necessarily reflect the views of the publisher.
This work was supported by the Technology Industries of Finland Centennial Foundation to Urban Air Quality 2.0 project, the EU Horizon 2020 Framework Programme via the Research Infrastructures Services Reinforcing Air Quality Monitoring Capacities in European Urban and Industrial Areas (RI-URBANS) project (GA-101036245), European Union's Horizon Europe research and innovation programme under grant agreement no. 101096133 (PAREMPI: Particle emission prevention and impact: from real-world emissions of traffic to secondary PM of urban air), GIANT (Global trends in IAQ: Novel technologies, Competence and Business, no. 4736/31/2023)) funded by Business Finland and participating companies, and the Academy of Finland ACCC Flagship (grant nos. 337552, 337551, 337549).
This research has been supported by the Teknologiateollisuuden 100-Vuotisjuhlasäätiö (grant no. GA-101036245), the EU Horizon 2020 (grant no. 101096133), the Business Finland (grant no. 4736/31/2023), and the Research Council of Finland (grant nos. 337552, 337551, and 337549).
This paper was edited by Francis Pope and reviewed by Jason Southgate and one anonymous referee.
Ahlm, L., Liu, S., Day, D. A., Russell, L. M., Weber, R., Gentner, D. R., Goldstein, A. H., DiGangi, J. P., Henry, S. B., Keutsch, F. N., VandenBoer, T. C., Markovic, M. Z., Murphy, J. G., Ren, X., and Scheller, S.: Formation and growth of ultrafine particles from secondary sources in Bakersfield, California, J. Geophys. Res.-Atmos., 117, https://doi.org/10.1029/2011JD017144, 2012.
Asbach, C., Todea, A. M., and Kaminski, H.: Evaluation of a Partector Pro for atmospheric particle number size distribution and number concentration measurements at an urban background site, Aerosol Research, 2, 1–12, https://doi.org/10.5194/ar-2-1-2024, 2024.
Atkinson, R. W., Kang, S., Anderson, H. R., Mills, I. C., and Walton, H. A.: Epidemiological time series studies of PM2.5 and daily mortality and hospital admissions: a systematic review and meta-analysis, Thorax, 69, 660–665, https://doi.org/10.1136/thoraxjnl-2013-204492, 2014.
Aurela, M., Saarikoski, S., Niemi, J. V., Canonaco, F., Prevot, A. S. H., Frey, A., Carbone, S., Kousa, A., and Hillamo, R.: Chemical and Source Characterization of Submicron Particles at Residential and Traffic Sites in the Helsinki Metropolitan Area, Finland, Aerosol Air Qual. Res., 15, 1213–1226, https://doi.org/10.4209/aaqr.2014.11.0279, 2015.
Barreira, L. M. F., Helin, A., Aurela, M., Teinilä, K., Friman, M., Kangas, L., Niemi, J. V., Portin, H., Kousa, A., Pirjola, L., Rönkkö, T., Saarikoski, S., and Timonen, H.: In-depth characterization of submicron particulate matter inter-annual variations at a street canyon site in northern Europe, Atmos. Chem. Phys., 21, 6297–6314, https://doi.org/10.5194/acp-21-6297-2021, 2021.
Belkacem, I., Khardi, S., Helali, A., Slimi, K., and Serindat, S.: The influence of urban road traffic on nanoparticles: Roadside measurements, Atmos. Environ., 242, 117786, https://doi.org/10.1016/j.atmosenv.2020.117786, 2020.
Carbone, S., Aurela, M., Saarnio, K., Saarikoski, S., Timonen, H., Frey, A., Sueper, D., Ulbrich, I. M., Jimenez, J. L., Kulmala, M., Worsnop, D. R., and Hillamo, R. E.: Wintertime Aerosol Chemistry in Sub-Arctic Urban Air, Aerosol Sci. Tech., 48, 313–323, https://doi.org/10.1080/02786826.2013.875115, 2014.
CEN: EN 16976:2024 Ambient air – Determination of the particle number concentration of atmospheric aerosol, European Committee for Standardization, https://standards.iteh.ai/catalog/standartds/cen/ab8b1143-a1d3-481b-b268-38a3b1da18b7/en-169976-2024 (last access: 26 June 2026), 2024.
Choi, W., Winer, A. M., and Paulson, S. E.: Factors controlling pollutant plume length downwind of major roadways in nocturnal surface inversions, Atmos. Chem. Phys., 14, 6925–6940, https://doi.org/10.5194/acp-14-6925-2014, 2014.
European Union: Directive (EU) 2024/2881 of the European Parliament and of the Council of 23 October 2024 on ambient air quality and cleaner air for Europe (recast), Official Journal of the European Union, 2024, http://data.europa.eu/eli/dir/2024/2881/oj (last access: 26 June 2026), 2024.
Gentner, D. R., Isaacman, G., Worton, D. R., Chan, A. W. H., Dallmann, T. R., Davis, L., Liu, S., Day, D. A., Russell, L. M., Wilson, K. R., Weber, R., Guha, A., Harley, R. A., and Goldstein, A. H.: Elucidating secondary organic aerosol from diesel and gasoline vehicles through detailed characterization of organic carbon emissions, P. Natl. Acad. Sci. USA, 109, 18318–18323, https://doi.org/10.1073/pnas.1212272109, 2012.
Gentner, D. R., Jathar, S. H., Gordon, T. D., Bahreini, R., Day, D. A., El Haddad, I., Hayes, P. L., Pieber, S. M., Platt, S. M., de Gouw, J., Goldstein, A. H., Harley, R. A., Jimenez, J. L., Prévôt, A. S. H., and Robinson, A. L.: Review of Urban Secondary Organic Aerosol Formation from Gasoline and Diesel Motor Vehicle Emissions, Environ. Sci. Technol., 51, 1074–1093, https://doi.org/10.1021/acs.est.6b04509, 2017.
Hänninen, O., Lehtomäki, H., Korhonen, A., Kokkola, T., Hartikainen, A., Sippula, O., Haverinen-Shaughnessy, U., Leviäkangas, P., and Rumrich, I. K.: Health risks related to air pollution by transport categories and vehicle types: Comparison by mortality indicators, Environ. Int., 202, 109657, https://doi.org/10.1016/j.envint.2025.109657, 2025.
Harni, S. D., Saarikoski, S., Kuula, J., Helin, A., Aurela, M., Niemi, J. V., Kousa, A., Rönkkö, T., and Timonen, H.: Effects of emission sources on the particle number size distribution of ambient air in the residential area, Atmos. Environ., 293, 119419, https://doi.org/10.1016/j.atmosenv.2022.119419, 2023.
Hietikko, R., Kuuluvainen, H., Harrison, R. M., Portin, H., Timonen, H., Niemi, J. V., and Rönkkö, T.: Diurnal variation of nanocluster aerosol concentrations and emission factors in a street canyon, Atmos. Environ., 189, 98–106, https://doi.org/10.1016/j.atmosenv.2018.06.031, 2018.
Janka, K. and Saukko, E.: Apparatus and process for measuring characteristics of particle flow, World Intellectual Property Organization (WIPO) Patent Application WO 2017/077190 A1, 2017, https://patents.google.com/patent/WO2017077190A1/en (last access: 26 June 2026), 2017.
Järvi, L., Junninen, H., Karppinen, A., Hillamo, R., Virkkula, A., Mäkelä, T., Pakkanen, T., and Kulmala, M.: Temporal variations in black carbon concentrations with different time scales in Helsinki during 1996–2005, Atmos. Chem. Phys., 8, 1017–1027, https://doi.org/10.5194/acp-8-1017-2008, 2008.
Järvi, L., Hannuniemi, H., Hussein, T., Junninen, H., Aalto, P. P., Hillamo, R., Mäkelä, T., Keronen, P., Siivola, E., Vesala, T., and Kulmala, M.: The urban measurement station SMEAR III: Continuous monitoring of air pollution and surface–atmosphere interactions in Helsinki, Finland, Boreal Environ. Res., Suppl. A, 14, 86–109, ISSN: 1239-6095, 2009.
Kalkavouras, P., Grivas, G., Stavroulas, I., Petrinoli, K., Bougiatioti, A., Liakakou, E., Gerasopoulos, E., and Mihalopoulos, N.: Source apportionment of fine and ultrafine particle number concentrations in a major city of the Eastern Mediterranean, Sci. Total Environ., 915, 170042, https://doi.org/10.1016/j.scitotenv.2024.170042, 2024.
Kuula, J., Kuuluvainen, H., Rönkkö, T., Niemi, J. V., Saukko, E., Portin, H., Aurela, M., Saarikoski, S., Rostedt, A., Hillamo, R., and Timonen, H.: Applicability of Optical and Diffusion Charging-Based Particulate Matter Sensors to Urban Air Quality Measurements, Aerosol Air Qual. Res., 19, 1024–1039, https://doi.org/10.4209/aaqr.2018.04.0143, 2019.
Kuula, J., Kuuluvainen, H., Niemi, J. V., Saukko, E., Portin, H., Kousa, A., Aurela, M., Rönkkö, T., and Timonen, H.: Long-term sensor measurements of lung deposited surface area of particulate matter emitted from local vehicular and residential wood combustion sources, Aerosol Sci. Tech., 54, 190–202, https://doi.org/10.1080/02786826.2019.1668909, 2020.
Kuuluvainen, H., Poikkimäki, M., Järvinen, A., Kuula, J., Irjala, M., Dal Maso, M., Keskinen, J., Timonen, H., Niemi, J. V., and Rönkkö, T.: Vertical profiles of lung deposited surface area concentration of particulate matter measured with a drone in a street canyon, Environ. Pollut., 241, 96–105, https://doi.org/10.1016/j.envpol.2018.04.100, 2018.
Lelieveld, J., Evans, J. S., Fnais, M., Giannadaki, D., and Pozzer, A.: The contribution of outdoor air pollution sources to premature mortality on a global scale, Nature, 525, 367–371, https://doi.org/10.1038/nature15371, 2015.
Lepistö, T., Barreira, L. M. F., Helin, A., Niemi, J. V., Kuittinen, N., Lintusaari, H., Silvonen, V., Markkula, L., Manninen, H. E., Timonen, H., Jalava, P., Saarikoski, S., and Rönkkö, T.: Snapshots of wintertime urban aerosol characteristics: Local sources emphasized in ultrafine particle number and lung deposited surface area, Environ. Res., 231, 116068, https://doi.org/10.1016/j.envres.2023.116068, 2023.
Lepistö, T., Lintusaari, H., Salo, L., Silvonen, V., Barreira, L. M. F., Hoivala, J., Markkula, L., Niemi, J. V., Ondracek, J., Teinilä, K., Manninen, H. E., Saarikoski, S., Timonen, H., Dal Maso, M., and Rönkkö, T.: Comparison of size distribution and electrical particle sensor measurement methods for particle lung deposited surface area (LDSAal) in ambient measurements with varying conditions, Aerosol Research, 2, 271–289, https://doi.org/10.5194/ar-2-271-2024, 2024.
Niemi, J. V., Tervahattu, H., Vehkamäki, H., Kulmala, M., Koskentalo, T., Sillanpää, M., and Rantamäki, M.: Characterization and source identification of a fine particle episode in Finland, Atmos. Environ., 38, 5003–5012, https://doi.org/10.1016/j.atmosenv.2004.06.023, 2004.
Niemi, J. V., Tervahattu, H., Vehkamäki, H., Martikainen, J., Laakso, L., Kulmala, M., Aarnio, P., Koskentalo, T., Sillanpää, M., and Makkonen, U.: Characterization of aerosol particle episodes in Finland caused by wildfires in Eastern Europe, Atmos. Chem. Phys., 5, 2299–2310, https://doi.org/10.5194/acp-5-2299-2005, 2005.
Niemi, J. V., Saarikoski, S., Aurela, M., Tervahattu, H., Hillamo, R., Westphal, D. L., Aarnio, P., Koskentalo, T., Makkonen, U., Vehkamäki, H., and Kulmala, M.: Long-range transport episodes of fine particles in southern Finland during 1999–2007, Atmos. Environ., 43, 1255–1264, https://doi.org/10.1016/j.atmosenv.2008.11.022, 2009.
Pirjola, L., Niemi, J. V., Saarikoski, S., Aurela, M., Enroth, J., Carbone, S., Saarnio, K., Kuuluvainen, H., Kousa, A., Rönkkö, T., and Hillamo, R.: Physical and chemical characterization of urban winter-time aerosols by mobile measurements in Helsinki, Finland, Atmos. Environ., 158, 60–75, https://doi.org/10.1016/j.atmosenv.2017.03.028, 2017.
Rönkkö, T. and Timonen, H.: Overview of Sources and Characteristics of Nanoparticles in Urban Traffic-Influenced Areas, J. Alzheimers Dis., 72, 15–28, https://doi.org/10.3233/JAD-190170, 2019.
Rönkkö, T., Kuuluvainen, H., Karjalainen, P., Keskinen, J., Hillamo, R., Niemi, J. V., Pirjola, L., Timonen, H. J., Saarikoski, S., Saukko, E., Järvinen, A., Silvennoinen, H., Rostedt, A., Olin, M., Yli-Ojanperä, J., Nousiainen, P., Kousa, A., and Dal Maso, M.: Traffic is a major source of atmospheric nanocluster aerosol, P. Natl. Acad. Sci. USA, 114, 7549–7554, https://doi.org/10.1073/pnas.1700830114, 2017.
Rostedt, A., Arffman, A., Janka, K., Yli-Ojanperä, J., and Keskinen, J.: Characterization and Response Model of the PPS-M Aerosol Sensor, Aerosol Sci. Tech., 48, 1022–1030, https://doi.org/10.1080/02786826.2014.951023, 2014.
Saarikoski, S., Timonen, H., Saarnio, K., Aurela, M., Järvi, L., Keronen, P., Kerminen, V.-M., and Hillamo, R.: Sources of organic carbon in fine particulate matter in northern European urban air, Atmos. Chem. Phys., 8, 6281–6295, https://doi.org/10.5194/acp-8-6281-2008, 2008.
Savadkoohi, M., Pandolfi, M., Reche, C., Niemi, J. V., Mooibroek, D., Titos, G., Green, D. C., Tremper, A. H., Hueglin, C., Liakakou, E., Mihalopoulos, N., Stavroulas, I., Artiñano, B., Coz, E., Alados-Arboledas, L., Beddows, D., Riffault, V., De Brito, J. F., Bastian, S., Baudic, A., Colombi, C., Costabile, F., Chazeau, B., Marchand, N., Gómez-Amo, J. L., Estellés, V., Matos, V., van der Gaag, E., Gille, G., Luoma, K., Manninen, H. E., Norman, M., Silvergren, S., Petit, J.-E., Putaud, J.-P., Rattigan, O. V., Timonen, H., Tuch, T., Merkel, M., Weinhold, K., Vratolis, S., Vasilescu, J., Favez, O., Harrison, R. M., Laj, P., Wiedensohler, A., Hopke, P. K., Petäjä, T., Alastuey, A., and Querol, X.: The variability of mass concentrations and source apportionment analysis of equivalent black carbon across urban Europe, Environ. Int., 178, 108081, https://doi.org/10.1016/j.envint.2023.108081, 2023.
Schraufnagel, D. E.: The health effects of ultrafine particles, Exp. Mol. Med., 52, 311–317, https://doi.org/10.1038/s12276-020-0403-3, 2020.
Sebastian, M., Kompalli, S. K., Kumar, V. A., Jose, S., Babu, S. S., Pandithurai, G., Singh, S., Hooda, R. K., Soni, V. K., Pierce, J. R., Vakkari, V., Asmi, E., Westervelt, D. M., Hyvärinen, A.-P., and Kanawade, V. P.: Observations of particle number size distributions and new particle formation in six Indian locations , Atmos. Chem. Phys., 22, 4491–4508, https://doi.org/10.5194/acp-22-4491-2022, 2022.
Srivastava, D., Vu, T. V., Tong, S., Shi, Z., and Harrison, R. M.: Formation of secondary organic aerosols from anthropogenic precursors in laboratory studies, Npj Clim. Atmospheric Sci., 5, 22, https://doi.org/10.1038/s41612-022-00238-6, 2022.
Teinilä, K., Saarikoski, S., Lintusaari, H., Lepistö, T., Marjanen, P., Aurela, M., Hellén, H., Tykkä, T., Lampimäki, M., Lampilahti, J., Barreira, L., Mäkelä, T., Kangas, L., Hatakka, J., Harni, S., Kuula, J., V. Niemi, J., Portin, H., Yli-Ojanperä, J., Niemelä, V., Jäppi, M., Lehtipalo, K., Vanhanen, J., Pirjola, L., Manninen, H. E., Petäjä, T., Rönkkö, T., and Timonen, H.: Measurement report: Wintertime aerosol characterization at an urban traffic site in Helsinki, Finland, Atmos. Chem. Phys., 25, 4907–4928, https://doi.org/10.5194/acp-25-4907-2025, 2025.
Todea, A. M., Beckmann, S., Kaminski, H., Bard, D., Bau, S., Clavaguera, S., Dahmann, D., Dozol, H., Dziurowitz, N., Elihn, K., Fierz, M., Lidén, G., Meyer-Plath, A., Monz, C., Neumann, V., Pelzer, J., Simonow, B. K., Thali, P., Tuinman, I., van der Vleuten, A., Vroomen, H., and Asbach, C.: Inter-comparison of personal monitors for nanoparticles exposure at workplaces and in the environment, Sci. Total Environ., 605–606, 929–945, https://doi.org/10.1016/j.scitotenv.2017.06.041, 2017.
Trechera, P., Garcia-Marlès, M., Liu, X., Reche, C., Pérez, N., Savadkoohi, M., Beddows, D., Salma, I., Vörösmarty, M., Casans, A., Casquero-Vera, J. A., Hueglin, C., Marchand, N., Chazeau, B., Gille, G., Kalkavouras, P., Mihalopoulos, N., Ondracek, J., Zikova, N., Niemi, J. V., Manninen, H. E., Green, D. C., Tremper, A. H., Norman, M., Vratolis, S., Eleftheriadis, K., Gómez-Moreno, F. J., Alonso-Blanco, E., Gerwig, H., Wiedensohler, A., Weinhold, K., Merkel, M., Bastian, S., Petit, J.-E., Favez, O., Crumeyrolle, S., Ferlay, N., Martins Dos Santos, S., Putaud, J.-P., Timonen, H., Lampilahti, J., Asbach, C., Wolf, C., Kaminski, H., Altug, H., Hoffmann, B., Rich, D. Q., Pandolfi, M., Harrison, R. M., Hopke, P. K., Petäjä, T., Alastuey, A., and Querol, X.: Phenomenology of ultrafine particle concentrations and size distribution across urban Europe, Environ. Int., 172, 107744, https://doi.org/10.1016/j.envint.2023.107744, 2023.
Vallabani, N. V. S., Gruzieva, O., Elihn, K., Juárez-Facio, A. T., Steimer, S. S., Kuhn, J., Silvergren, S., Portugal, J., Piña, B., Olofsson, U., Johansson, C., and Karlsson, H. L.: Toxicity and health effects of ultrafine particles: Towards an understanding of the relative impacts of different transport modes, Environ. Res., 231, 116186, https://doi.org/10.1016/j.envres.2023.116186, 2023.
World Health Organization: WHO global air quality guidelines: Particulate matter (PM2.5 and PM10), ozone, nitrogen dioxide, sulfur dioxide and carbon monoxide, World Health Organization, https://www.who.int/publications/i/item/9789240034228 (last access: 26 June 2026), 2021.
Zanobetti, A., Austin, E., Coull, B. A., Schwartz, J., and Koutrakis, P.: Health effects of multi-pollutant profiles, Environ. Int., 71, 13–19, https://doi.org/10.1016/j.envint.2014.05.023, 2014.