
the Creative Commons Attribution 4.0 License.
the Creative Commons Attribution 4.0 License.
 | 09 Jul 2026
Enhancing GNSS water vapour retrieval via synergistic microwave radiometry: thermodynamic error diagnosis and bias correction
Avinash N. Parde
Christina Oikonomou
Haris Haralambous
The retrieval of Precipitable Water Vapour (PWV) from Global Navigation Satellite Systems (GNSS) in thermodynamically complex environments is significantly limited by the accuracy of the weighted mean temperature (Tm). This study evaluates the efficacy of static climatological models versus dynamic ground-based microwave radiometry for Tm determination in the Eastern Mediterranean, a region characterized by sharp refractivity gradients. Using the Cyprus GNSS Meteorology Enhancement research project (CYGMEN) infrastructure in Nicosia, the performance of the ERA5-based HGPT2 model and a co-located Microwave Radiometer (MWR) was assessed against radiosonde (RS) profiles during the 2025 warm season (Spring–Summer). Diagnostic analysis reveals that the static HGPT2 model fails to resolve the diurnal thermodynamic decoupling between the boundary layer and the free troposphere, leading to a systematic overestimation of Tm exceeding 6 K during peak solar insolation. Conversely, the MWR captures short-term thermodynamic variability (r=0.98) but exhibits a systematic cold bias of −1.91 K in raw retrievals. It is demonstrated that a site-specific linear bias correction reduces the MWR Tm Root Mean Square Error (RMSE) from 2.32–1.43 K, significantly outperforming the empirical model. Sensitivity analysis confirms that thermodynamic uncertainty dominates the error budget, outweighing uncertainties in refractivity constants by an order of magnitude. Consequently, standard climatological retrievals diverge from the synergistic MWR-GNSS method during extreme hygrometric events, introducing systematic PWV biases exceeding 1.0 mm when moisture levels surpass 45 mm. The synergistic coupling of real-time radiometric Tm with GNSS data is therefore meaningful for generating climate-quality PWV records in semi-arid coastal regions.
- Article
(6647 KB) - Full-text XML
- BibTeX
- EndNote


Atmospheric water vapour (WV) is the primary greenhouse gas, contributing approximately 60 % to the natural greenhouse effect and playing a vital role in regulating the Earth's thermodynamic budget (Kiehl and Trenberth, 1997; Trenberth et al., 2005). Furthermore, WV is the main driver of latent heat transport, influencing convective systems and global precipitation patterns. High-frequency variations in Precipitable Water Vapour (PWV) correlate strongly with atmospheric instability and are a key factor in the initiation of severe weather. Specifically, rapid temporal gradients in PWV often precede heavy rainfall and flash floods, acting as a reliable precursor for convective storms (Brenot et al., 2013). Consequently, assimilating high-resolution PWV data into Numerical Weather Prediction (NWP) models significantly improves short-range precipitation “now-casting” (Bennitt and Jupp, 2012). Accurate PWV retrieval is especially crucial for the Eastern Mediterranean, a climate change “hotspot” warming faster than the global average (Giorgi, 2006; Lelieveld et al., 2012; Held and Soden, 2006). This region is characterized by complex topography and land–sea contrasts, which create sharp atmospheric refractivity gradients. The Eastern Mediterranean faces a hydro-climatic paradox: a long-term drying trend () alongside increasing high-intensity, short-duration flash flood events (Zittis et al., 2019; Ziv et al., 2021b). GNSS-derived PWV in this region exhibits strong diurnal cycles with amplitudes up to 5 mm, which are closely correlated with atmospheric instability (Ziskin Ziv et al., 2021a). Despite this vulnerability, the Eastern Mediterranean currently lacks dense, continuous atmospheric profiling networks. Traditional observation methods, such as radiosondes (RS), fail to resolve these mesoscale events due to low temporal resolution (typically 12 h intervals) and significant spatial gaps (Soden and Lanzante, 1996). While satellite-based passive remote sensing offers global coverage, it is often limited by revisit times, daylight dependence, or data degradation in coastal zones due to land contamination in the microwave footprint (Bennartz and Bauer, 2003).
These limitations underscore the necessity for ground-based remote sensing techniques that offer continuous, all-weather operability. Ground-based Global Navigation Satellite Systems (GNSS) meteorology has emerged as a robust technique for atmospheric sounding since the seminal proposal by Bevis et al. (1992). By estimating the Zenith Total Delay (ZTD) of GNSS signals traversing the neutral atmosphere, the Zenith Wet Delay (ZWD) can be isolated by subtracting the Zenith Hydrostatic Delay (ZHD), which is accurately modeled from surface pressure observations (Saastamoinen, 1972). GNSS-derived PWV offers significant advantages, including high temporal resolution (sub-hourly), all-weather availability, and cost-efficiency by leveraging existing geodetic infrastructure (Guerova et al., 2016; Jones et al., 2020).
The retrieval of PWV from GNSS ZWD relies on a dimensionless conversion factor, Π, which is a function of the atmospheric weighted mean temperature, Tm. Defined physically as (Askne and Nordius, 1987), Tm encapsulates the thermal state of the atmospheric column. Because the conversion factor (Π) is nearly linearly proportional to Tm, any relative error in the Tm estimation strictly propagates as an equivalent relative error in the final PWV retrieval. During severe moisture events with an PWV of 50 mm, this translates to an absolute error of ∼0.18 mm. Consequently, a 1 % relative error in Tm translates strictly to a 1 % relative error in PWV. Therefore, alongside the substantial errors inherent in ZTD estimation – such as mapping function inaccuracies and surface pressure interpolation for the ZHD (Ning et al., 2016) – the determination of Tm remains one of the primary sources of uncertainty in GNSS meteorology. In the absence of in-situ profiles, Tm is commonly estimated using empirical regression models or global climatological models. However, earlier studies have demonstrated that empirical Tm regressions, such as the Bevis model (Bevis et al., 1992), introduce relative PWV errors of 1 %–2 % due to weak Ts−Tm correlations in coastal and equatorial regions, where annual/semiannual variations are not adequately captured (Yao et al., 2014; Lan et al., 2016). Similarly, global grid-based Tm models like GPT2w achieve RMSE<4 K at ∼80 % of mid-latitude sites but degrade in data-sparse areas like the Middle East and Africa, where reanalysis quality is limited (Böhm et al., 2015; Jiang et al., 2019). The Hourly Global Pressure and Temperature 2 (HGPT2) model represents a major advancement by providing hourly estimates derived from ERA5 reanalysis (Mateus et al., 2021). Despite recent validation of GPT2w and ECMWF models for Precipitable Water Vapour (PWV) retrieval in the Mediterranean (Oikonomou et al., 2018), a critical gap exists: the quantification of vertical interpolation errors in these models, especially over complex coastal terrains. For instance, while recent validation studies in Cyprus demonstrate strong GNSS-PWV correlations (>0.6) with ERA5 during extreme precipitation, persistent reanalysis interpolation errors are highlighted in mountainous areas (Giannadaki et al., 2025). This lack of validation for HGPT2's performance in the complex topography of the Eastern Mediterranean potentially exacerbates PWV biases during extreme events.
An alternative approach to deriving Tm is the use of ground-based Microwave Radiometers (MWR). MWRs measure brightness temperatures at multiple frequencies to retrieve continuous vertical profiles of temperature and humidity. Ground-based MWRs have been shown to retrieve Tm with in mid-latitudes, outperforming empirical models during synoptic anomalies (Cimini et al., 2011; Crewell and Löhnert, 2007; Löhnert and Maier, 2012). While multi-site intercomparisons reveal that MWR retrievals can exhibit upper-tropospheric cold biases (up to 5 K at >2 km altitude) (Van Malderen et al., 2014; Steinke et al., 2015), simple linear corrections can reduce RMSE by 20 %–40 % (Ning and Elgered, 2021). Operational GNSS–MWR synergies for Tm bias correction have documented gains in PWV accuracy (10 %–30 % RMSE reduction) in European networks (Vaquero-Martínez et al., 2018; Li et al., 2020). However, such applications are rare in the semi-arid Eastern Mediterranean, where MWR could critically mitigate reanalysis uncertainties.
This study leverages the infrastructure of the CYGMEN (Cyprus GNSS Meteorology Enhancement) project, which is establishing a dense, multi-sensor meteorological network in Cyprus. The network, termed CyMETEO, integrates a dense array of continuous GNSS stations distributed across the island. Due to the high cost and operational complexity of radiometric profiling, the network currently features a single, centralized thermodynamic “supersite” at the Athalassa observatory, where a GNSS receiver is strictly co-located with a MWR and a RS launch facility. This unique instrumental setup provides an ideal testbed for inter-comparing atmospheric retrieval techniques in a coastal, semi-arid environment. The primary objective of this manuscript is to evaluate the accuracy of GNSS-derived PWV over the Eastern Mediterranean by assessing the performance of different Tm determination strategies. We specifically investigate the efficacy of the HGPT2 model compared to MWR-derived Tm and RS benchmarks. The study aims to quantify the error budget of GNSS-PWV and determine whether the inclusion of MWR data provides statistically significant improvements over the state-of-the-art HGPT2 model. The manuscript is organized as follows: Section 2 describes the study area and the instrumentation of the CyMETEO network; Sect. 3 details the methodology for GNSS processing, ZTD estimation, and the mathematical derivation of Tm from different sources; Sect. 4 presents the validation results and statistical analysis against RS reference data; and Sect. 5 concludes with recommendations for operational PWV monitoring strategies in the region.
2.1 Observational Site and CYGMEN Infrastructure
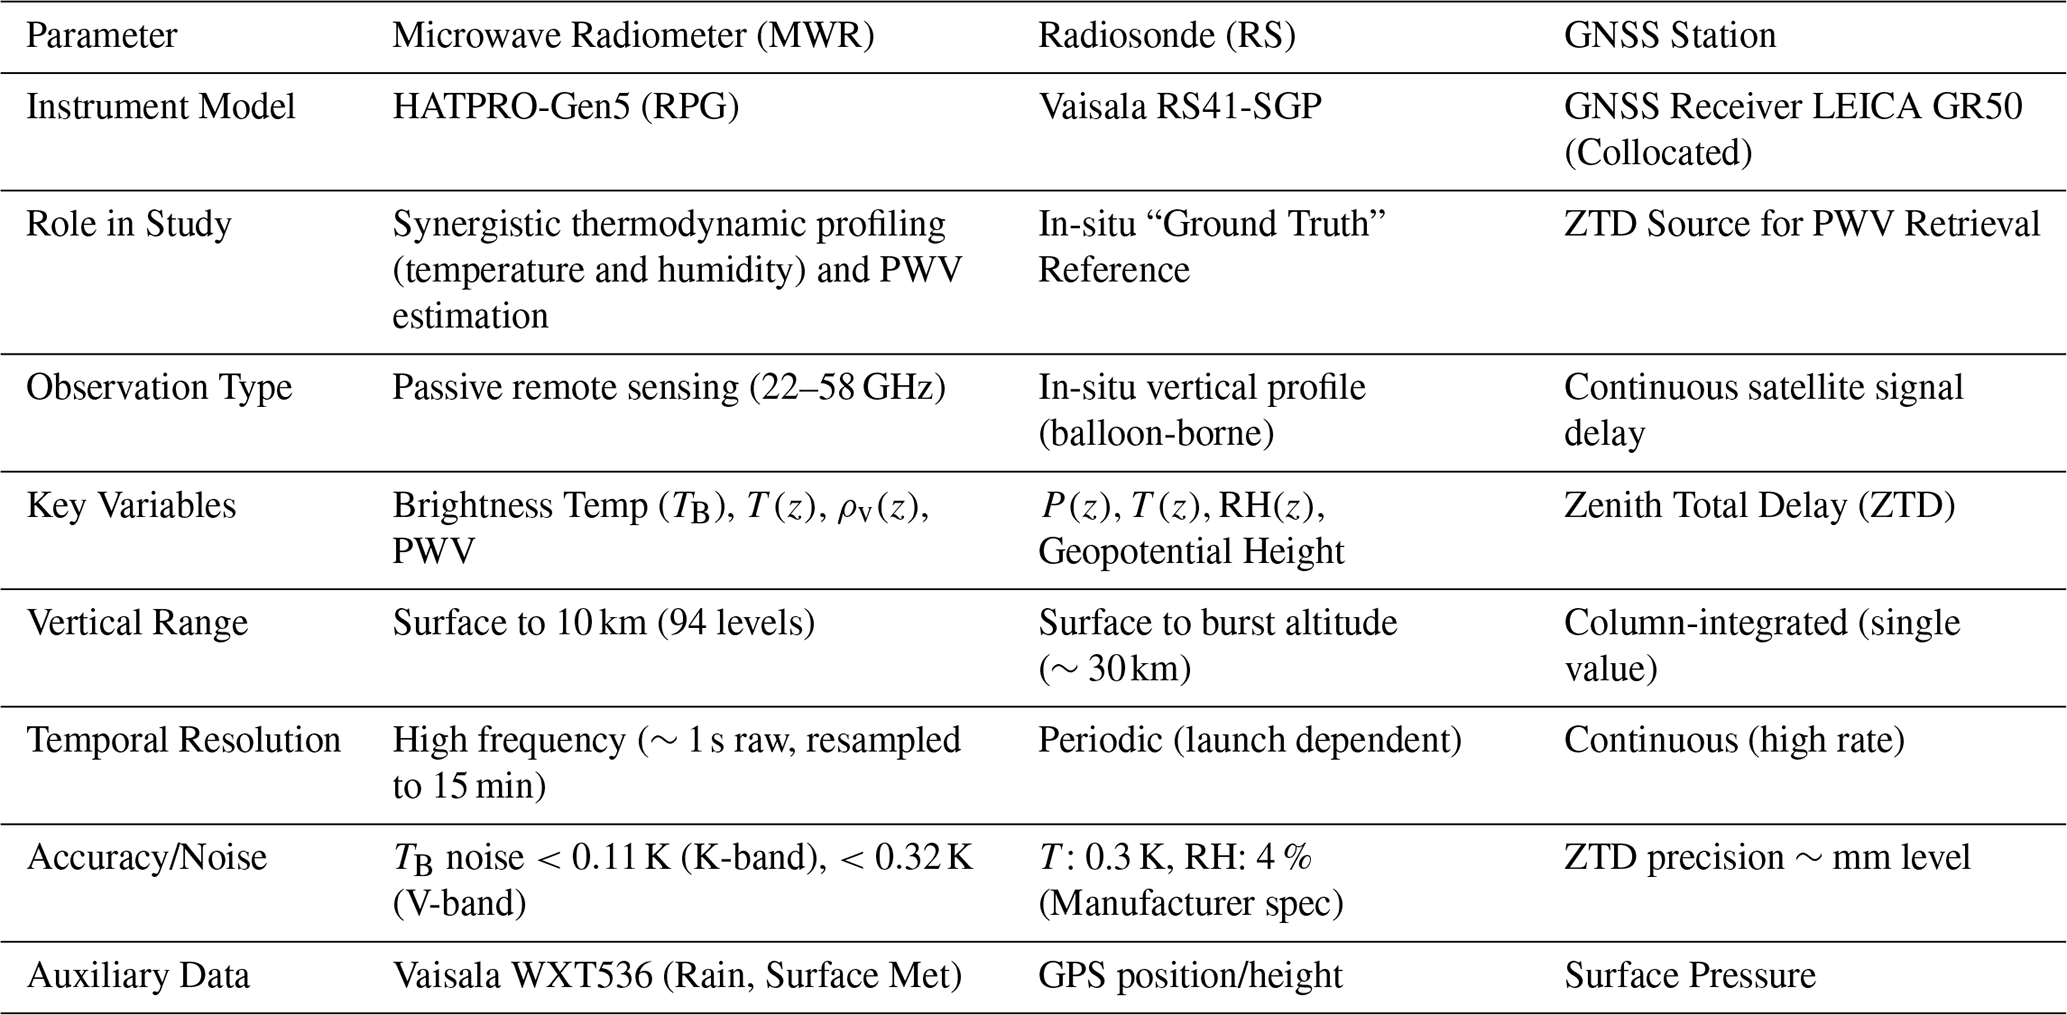
The observational campaign was conducted at the Athalassa atmospheric observatory in Nicosia, Cyprus (35.15° N, 33.40° E, 160 m a.s.l. (meter above sea level)), situated in the central Mesaoria plain. The site is characterized by complex topography, bounded by the Troodos Mountain to the southwest and the Pentadaktylos Mountain to the north, as shown in Fig. 1a. This study presents the first comprehensive analysis of radiometric data acquired under the CYGMEN infrastructure project, established to monitor the thermodynamic state of the Eastern Mediterranean atmosphere. To ensure robust thermodynamic profiling and validation, three primary datasets were collated, as shown in Table 1.
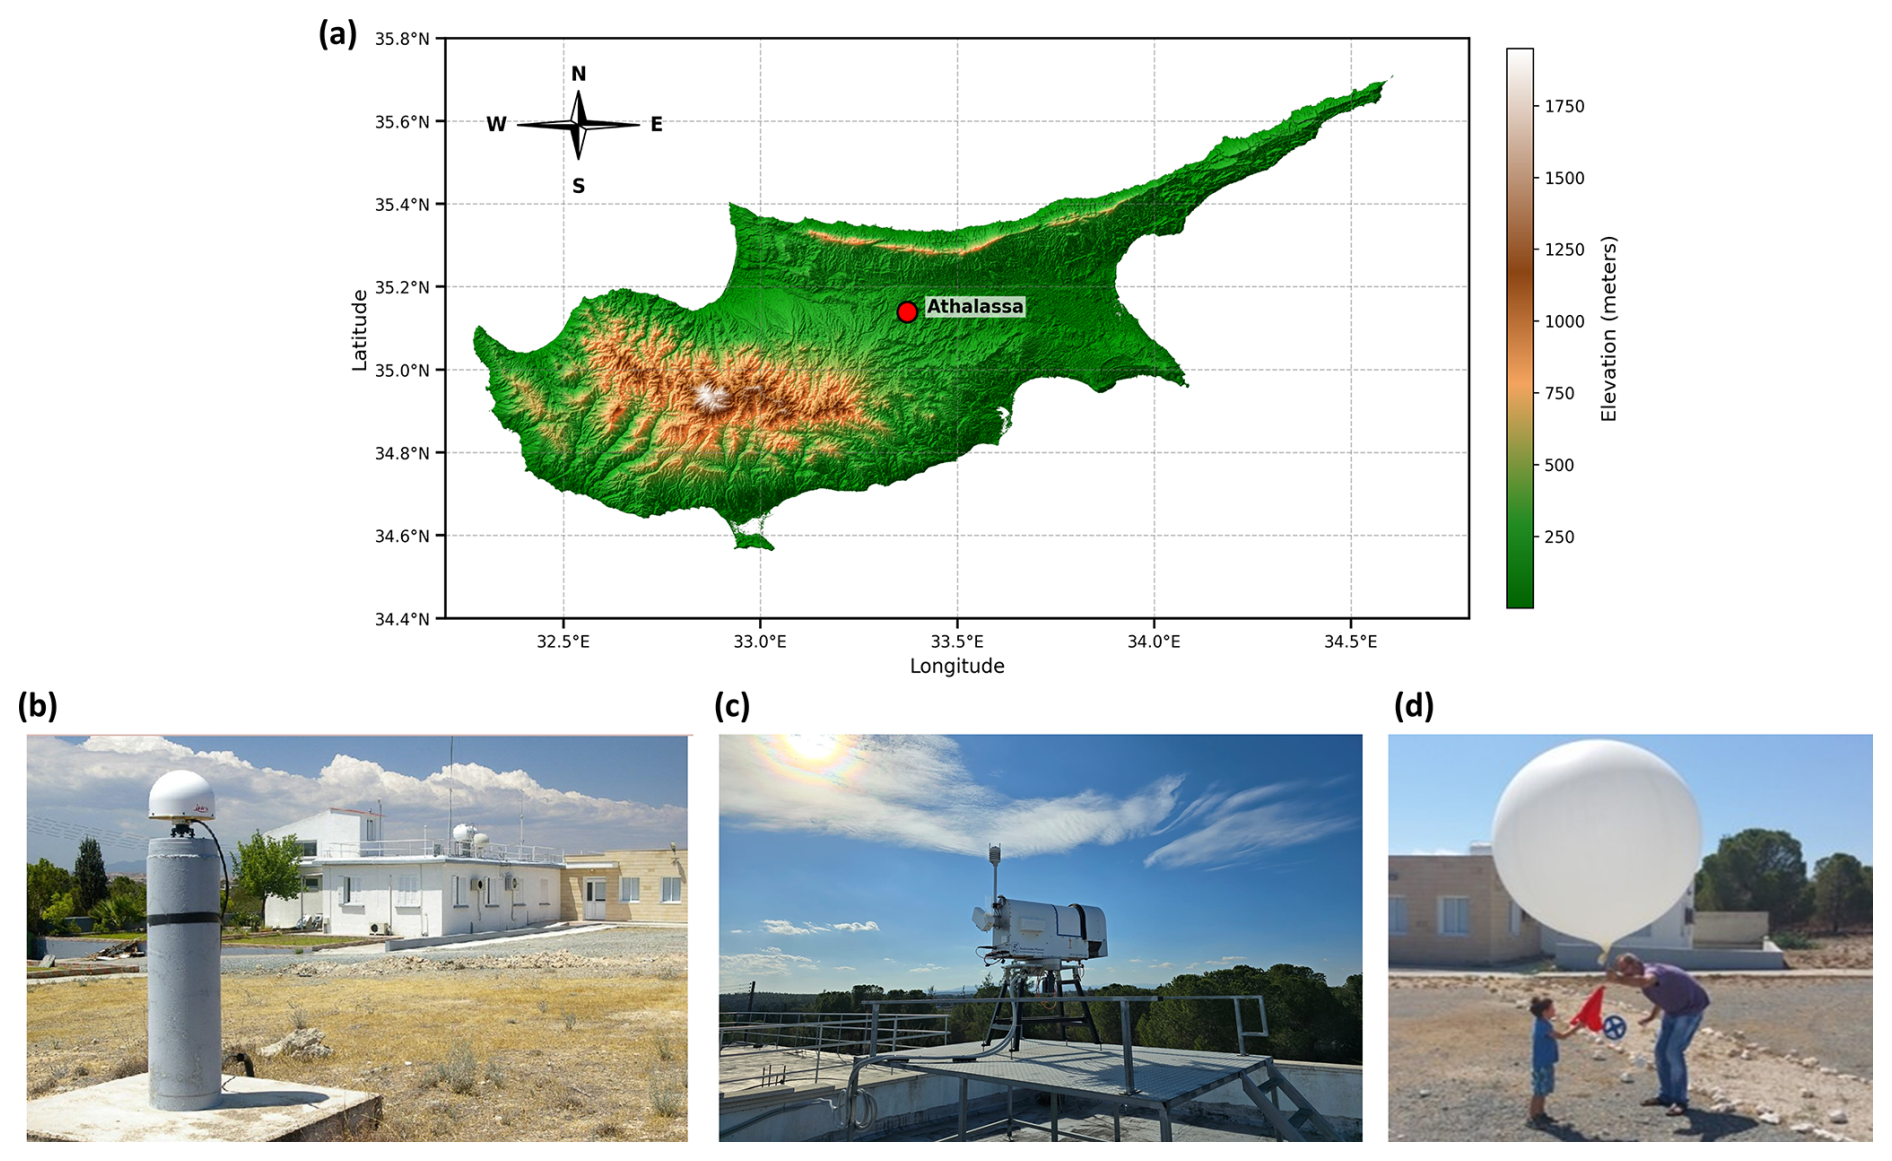
Figure 1Location and instrumentation at Athalassa, Cyprus. (a) Site location on the island's elevation map. (b) GNSS reference station. (c) RPG-HATPRO radiometer. (d) Radiosonde balloon launching.
2.2 Instrumentation and Data Processing
2.2.1 Microwave Radiometry (MWR)
The RPG-HATPRO radiometer observes downwelling atmospheric brightness temperatures (TB) across 14 channels: seven in the K-band (22–31 GHz) sensitive to water vapour, and seven in the V-band (51–58 GHz) sensitive to oxygen for temperature profiling. This instrument enables the continuous retrieval of temperature (T) and absolute humidity (ρv) profiles on a standardized grid of 94 vertical levels from the surface up to 10 km. The vertical resolution is optimized for the planetary boundary layer (PBL), ranging from 10–30 m up to 500 m, and decreasing to 100–500 m in the free troposphere. For this study, high-frequency MWR observations were resampled to 15 min intervals to align with GNSS processing epochs. It is a well-documented limitation of passive microwave radiometry that retrieval accuracy degrades significantly during precipitation, as liquid water on the instrument's radome heavily contaminates the measured brightness temperatures (Foth et al., 2024; Parde et al., 2025; Pakkattil et al., 2025; Ware et al., 2004). Because this study focused on the warm, dry season in the Eastern Mediterranean (March–October 2025), rainfall events were naturally sparse. Nevertheless, to ensure data integrity, real-time precipitation flags generated by the co-located Vaisala WXT536 surface weather transmitter were utilized as a strict quality-control filter. Any MWR profiles retrieved during active precipitation events were excluded from the dataset to prevent wet-radome anomalies from artificially skewing the thermodynamic bias analysis. To diagnose potential biases in the MWR-derived Tm, the dataset was split into a training Set (April–June 2025) for regression modeling and a validation Set (July–October 2025) for independent testing. In addition to thermodynamic profiling, the MWR's native retrieval algorithm possesses the capacity to directly estimate PWV from its K-band brightness temperatures.
Any MWR profiles retrieved during active precipitation events were excluded from the dataset to prevent wet-radome anomalies from artificially skewing the thermodynamic bias analysis. To mitigate Tm errors in MWR, a supervised linear regression model was developed to calibrate the MWR observations. For robust independent validation, the collocated dataset was separated into two distinct temporal subsets: the training Set (April–June 2025), which was used to derive the regression coefficients, and the validation Set (July–October 2025), which was used exclusively to test the correction's performance on unseen data. A simple linear correction model was fitted to the training data using Ordinary Least Squares (OLS) minimization. The relationship is defined in Eq. (1) as:
where Tm,corr is the corrected MWR temperature, Tm,MWR is the raw Tm derived from the radiometer and α (slope) and β (intercept) are the learned coefficients minimizing the residual sum of squares between the MWR and RS values. Based on our training Set, the derived coefficients applied to the validation Set were α=1.0623 and .
2.2.2 Radiosonde Data Processing
To establish a rigorous validation dataset, PWV was derived from high-resolution vertical profiles obtained from collocated radiosonde launches. A strict collocation window was applied, where MWR profiles were averaged within ±30 minutes of the balloon launch time. The raw telemetry data, comprising pressure (P), temperature, and dew point temperature (Td), were processed to derive the total columnar water vapour content (in kg m−2) through the vertical integration of specific humidity, assuming the atmosphere is in hydrostatic equilibrium. The determination of the necessary moisture variables relied on the Magnus-Tetens approximation, which provides a widely accepted empirical relationship for saturation vapour pressure. First, the actual vapour pressure (e, in hPa) was computed directly from the dew point temperature (Td, in °C). This calculation utilized the coefficients defined by Bolton (1980), which are optimized for saturation vapour pressure over liquid water in the meteorological temperature range, as shown in Eq. (2):
Subsequently, the specific humidity (q, in kg kg−1) was derived via Eq. (3), representing the mass mixing ratio of water vapour to the total moist air parcel:
where P is the static pressure (hPa) and ϵ≈0.622 represents the ratio of the molecular weight of water vapour to that of dry air. Once the specific humidity profile was established, the PWV was calculated by integrating q with respect to pressure. The retrieval algorithm employed the trapezoidal rule for numerical integration, which approximates the integral as the sum of discrete atmospheric layers (Eq. 4):
where g is the gravity dependent on altitude, g(ϕ,h), where ϕ represents the Geodetic latitude and h is the orthometric height. P is converted to Pascals (Pa) prior to integration and N represents the total number of vertical levels in the RS profile. It should be noted that while the trapezoidal rule can theoretically overestimate the integral of an exponentially decaying profile, the Vaisala RS41-SGP provides high-frequency 1 s telemetry (yielding a vertical spatial resolution of approximately 5–8 m). At this exceptionally fine resolution, the linear approximation between measurement levels effectively converges with the true atmospheric profile, rendering any systematic integration bias mathematically negligible. Also, it should be noted that IWV, representing the mass column integral in kg m−2, is physically and numerically equivalent to PWV expressed as a depth in millimeters (mm), assuming the standard density of liquid water (1000 kg m−3). A strict quality assurance protocol was implemented to ensure vertical completeness; only radiosonde flights that successfully maintained continuous telemetry up to the 10 km AGL integration ceiling were included in the final comparative dataset. While the term PWV is frequently used when discussing direct profile integration from the MWR and RS, this study uses PWV (mm) as the standardized final retrieval metric to align with operational meteorological and forecasting conventions. It is important to note that while the nominal manufacturer uncertainty for the Vaisala RS41 humidity sensor is stated as 4 % for individual profile measurements, the uncertainty of the resulting PWV is significantly lower. Because PWV is computed by integrating hundreds of discrete measurements across the vertical column (Eq. 3), uncorrelated random sensor noise is largely suppressed through statistical cancellation. Consequently, the integrated variables derived from the radiosonde, such as PWV and the Tm, possess the requisite precision to serve as a robust “ground truth” standard for evaluating the finer relative uncertainties (1 %–2 %) associated with the GNSS and MWR retrievals. To ensure a rigorous and direct intercomparison with the active MWR, the radiosonde integration was strictly confined to a maximum altitude of 10 km Above Ground Level (AGL). This vertical cutoff was deliberately chosen to exactly match the 10 km ceiling of the standard RPG-HATPRO retrieval grid. While GNSS integrates delays through the entire atmosphere, bounding the in-situ reference data is mathematically necessary to isolate profiling performance. It is well established that this 10 km threshold does not introduce a systematic dry bias when comparing against total-column GNSS (Van Baelen et al., 2005). Furthermore, ambient temperatures at this altitude range from −40 to −50 °C, strictly limiting the saturation vapour pressure. Consequently, the residual water vapour between 10 km and the tropopause is thermodynamically constrained to fractions of a millimeter. Omitting this minute residual mass is functionally negligible, as it falls well within the overall baseline uncertainty (typically 1–2 mm) of the total-column radiosonde PWV retrieval.
2.2.3 GNSS Data Processing
ZTD estimates were derived from the collocated Leica GR50 receiver (station NICO) using the Tefnut PP software (Douša and Václavovic, 2014). The processing employed a Precise Point Positioning (PPP) strategy with an elevation cutoff angle of 10°. To account for tropospheric mapping errors, the Vienna Mapping Function 1 (VMF1) was applied. Station coordinates were constrained to the IGS14 reference frame, and satellite orbits and clock corrections were utilized from IGS Ultra-Rapid products. While IGS Final products are the gold standard for historical climate reprocessing due to their minimal orbital uncertainty, this study deliberately utilized IGS Ultra-Rapid products to evaluate the proposed synergistic retrieval architecture under near real-time operational constraints. Because a primary application of continuous GNSS-PWV is its assimilation into short-range NWP for severe weather “nowcasting”, it is crucial to assess system performance using the satellite orbits and clocks actually available during active forecasting. Although Ultra-Rapid products introduce a slight degradation in ZTD precision compared to final products, this uncertainty (typically fractions of a millimeter in PWV) remains negligible compared to the massive, multi-millimeter systematic errors introduced by static thermodynamic modeling, which is the primary focus of this investigation. While modern Numerical Weather Prediction systems frequently assimilate ZTD directly to avoid conversion uncertainties, deriving an accurate physical PWV product remains essential. PWV serves as an intuitive, absolute moisture metric heavily utilized by operational forecasters for severe weather nowcasting, and is fundamentally necessary for building long-term, cross-instrument climatological records. To isolate the ZWD, the ZHD was precisely calculated using continuous, co-located surface pressure observations obtained directly from the Vaisala WXT536 weather transmitter installed at the site, rather than relying on interpolated pressure fields. ZTD values were estimated at 15 min intervals, directly aligning with the temporal resolution of the MWR. It must also be noted that the computation of ZHD is significantly dependent on the assumed value of the dry refractivity constant, k1. As established by Bevis et al. (1994) and further evaluated by Healy (2011), while k1 is known to a high degree of relative accuracy, its residual fractional uncertainty introduces a persistent systematic bias into the ZHD estimation. Because ZWD is isolated by subtracting ZHD from the total delay, this k1-induced bias directly propagates into the final PWV error budget, acting alongside the conversion uncertainties analyzed later in this study.
2.3 Thermodynamic Modeling and Synergistic Retrieval Strategy
The conversion of GNSS-derived ZWD to PWV is governed by a proportionality factor, Π, whose accuracy is largely dictated by the Tm. To assess the fidelity of thermodynamic inputs for GNSS meteorology, we evaluated three distinct Tm derivation strategies. For profile-resolving instruments (MWR and RS), Tm values were computed by integrating the vertical profiles of physical temperature, T(z) (K), and absolute humidity, ρv(z) (kg m−3). Consistent with Bevis et al. (1992), Tm is defined as the mean temperature of the atmosphere weighted by the water vapour partial pressure, which can be expressed in terms of vapour density as shown in Eq. (5):
In practice, the continuous integrals were discretized using the trapezoidal rule from the surface (zsurf) to the highest available profile level (ztop). This approach assumes linear variation of T and ρv between measurement levels. For standalone GNSS retrieval (where no dynamic profiles are available), Tm was derived from the HGPT2 (Hourly Global Pressure and Temperature 2) model (Mateus et al., 2021). HGPT2 is an advanced “blind” empirical model, meaning its outputs are independent of the specific observational year. While dynamic NWP models provide superior real-time meteorological data, “blind” models like HGPT2 remain heavily utilized in standard geodetic GNSS processing where real-time meteorological or NWP data streams are unavailable. It is constructed from a comprehensive 20 year historical baseline of atmospheric data from the ERA5 global reanalysis. Unlike standard static climatologies, HGPT2 leverages the full ERA5 spatial resolution (0.25°×0.25°) and provides temporal resolution at 1 h intervals for any given Day of Year (DOY). It achieves this by employing a time-segmentation concept, modeling thermodynamic variables via long-term mean values combined with annual, semi-annual, and quarterly periodic functions.
Applying the linear correction model (as formulated in Sect. 2.2.1) successfully re-centers the error distribution. To quantify the benefits of sensor synergy in integrated water vapour estimation, this study defines and contrasts two distinct GNSS PWV retrieval architectures. The first, “Standard Retrieval” which is a control method utilizes the ZTDGNSS combined with the Tm derived empirically from the HGPT2 climatological model (Böhm et al., 2015). Second “Synergistic Retrieval” which proposed method couples ZTDGNSS with a physical Tm derived directly from a collocated MWR. For the synergistic approach, the dimensionless conversion factor (Π) was calculated dynamically using the MWR-derived Tm following Eq. (6) and Eq. (7).
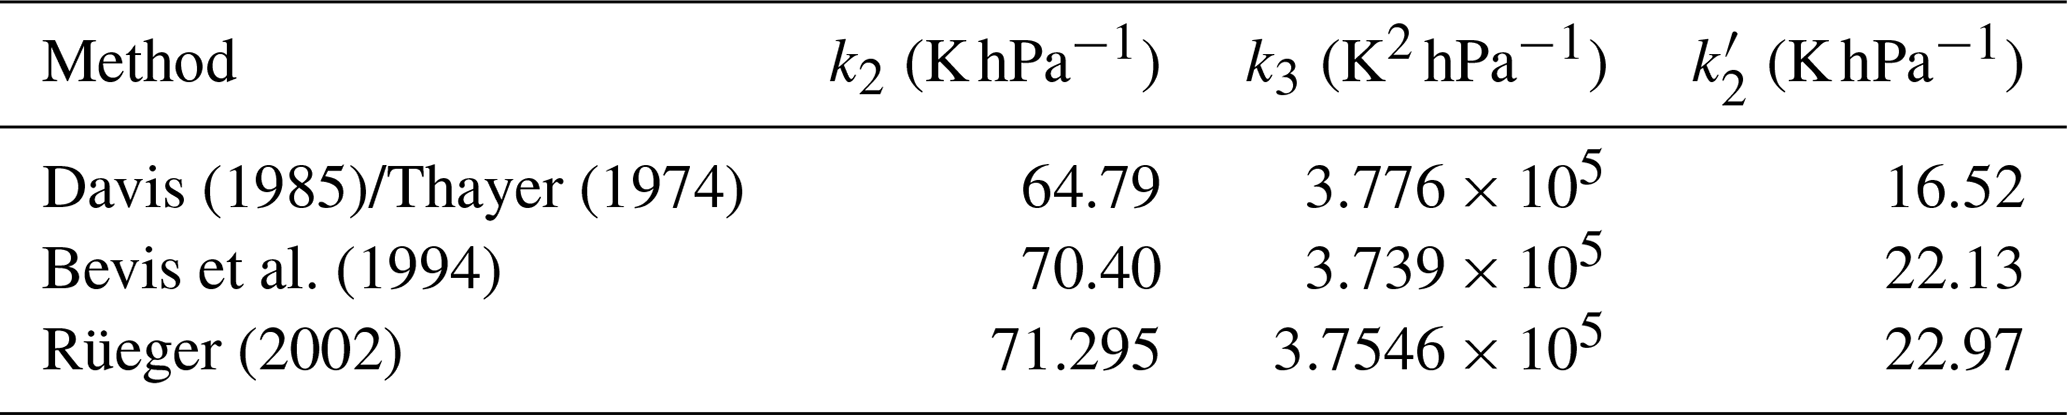
where ρw represents the density of liquid water (1000 kg m−3) and Rv is the specific gas constant for water vapour (461.52 ). To assess the sensitivity of the Π to the choice of thermodynamic coefficients, three widely used formulations were employed in this study, following Davis et al. (1985)/Thayer (1974), Bevis et al. (1994), and Rüeger (2002), as shown in Table 2.
Table 2Refractivity constants used in the sensitivity analysis of the Π factor, based on three commonly adopted formulations.
To rigorously quantify the uncertainty in the final PWV retrieval and avoid fragmented error attributions, standard error propagation must be applied to the fundamental conversion Eq. (6). Assuming the uncertainties in the wet delay and the conversion factor are uncorrelated, the variance of the final PWV () is expressed using partial derivatives as in Eq. (8):
Evaluating these primary partial derivatives yields the proportional contributions of the geodetic and thermodynamic components as shown in Eq. (9):
The uncertainty in the conversion factor () is itself a compound term driven by the Tm and the static atmospheric refractivity constants (k2′ and k3). Its variance is defined via partial derivatives as shown in Eq. (10):
The sensitivity of the conversion factor strictly to Tm (the dynamic thermodynamic variable evaluated in this study) is quantified by its partial derivative and it represented as Eq. (11):
This consolidated formulation establishes the exact mathematical limits of thermodynamic error propagation. As demonstrated in the sensitivity analysis (Sect. 3.4), this framework accurately isolates the dynamic uncertainties driven by Tm from the baseline static biases introduced by the chosen refractivity constants.
2.4 Diagnostic Parameters and Error Analysis
The vertical structure of the atmosphere was analyzed by segregating the dataset into two regimes: the PBL (0–2 km), where water vapour is concentrated, and the Free Troposphere (>2 km). Additionally, the water vapour scale height (Hv) was calculated to parameterize the vertical distribution of moisture. Hv was derived for both RS and MWR by fitting an exponential decay function (Eq. 12) to the absolute humidity profile (ρv).
where ρv(z) is the absolute humidity at height z, and ρv,0 is the surface humidity. This curve fitting was deliberately restricted to the lowest 4 km of the atmosphere. Because this layer contains the vast majority (>90 %) of the tropospheric water vapour mass, bounding the fit prevents the algorithm from heavily weighting near-zero, noisy upper-tropospheric values that mathematically degrade the fit for the boundary layer. Furthermore, the scale height metric fundamentally assumes the atmosphere conforms to a well-behaved exponential decay. Profiles yielding Hv values outside the physically realistic range of 0.1–4.0 km were excluded from the statistical analysis to prevent artificial statistical skewing during complex meteorological states (e.g., deep convective mixing) where the underlying exponential model is invalid. Forcing a mathematical fit onto these non-exponential profiles yields physically meaningless artifacts. Therefore, a Quality Assurance filter was applied, bounding the analysis to the physically realistic range of . Profiles yielding values outside this range were discarded because they indicate the underlying exponential model itself is invalid for that specific atmospheric profile, preventing artificial statistical skewing in the instrument intercomparison. Profiles yielding Hv values outside the physically realistic range of 0.1–4.0 km were excluded from the statistical analysis. To evaluate the performance limitations of standard climatological models under varying hygrometric conditions, the systematic error (ΔPWV) was defined as the residual between the synergistic and standard approaches (Eq. 13):
The dataset was stratified into discrete bins of 5 mm PWV to isolate regimes of moisture abundance. Within each bin, the mean bias and ±1σ uncertainty were computed. These statistics were utilized to determine the “Systematic Bias Threshold,” defined herein as the specific hygrometric threshold where the systematic model error exceeds 1 mm. Finally, the propagation of thermodynamic uncertainty into the moisture retrieval was quantified via linear regression analysis. This compared the relative error in Tm (HGPT2 vs. MWR) against the resulting relative error in PWV, serving as an empirical verification of the theoretical sensitivity approximation given in Eq. (14):
The following evaluation follows a top-down diagnostic approach. First, the macroscopic baseline performance of the final derived moisture products is established. Subsequently, the underlying thermodynamic variables driving these discrepancies are isolated, culminating in the development of a targeted calibration scheme to mitigate the identified biases.
3.1 Temperature and Humidity Profile Validation
MWR-retrieved temperature T and ρv profiles were validated against collocated RS observations at 00:00 UTC and 12:00 UTC during March–October 2025. Profiles were stratified into the planetary boundary layer (PBL; 0–2 km) and free troposphere (>2 km), as shown in Figs. 2 and 3. Mean vertical temperature profiles show agreement between MWR and RS (Fig. 2a and b). In the boundary layer (0–2 km), MWR retrieves temperature with high precision (r>0.98, RMSE<1.5 K). Above 2 km, a cold bias is observed in the MWR retrieval, reaching −5.16 K at 12 UTC (Fig. 2f). Despite this bias, the linearity remains strong (r≈0.97), indicating the sensor captures relative thermal variations aloft despite the absolute offset. This confirms the trend observed in the mean profiles, where the MWR underestimates temperatures in the mid-to-upper troposphere. Furthermore, horizontal balloon drift driven by prevailing winds inevitably causes the radiosonde to sample a different atmospheric volume than the MWR's strict zenith view. While this spatiotemporal mismatch introduces random scatter into the upper-level comparisons, it does not artificially skew the systematic biases identified in this study. Consequently, the RMSE increases substantially to approximately 6.4–6.7 °C. The stark contrast in accuracy between the lower and upper troposphere is a known characteristic of ground-based microwave radiometry (Parde et al., 2025; Pakkattil et al., 2025). The high accuracy below 2 km is attributed to the high information content of the opaque V-band channels (51–58 GHz), whose weighting functions peak near the surface. Above 2 km, these weighting functions broaden significantly, reducing vertical resolution and causing a “smearing” effect where the instrument provides a volume-averaged temperature rather than a precise point measurement. The observed cold bias is likely a result of the retrieval algorithm (e.g., neural network) relying heavily on a climatological a priori dataset that does not perfectly represent the thermal conditions of the transition season observed, or systematic offsets in the radiative transfer model (absorption coefficients) used for training.
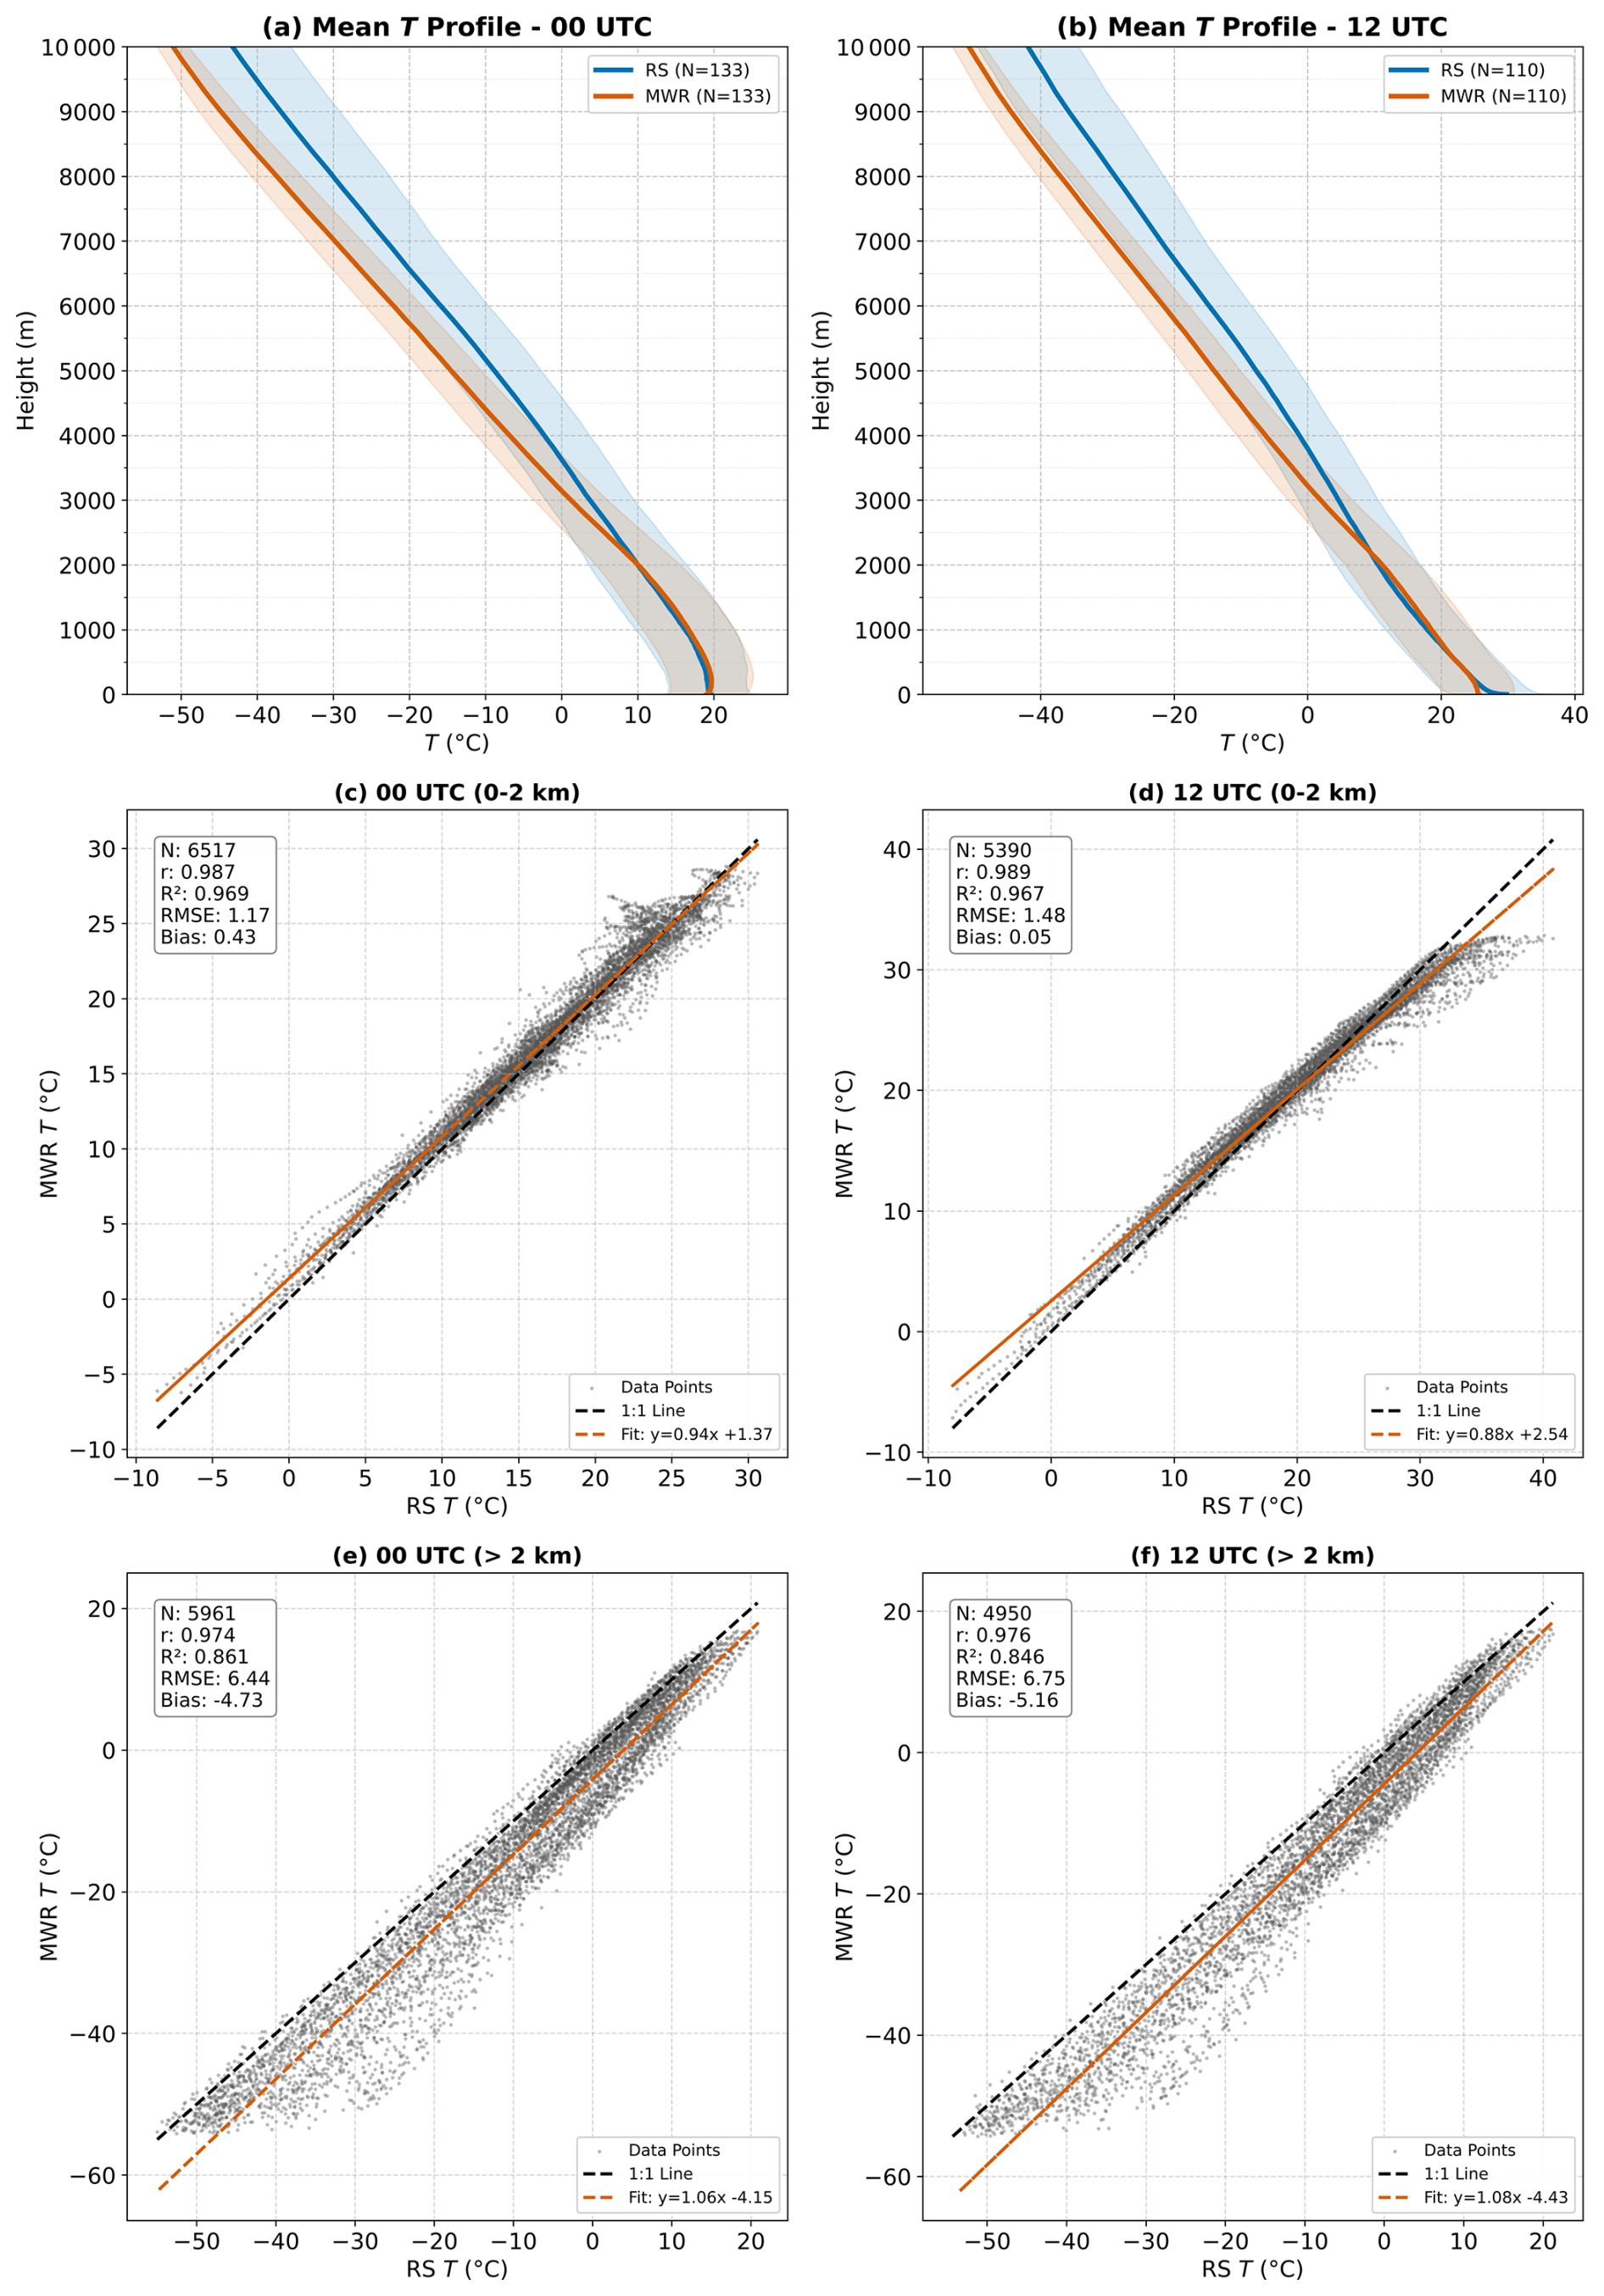
Figure 2Comparison of radiosonde and microwave radiometer (MWR) temperature profiles: (a, b) Mean vertical temperature (T) profiles at 00 and 12 UTC with variability shading; (c–f) Scatter comparisons for the lower (0–2 km) and upper (>2 km) atmosphere at both times.
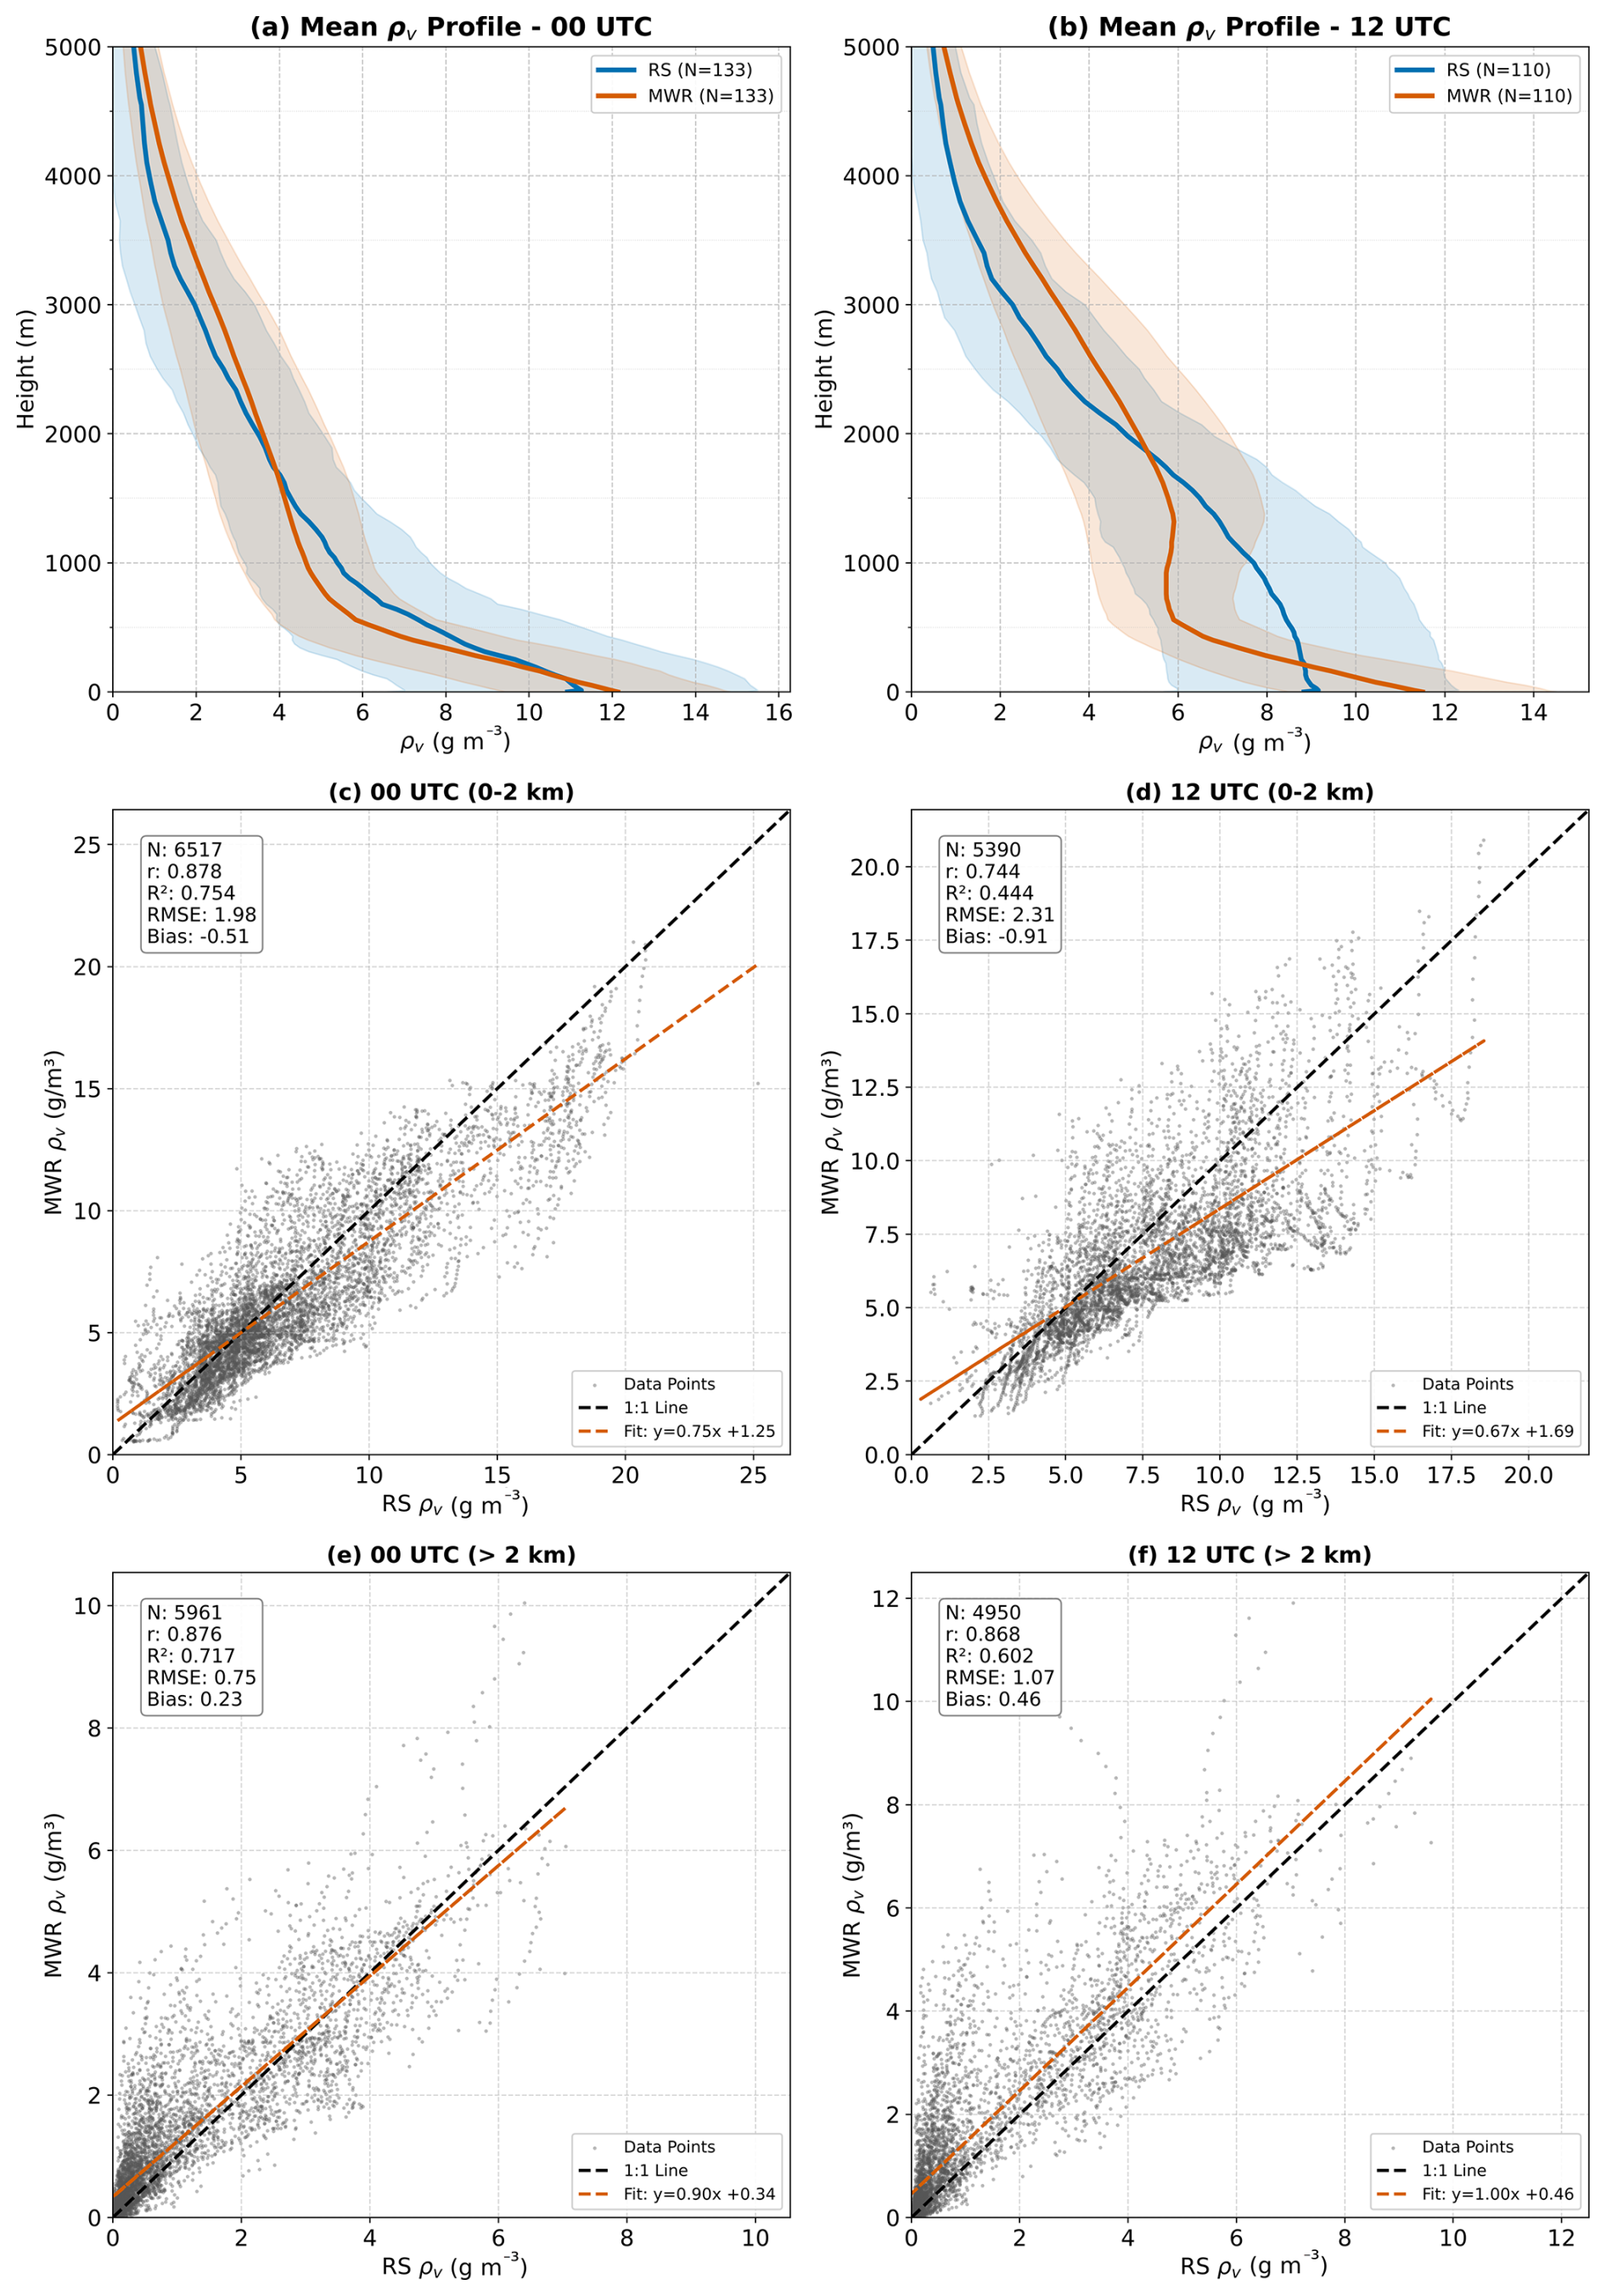
Figure 3Comparison of radiosonde and microwave radiometer (MWR) absolute humidity (ρv) profiles: (a, b) Mean vertical ρv profiles at 00 and 12 UTC with variability shading; (c–f) Scatter comparisons for the lower (0–2 km) and upper (>2 km) atmosphere at both times.
The mean ρv profiles (Fig. 3a and b) show the expected exponential decrease of moisture with height. At 00 UTC, the profiles align reasonably well. However, at 12 UTC, the MWR profile exhibits a structural deviation between 1–2 km, failing to capture the smooth moisture gradient recorded by the RS. This discrepancy may be attributed to the MWR's limited vertical resolution during periods of active daytime mixing or complex humidity layering. The retrieval of humidity in the lower atmosphere shows moderate agreement but is less accurate than the temperature retrievals. Performance is notably better at night (00 UTC) with r of 0.878 and RMSE of 1.98 g m−3. At 12 UTC, the correlation drops to 0.744, and the scatter increases (). Because the integrated mass of the water vapour column is physically and numerically equivalent to its depth (assuming the standard density of liquid water), this physical quantity is exclusively referred to as PWV expressed in millimeters (mm) throughout this study to align with operational meteorological conventions. A negative bias persists at both times ( at 00 UTC and at 12 UTC), indicating a tendency for the MWR to underestimate moisture content in the boundary layer, particularly during the day. Surprisingly, the statistical linearity for ρv improves slightly or remains stable above 2 km, likely due to the lower overall magnitude of humidity at these heights. The correlation coefficients remain stable (∼0.87). In contrast to the lower levels, the bias shifts to slightly positive values (0.23 g m−3 at 00 UTC and 0.46 g m−3 at 12 UTC), suggesting a slight moist bias in the MWR retrievals aloft. The linear fits (Fig. 3e and f) align closely with the 1:1 line, with slopes near unity (0.90 and 1.00), indicating that the MWR effectively captures the free tropospheric humidity trends despite the lower absolute values. The difficulty in retrieving accurate ρv profiles, particularly at 12 UTC, stems from the limited vertical resolution of the K-band channels (22–31 GHz). Unlike temperature profiling, humidity profiling offers very few independent degrees of freedom (typically<3), making it difficult for the MWR to resolve sharp vertical gradients often present at the top of the convective boundary layer during the daytime. The structural deviation and underestimation are common issues linked to the “smoothing” error inherent in passive radiometry, where sharp moisture inversions are averaged out. Furthermore, the persistent bias suggests potential uncertainties in the water vapour absorption models (spectroscopic parameters) or non-representative training data used in the retrieval algorithm.
3.2 Precipitable Water Vapour (PWV) and Scale Height (Hv) Validation
Unlike vertical profiling, the MWR excels in measuring total column quantities. The comparison with RS yields an excellent correlation (r=0.971) and a low RMSE of 1.72 kg m−2 (Fig. 4). This performance disparity – superior PWV versus degraded profiles – confirms that while the sensor cannot resolve vertical structural details due to smoothing error, the radiometric brightness temperature in the K-band remains strictly proportional to the total precipitable water mass. The GNSS-derived PWV shows a slight negative bias relative to RS (), whereas it relative to the MWR exhibits a positive bias (). The cumulative offset observed in the MWR-GNSS intercomparison () highlights the systematic differences in calibration and retrieval assumptions between active (GNSS) and passive (MWR) techniques. The GNSS underestimation is likely driven by errors in the Tm derived from the static HGPT2 model, a hypothesis further explored in Sect. 3.4. To further diagnose the structural limitations of the retrievals, we evaluated the water vapour Hv. While Hv is admittedly a single-parameter representation of the complex atmospheric moisture profile, it is a crucial parameter that provides a representative value for the rate at which water vapour decreases with altitude – a key factor in understanding atmospheric stability, cloud formation, and radiative transfer processes. In this study, it is utilized specifically as a diagnostic metric to quantify the vertical structural limitations of passive microwave remote sensing. The comparison of Hv calculated from RS and MWR profiles is shown in Fig. 5. Unlike the high-fidelity PWV retrievals, the MWR-derived scale height shows negligible correlation with RS observations (r=0.25, ) and a massive systematic positive bias of 0.62 km. The histograms (Fig. 5b) further elucidate this discrepancy: while the RS scale heights follow a narrow, physically realistic distribution centered around a mean (μ) of 1.51 km, the MWR distribution is artificially broad and shifted to significantly higher values (μ=2.13 km).
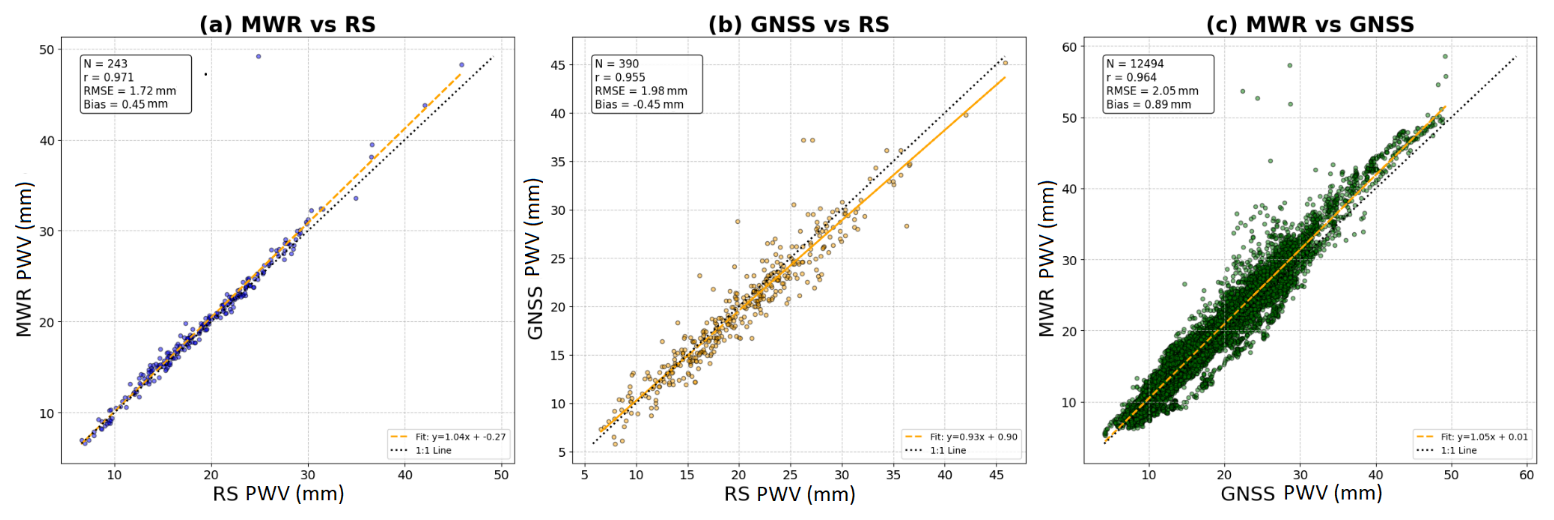
Figure 4Intercomparison of precipitable water vapour (PWV) retrieved from Microwave Radiometer (MWR), GNSS, and Radiosonde observations. (a) MWR PWV versus radiosonde PWV, (b) GNSS PWV (derived using HGPT2 Tm) versus radiosonde PWV, and (c) MWR PWV versus GNSS PWV (derived using HGPT2 Tm).
The large scatter and ambiguity in the MWR estimates – which completely dwarf the individual least-squares fit uncertainties of the exponential regression – are a direct consequence of the instrument's physical limitations. Hv is highly sensitive to the sharp vertical gradient of humidity at the top of the planetary boundary layer. However, the K-band channels (22–31 GHz) utilized for humidity profiling possess broad weighting functions, restricting the vertical degrees of freedom to typically fewer than three. Because the MWR lacks the vertical resolution to capture sharp moisture inversions, the retrieval algorithm mathematically smears the moisture mass upward. This inherent “smoothing error” artificially elongates the vertical moisture profile, effectively inflating the calculated e-folding depth. Therefore, the inclusion of this Hv analysis serves to transparently demonstrate a critical operational boundary: while the MWR is an excellent standard for PWV, it is significantly unreliable and mathematically unsuited for characterizing vertical moisture compactness. The significant deviations observed in these macroscopic retrieval products necessitate a deeper investigation into the intermediate thermodynamic variables driving the conversion process. Consequently, the isolated performance of the Tm is evaluated in Sect. 3.3, followed by the introduction of a post-retrieval MWR calibration scheme in Sect. 3.4 designed to mitigate these native biases.
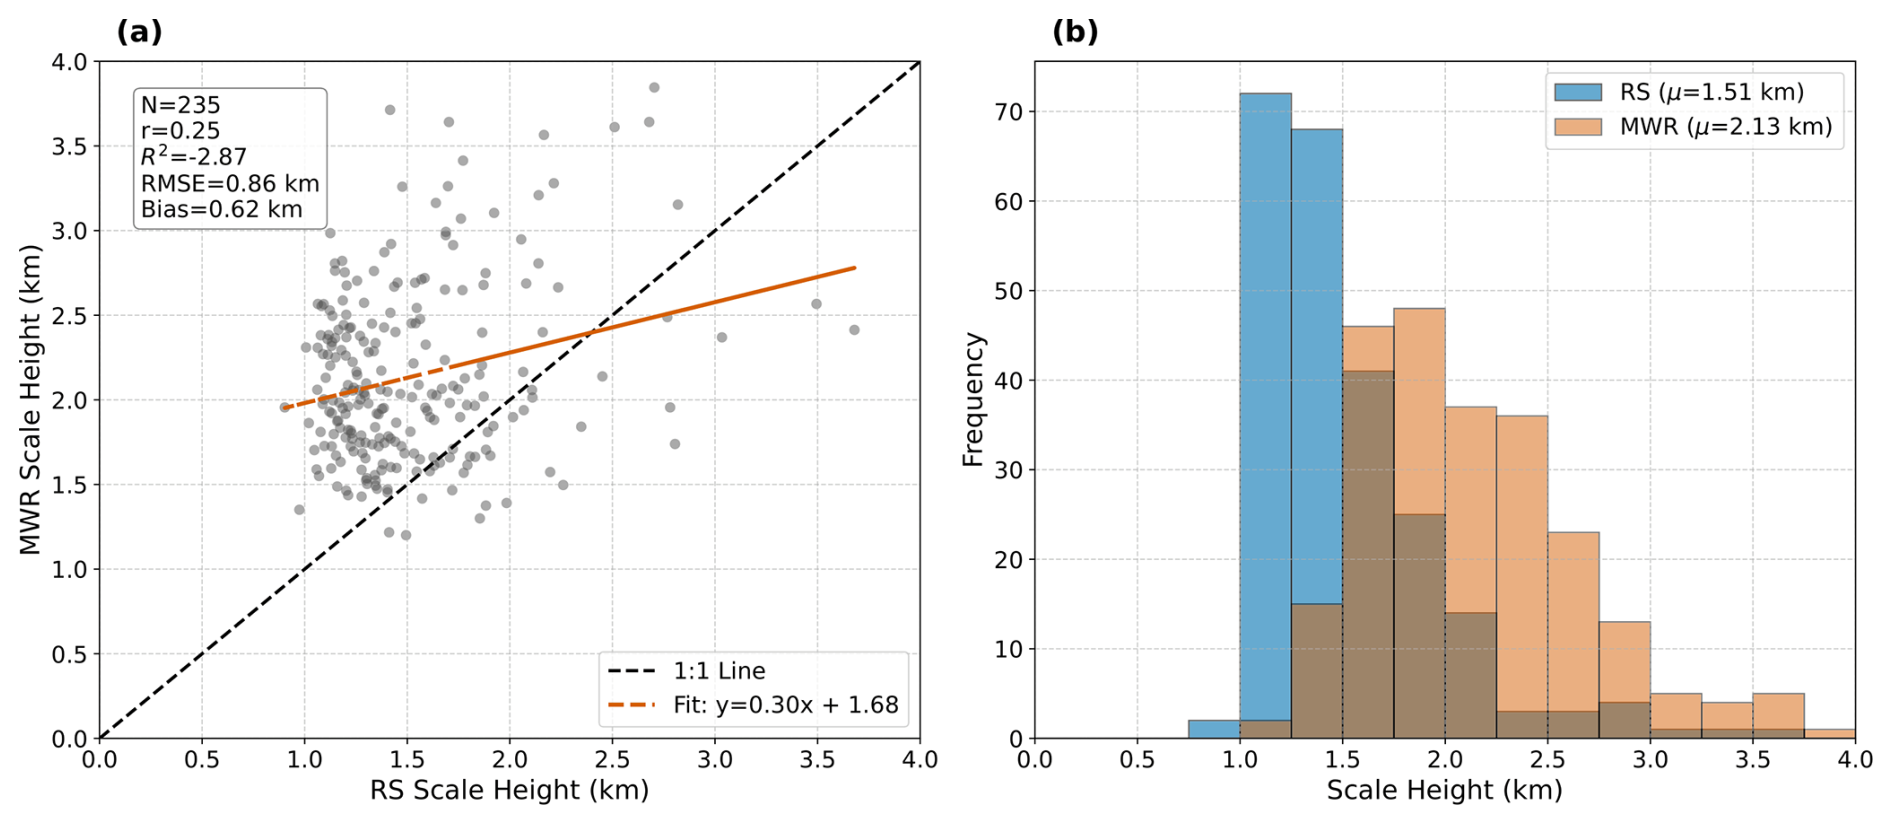
Figure 5Comparison of scale height from radiosonde (RS) and microwave radiometer (MWR): (a) Scatter plot with 1:1 line and linear fit, including summary statistics; (b) Frequency distributions showing mean scale heights for RS and MWR.
3.3 Weighted Mean Temperature (Tm) Validation
The accurate estimation of the Tm is critical for converting GNSS-derived ZWD into PWV. The performance of Tm derived from the MWR and the empirical GPT2w model (HGPT2) was evaluated against RS measurements, which serve as the “ground truth.” The results are presented in Fig. 6. The time series (Fig. 6a) illustrates the seasonal evolution of Tm from April–October 2025. The Radiosonde observations (black dots) show significant variability, capturing synoptic-scale weather fluctuations. The MWR-derived Tm (orange dots) tracks these fluctuations with remarkable precision, overlaying the RS points almost perfectly. In stark contrast, the HGPT2 model (blue dots) provides a smooth, climatological curve. While it captures the general seasonal trend, it completely misses the day-to-day thermodynamic variability, often overestimating Tm during cooler transient events and underestimating it during warmer anomalies. The empirical model shows only moderate performance (r=0.800) with a substantial spread (RMSE=4.54 K). A systematic positive bias of 1.67 K indicates that HGPT2 generally overestimates the atmospheric temperature profile in this region. The scatter plot reveals a diffuse, “cloud-like” distribution, confirming its inability to capture real-time atmospheric dynamics. The MWR demonstrates superior performance, achieving a near-perfect correlation (r=0.981). The RMSE is significantly reduced to 2.33 K, which is nearly half the error of the empirical model. Interestingly, the MWR exhibits a negative bias of −1.91 K, suggesting a systematic underestimation of Tm. Crucially, this bias does not originate in the free troposphere, but rather in the planetary boundary layer (0–3 km). Since Tm is weighted by water vapour pressure, this “cold bias” indicates the MWR is underestimating the intense near-surface heating or the sharp lapse rates characteristic of the Nicosia environment. Despite this offset, the tight linearity indicates that MWR is an excellent source for capturing real-time Tm variations. Comparing the large dataset of MWR against HGPT2 (N=12 493) confirms the discrepancy between dynamic and static modeling. The correlation is lower (r=0.770) and the scatter is large (RMSE=4.89 K), further proving that static empirical models are insufficient for high-precision GNSS meteorology compared to dynamic radiometer measurements. While errors in ZTD estimation contribute significantly to the overall uncertainty budget, the specific error introduced during the conversion from delay to water vapour is linearly dependent on the accuracy of Tm. Assuming a given ZTD, a standard rule of thumb states that a 1 % relative error in Tm translates to roughly a 1 % relative error in the resulting PWV. By switching from a static model (HGPT2, ∼4.5 K error) to a dynamic sensor (MWR, ∼2.3 K error), the uncertainty in the GNSS water vapour product is effectively halved. This validates the “synergistic” approach of using collocated MWR thermal data to process GNSS signals.
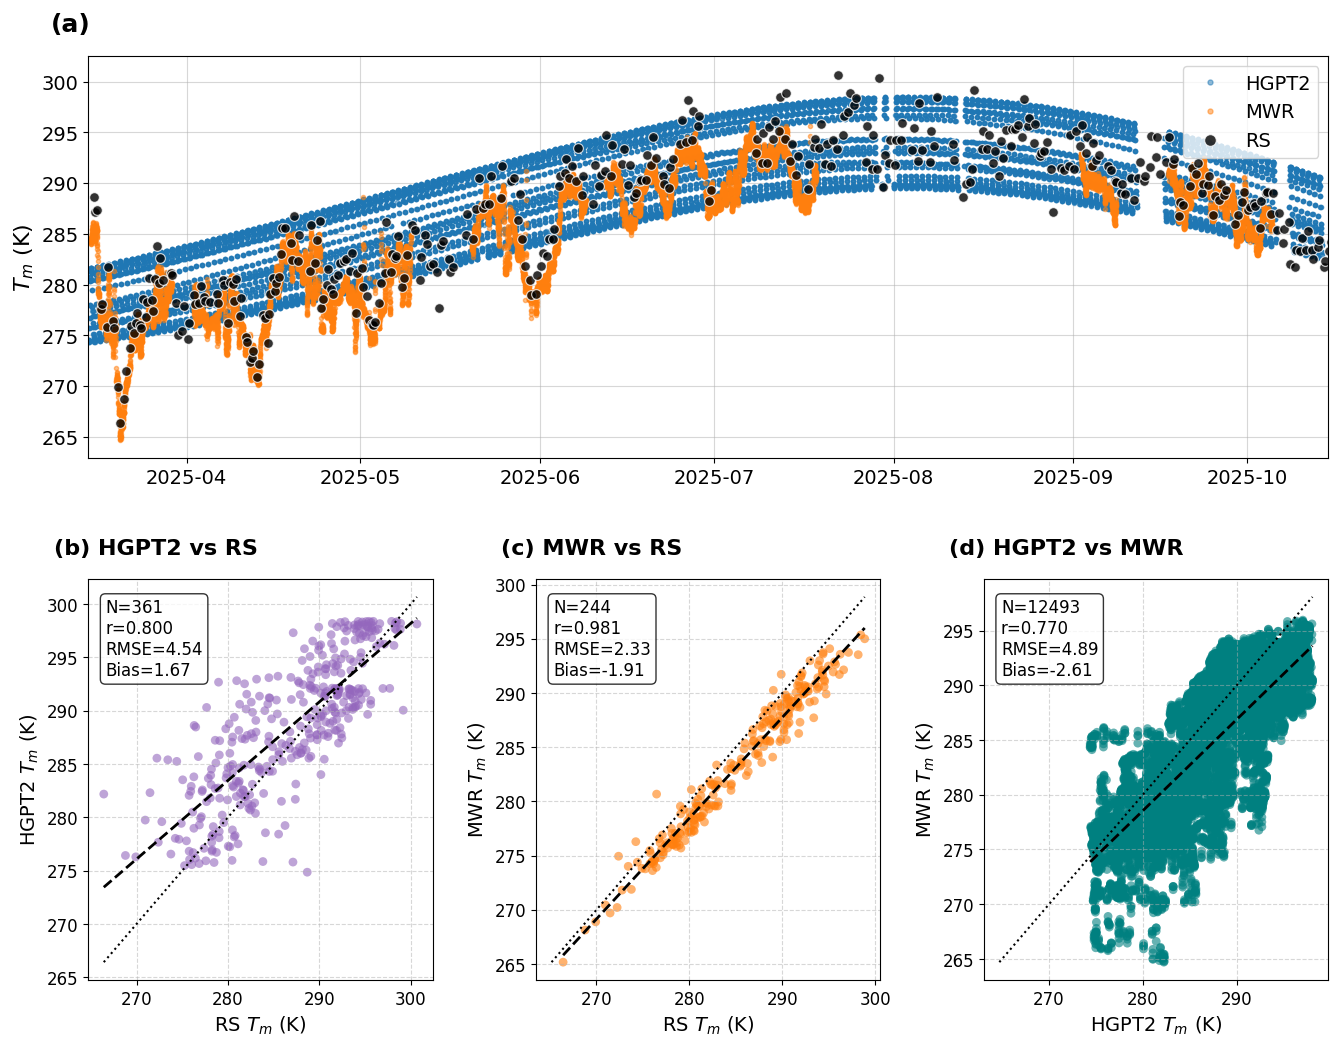
Figure 6Comparison of weighted mean temperature (Tm) derived from HGPT2, MWR, and Radiosonde (RS) during March–November 2025. (a) Time series of Tm estimates from all three sources. (b–d) Scatter plots showing statistical comparisons between: (b) HGPT2 vs. RS, (c) MWR vs. RS, and (d) HGPT2 vs. MWR.
3.4 Diagnostic Analysis of Thermodynamic Conversion Uncertainty
3.4.1 Diurnal Bias Amplification in Static Models
To pinpoint the physical origin of the HGPT2 model's deficiency, a diurnal cycle analysis was performed (Fig. 7). While the previous statistical metrics indicated a general positive bias, the temporal breakdown in Fig. 7a reveals that this error is not uniform, but is driven by a fundamental misrepresentation of atmospheric thermodynamics. The MWR-derived Tm (orange line) exhibits a physically realistic, dampened diurnal amplitude of approximately 1.5 K. This stability reflects the high thermal inertia of the tropospheric column, which does not heat rapidly in response to surface insolation. In stark contrast, the HGPT2 model (blue line) displays an exaggerated diurnal wave with an amplitude exceeding 8.5 K, peaking synchronously with solar noon (12:00 UTC). As previously documented in the literature (Wang, 2005; Bock et al., 2021), deriving Tm via empirical regression on surface temperature (Ts) is known to introduce spurious diurnal cycles. Our observations confirm this intrinsic limitation: because the empirical model's periodic functions are overly sensitive to Ts, it assumes intense surfcae-level heating propagates uniformly through the column, failing to capture the true thermodynamic decoupling between the turbulent planetary boundary layer and the stable free troposphere. During the hours of peak solar insolation (11:00–14:00 UTC), the coastal environment experiences active convective mixing and the onset of the sea breeze, which dramatically alters the vertical distribution of water vapour. If the underlying reanalysis climatology fails to adequately resolve the sharp moisture capping inversion at the top of the daytime planetary boundary layer (PBL), it will misrepresent the Tm weighting function. Specifically, if the model traps too much moisture near the intensely heated surface – or fails to capture the thermodynamic decoupling between the turbulent PBL and the stable free troposphere – the integral will disproportionately weight the hottest atmospheric layers. This coupled temperature-humidity mechanism physically manifests as the severe diurnal bias peak effect observed in Fig. 7b, where the systematic bias surges to over +6 K. This demonstrates that high-precision GNSS meteorology requires synergistic MWR data to capture both the true thermal stability and the dynamic vertical moisture weighting of the atmosphere.
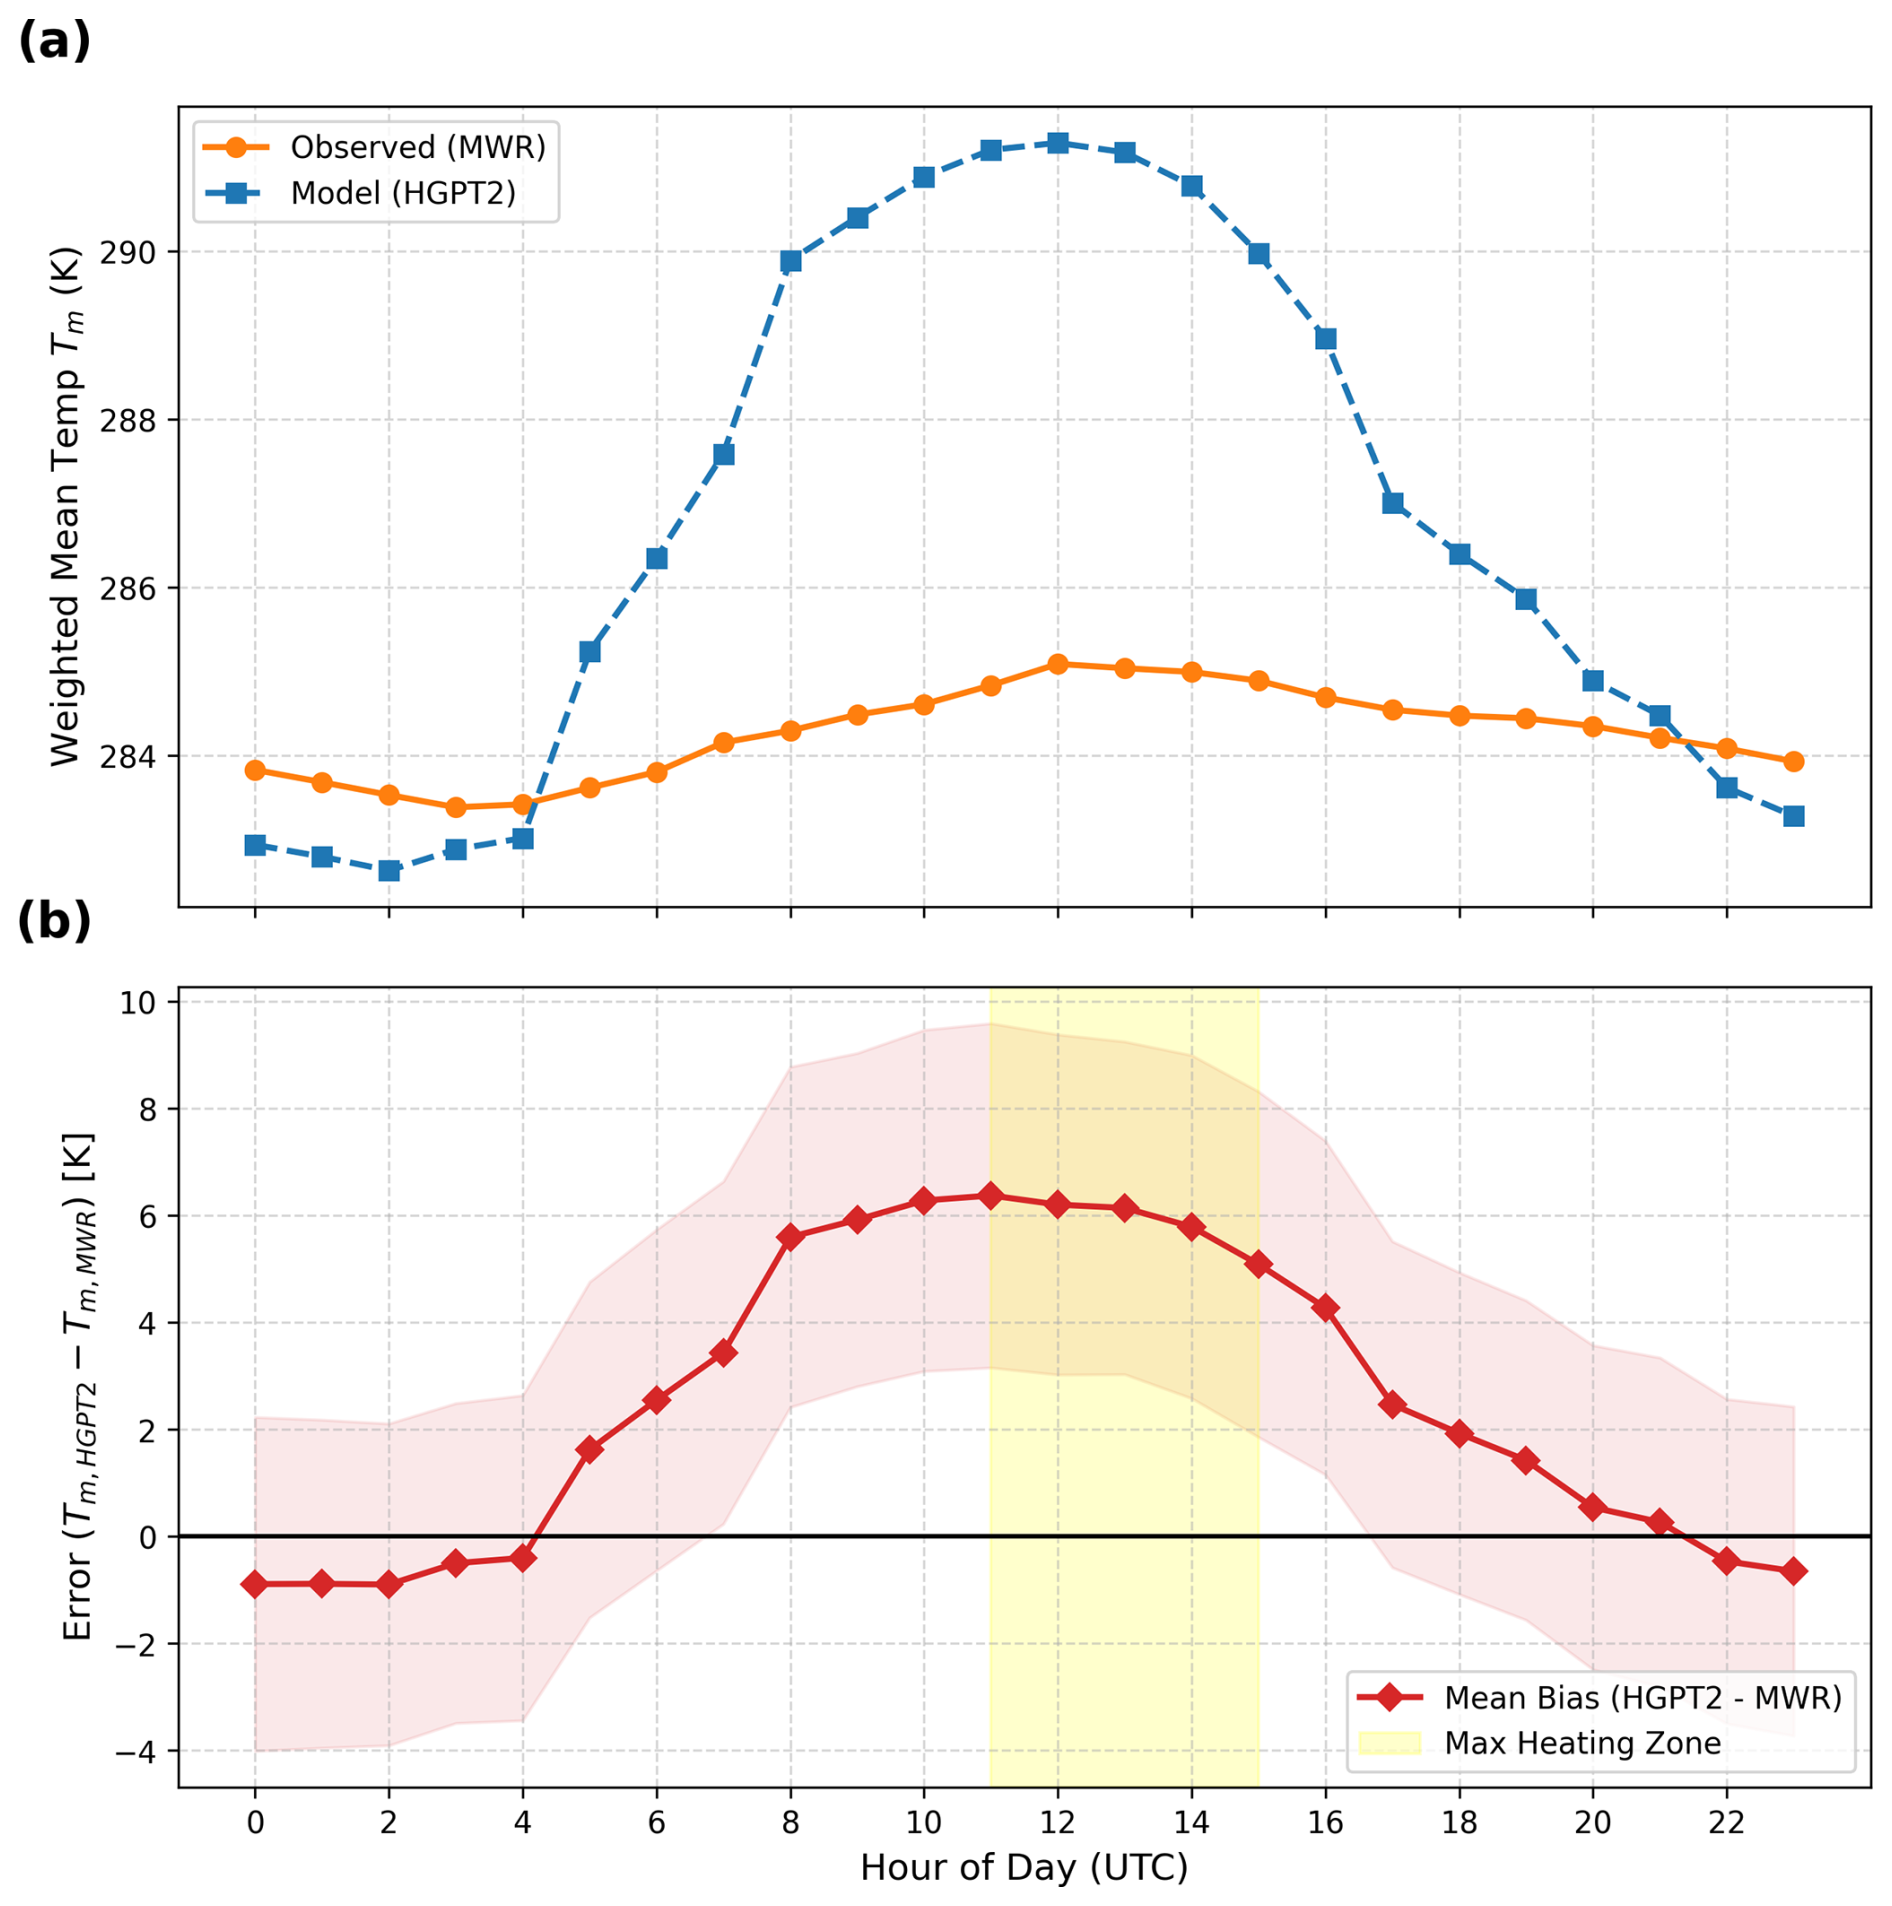
Figure 7Diurnal variation of weighted mean atmospheric temperature Tm derived from microwave radiometer (MWR) observations and HGPT2 model simulations (top panel). The bottom panel shows the corresponding hourly mean bias (Tm,HGPT2−Tm,MWR), with shaded envelopes indicating variability. The yellow shaded region highlights the period of maximum daytime heating.
3.4.2 Calibration and Bias Correction of MWR Tm
Figure 8 presents a statistical validation of the MWR derived Tm against co-located RS observations. The analysis highlights the necessity and efficacy of a linear bias correction scheme to improve GNSS-PWV conversion accuracy. The scatter plot (Fig. 2a) reveals a distinct systematic deviation in the original MWR retrieval relative to the RS reference. The data points consistently fall below the 1:1 identity line, indicating a negative bias in the raw MWR Tm product. The original RMSE is 2.32 K. This error is largely driven by the systematic offset rather than random scatter, as evidenced by the high linearity (R2) of the relationship. The thermodynamic profiles were retrieved using the manufacturer's standard Neural Network (NN) algorithm, trained on Region historical RS data.
The Probability Density Function (PDF) of the errors (Tm,MWR−Tm,RS) in Fig. 8b clearly visualizes the bias shift. The pre-correction distribution is non-Gaussian and shifted significantly to the negative domain, with a mean bias (μ) of −1.90 K. In the context of GNSS meteorology, a Tm error of ≈2 K translates to a relative PWV error of approximately 0.7 %–1.0 %. For climate monitoring, this represents a significant systematic dry bias. Applying the linear correction model (as formulated in Sect. 2.2.1) successfully re-centers the error distribution. The post-correction bias is reduced to 0.50 K, and the histogram aligns symmetrically around the zero-error line. The correction reduces the RMSE to 1.43 K, which is consistent with the theoretical accuracy limit of ground-based radiometric profiling (typically 1–2 K). The remaining spread (width of the green histogram) represents the random error component, likely attributable to instrumental noise and the imperfect spatiotemporal matching between the instantaneous MWR zenith view and the drifting radiosonde balloon. The correction methodology effectively removes the systematic instrumental bias without artificially compressing the natural variability of the atmosphere. The reduction of RMSE by ∼38 % (from 2.32–1.43 K) confirms that site-specific calibration of Tm is a mandatory processing step for generating climate-quality GNSS-PWV datasets.
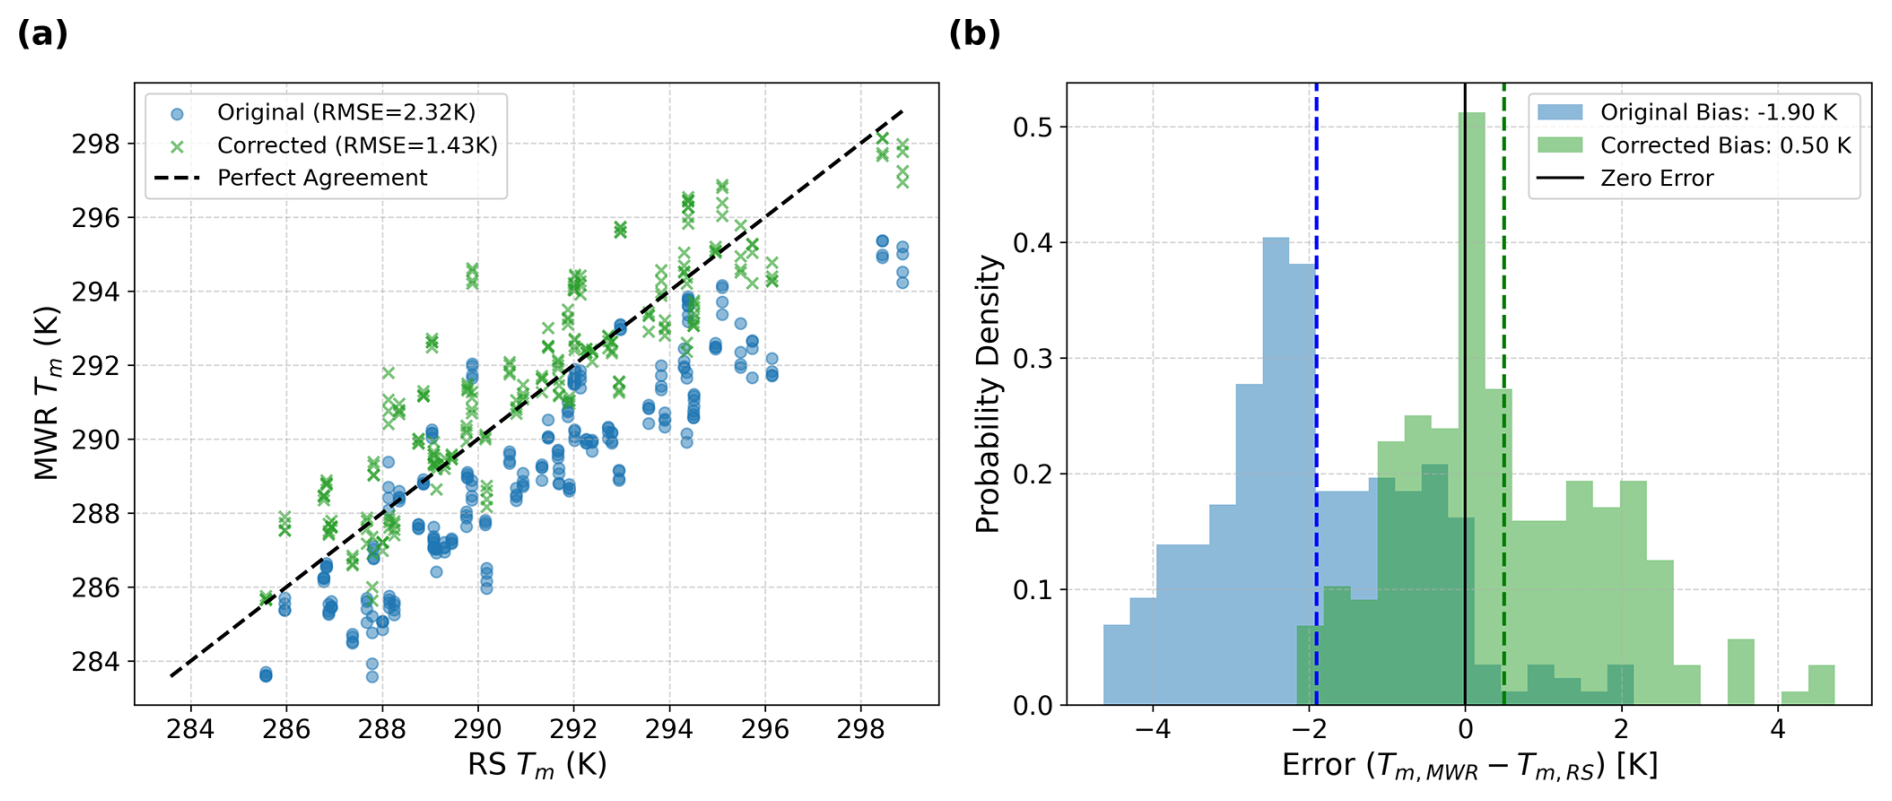
Figure 8Evaluation of weighted mean temperature Tm correction against Radiosonde (RS) observations. (a) scatter plots of original and bias-corrected MWR-derived Tm versus RS Tm with the dashed line indicating perfect agreement. (b) presents the probability density of errors (Tm,MWR−Tm,RS) before and after correction, demonstrating a substantial reduction in cold bias and RMSE.
3.4.3 Uncertainty Budget Analysis
In standard GNSS network processing, the largest source of PWV uncertainty is often the interpolation or modeling of surface pressure required to calculate the ZHD (Van Malderen et al., 2022). However, the CYGMEN observatory setup mitigates this spatial interpolation error by utilizing the co-located Vaisala WXT536 sensor, which has a stated pressure accuracy of ±0.5 hPa. A 0.5 hPa pressure uncertainty propagates to approximately 1.15 mm of error in the ZHD. After applying the Π conversion factor, this restricts the pressure-induced PWV uncertainty to roughly ±0.17 mm. Because this high-precision localized pressure data effectively minimizes ZHD uncertainty, the accuracy of the Tm parameterization emerges as the dominant remaining variable in the PWV error budget for this site.
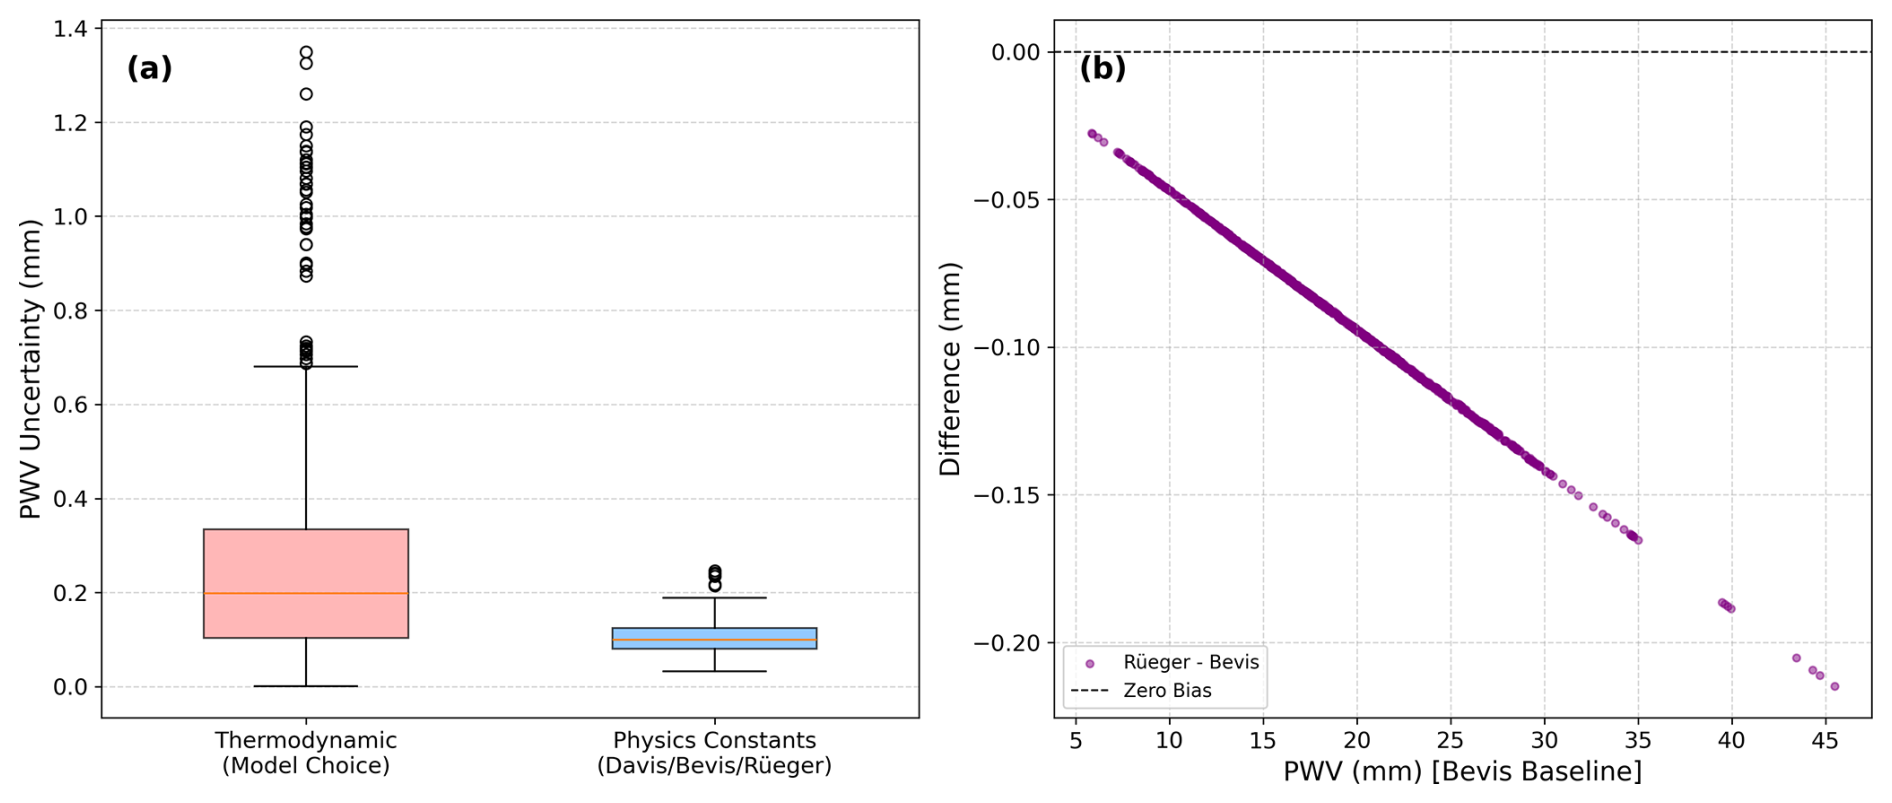
Figure 9(a) PWV uncertainty attributed to thermodynamic assumptions and to the choice of refractivity constants. (b) Difference in GNSS-derived PWV resulting from the use of alternative refractivity constant formulations relative to Bevis et al. (1994).
It is important to note that the complete error budget for GNSS-derived PWV encompasses significant uncertainties originating from the ZTD estimation phase itself. These include geodetic errors such as satellite orbit and clock uncertainties, mapping function inaccuracies, and site-dependent electromagnetic effects like signal scattering and multipath. While these geodetic factors are critical, the following component-wise uncertainty analysis (Fig. 9) specifically isolates the errors introduced during the subsequent conversion step (Π). To decouple these retrieval contributions, two primary sources of uncertainty were isolated: the thermodynamic parameterization of Tm and the selection of atmospheric refractivity constants (). When decoupling these retrieval contributions, it is critical to distinguish between the statistical nature of the underlying error sources. As demonstrated by Healy (2011), uncertainties in the atmospheric refractivity constants () act strictly as static systematic biases; selecting a different set of published constants permanently shifts the baseline of the Π by a fixed margin. Conversely, the uncertainty originating from the Tm parameterization is a dynamic, compound error. As highlighted by Wang et al. (2005) and Bock et al. (2021), empirical Tm models derived from surface temperatures often fail to capture the true profile variance, introducing both a systematic bias (the model's mean regional offset) and a substantial random error component (the statistical scatter, or RMSE, driven by real-time thermodynamic variability and diurnal decoupling). While Fig. 9 juxtaposes these two distinct sources to illustrate their relative bounding magnitude on the final PWV product, their significantly different statistical behaviors – static bias versus dynamic scatter – must be acknowledged. As illustrated in Fig. 9a, and explicitly evaluating the components of the conversion uncertainty framework established in Eq. (10), the variance introduced by the Tm estimation strategy () significantly outweighs the influence of the physical constants (). Feeding our empirically derived thermodynamic uncertainties into the partial derivative formulation defined in Eq. (11) specifically, substituting the HGPT2 RMSE of 4.54 K versus the corrected MWR RMSE of 1.43 K as our values – yields an isolated PWV retrieval error of approximately 1–2 mm due to stochastic thermodynamic variability. In contrast, evaluating the exact mathematical limits of the refractivity coefficients () defined here as the maximum divergence between the historical Davis et al. (1985), the standard Bevis et al. (1994), and the updated Rüeger (2002) formulations – results in an uncertainty an order of magnitude smaller. Figure 9b further resolves the impact of the refractivity constants, showing the differential bias between the oldest (Davis) and newest (Rüeger) standards. The relationship is linear and proportional to the total water vapour content, consistent with a scaling of the Π factor. While the transition to the Rüeger (2002) constants introduces a systematic positive shift, the magnitude of this correction (typically<0.2 mm for standard loading) is negligible for synoptic meteorological applications compared to the noise induced by Tm errors. However, for long-term climatological trend analysis where stability is paramount, consistent adherence to the Rüeger (2002) standard is recommended to eliminate this small, but persistent systematic bias. Overall, the correction of the Tm is 2.5 times more important than selection of the constant.
3.5 Error Propagation and Synergistic Retrieval Assessment
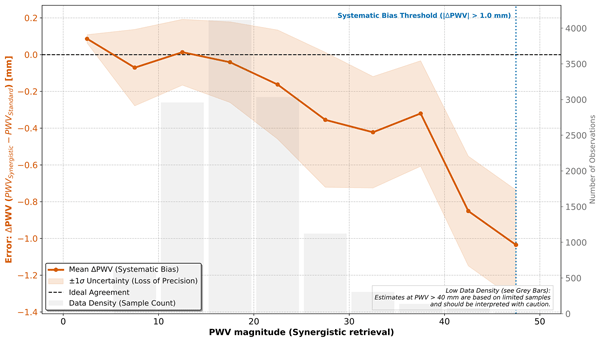
In this section, the PWV was derived using bias-corrected mean temperature (Tm) and constant values based on the study by Rüeger (2002), as mentioned in the Sect. 3.4. The impact of Tm errors on the final PWV product was analyzed to quantify the benefits of the synergistic retrieval method. Figure 10 visualizes the direct relationship between the relative error in Tm and the resulting relative error in PWV. The plot reveals a strictly linear relationship (R2=0.984) with a slope of 0.981. This confirms the theoretical approximation that . The color gradient indicates that this linear error propagation holds true across all PWV magnitudes (from<10 mm to >45 mm). This implies that temperature errors propagate directly into moisture errors regardless of the humidity level, making accurate Tm crucial at all times. Figure 11 investigates the systematic difference (ΔPWV) between the synergistic retrieval (using MWR Tm) and a standard retrieval (using empirical Tm) as a function of moisture abundance (PWV magnitude). For drier conditions (PWV<25 mm), the difference is minimal (near zero), and the uncertainty (shaded region) is low. This suggests that for low humidity, the choice of Tm source is less critical. As atmospheric moisture increases (>25 mm), a significant negative bias emerges. The curve dips sharply, reaching nearly −1.0 mm at extreme humidity (45+ mm). The “Systematic Bias Threshold” marker indicates that beyond 45 mm, the discrepancy exceeds 1.0 mm. The fact that the bias magnitude scales directly with total PWV provides physical confirmation that the error source is located in the boundary layer, where the bulk of the water vapour resides. The growing negative bias demonstrates that standard GNSS processing (using static models like HGPT2) systematically overestimates water vapour during extreme events compared to the more accurate synergistic method. Rather than extrapolating these localized errors to regional hydrological impacts, we emphasize the primary empirical observation: the systemic deviation of the standard empirical model scales proportionally with the magnitude of the PWV regime. Crucially, this systematic overestimation of moisture during extreme events is deeply intertwined with the diurnal cycle of the local atmosphere. This analysis quantifies the specific operational penalty of utilizing static climatological models in this region, demonstrating that HGPT2 incurs an PWV error exceeding 1.0 mm during severe thermodynamic events. As previously established (Fig. 7), the static HGPT2 model displays an exaggerated diurnal wave with an amplitude exceeding 8.5 K. Because the static model fails to account for the thermodynamic decoupling between the heated boundary layer and the cooler free troposphere during the day, this Tm error artificially inflates the amplitude of the GNSS-derived PWV diurnal cycle during peak solar insolation. By utilizing the synergistic retrieval approach, this spurious daytime moisture amplification is effectively mitigated. While further multi-site, long-term studies are required to assess the broader impacts on regional operational forecasting, our localized dataset clearly indicates that integrating real-time MWR thermal data successfully removes diurnal artifacts and reduces systematic measurement biases at this site.
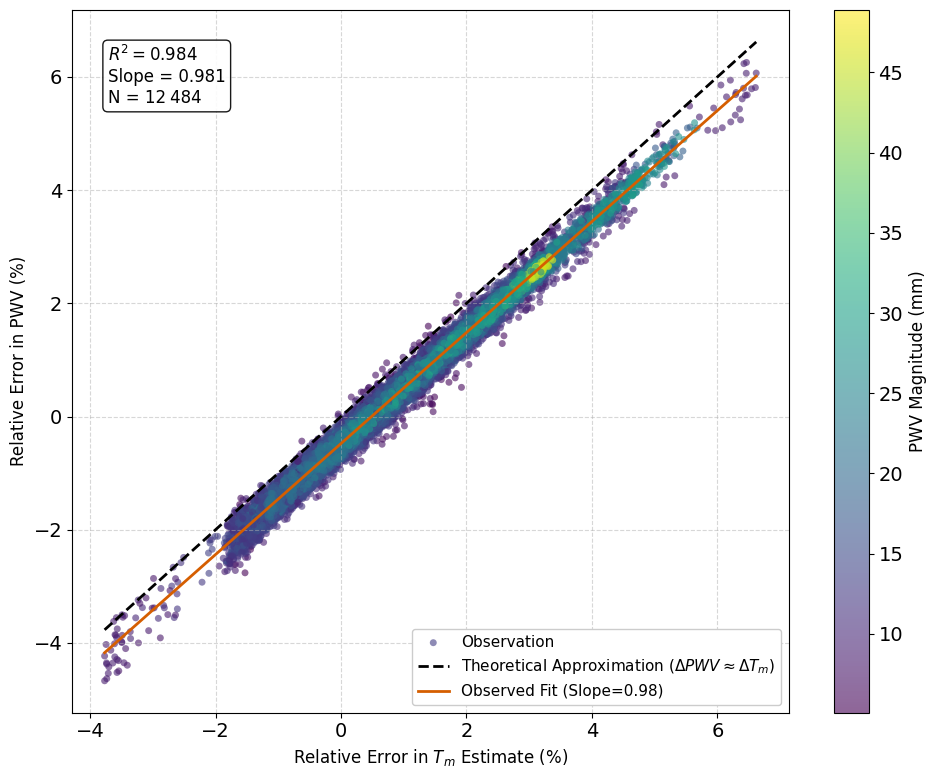
Figure 10Driver of model failure: Impact of weighted mean temperature (Tm) accuracy on PWV retrieval.
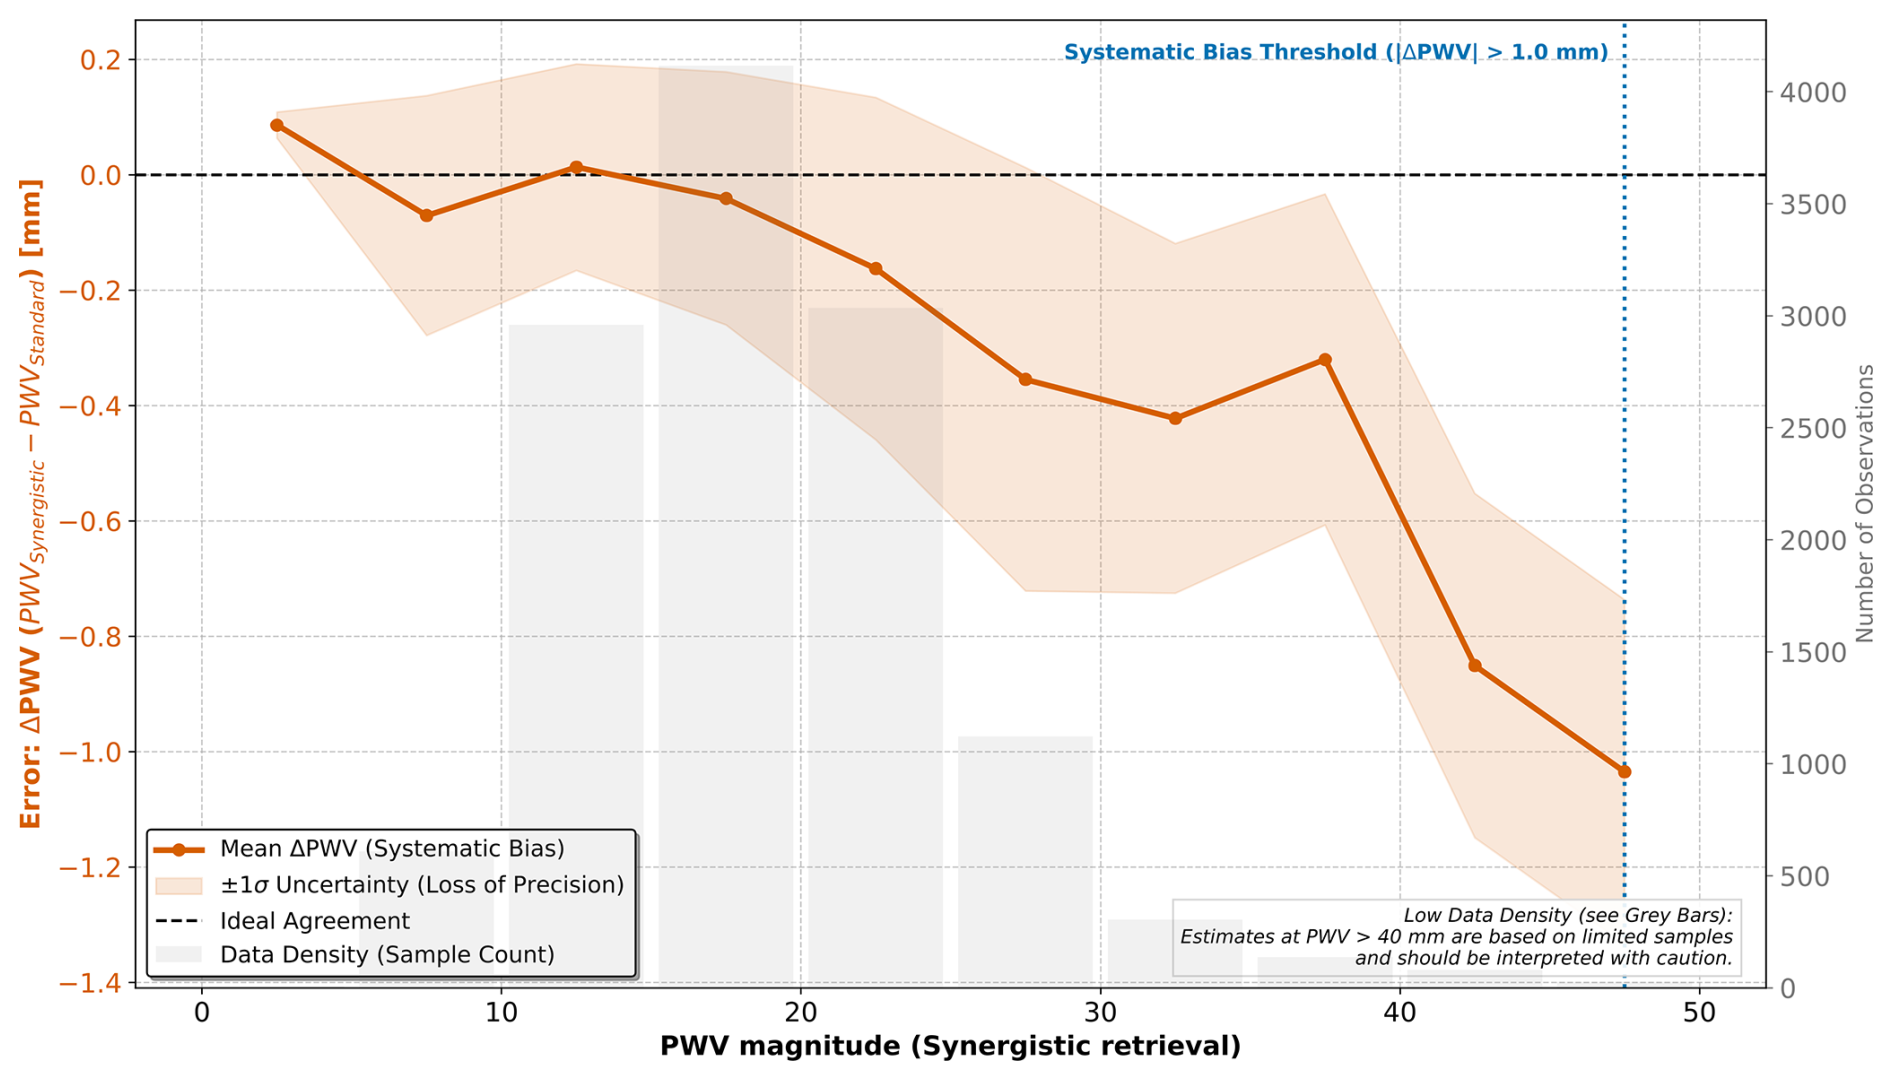
Figure 11Systematic breakdown and instability of the Standard GNSS model under extreme thermodynamic conditions.
The results of this study necessitate a fundamental re-evaluation of how Tm parameterization errors are parameterized in GNSS meteorology, particularly within thermodynamically complex, semi-arid coastal environments like the Eastern Mediterranean. The pronounced failure of the static HGPT2 model to capture the diurnal Tm cycle reveals a structural limitation inherent to empirical modeling. The observed “diurnal bias peak” effect is not merely a statistical anomaly; it represents a physical disconnect. Static empirical models rely heavily on Ts, effectively assuming that intense surface-level heating propagates uniformly through the atmospheric column. This assumption critically breaks down during the daytime in the EM, where the turbulent planetary boundary layer (PBL) aggressively decouples from the stable free troposphere. Evidence for this severe decoupling is explicitly documented in the high-vertical-resolution RS profiles collected during the campaign. Because the passive MWR struggles to effectively capture this sharp boundary – a direct result of the broad weighting functions and degraded vertical resolution inherent to its K-band observations – the instrument exhibits a “smoothing error” across the inversion layer. This structural limitation highlights exactly why applying a site-specific bias correction to the MWR's native output is a necessary prerequisite for precision GNSS meteorology. Furthermore, the failure of the reanalysis climatology to properly resolve the sharp moisture capping inversion during the onset of the daytime sea-breeze significantly corrupts the moisture-weighted Tm integral. Ground-based microwave radiometry overcomes this structural blindness by directly measuring the integrated thermal emissions of the column.
However, the performance of the MWR in this study highlights the duality of passive microwave remote sensing: it is highly proficient at retrieving integral quantities but degrades severely when resolving differential or gradient-based parameters. The successful reduction of the Tm RMSE via site-specific linear correction confirms that the MWR's K-band and V-band channels effectively capture the true thermal inertia of the troposphere. The initial systematic cold bias observed aloft is a known artifact of ill-posed neural network retrievals (Cimini et al., 2006; Löhnert and Maier, 2012). Because the vertical resolution of passive microwave observations degrades rapidly with height, the retrievals become heavily constrained by historical training datasets (the climatological prior), which often fail to capture localized, transition-season lapse rates in the free troposphere. Conversely, the complete failure of the MWR to derive a physically realistic water vapour scale height (Hv) exposes the “smoothing error” inherent to passive radiometry. Because the broad weighting functions of the K-band channels cannot resolve sharp boundary layer moisture inversions, the retrieval algorithm mathematically smears the moisture mass upward. This confirms that while MWR serves as a robust standard for total column mass, researchers must exercise extreme caution when utilizing its smoothed profiles to characterize vertical moisture compactness.
While this study relies on a single-site, multi-month dataset, the physical mechanisms identified have broad relevance beyond the Nicosia region. The Eastern Mediterranean serves as a highly representative climatic hotspot for semi-arid coastal environments experiencing enhanced warming and intensified hydrological cycles. It is important to note that the specific threshold of >45 mm identified here is characteristic of the climatological moisture capacity of the Eastern Mediterranean during extreme summer anomalies. While the exact numerical value of this “Systematic Bias Threshold” will vary geographically depending on local atmospheric dynamics and latitude, the underlying physical principle remains universal: empirical Tm models systematically degrade proportionally to the total atmospheric moisture mass during severe local extremes. The core vulnerability exposed in this research – that static global models are structurally blind to sharp boundary layer thermodynamic decoupling during peak insolation – is a fundamental physics problem, not a local anomaly. Therefore, the proposed synergistic MWR-GNSS retrieval architecture provides a universally applicable solution for mitigating systematic dry biases in any complex terrain or coastal environment globally. While the simple linear regression applied in this study proved highly effective at correcting systematic Tm biases for operational GNSS conversions, there remains room for algorithmic improvement. As the CYGMEN infrastructure accumulates a multi-year climatological database of high-resolution radiosonde profiles, future work should focus on complementary Neural Network (NN) training. By retraining the MWR retrieval algorithms using site-specific radiative transfer modeling rather than relying on the manufacturer's regional historical priors, the native temperature and humidity profiles can be further optimized at the retrieval level.
Finally, our component-wise uncertainty analysis clarifies the error propagation chain in the GNSS-PWV conversion process, shifting the paradigm of where optimization efforts should be focused. Historically, significant effort within the geodetic community has been expended on refining atmospheric refractivity constants. However, we demonstrate that the error induced by transitioning from the historical Davis et al. (1985) formulations to the modern Rüeger (2002) constants is practically negligible (<0.2 mm) for synoptic meteorological applications. The true “weak link” in the retrieval chain is unequivocally the thermodynamic parameterization, which introduces errors an order of magnitude larger.
This study demonstrated that the accuracy of GNSS-derived Precipitable Water Vapour (PWV) in the Eastern Mediterranean region, is significantly affected by the thermodynamic rigidity of static climatological models. By implementing a synergistic retrieval strategy that couples GNSS delays with real-time ground-based microwave radiometry (MWR), we successfully quantified and mitigated these limitations. The investigation yielded three primary methodological conclusions. First, we established that standard empirical models (e.g., HGPT2) are structurally incapable of resolving the diurnal thermodynamic decoupling between the boundary layer and free troposphere. This deficiency leads to severe systematic errors (the “diurnal bias peak” effect) exceeding 6 K in weighted mean temperature (Tm) during peak solar insolation, which directly propagates into a PWV bias>1.0 mm during extreme hygrometric events. Second, the MWR proved to be a superior source for Tm parameterization errors, provided that site-specific calibration is applied. The development of a linear bias correction scheme reduced the MWR Tm root-mean-square error from 2.32–1.43 K. This correction substantially reduces the conversion-related uncertainty in the GNSS water vapour product compared to standard climatological approaches. Third, the component-wise sensitivity analysis confirmed that thermodynamic parameterization is a highly significant source of uncertainty that exacerbates existing geodetic ZTD errors, outweighing uncertainties in refractive index constants by an order of magnitude. Consequently, the proposed combined retrieval represents a highly valuable architectural upgrade for monitoring severe weather in complex coastal environments like the Eastern Mediterranean. However, it must be acknowledged that there are many sites worldwide where the deployment of microwave radiometers may not be justified. Given the high capital and operational costs of radiometric hardware, the presence of other unmitigated geodetic uncertainties, and the adequate performance of static Tm models in less thermodynamically complex regions, this synergistic approach is best reserved for targeted deployments in highly vulnerable climatic hotspots.
For the climate-sensitive Eastern Mediterranean region, relying on static models for GNSS processing risks systematically masking moisture trends during heatwaves and deep convection. We therefore recommend the operational integration of collocated MWR observations into national GNSS processing chains. Where collocation is not feasible, future work should focus on assimilating MWR-derived diurnal shape functions into static models to bridge the gap between climatology and reality. This study establishes the “Corrected Synergistic Method” as a robust benchmark for generation of climate-quality water vapour datasets in complex thermodynamic environments. From an operational perspective, relying exclusively on MWRs for regional moisture monitoring is constrained by high capital costs, maintenance complexity, and signal degradation during precipitation events. Conversely, GNSS networks provide highly cost-effective, dense, and all-weather monitoring capabilities. The primary operational interest of this proposed methodology is the “supersite” calibration strategy: utilizing a centralized MWR to capture the true, real-time thermodynamic diurnal variations that static models like HGPT2 miss, and subsequently assimilating these dynamic Tm corrections over a much wider, regional network of standard GNSS receivers. This synergy allows forecasting centers to leverage the superior thermodynamic accuracy of a single MWR to drastically improve the high-resolution, continuous PWV datasets generated by dense, low-cost GNSS infrastructure.
The GNSS Zenith Total Delay estimates, the Microwave Radiometer (MWR) brightness temperatures, and the retrieved profiles collected under the CYGMEN project, along with the custom processing scripts used for the linear bias correction, are available by contacting Dr. Christina Oikonomou (CYGMEN Project Coordinator). The high-resolution radiosonde profiles provided by the Department of Meteorology (DoM), Cyprus, are under restricted access due to third-party data policies and can be requested by contacting the department through their official website. The Tefnut PP software used for GNSS processing is available at https://gnutsoftware.com/software/tefnut (last access date: 15 May 2026). The ERA5 reanalysis data can be obtained from the Copernicus Climate Change Service (C3S) Climate Data Store at https://doi.org/10.24381/cds.bd0915c6 (Copernicus Climate Change Service, Climate Data Store, 2023).
ANP carried out the GNSS, MWR, and Radiosonde data processing, performed the synergistic PWV retrievals and error diagnosis, and wrote the initial version of the paper. CO and HH conceptualized the study, acquired the funding and resources for the CYGMEN infrastructure, and supervised the investigation. All authors discussed the results, edited, and proofread the paper.
The contact author has declared that none of the authors has any competing interests.
Publisher's note: Copernicus Publications remains neutral with regard to jurisdictional claims made in the text, published maps, institutional affiliations, or any other geographical representation in this paper. The authors bear the ultimate responsibility for providing appropriate place names. Views expressed in the text are those of the authors and do not necessarily reflect the views of the publisher.
We would like to express our sincere gratitude to the Cyprus Department of Meteorology (DoM) and in particular to Physicist and Meteorology Officer Demetris Charalambous, for his invaluable guidance and for providing access to essential resources at Athalassa observatory in Nicosia, Cyprus.
The present study is funded by the Strategic Infrastructure project CYGMEN, which is implemented in the frames of Cohesion Policy Programme “THALIA 2021-2027” and is co-funded by the European Union.
This paper was edited by Roeland Van Malderen and reviewed by three anonymous referees.
Askne, J. and Nordius, H.: Estimation of tropospheric delay for microwaves from surface weather data, Radio Sci., 22, 379–386, https://doi.org/10.1029/RS022i003p00379, 1987.
Bennartz, R. and Bauer, P.: Sensitivity of microwave radiances at 85–183 GHz to precipitating ice particles, Radio Sci., 38, 8075, https://doi.org/10.1029/2002RS002626, 2003.
Bennitt, G. V. and Jupp, A.: Operational assimilation of GPS zenith total delay observations into the Met Office numerical weather prediction models, Mon. Weather Rev., 140, 2706–2719, https://doi.org/10.1175/MWR-D-11-00156.1, 2012.
Bevis, M., Businger, S., Herring, T. A., Rocken, C., Anthes, R. A., and Ware, R. H.: GPS meteorology: Remote sensing of atmospheric water vapor using the Global Positioning System, J. Geophys. Res., 97, 15787–15801, https://doi.org/10.1029/92JD01517, 1992.
Bevis, M., Businger, S., Chiswell, S., Herring, T. A., Anthes, R. A., Rocken, C., and Ware, R. H.: GPS meteorology: Mapping zenith wet delays onto precipitable water, J. Appl. Meteorol., 33, 379–386, https://doi.org/10.1175/1520-0450(1994)033<0379:GMMZWD>2.0.CO;2, 1994.
Böhm, J., Möller, G., Schindelegger, M., Pain, G., and Weber, R.: Development of an improved empirical model for slant delays in the troposphere (GPT2w), GPS Solut., 19, 433–441, https://doi.org/10.1007/s10291-014-0403-7, 2015.
Bolton, D.: The computation of equivalent potential temperature, Mon. Weather Rev., 108, 1046–1053, https://doi.org/10.1175/1520-0493(1980)108<1046:TCOEPT>2.0.CO;2 1980.
Brenot, H., Neméghaire, J., Delobbe, L., Clerbaux, N., De Meutter, P., Deckmyn, A., Delcloo, A., Frappez, L., and Van Roozendael, M.: Preliminary signs of the initiation of deep convection by GNSS, Atmos. Chem. Phys., 13, 5425–5449, https://doi.org/10.5194/acp-13-5425-2013, 2013.
Bock, O., Bosser, P., Flamant, C., Doerflinger, E., Jansen, F., Fages, R., Bony, S., and Schnitt, S.: Integrated water vapour observations in the Caribbean arc from a network of ground-based GNSS receivers during EUREC4A, Earth Syst. Sci. Data, 13, 2407–2436, https://doi.org/10.5194/essd-13-2407-2021, 2021.
Cimini, D., Hewison, T. J., Martin, L., Güldner, J., Gaffard, C., and Marzano, F. S.: Temperature and humidity profile retrievals from ground-based microwave radiometers during TUC, Meteorol. Z., 15, 45–56, 2006.
Cimini, D., Westwater, E. R., Gasiewski, A. J., Klein, M., Leuski, V. Y., and Dowlatshahi, S.: Thermodynamic atmospheric profiling during the 2010 Winter Olympics using ground-based microwave radiometry, IEEE T. Geosci. Remote, 49, 4959–4969, https://doi.org/10.1109/TGRS.2011.2154337, 2011.
Copernicus Climate Change Service, Climate Data Store (2023): ERA5 hourly data on pressure levels from 1940 to present, Copernicus Climate Change Service (C3S) Climate Data Store (CDS) [data set], https://doi.org/10.24381/cds.bd0915c6, 2023.
Crewell, S. and Löhnert, U.: Accuracy of boundary layer temperature profiles retrieved with multifrequency multiangle microwave radiometry, IEEE T. Geosci. Remote, 45, 2195–2201, https://doi.org/10.1109/TGRS.2006.888434, 2007.
Douša, J. and Václavovic, P.: Real-time zenith tropospheric delays in support of numerical weather prediction applications, Adv. Space Res., 53, 1347–1358, https://doi.org/10.1016/j.asr.2014.02.021, 2014.
Davis, J. L., Herring, T. A., Shapiro, I. I., Rogers, A. E. E., and Elgered, G.: Geodesy by radio interferometry: Effects of atmospheric modeling errors on estimates of baseline length, Radio Sci., 20, 1593–1607, https://doi.org/10.1029/RS020i006p01593, 1985.
Foth, A., Lochmann, M., Saavedra Garfias, P., and Kalesse-Los, H.: Determination of low-level temperature profiles from microwave radiometer observations during rain, Atmos. Meas. Tech., 17, 7169–7181, https://doi.org/10.5194/amt-17-7169-2024, 2024.
Giannadaki, D., Oikonomou, C., Haralambous, H., Tymvios, F., and Loizou, E.: Validation of precipitable water vapour products using CyMETEO GNSS network in Cyprus, in: Eleventh International Conference on Remote Sensing and Geoinformation of the Environment (RSCy2025), vol. 13816, 397–409, SPIE, https://doi.org/10.1117/12.3073174, 2025.
Giorgi, F.: Climate change hot-spots, Geophys. Res. Lett., 33, L08707, https://doi.org/10.1029/2006GL025734, 2006.
Guerova, G., Jones, J., Douša, J., Dick, G., de Haan, S., Pottiaux, E., Bock, O., Pacione, R., Elgered, G., Vedel, H., and Bender, M.: Review of the state of the art and future prospects of the ground-based GNSS meteorology in Europe, Atmos. Meas. Tech., 9, 5385–5406, https://doi.org/10.5194/amt-9-5385-2016, 2016.
Held, I. M. and Soden, B. J.: Robust responses of the hydrological cycle to global warming, J. Climate, 19, 5686–5699, https://doi.org/10.1175/JCLI3990.1, 2006.
Healy, S. B.: Refractivity coefficients used in the assimilation of GPS radio occultation measurements, J. Geophys. Res.-Atmos., 116, https://doi.org/10.1029/2010JD014013, 2011.
Jiang, P., Ye, S., Lu, Y., Liu, Y., Chen, D., and Wu, Y.: Development of time-varying global gridded Ts−Tm model for precise GPS–PWV retrieval, Atmos. Meas. Tech., 12, 1233–1249, https://doi.org/10.5194/amt-12-1233-2019, 2019.
Jones, J., Guerova, G., Douša, J., Dick, G., de Haan, S., Pottiaux, E., Bock, O., Pacione, R., Elgered, G., Vedel, H., and Bender, M.: Advanced GNSS Tropospheric Products for Monitoring Severe Weather Events and Climate, Springer, Cham, https://doi.org/10.1007/978-3-030-13901-8, 2020.
Kiehl, J. T. and Trenberth, K. E.: Earth's annual global mean energy budget, B. Am. Meteorol. Soc., 78, 197–208, https://doi.org/10.1175/1520-0477(1997)078<0197:EAGMEB>2.0.CO;2, 1997.
Lan, Z., Zhang, B., and Geng, T.: Establishment and analysis of global gridded Tm-Ts relationship model, Geodesy and Geodynamics, 7, 101–107, https://doi.org/10.1016/j.geog.2016.02.001, 2016.
Lelieveld, J., Hadjinicolaou, P., Kostopoulou, E., Chenoweth, J., El Maayar, M., Giannakopoulos, C., Hannides, C., Lange, M. A., Tanarhte, M., Tyrlis, E., and Xoplaki, E.: Climate change and impacts in the Eastern Mediterranean and the Middle East, Climatic Change, 114, 667–687, https://doi.org/10.1007/s10584-012-0418-4, 2012.
Li, H., Wang, X., Wu, S., Zhang, K., Chen, X., Qiu, C., Zhang, Q., and Li, L.: Development of an improved model for prediction of short-term heavy precipitation based on GNSS-derived PWV, Remote Sens.-Basel, 12, 4101, https://doi.org/10.3390/rs12244101, 2020.
Löhnert, U. and Maier, O.: Operational profiling of temperature using ground-based microwave radiometry at Payerne: prospects and challenges, Atmos. Meas. Tech., 5, 1121–1134, https://doi.org/10.5194/amt-5-1121-2012, 2012.
Mateus, P., Mendes, V. B., and Plecha, S. M.: HGPT2: an ERA5-based global model to estimate relative humidity, Remote Sens.-Basel, 13, 2179, https://doi.org/10.3390/rs13112179, 2021.
Tirpitz, J.-L., Frieß, U., Hendrick, F., Alberti, C., Allaart, M., Apituley, A., Bais, A., Beirle, S., Berkhout, S., Bognar, K., Bösch, T., Bruchkouski, I., Cede, A., Chan, K. L., den Hoed, M., Donner, S., Drosoglou, T., Fayt, C., Friedrich, M. M., Frumau, A., Gast, L., Gielen, C., Gomez-Martín, L., Hao, N., Hensen, A., Henzing, B., Hermans, C., Jin, J., Kreher, K., Kuhn, J., Lampel, J., Li, A., Liu, C., Liu, H., Ma, J., Merlaud, A., Peters, E., Pinardi, G., Piters, A., Platt, U., Puentedura, O., Richter, A., Schmitt, S., Spinei, E., Stein Zweers, D., Strong, K., Swart, D., Tack, F., Tiefengraber, M., van der Hoff, R., van Roozendael, M., Vlemmix, T., Vonk, J., Wagner, T., Wang, Y., Wang, Z., Wenig, M., Wiegner, M., Wittrock, F., Xie, P., Xing, C., Xu, J., Yela, M., Zhang, C., and Zhao, X.: Intercomparison of MAX-DOAS vertical profile retrieval algorithms: studies on field data from the CINDI-2 campaign, Atmos. Meas. Tech., 14, 1–35, https://doi.org/10.5194/amt-14-1-2021, 2021.
Ning, T., Wang, J., Elgered, G., Dick, G., Wickert, J., Bradke, M., Sommer, M., Querel, R., and Smale, D.: The uncertainty of the atmospheric integrated water vapour estimated from GNSS observations, Atmos. Meas. Tech., 9, 79–92, https://doi.org/10.5194/amt-9-79-2016, 2016.
Pakkattil, A., Parde, A. N., Wagh, S., Lonkar, P., and Ghude, S. D.: Wintertime Intercomparison of Specific Humidity and Temperature Profiles Measured by Microwave Radiometer (MWR), Radiosonde, and INSAT-3DR Sounder Over Delhi, India, J. Geophys. Res.-Atmos., 130, e2025JD044462, https://doi.org/10.1029/2025JD044462, 2025.
Parde, A. N., Ghude, S. D., Prasad, V. S., Hari Prasad, K. B. R. R., Dhangar, N. G., Lonkar, P., and Rajeevan, M.: Influence of ground-based microwave radiometer profile assimilation on fog genesis forecasts in the winter boundary layer of Northern India, J. Geophys. Res.-Atmos., 130, e2024JD042224, https://doi.org/10.1029/2024JD042224, 2025.
Oikonomou, C., Tymvios, F., Pikridas, C., Bitharis, S., Balidakis, K., Michaelides, S., Haralambous, H., and Charalambous, D.: Tropospheric delay performance for GNSS integrated water vapor estimation by using GPT2w model, ECMWF's IFS operational model and in situ meteorological data, Adv. Geosci., 45, 363–375, https://doi.org/10.5194/adgeo-45-363-2018, 2018.
Rüeger, J. M.: Refractive index formulae for radio waves. In Proceedings of the FIG XXII International Congress, Washington, D.C., USA, 19–26 April, 2002.
Saastamoinen, J.: Atmospheric correction for the troposphere and stratosphere in radio ranging satellites, in: The Use of Artificial Satellites for Geodesy, Geophys. Monogr. Ser., 15, 247–251, AGU, Washington, D. C., https://doi.org/10.1029/GM015p0247, 1972.
Soden, B. J. and Lanzante, J. R.: An assessment of satellite and radiosonde climatologies of upper-tropospheric water vapor, J. Climate, 9, 1235–1250, https://doi.org/10.1175/1520-0442(1996)009<1235:AAOSAR>2.0.CO;2, 1996.
Steinke, S., Eikenberg, S., Löhnert, U., Dick, G., Klocke, D., Di Girolamo, P., and Crewell, S.: Assessment of small-scale integrated water vapour variability during HOPE, Atmos. Chem. Phys., 15, 2675–2692, https://doi.org/10.5194/acp-15-2675-2015, 2015.
Thayer, G. D.: An improved equation for the radio refractive index of air, Radio Sci., 9, 803–807, https://doi.org/10.1029/RS009i010p00803, 1974.
Trenberth, K. E., Fasullo, J., and Smith, L.: Trends and variability in column-integrated atmospheric water vapor, Clim. Dynam., 24, 741–758, https://doi.org/10.1007/s00382-005-0017-4, 2005.
Van Baelen, J., Aubagnac, J. P., and Dabas, A.: Comparison of near–real time estimates of integrated water vapor derived with GPS, radiosondes, and microwave radiometer, J. Atmos. Ocean. Tech., 22, 201–210, 2005.
Van Malderen, R., Brenot, H., Pottiaux, E., Beirle, S., Hermans, C., De Mazière, M., Wagner, T., De Backer, H., and Bruyninx, C.: A multi-site intercomparison of integrated water vapour observations for climate change analysis, Atmos. Meas. Tech., 7, 2487–2512, https://doi.org/10.5194/amt-7-2487-2014, 2014.
Van Malderen, R., Pottiaux, E., Stankunavicius, G., Beirle, S., Wagner, T., Brenot, H., Bruyninx, C., and Jones, J.: Global spatiotemporal variability of integrated water vapor derived from GPS, GOME/SCIAMACHY and ERA-Interim: Annual cycle, frequency distribution and linear trends, Remote Sens.-Basel, 14, 1050, https://doi.org/10.3390/rs14041050, 2022.
Vaquero-Martinez, J., Anton, M., de Galisteo, J. P. O., Cachorro, V. E., Álvarez-Zapatero, P., Román, R., Loyola, D., Costa, M. J., Wang, H., Abad, G. G., and Noel, S.: Inter-comparison of integrated water vapor from satellite instruments using reference GPS data at the Iberian Peninsula, Remote Sens. Environ., 204, 729–740, https://doi.org/10.1016/j.rse.2017.09.028, 2018.
Wang, J., Zhang, L., and Dai, A.: Global estimates of water-vapor-weighted mean temperature of the atmosphere for GPS applications, J. Geophys. Res.-Atmos., 110, D21, https://doi.org/10.1029/2005JD006215, 2005.
Ware, R., Cimini, D., Herzegh, P., Marzano, F., Vivekanandan, J., and Westwater, E.: Ground-based microwave radiometer measurements during precipitation, in: 8th Specialist Meeting on Microwave Radiometry, 24–27 February 2004, Rome, Italy, 2004.
Yao, Y., Zhang, B., Yue, S., Xu, C., and Peng, W.: Analysis of the global Tm-Ts correlation and establishment of the latitude-related linear model, Chinese Sci. Bull., 59, 2340–2347, https://doi.org/10.1007/s11434-014-0275-9, 2014.
Ziskin Ziv, S., Yair, Y., Alpert, P., Uzan, L., and Reuveni, Y.: The diurnal variability of precipitable water vapor derived from GPS tropospheric path delays over the Eastern Mediterranean, Atmos. Res., 249, 105307, https://doi.org/10.1016/j.atmosres.2020.105307, 2021a.
Ziskin Ziv, S., Alpert, P., and Reuveni, Y.: Long-term variability and trends of precipitable water vapour derived from GPS tropospheric path delays over the Eastern Mediterranean, Int. J. Climatol., 41, 6433–6454, https://doi.org/10.1002/joc.7205, 2021b.
Zittis, G., Hadjinicolaou, P., Klangidou, M., Proestos, Y., and Lelieveld, J.: A multi-model, multi-scenario, and multi-domain analysis of regional climate projections for the Mediterranean, Reg. Environ. Change, 19, 2621–2635, https://doi.org/10.1007/s10113-019-01565-w, 2019.