
the Creative Commons Attribution 4.0 License.
the Creative Commons Attribution 4.0 License.
 | 09 Jul 2026
Emissions from fuel combustion by stoves in residential kitchens in São Paulo – Brazil
Tailine Corrêa dos Santos
Elaine Cristina Araujo
Thaís Andrade da Silva
Enrico Valente Freire
Eduardo Landulfo
Maria de Fátima Andrade
This study investigates greenhouse gas (GHG) emissions and indoor air quality associated with residential cooking practices in São Paulo, Brazil. Measurements were conducted in 30 households, focusing on kitchens using natural gas (NG) or liquefied petroleum gas (LPG) stoves. A measurement protocol was developed to assess emissions of carbon dioxide (CO2), methane (CH4), and nitrogen oxides (NOx) under different operational conditions. Emission rates and factors were calculated using mass balance approaches, considering kitchen volume, air exchange rates, and gas concentrations. The results show different behavior for the type of fuel, especially for methane, which has a significant response to the use of NG, unlike LPG. It was also possible to observe a difference between the temporal variability cycles, as the burners responded quickly to the increase in concentration, while the oven showed a delayed increase observed in the environment. There was a high variability in the concentrations in the different residences, which may be associated with factors such as the age of the stove, model, leak and internal influence. The emission factors obtained were three times higher than the IPCC considering only the consistent values, but when considering the outliers it is up to 10 times higher for CH4 in the case of NG. For CO2 the factor obtained was lower than the IPCC. The findings highlight the importance of considering fuel type in evaluating GHG emissions from residential cooking and the need for robust data on residential emissions in Brazil.
- Article
(3376 KB) - Full-text XML
-
Supplement
(711 KB) - BibTeX
- EndNote


Carbon dioxide (CO2), methane (CH4), and nitrogen oxides (NOx) are emitted during fossil fuel combustion, material production (e.g., steel, cement, plastics), and food cultivation. CO2 and CH4 are major greenhouse gases, significantly contributing to global warming (IPCC, 2022b). NO2 primarily affects health and is a key precursor of tropospheric ozone (IPCC, 2022a; WHO, 2021). Additionally, these gases impact the atmospheric radiation budget (IPCC, 2022a).
Indoor ambients, such as kitchen, can have their air quality significantly affected by concentrations of compounds such as NO2, CO2 and CH4. These gases can have different impacts on human health depending on their concentration, the time of exposure, and on climate conditions. NO2, a pollutant known for its health effects, can cause irritation to the lungs, eyes and throat in high concentrations during short-term exposure, while respiratory effects can be severe in the long term (WHO, 2021). CO2 and CH4, although not strongly associated with health risks, can cause fatigue and possible mental confusion in confined environments and in high concentrations (OSHA, 2021; NIOSH, 2022). In the case of CH4, in cases of cumulative risk, there is also an explosive risk (NIOSH, 2022).
According to the World Meteorological Organization (WMO) Greenhouse Gas Bulletin (No. 20 – 28 October 2024), the global average CO2 concentration increased from 417.9 ppm in 2022, to 420.0 ppm in 2023. Methane (CH4) levels also exhibited a significant increase, going from 1923 to 1934 ppb, between 2022 and 2023 (WMO, 2024). The WMO reports that this persistent increase reflects the ongoing impact of human activities. Anthropogenic sources contribute approximately 4.7 billion t of CO2 annually (WMO, 2024).
As a signatory of the United Nations Framework Convention on Climate Change (UNFCCC), Brazil is comitted to submitting its National Inventories of Greenhouse Gas (GHG) Emissions. In its most recent National Inventory published in 2020 with base year up to 2016, Brazil has been committed to the implementation of the “2006 IPCC Guidelines for National Inventories of Greenhouse Gas Emissions”, being organized into five sectors: Energy; Industrial Processes And Use Of Products (IPPU); Agricultural; Land Use, Land Use Change And Forests (LULUCF) and Waste. However, Brazil reports Agriculture and LULUCF separately due to their significant impact on the country's emissions, whereas the IPCC groups them under the Agriculture, Forestry, and Other Land Use (AFOLU) sector (MCTI, 2020; IPCC, 2019).
The latest National Inventory contemplated in the Fourth National Communication presents the GHG emissions of Brazil from 1990 to 2016. In 2016, Brazil's emissions totaled 1467 Tg CO2e, with CO2 being the most emitted GHG. The Agriculture sector contributed 33.2 % of total emissions, the Energy sector 28.9 % and the LULUCF sector with 27.1 %. IPPU and Waste contributed smaller portions of emissions, representing 6.4 % and 4.5 %, respectively (MCTI, 2020).
In 2016, the state of São Paulo's energy sector was responsible for 59 % of GHG emissions, around 90 Mt CO2e. These emissions are mainly fed by transport (vehicular emissions) – National Inventory of Greenhouse Gas Emissions, Brazil, 2022 (SEEG, 2024). The city of São Paulo follows in the same direction as the state of São Paulo, with the largest emissions from the energy sector, 11 Mt CO2e in 2023. In this sector, the biggest emitter in the city is transport, followed by air and residential sectors (classified as IPCC Category 1A4b in the national inventory) (SEEG, 2024).
According to SEEG (2024) estimates, 2296 Mt of CO2e were emitted in 2023, distributed as follows: Deforestation (46 %), Agriculture (28 %), Power Generation (18 %), Waste (4 %) and Industrial Processes (4 %). Analyzing only the energy sector, we have the following breakdown: Transport (53.3 %), Industry (16.2 %), Fuel Production (13.2 %), Residential (6.4 %) and Others (11.2 %). The impact of the residential sector on greenhouse gas emissions is approximately 1.2 %.
The information in the Brazilian Energy Balance summary report for 2020 highlights the diverse sources of energy consumption in residential settings across the country, emphasizing the dominance of electricity at 46 %, throughout the entirety of the household premises. However, the reliance on other fuels like firewood (26.6 %), Liquefied Petroleum Gas (LPG) (24.4 %) and Natural Gas (NG) at 1.5 % varies significantly by region (EPE, 2020).
In the Southern Region, colder climates and traditional practices lead to higher firewood usage, while the North and Northeast Regions show a tendency towards solid fuels due to economic constraints. LPG, although accounting for a smaller percentage of total energy consumption, plays a crucial role, especially as the primary cooking fuel with over 70 % of its use in households. This demonstrates how regional characteristics and economic factors shape energy preferences in Brazilian households (Gioda, 2019).
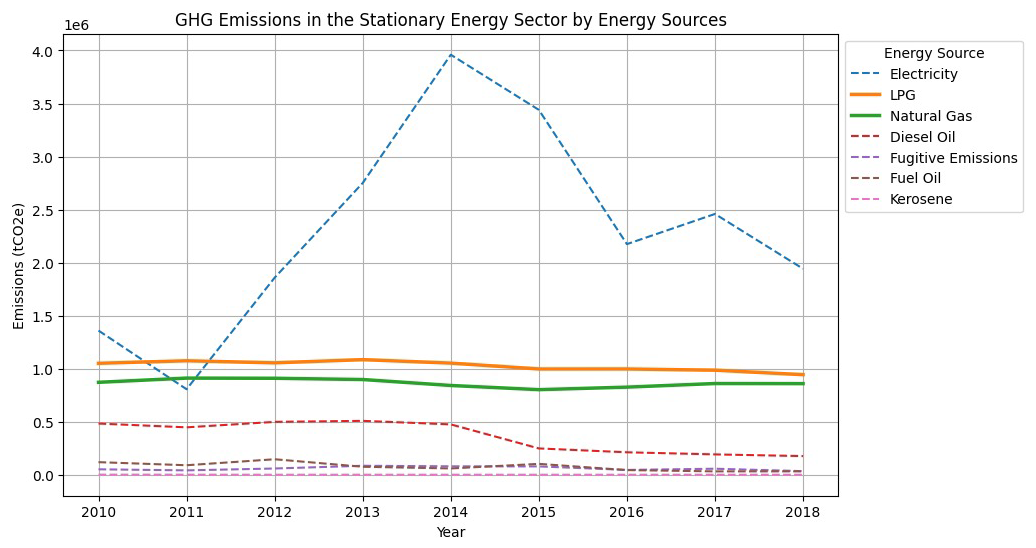
The Anthropogenic Emissions and Removals of Greenhouse Gases Inventory in the São Paulo Municipality presented GHG emissions, between 2010 and 2018, from stationary energy sources, including electricity, LPG, natural gas, diesel oil, fugitive emissions, fuel oil, and kerosene (SVMA, 2022). Figure 1 shows electricity emerging as the dominant source, with a notable spike in 2014, due to increased reliance on thermal power plants during a drought, significantly impacting residential emissions. LPG and natural gas show stable trends, reflecting their consistent use in cooking and heating, particularly in the residential sector. Diesel oil, fuel oil, and kerosene contribute minimally but remain relevant for specific applications in rural or less urbanized areas. Fugitive emissions, primarily from natural gas distribution, add a steady but smaller share. The residential sector is a significant contributor to these emissions, driven by its reliance on electricity, LPG, and natural gas (SVMA, 2022).
Studies, including the one conducted by Cameron et al. (2016) using the MESSAGE-Access model, emphasize the benefits of induction stoves. These stoves are not only efficient in reducing GHG emissions, but also improve health outcomes by minimizing indoor air pollution. However, they emphasize that this transition depends on reliable electricity and adequate infrastructure, especially in developing regions where energy systems are still evolving (Cameron et al., 2016).
Lebel et al. (2022) estimated total emissions of 28 Gg CH4 yr−1 (28 000 t) from residential sources in the United States, which exceeds the estimates provided by the U.S. EPA. Their detailed breakdown revealed that burners emit 2.7 Gg CH4 yr−1 (2700 t) during steady-state-on conditions and 1.1 Gg CH4 yr−1 (1100 t) from on/off pulses, while 21.2 Gg CH4 yr−1 (21 200 t) is attributed to steady-state-off emissions from stoves, indicating substantial leakage even when appliances are not in active use (Lebel et al., 2022). Complementary findings by Merrin and Francisco (2019) estimated 2.7 Gg CH4 yr−1 (2700 t) from burner use, aligning closely with Lebel et al. (2022), but also reported emissions of 3.3 Gg CH4 yr−1 from stoves (3300 t) and 5.0 Gg CH4 yr−1 from ovens (5000 t), suggesting that multiple components of cooking systems contribute significantly to overall methane release (Merrin and Francisco, 2019). Similarly, Fischer et al. (2018) identified 1.6 Gg CH4 yr−1 (1600 t) from general cooking equipment in California alone, reinforcing the relevance of regional assessments (Fischer et al., 2018).
Globally, the residential sector contributes less to GHG emissions than larger sectors such as transport and industry, but it is important to understand its influence on these emissions to address the challenges related to climate change and health (IPCC, 2022a; WRI, 2024).
The objective of this research is to gather data on cooking fuel usage in Brazilian kitchens, focusing on the two most commonly used sources: liquefied petroleum gas and natural gas. The study seeks to evaluate the emissions of CO2, CH4, and NOx, resulting from the use of gas stoves in urban areas, and to analyze the associated indoor air quality, expanding the analysis of data on indoor concentrations and emissions, which is limited.
2.1 Denifition of sample object components
Measurements were carried out in the kitchens of Brazilian homes, more specifically in the city of São Paulo. This study focused on different types of stoves and specifically analyzed natural gas or LPG-powered stoves, most of which have 2 to 6 individual cooking elements (burners). These burners were the main objects of analysis due to their direct impact on energy consumption and emissions associated with their use.
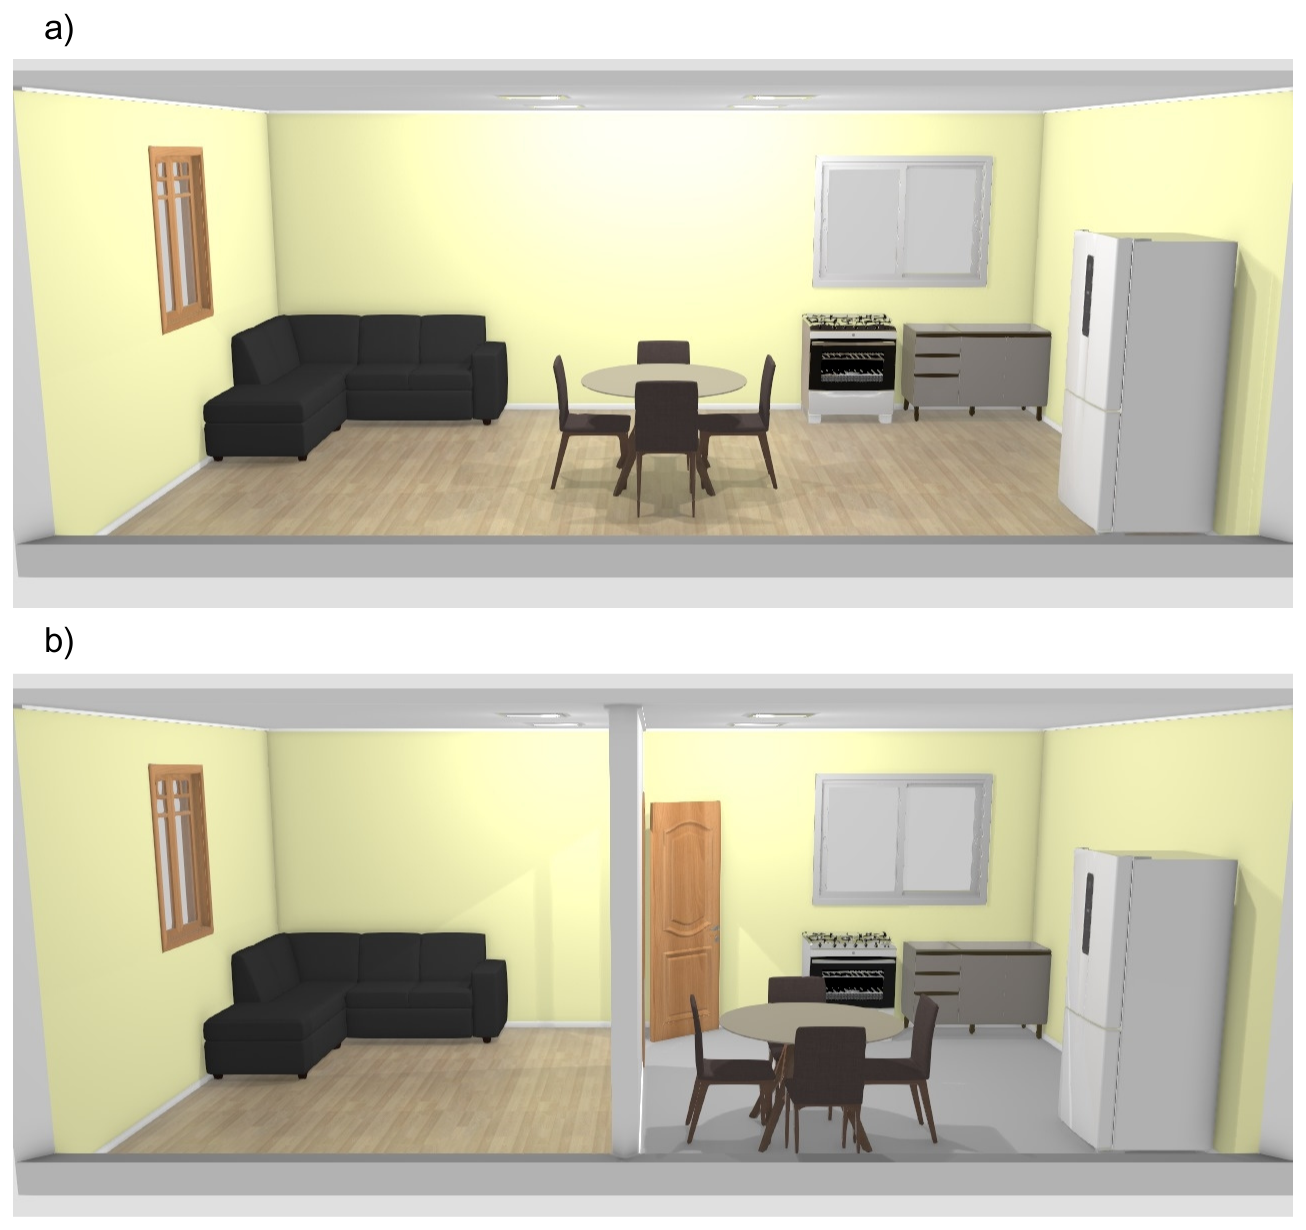
Figure 2Kitchen layout concepts. (a) Open concept kitchen design. (b) Closed concept kitchen design. Source: figure created by the author using Mooble Planner (https://planner.mooble.com/, last access: 5 February 2025).
In addition, two types of kitchens were evaluated during the sampling process: open and closed concepts. Open concept kitchens are integrated with other areas of the house, such as living or dining rooms, without physical partitions between spaces (Fig. 2a); in this case, it was necessary to put a plastic seal. In contrast, closed concept kitchens are entirely separated from other areas by walls and doors, providing a more enclosed environment (Fig. 2b).
2.2 Region of study and distribution of residence
The city of São Paulo is known as the most populous city in Brazil, according to the 2022 census, the population of São Paulo is 11 451 999 people, and adding with the cities of the metropolitan region of São Paulo comes to around 20 million inhabitants (IBGE, 2025). Most of the volunteer residences for the study were located in the city of São Paulo, with additional samples from neighboring cities in the metropolitan region, as shown in the map of participant residences (Fig. 3). The volunteers gave their consent, authorizing the gas measurements, circulation within the monitored environment, and the sharing of the results obtained in this study, by signing a consent form. The map highlights the Metropolitan Area of São Paulo (MASP), with the city of São Paulo marked in red. The triangles represent the distribution of volunteer residences, indicating that most data collection occurred within the city of São Paulo.
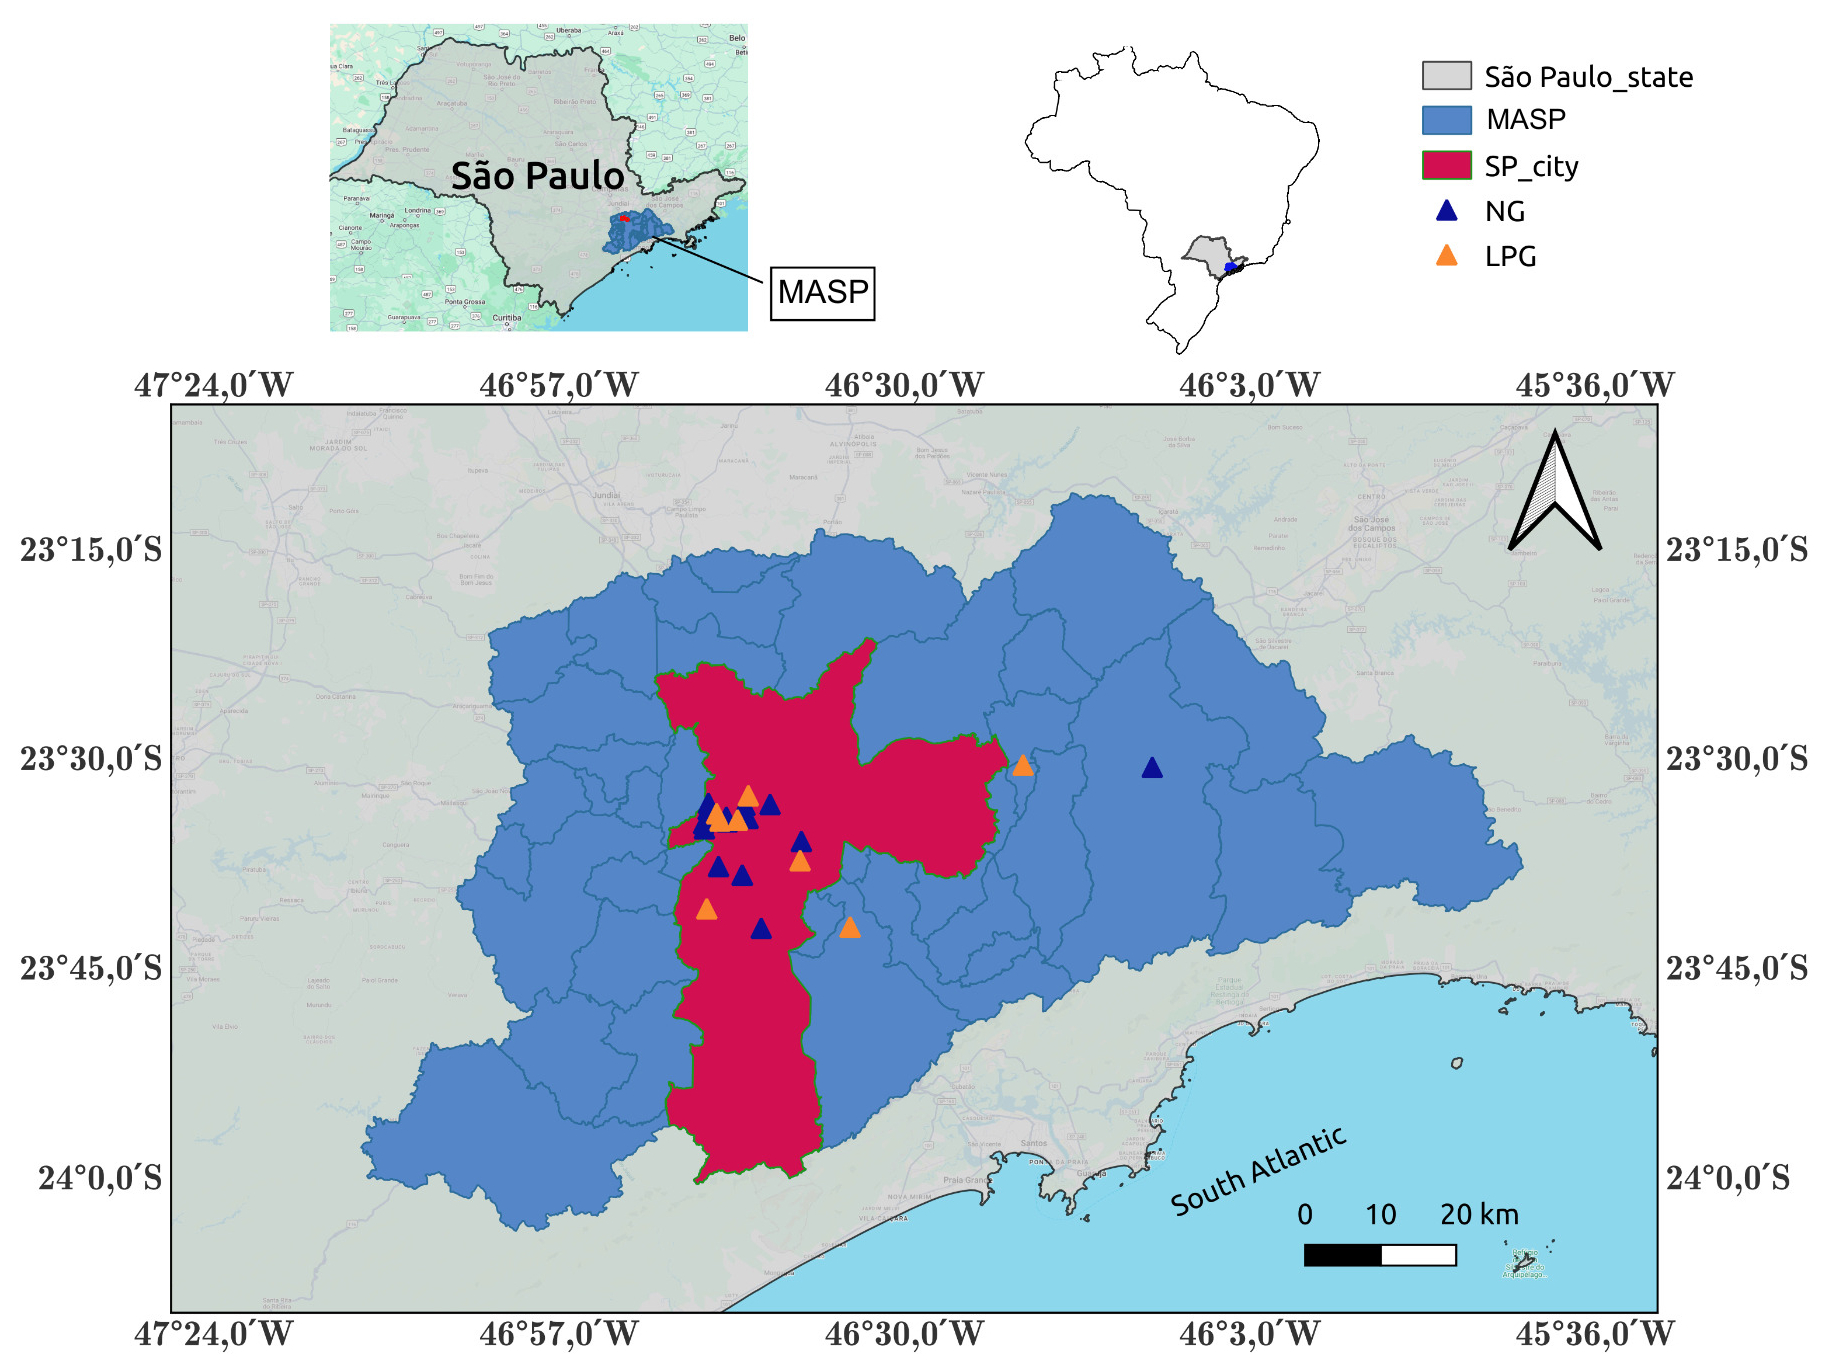
Figure 3Map of São Paulo state highlighting São Paulo city (SP_city in pink) and the spatial distribution of residences. Source: Map generated in QGIS 3.22 – QGIS Geographic Information System with shapefile São Paulo City from the Brazilian Institute of Geography and Statistics (IBGE) by the authors.
The participating residences included apartments and houses, reflecting the variety of housing in São Paulo. 60 % of the samples were collected in apartments, while 40 % were in houses, which usually had larger kitchens. Approximately 67 % of the kitchens were closed concept, while 33 % were open concept, requiring sealing with plastic, and the samples of cooking fuels were from Natural Gas (NG), approximately 67 % and Liquefied Petroleum Gas (LPG) was approximately 33 %.
2.3 Measurement protocol
Measurement Protocol for Evaluating Greenhouse Gas (GHG) Emissions in Brazilian Households was developed based on international studies and tailored to local conditions. The methodology applied follows a series of steps to ensure the accuracy and reliability of the data collected and aims to verify the emissions from the use of natural gas in the cooking process. The measurements were carried out in kitchens of volunteer residences in the city of São Paulo and region, in total the experiment was conducted in 30 properties. The key stages of the protocol with full description is in Sect. S1 of the Supplement.
Table 1Module, cycles, and time of each module performed in the residences.
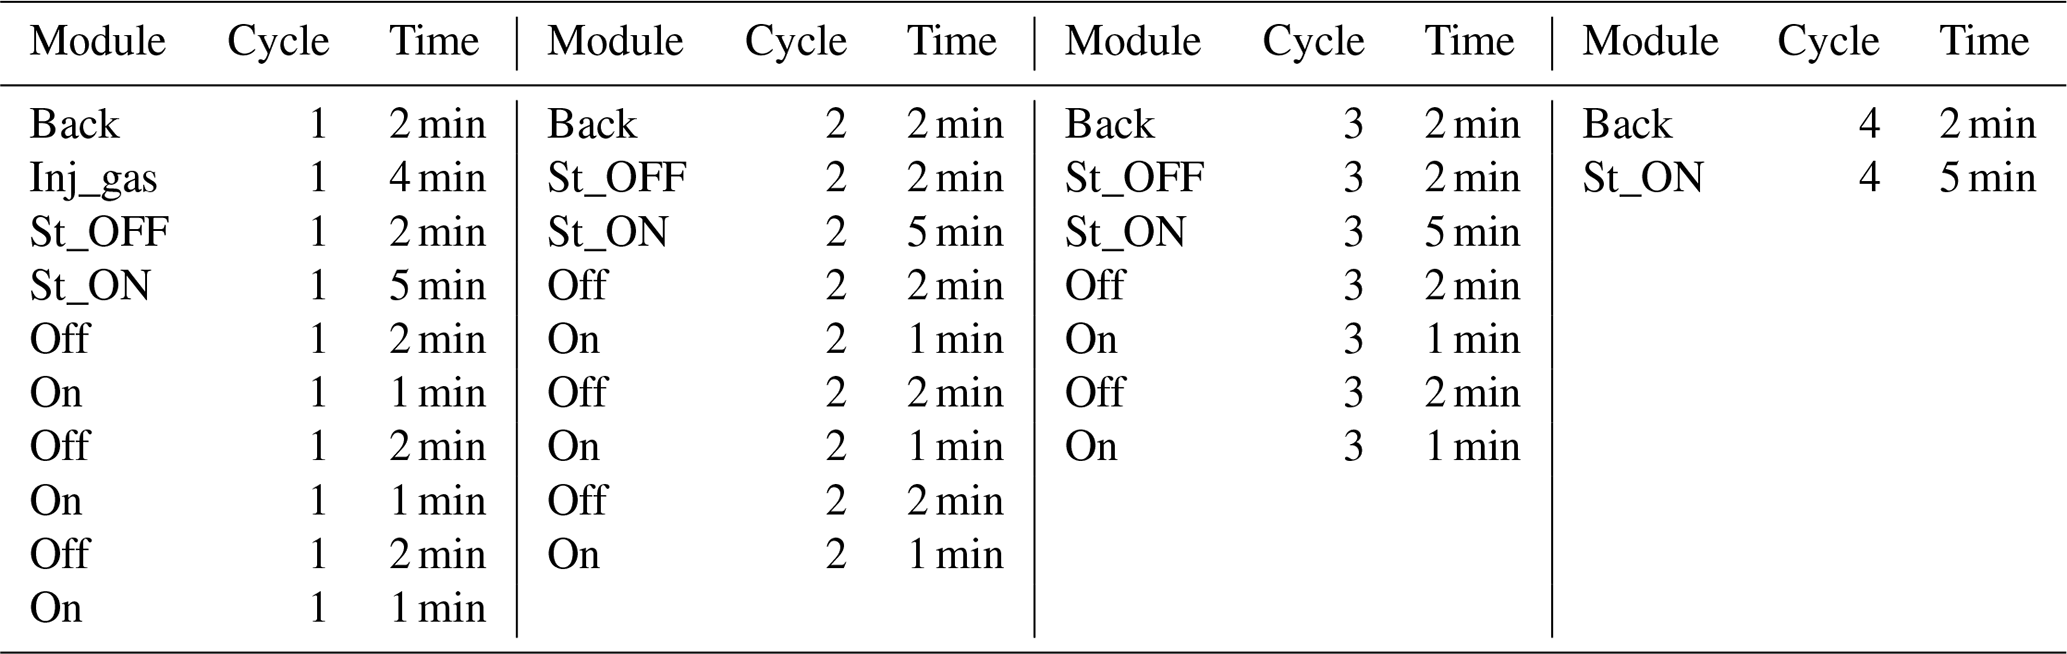
The experimental modules were organized based on the methodological framework proposed by Lebel et al. (2022), with adaptations made to accommodate the specific context of Brazilian households. The nomenclature and respective cycle durations of each module are detailed in Table 1. These durations were refined through preliminary tests conducted before data collection, which identified behavioral and operational patterns influencing the temporal configuration of each module (Lebel et al., 2022).
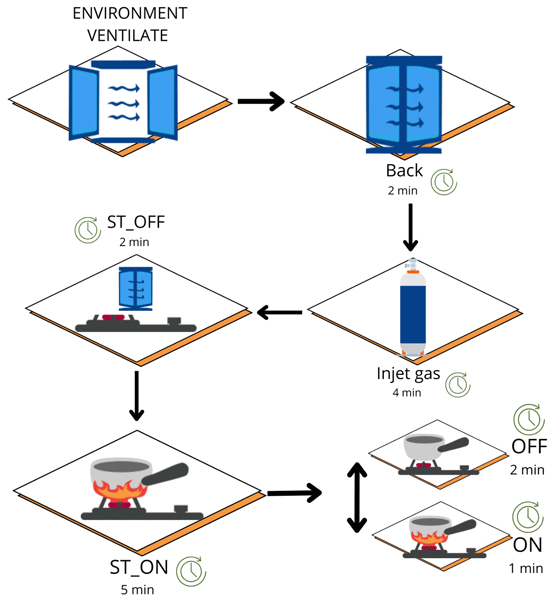
In the “STATE ON” module, a duration of 5 min was established as adequate for the stabilization of CO2 and CH4 concentrations while the burner remained active. In the “ON” and “OFF” modules, distinct gas emission dynamics were observed: a rapid increase in concentrations during the “ON” phase, followed by a gradual decay during the “OFF” phase. These changes were effectively captured within 1 min for the “ON” module and 2 min for the “OFF” module.
The modules were distributed across four distinct cycles to evaluate emissions from different sources and scenarios. Cycle 1 focused on the larger burner, Cycle 2 on the smaller burner, Cycle 3 on the oven, and Cycle 4 on the overall kitchen environment.
Figure 4 illustrates the sequence and duration of each module applied during the first measurement cycle. The process begins with environmental ventilation, followed by a 2 min background stabilization phase (“Back”). Next, a 4 min CO2 injection is performed (“Inject Gas”), after which the cycle proceeds through the ST_OFF and ST_ON modules. During the ST_OFF phase, the burner remains off, allowing gas concentrations to return toward baseline levels over 2 min. In contrast, the ST_ON phase involves igniting the burner under typical cooking conditions, with emissions monitored for 5 min to ensure stabilization of CO2 and CH4 concentrations. Finally, the ON and OFF phases are alternated to capture transient emission dynamics, lasting one and 2 min, respectively. The Inject Gas step could be used to ensure accurate concentration values for assessing the enclosed environment. This method consists of injecting a known volume of a standard gas and it accounts for the indoor volume and baseline (Lebel et al., 2022). Additional methodological details are provided in the Sects. S1 and S4 in the Supplement.
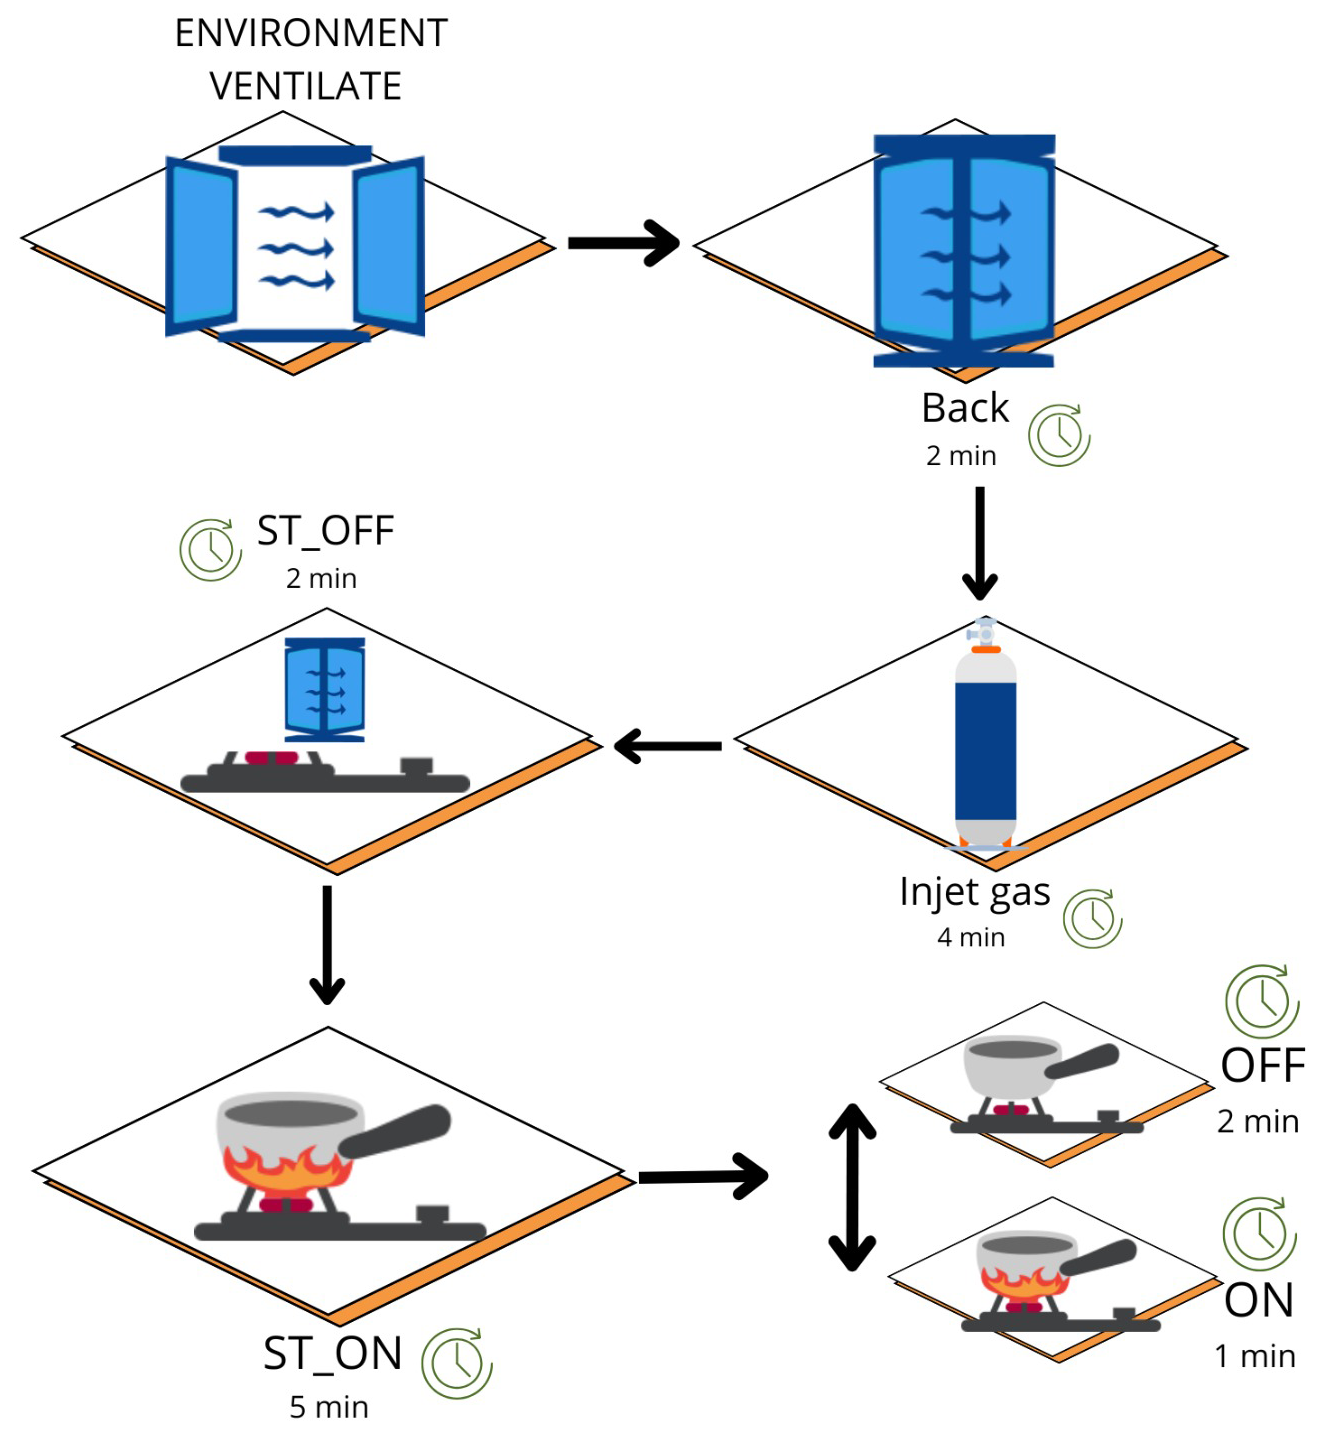
Figure 4Sequence and durations of the measurement protocol applied to cycle 1. The ON/OFF phases were repeated three times within each cycle, followed by a ventilation phase to reset the environment.
2.4 Equipments
Nitric oxide (NO), nitrogen dioxide (NO2), and total nitrogen oxides (NOx) were continuously analyzed by the Serinus 40 analyzer, which employs gas-phase chemiluminescence detection for continuous analysis, with a measurement support of ±0 to 20 ppm. Approved by the U.S. EPA as a reference method and certified by the TUV (Technischer Überwachungsverein) according to EN (European Norms), the instrument consists of a pneumatic system, a converter from NO2 to NO, a reaction cell, a measuring cell (PMT), an ozone generator and a PCA controller (Ecotech Inc., 2020; U.S. EPA, 2017).
Chemiluminescence occurs by the emission of light from an activated species of NO, formed by the reaction between NO and O3 in an evacuated chamber (Ecotech Inc., 2020).
Methane (CH4) and carbon dioxide (CO2) were measured by the Microportable Greenhouse Gas Analyzer (MGGA), that employs the Integrated Cavity Output Spectroscopy (OA-ICOS) technique, configured to acquire samples of the greenhouse gases, including water vapor, reaching an accuracy of < 0.9 ppb (1 s) for CH4 and < 350 ppb for CO2 (1 s) (ABB Inc., 2022). The MGGA has measurement rates ranging from 0.01 to 10 Hz and supports CH4 concentrations of 0.01 to 100 ppm and CO2 concentrations of 10 to 20 000 ppm, respectively. The analyzer's optical system consists of two lasers, with specific wavelengths for the detection of CH4 and H2Ov (Laser A) and CO2 (Laser B), respectively (ABB Inc., 2022).
Furthermore, some auxiliary materials were used, such as fans, plastic for sealing the open kitchen, a tripod for fixing the equipment tubes, a CO2 cylinder, and an auxiliary pump.
2.5 Emission Estimation Methodology
Accurate measurement of gas concentrations over time enables the determination of the instantaneous emission rate of gas “i”. This methodology was applied to different operational modes of stoves, such as the use of individual burners, and the average emission rate was calculated as showed in the Eq. (1), based on IPCC (2006).
This method accounts for the environment's volume, baseline and measured concentrations, and the air exchange rate, providing detailed insights into emissions. Therefore, the following description will be provided for each part of the equation (Eqs. 1.1 to 1.4).
Emissions were calculated for all cycles and homes during the stove stabilization (St_ON). The concentration change rates over time are determined by subtracting the final time concentration from the initial time, divided by the change over time. Rates are given for each gas and one for each cycle.
Where, concentration (Ci) is the average ppm concentration of the St_ON event, and background concentration (Ci,b) is the average ppm concentration of the Back event.
The air-exchange rate (λ) was determined after ventilating the kitchen to achieve indoor concentrations similar to the outdoor environment. For each household, λ was estimated from an exponential fit to the decay of indoor CO2 concentrations following stove operation. According to the experimental protocol, each cycle consisted of a stabilization period with the kitchen closed (St_OFF), followed by stove stabilization (St_ON) and a subsequent period with the stove turned off and the kitchen still closed. The best adjustment was chosen for each home, which was not necessarily in the same cycle. More details about this methodology is in Sect. S4 of the Supplement.
Equation (1.4) were used for the conversion from ppm to mg L−1. The Volume (V0) was estimated by calculating the volume of the environment (in liters) based on the physical dimensions of the space of measurement. The atmospheric average pressure (p) in the study region is 101 600 Pa (INMET, 2023). Others factor used were universal gas constant (R) of 8.314 J (mol K)−1, molar mass (Mi) of 16 g mol−1 for methane, 44 g mol−1 for carbon dioxide, and 46 g mol−1 for nitrogen dioxide, and temperature (T; Kelvin) at the environmental station in the city of São Paulo (CETESB, 2025).
Emission factor calculations
The emission factor FEi for gas “i” was calculated using Eq. (2) (IPCC, 2006).
Where the average gas consumed (q) was based on 0.25 m3 h−1 (Petrobras, 2022), and the lower heating value (LHV), was based on values for Brazil, which is 45 MJ kg−1 for NG (ANP, 2010), and 46 MJ kg−1 for LPG (ANP, 2020). The complete characteristics are in Tables S2 and S3 in Sect. S5 of the Supplement.
2.6 Data Processing
To ensure consistency in calculations, outliers were identified using statistical analysis based on the Tukey method and the interquartile range (IQR) criterion. Values below the 1st quartile minus 1.5 times the IQR (Q1 − 1.5 × IQR) or above the 3rd quartile plus 1.5 times the IQR (Q3 + 1.5 × IQR) were classified as outliers and excluded from the main estimates. This procedure ensures objective and reproducible criteria in data analysis.
The concentrations of the gases analyzed (CH4, CO2, and NOx) were normalized, making it possible to evaluate the influence of each gas on the others and their behavior in relation to the conditions maintained at the time of measurement, as they had different magnitudes. This normalization was done through the standardization method (z-score), which transforms the data so it has a mean of zero and a standard deviation equal to one. The equation based on this method is described in Sect. S3 of the Supplement.
Negative emission values were occasionally observed under specific measurement conditions and reflect limitations of the experimental setup rather than physical emissions; therefore, these values have been replaced with zero in the data processing stage. A discussion of the origin of these values is provided in Sect. S4 of the Supplement.
3.1 Normalized concentration
The normalized concentration profiles illustrate the temporal variability differences between two household examples: the SP_CASA02 (Fig. 5a), which uses liquefied petroleum gas (LPG), and SP_CASA03 (Fig. 5b), which uses natural gas (NG) for CH4, CO2, and NOx. In the LPG case, CO2 and NOx concentrations increase upon stove ignition (St_ON), except during Cycle 4 (ambient conditions). It is important to notice that, in both examples of Fig. 5, the houses had closet concept kitchens, in other words, it was not necessary sealing with plastic.
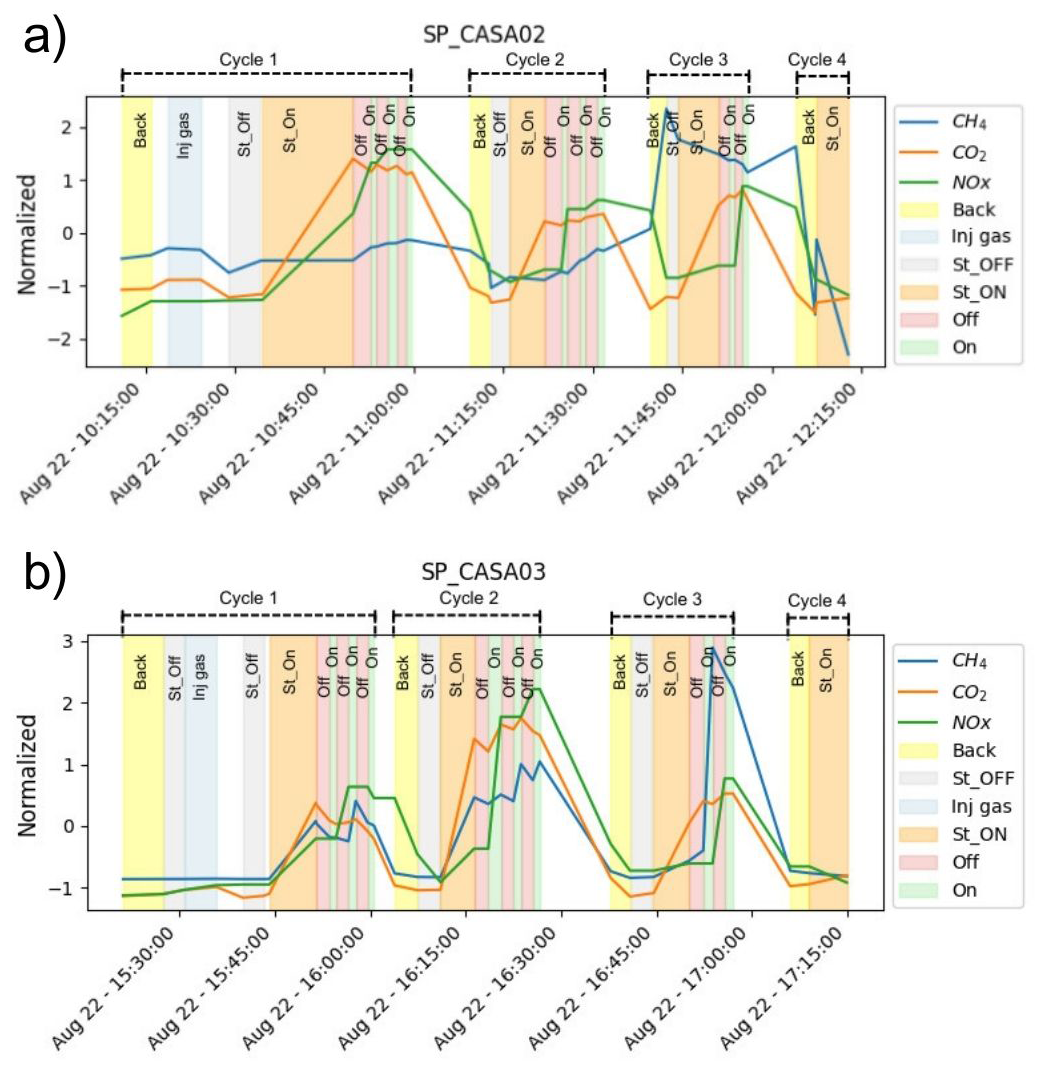
Figure 5Temporal variability of the normalized concentrations of CH4, CO2 and NOx. (a) Residence using Liquefied Petroleum Gas (SP_CASA02). (b) Residence using Natural Gas (SP_CASA03).
Methane (CH4) concentrations remained stable for most of the period in SP_CASA02 but showed variability from Cycle 3 onwards, suggesting an external influence unrelated to the LPG source.
Measurements on the large and small burners (cycle 1 and cycle 2) caused immediate responses in all compounds, which means that turning on the burner results in an increase in gas concentrations. Figure 5a and b presents time series examples from House SP_CASA02, which utilizes LPG for cooking, and House SP_CASA03, which uses NG.
In the case of NG (SP_CASA03), all gases displayed an increase upon stove ignition (St_ON), except in Cycle 4. In Cycle 3 (oven use), the response appeared delayed but resulted in higher CH4 concentrations. This behavior was observed in other households using NG, although no consistent pattern was identified across all samples, meaning it did not occur universally. Such delays, particularly in ovens, may be associated with leaks, a topic that warrants further investigation.
3.2 Concentrations by cycles: CH4, CO2, NO and NO2
The concentrations variability in CH4 (Fig. 6a) and CO2 (Fig. 6b) is evident across the monitored homes. CH4 shows the highest values in natural gas (NG) homes, with considerable variability and several outliers, while homes using liquefied petroleum gas (LPG) display relatively stable CH4 levels. The CO2 concentration exhibits the greatest variability, particularly in Cycle 2, in some cases where concentrations often exceed health effect limits. LPG homes show elevated CO2 levels in both burner cycles (Cycle 1 and Cycle 2).
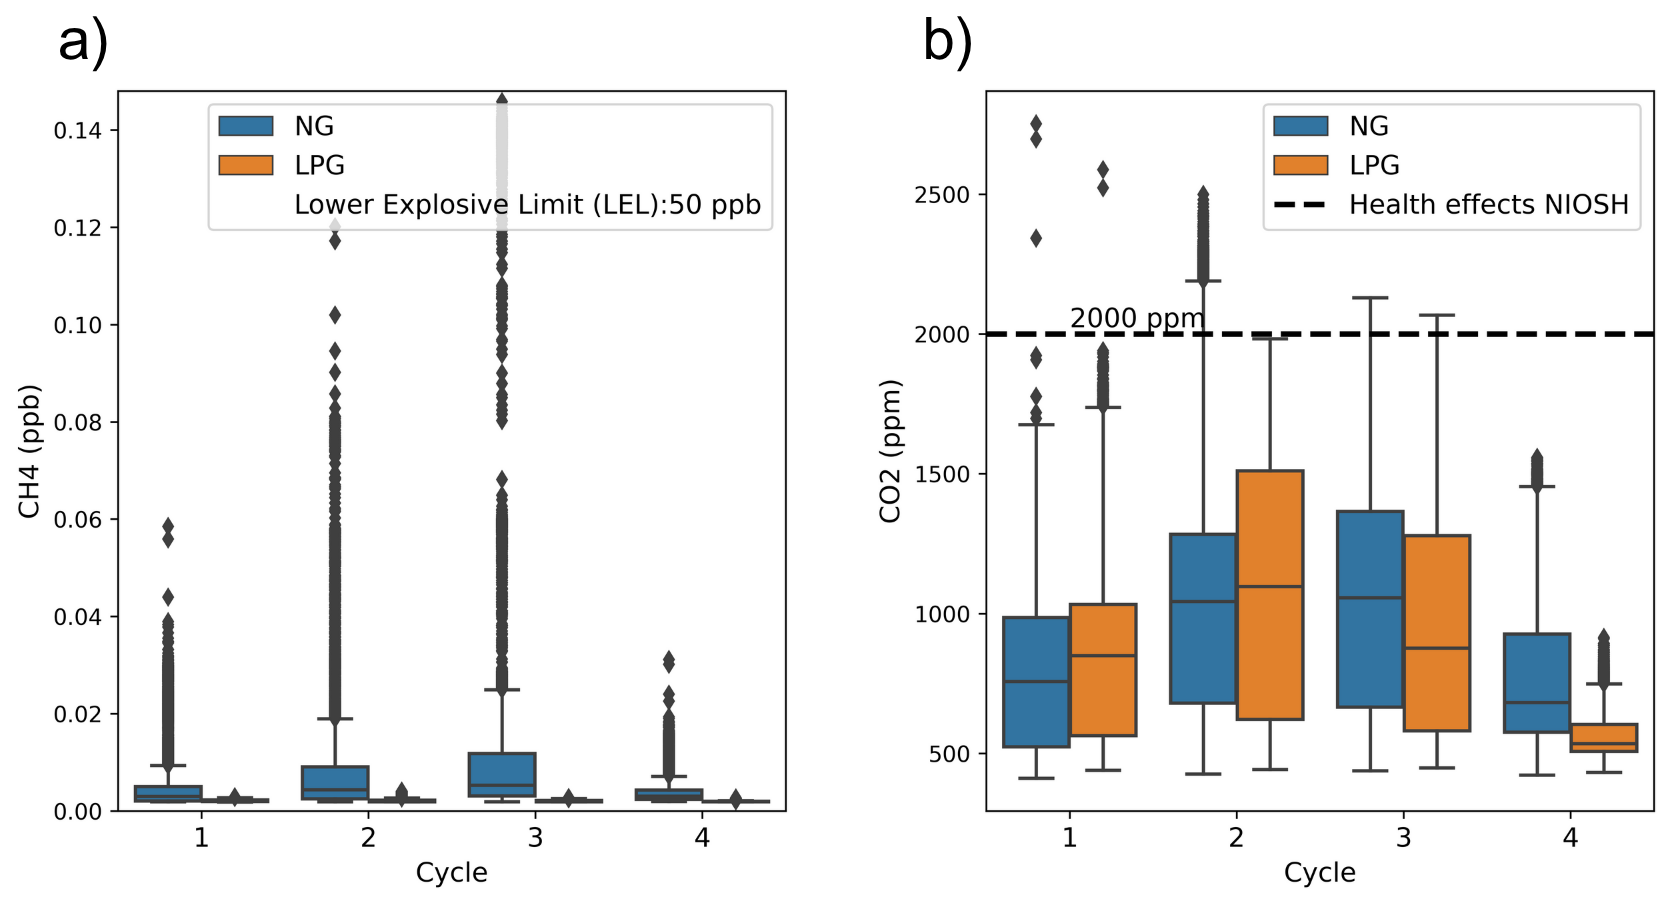
Figure 6Variability in gas concentrations across the monitored households using Natural Gas (NG) and Liquefied Petroleum Gas (LPG): (a) methane (CH4), with the lower explosive limit indicated at 50 ppm; and (b) carbon dioxide (CO2), with the NIOSH health effect threshold indicated at 2000 ppm.
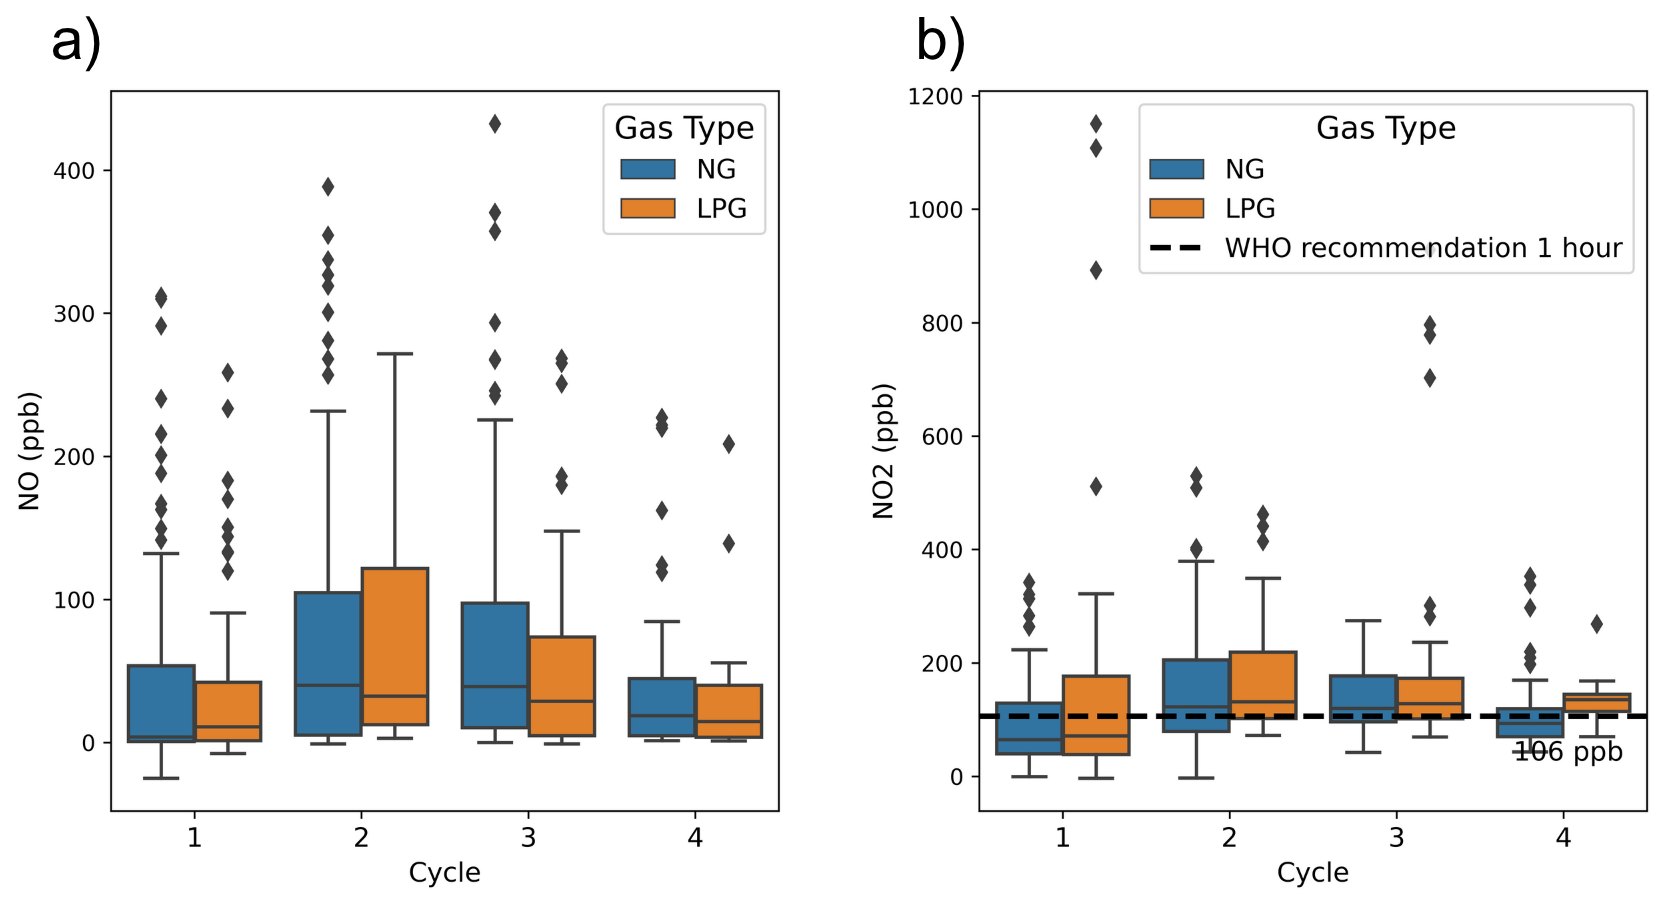
Figure 7Variability in gas concentrations across the monitored households using Natural Gas (NG) and Liquefied Petroleum Gas (LPG): (a) nitrogen oxide (NO); and (b) nitrogen dioxide (NO2), with the WHO 1 h exposure recommendation indicated at 106 ppb.
Figure 7a and b presents the NO and NO2 concentration data for households using natural gas (NG) and liquefied petroleum gas (LPG). NO concentrations show significant variability in both distribution and median values. Although the medians for NG are generally higher than those for LPG in most cycles, along with the presence of outliers, it was not possible to precisely quantify the difference between the two fuels due to the wide data distribution. For NO2, the concentrations for both LPG and NG during the cycles exceeded the WHO recommendation of 106 ppb for 1 h exposure. Additionally, a significant increase in concentrations from Cycle 1 to Cycle 2 was observed for both NO and NO2.
3.3 Emission rate
The emission rate refers to the amount of pollutant released per unit of time and is commonly used to assess emissions in specific operations or direct measurements at sources. The emission factor, on the other hand, relates the quantity of pollutant emitted to the activity that generated it, such as fuel combustion.
Table 2 shows the Median, First and Third quartiles, allowing a more complete analysis of the data distribution, highlighting central tendency and variability. These values were calculated during the combustion process (St_ON) for natural and liquefied petroleum gas.
Table 2Emission rate for CO2, CH4, and NO2 for NG and LPG with Median, First and Third quartile (Q1 and Q3).
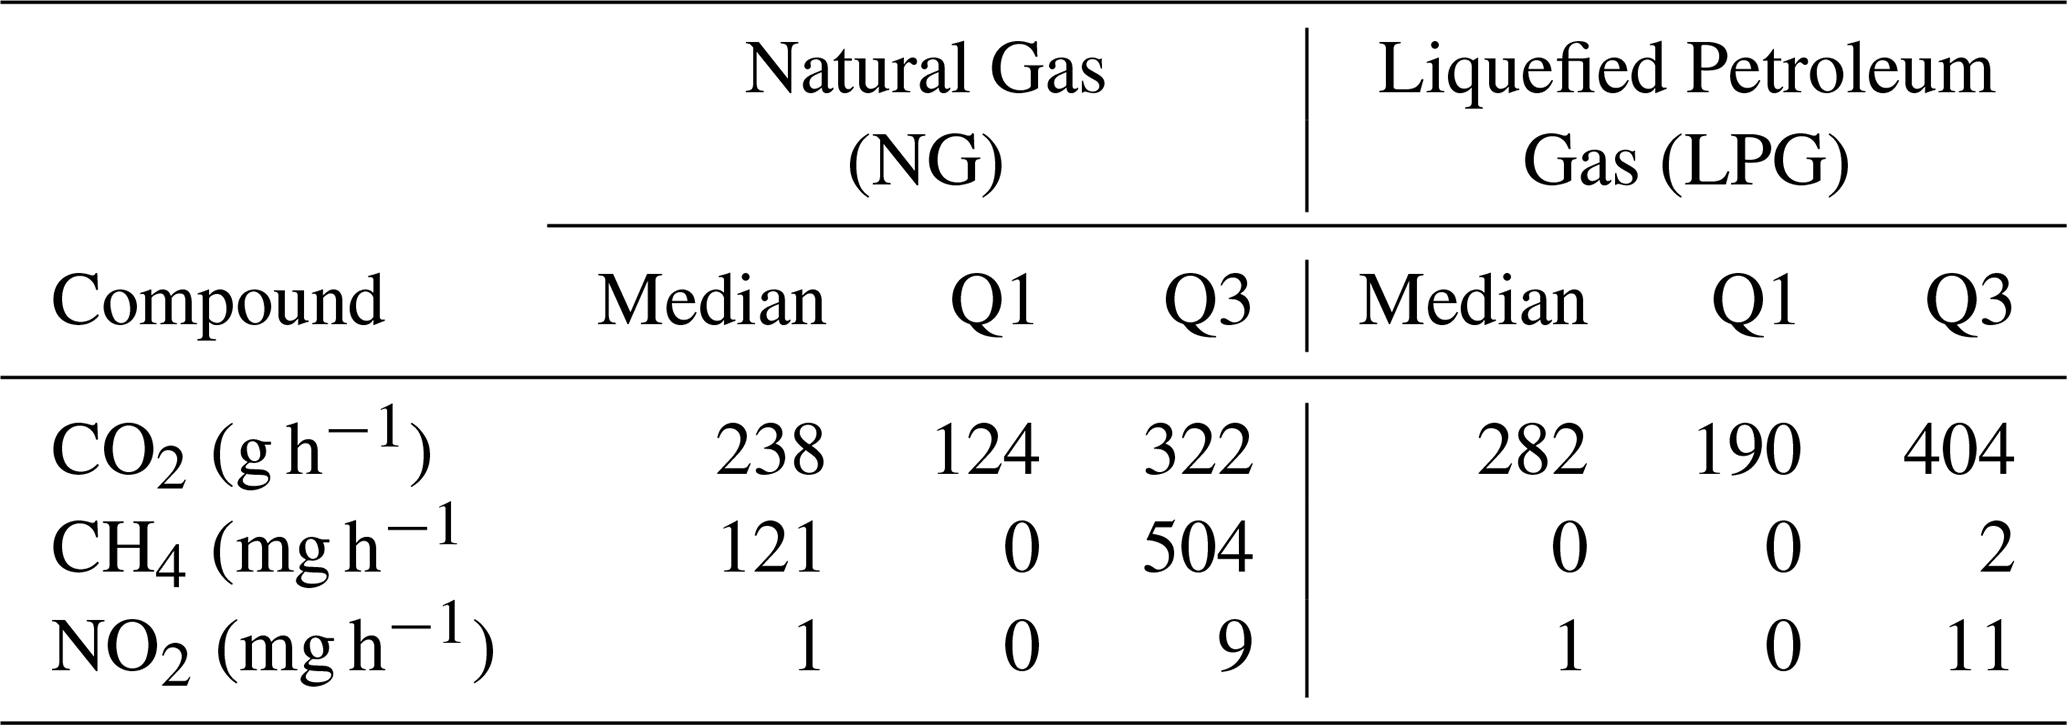
Median CO2 emission rates are lower for NG than for LPG, and the distribution of rates shows notable differences. For NG, Fig. 8a illustrates a range of values from 0 to 600 g h−1, while for LPG, the values are consistently higher, ranging from 180 to 700 g h−1.
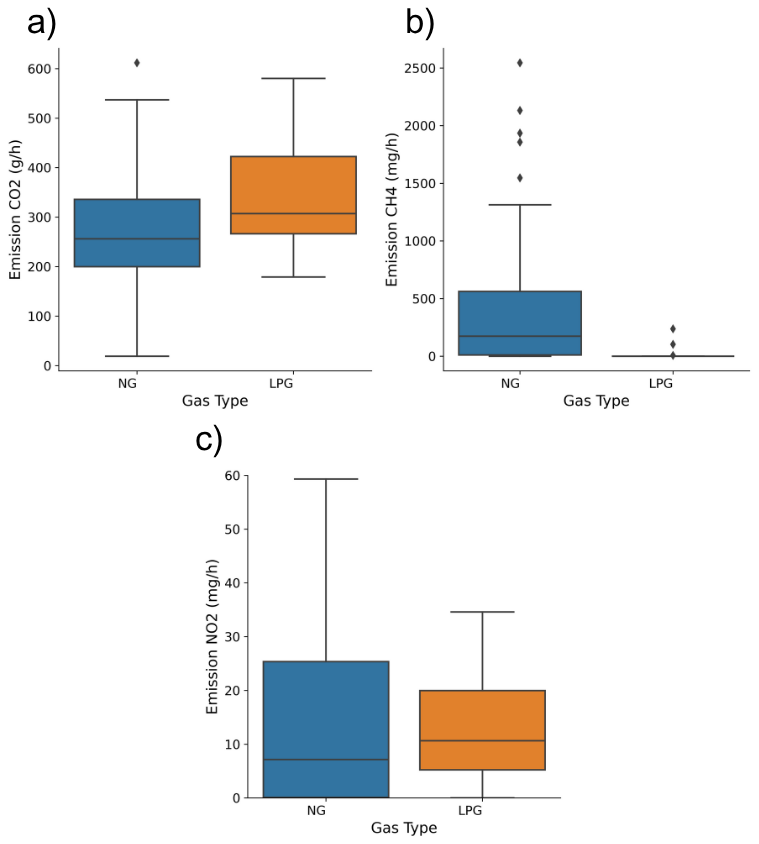
Figure 8Emission rates measured in the monitored households using natural gas (NG) and liquefied petroleum gas (LPG): (a) carbon dioxide (g h−1). (b) Methane (mg h−1). (c) Nitrogen dioxide (mg h−1).
The methane emission rates clearly highlight the difference between NG and LPG (Fig. 8b). For LPG, emissions are almost non-existent, resulting in no distribution. In contrast, NG exhibits a wide variability, with a strongly skewed distribution characterized by elevated emission rates and extreme positive outliers exceeding 2000 mg h−1, including a maximum value above 8000 mg h−1. It is worth noting that the third quartile was 504 mg h−1, indicating that a substantial fraction of the measurements corresponds to high emission levels.
Figure 8c shows that NO2 emission rates are similar for NG and LPG. There are no significant differences between these gases in this dataset. However, for LPG, a greater range of values and outliers is observed, reaching levels above 150 mg h−1. One hypothesis raised is that LPG is more commonly used in houses rather than apartments. In the sampled houses, close proximity to the street was noted, which may contribute to increased NO2 levels indoors. External interference may also occur for the same reason, due to inadequate sealing and high air exchange in some homes.
3.4 Emission factor
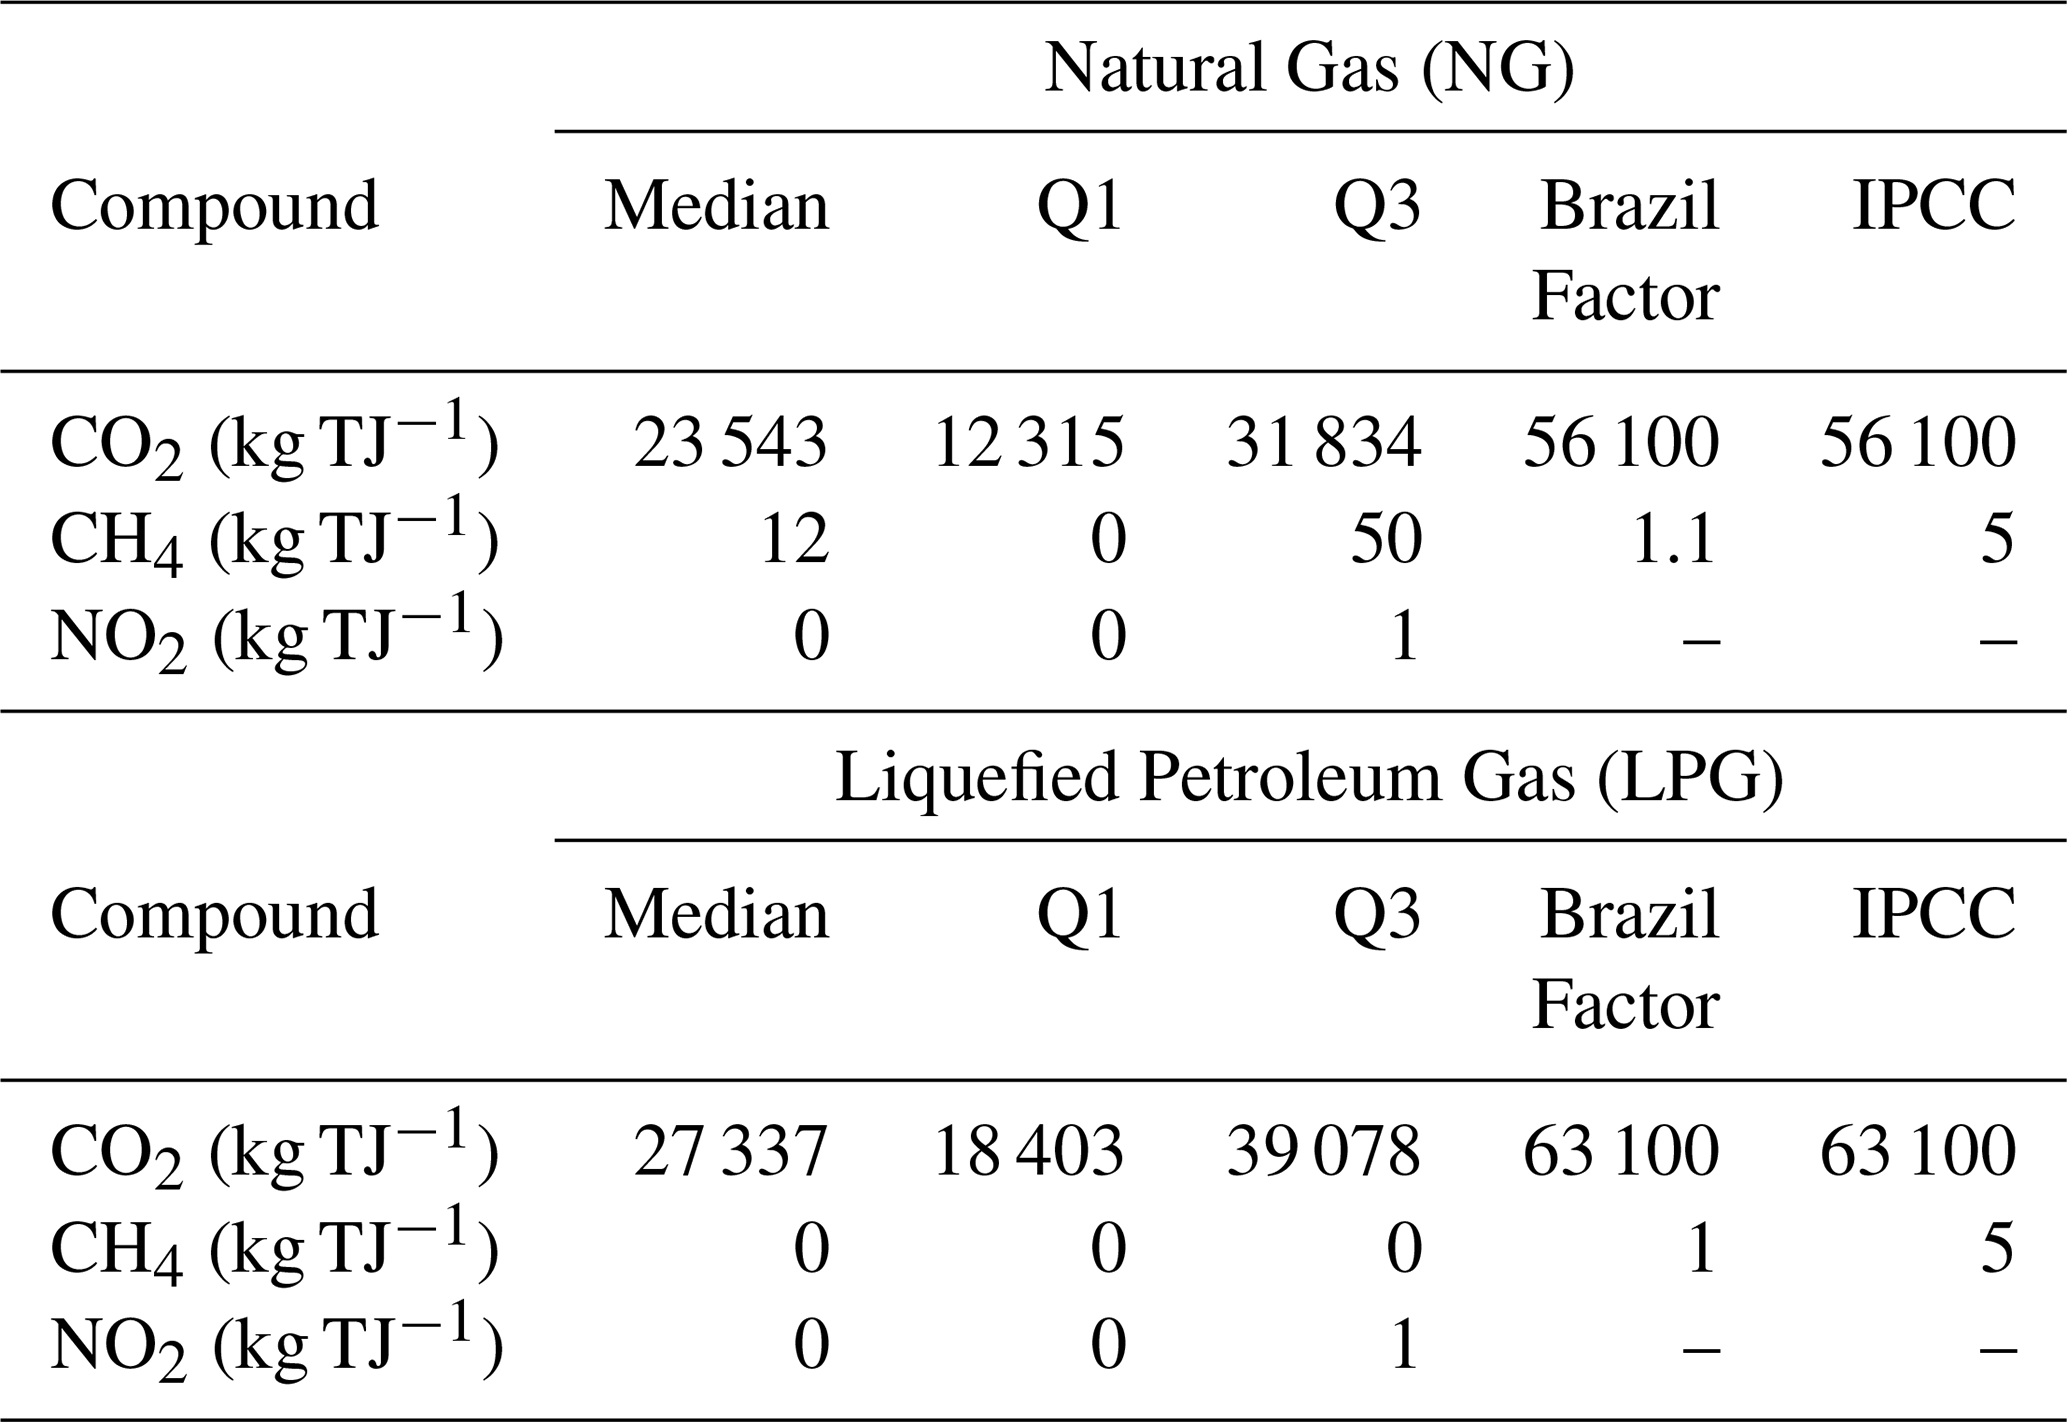
According to the national greenhouse emission inventory, Brazil could use IPCC emission factors to estimate household CO2 and methane emission values. The factor emission for CO2 is the same as the IPCC, 56 100 kg TJ−1 for NG and 63 100 kg TJ−1 for LPG. However, the factor adopted in Brazil for CH4 (LPG = 1.1 kg CH4 TJ−1 and NG = 1 kg CH4 TJ−1), diverges from the IPCC (NG = LPG = 5 kg CH4 TJ−1), because of the adaptations of brazilian gas specification and composition (MCTI, 2020; IPCC, 2019).
Considering the values used in the Brazilian inventory and an average gas consumption of 0.25 m3 h−1 (Petrobras, 2022). The methane emission factor obtained from the measurements median by NG taken was 11 kg TJ−1, 11 times higher than the national factor and 2 times higher than the IPCC (2019) value in kg TJ−1. And by LPG the values were zero, indicating no emission, that is lower than the Brazilian inventory and the IPCC value for methane (MCTI, 2020; IPCC, 2019).
The emission factor for CO2 obtained was around 20 981 kg TJ−1 for NG and 24 363 kg TJ−1 for LPG, both lower than the values used in the national inventory, similar to that of the IPCC (MCTI, 2020; IPCC, 2019). For NO2 the emission was 0 kg TJ−1 for NG and for LPG, indicating no emission. Table 3 summarizes the emission factor values obtained.
Table 3Emission factor for CO2, CH4, and NO2 for NG and LPG with Median, First and Third quartile (Q1 and Q3), Brazil inventory and IPCC factor value.
Liquefied petroleum gas (LPG) and natural gas (NG) are the primary fuels used in residential settings in Brazil, playing a critical role in meeting household energy needs. The residential sector accounts for 78 % of the final consumption of LPG in the country (EPE, 2023). Its importance in this sector is highlighted by the fact that, in 2020, LPG was the primary cooking fuel used in 94 % of households across Brazil (EPE, 2022). These further underscores the widespread reliance on LPG for cooking in Brazilian homes. In São Paulo, LPG remains the dominant fuel for residential kitchens, particularly in areas lacking the infrastructure for NG distribution. It is widely utilized in both urban and rural regions. However, the use of NG is gradually expanding, especially in urban centers and metropolitan areas where pipeline networks enable its direct delivery to homes (Associação Brasileira das Empresas Distribuidoras de Gás Canalizado – Abegás) (ABEGÁS, 2020). This study aimed to investigate GHG emissions under conditions related to domestic cooking practices in São Paulo, Brazil, focusing on natural gas (NG) and liquefied petroleum gas (LPG) stoves.
The time series analysis highlights distinct response behaviors of gases NO2, NOx, CH4 and CO2 under closed ambient conditions. For both natural gas (NG) and liquefied petroleum gas (LPG), concentrations of gases such as CH4 and CO2 show significant responses under closed environments, whereas their presence under ambient conditions is very low. When comparing NG and LPG, CH4 concentrations exhibit significant differences. NG homes consistently show higher CH4 levels, but the concentrations remain far below the lower explosive limit of 50 000 ppm established by the National Fire Protection Association (NFPA). On the other hand, CO2 concentrations vary among homes but display similar trends between NG and LPG, likely influenced by uncontrolled factors such as device types and operational conditions. Meanwhile, NO2 values sometimes exceed WHO's recommended 1 h limit of 106 ppb even before the stoves are turned on (St_OFF), which may be associated with the main pollution issue in São Paulo: vehicular emissions.
This difference between LPG and NG gases primarily lies in the composition specifications related to CH4. LPG, regulated by the National Agency of Petroleum, Natural Gas, and Biofuels (ANP), is predominantly composed of propane (C3H8) and butane (C4H10), with minor amounts of other hydrocarbons such as ethane (C2H6). To enhance safety, a sulfur-based odorant, typically ethyl mercaptan (C2H6S), is added to make leaks easily detectable by smell. LPG is widely distributed in 13 kg (P13) cylinders, which are commonly used for home cooking (EPE, 2023). Natural gas (NG) is primarily composed of methane CH4, making up over 70 % of its composition, followed by smaller proportions of ethane (C2H6) and propane (C3H8). Its gaseous state under normal atmospheric conditions makes it suitable for direct distribution via pipelines.
The study further dissects gas concentration behavior across different operational cycles. For CH4, homes using NG display a clear increase in CH4 levels during operation cycles, whereas LPG homes maintain concentrations close to ambient levels, reflecting a minimal response. CO2 present variability in both across cycles and within each cycle, primarily linked to stove burner activity. Elevated CO2 levels in certain cases during Cycle 2 highlight the influence of cooking on air quality. NG homes exhibit higher NO concentrations compared to LPG, but the difference is not mirrored for NO2, which remains consistently elevated for both fuels. And, across all cycles, NO2 concentrations exceed WHO recommendations, underscoring the potential risk associated with residential fuel combustion. In general, Cycle 4 (ambient conditions) recorded the lowest gas concentrations for all compounds and fuels, reaffirming the importance of adequate ventilation in reducing pollutant exposure indoors.
From a health perspective, the findings indicate that pollutant concentrations generally remain within safety thresholds under standard operational conditions. For CO2 typically below the National Institute for Occupational Safety and Health limit of 2000 ppm, with some exceptions during Cycle 2 (NIOSH, 2022, 2025). NO concentrations stay within the NIOSH recommended exposure limits (RELs), as time-weighted average (TWA) of 25 ppm during normal operations. NO2: Despite exceeding WHO's recommended values, NO2 concentrations remain under the NIOSH REL, as a short-term (ST) limit of 1 ppm for occupational exposure.
However, the absence of established air pollutant standards for residential environments, to define the direct assessment of health impacts is complicated by this factor. In additional São Paulo's urban air quality is heavily influenced by traffic-related NOx emissions, exacerbates the baseline exposure to these pollutants.
The study provides important insights into (CO2, CH4, and NO2 emissions associated with residential cooking practices, particularly the differences between houses using Natural Gas (NG) and Liquefied Petroleum Gas (LPG) as a fuel source. Residences relying on NG demonstrated higher mainly methane emissions compared to those using LPG. This finding underscores the importance of considering fuel type when evaluating greenhouse gas (GHG) emissions from residential sectors. The variability of concentrations can have various influences such as leaks, age and model of the stove, in addition to external sources such as automotive pollution, which is highly applicable in the case of São Paulo.
Although NG usage for cooking remains limited in São Paulo, its adoption is steadily increasing, driven by the expansion of pipeline infrastructure in urban areas. This trend positions NG as an emerging component of Brazil's energy matrix, though the country still lags behind other Latin American nations in NG penetration. LPG, however, continues to dominate as the primary cooking fuel, reflecting its widespread availability and affordability across urban and rural regions.
Transitioning to cleaner cooking technologies, like electric stoves, offers opportunities and challenges. The IPCC highlights that these transitions could significantly reduce methane emissions, which is a major component of natural gas (NG) and a potent greenhouse gas (GHG). However, in Brazil, adopting electric stoves may unintentionally lead to higher residential emissions because of the country's electricity generation mix. Additionally, for low-income households, the financial feasibility of making this transition is uncertain due to the high upfront costs and ongoing expenses associated with electric stoves.
The findings also highlight the scarcity of robust statistical data on residential emissions in Brazil, as noted by SEEG (Sistema de Estimativas de Emissões e Remoções de Gases de Efeito Estufa) (SEEG, 2021). Emissions are currently estimated using IPCC emission factors. The estimated methane (CH4) emission factors of natural gas were significantly higher than the values of the national inventories and the IPCC. This would mean that the previous estimates were lower than the actual emission rates for domestic use of natural gas.
Emissions of carbon dioxide CO2, however, were consistently lower than the IPCC estimates for natural gas and liquefied petroleum gas. These estimates, although widely used, are sources of data uncertainty due to differences in gas, stove and household characteristics. These differences occur not only from one country to another, but also between smaller regions. The difference observed in CO2 emission factors may be associated with the composition of fuels in Brazil, which tends to be cleaner and promotes more complete combustion, reducing CO2 formation per unit of energy (ANP, 2010, 2020). However, these results should be interpreted with caution, as they may reflect not only specific fuel characteristics but also sample limitations, operational variability, and particular conditions of the analyzed households. This study aims to highlight these possibilities and reinforces the need for more in-depth comparative approaches between national and international specifications, as well as future investigations to consolidate these findings.
These results show the need to study domestic emissions in greater detail to elucidate their effects on indoor air quality and climate change. In the construction of emission inventories this lack of data presents a significant barrier to fully understanding and addressing the impact of residential energy use on GHG and indoor pollutant emissions. Addressing this gap through targeted research and data collection is essential for developing effective policies and strategies to mitigate residential emissions, particularly as the use of NG continues to expand. It is worth noting that this work offers a partial view of a broader and more complex issue, indicating the need for new research at state and national levels, as such studies can help in the development of inventories of the residential sector, which would help to obtain strategies for both public health and sustainability for this sector. A more comprehensive statistical analysis would be beneficial for comparing the advantages and disadvantages of using natural gas or LPG in residences. Future research with larger samples and more rigorous experimental controls will enable the execution of more robust statistical tests to better investigate the differences between LPG and natural gas.
The software code underlying this study is currently not publicly available because it is part of an ongoing research and development effort within the research group and contains components intended for future scientific publications and methodological developments. Public release at this stage could compromise ongoing research activities and intellectual contributions. Access to specific parts of the code may be considered upon reasonable request to the corresponding author, subject to institutional approval and research collaboration agreements.
The underlying research data are currently not publicly available because the datasets are part of a continuously expanding observational database and require quality control, validation, and standardization prior to public dissemination. While the full database requires ongoing quality control, validation, and standardization prior to public release, the subset of data used in this study was fully curated and validated for the purposes of the analyses presented. The processed data supporting the conclusions of this study are available from the corresponding author upon reasonable request.
The supplement related to this article is available online at https://doi.org/10.5194/amt-19-4539-2026-supplement.
Material preparation, data collection, analysis, edit and interpretation of the result performed by TCS, ECA and TAS. All authors collaborated to interpret the results. The manuscript was written by TCS, ECA and TAS. The authors EVF, EL and MFA reviewed the study. All authors read and approved the final manuscript.
The contact author has declared that none of the authors has any competing interests.
The authors confirm that free and unconditional consent was obtained from the residents of all private homes, authorizing gas measurements, circulation within the monitored environment, and the sharing of the results obtained in this study. From registration to the completion of the measurements, the personal data and information of each volunteer were kept anonymous. The procedures and rules were discussed in advance with the volunteers, and a consent form was duly signed.
Publisher's note: Copernicus Publications remains neutral with regard to jurisdictional claims made in the text, published maps, institutional affiliations, or any other geographical representation in this paper. The authors bear the ultimate responsibility for providing appropriate place names. Views expressed in the text are those of the authors and do not necessarily reflect the views of the publisher.
We would like to thank the Global Methane Hub and the Latin American Future Foundation (FFLA), EBP Brazil, EBP Chile, Universidad Mayor of Chile, Universidad de los Andes of Colombia, University of São Paulo and Institute of Energy and Nuclear Research.
This paper was edited by Simone Lolli and reviewed by four anonymous referees.
ABB Inc.: GLA131 Series Microportable Analyzers User Manual: Measurement & Analytics, Quebec, https://library.e.abb.com/public/ec8c4878f3734ffb82adb3165badb4f9/3KXG167001R4601_C_ABB%20GLA131%20Series%20Microportable%20User%20Manual.pdf (last access: 19 December 2025), 2022. a, b
ABEGÁS: Consumo de gás natural cresce 39,6 % em outubro, Associação Brasileira das Empresas Distribuidoras de Gás Canalizado, https://www.abegas.org.br/arquivos/78359 (last access: 23 July 2025), 2020. a
ANP: Resolução ANP no. 7, de 16 de abril de 2010, Diário Oficial da União, DOU in 19 Apr 2010, https://atosoficiais.com.br/anp/resolucao-n-7-2010?origin=instituicao (last access: 28 February 2025), 2010 (revoked by Resolução no. 982/2025, https://atosoficiais.com.br/anp/resolucao-n-982-2025-estabelece-as-especificacoes-do-gas-natural-nacional-ou-importado-e-as-obrigacoes-quanto-ao-controle-da-qualidade-a-serem-atendidas-pelos-agentes-economicos-que-comercializam-ou-transportam-o-produto-em-territorio-nacional?origin=instituicao, last access: 11 June 2026). a, b
ANP: Resolução ANP no. 825, de 28 de agosto de 2020, Diário Oficial da União, DOU in 31 Aug 2020, https://atosoficiais.com.br/anp/resolucao-n-825-2020 (last access: 28 February 2025), 2020 (revoked by Resolução no. 980/2025, https://atosoficiais.com.br/anp/resolucao-n-980-2025-dispoe-sobre-as-obrigacoes-quanto-ao-controle-da-qualidade-dos-produtos-importados-a-que-se-refere-e-da-outras-providencias?origin=instituicao, last access: 11 June 2026). a, b
Cameron, C., Pachauri, S., Rao, N. D., McCollum, D., Rogelj, J., and Riahi, K.: Policy trade-offs between climate mitigation and clean cook-stove access in South Asia, Environ. Res. Lett., 1, 15010, https://doi.org/10.1038/nenergy.2015.10, 2016. a, b
CETESB: QUALAR – Sistema de Monitoramento da Qualidade do Ar: Dados de Temperatura, Governo Estadual de São Paulo, https://cetesb.sp.gov.br/ar/qualar/ (last access: 23 July 2025), 2025. a
Ecotech Inc.: Serinus 40: NOx Oxides of Nitrogen Gas Analyser – Spec Sheet, Ecotech Inc., 3.2 version, https://cleanaireurope.com/wp-content/uploads/2023/03/ACOEM-Ecotech-Serinus-40-NOx-Oxides-of-Nitrogen-Gas-Analyser-spec-sheet-20201014.pdf (last access: 27 February 2025), 2020. a, b
EPE: Brazilian Energy Balance 2020: Summary Report/Year 2019, Empresa de Pesquisa Energética, https://www.epe.gov.br/sites-en/publicacoes-dados-abertos/publicacoes/PublicacoesArquivos/publicacao-217/SUMMARY%20REPORT%202020.pdf (last access: 11 June 2026), 2020. a
EPE: Estudos prospectivos sobre oferta, demanda, investimentos e o abastecimento de GLP no Brasil, Nota Técnica EPE/DPG-DEA/2022/01, Empresa de Pesquisa Energética, https://www.sindigas.org.br/Download/PUBLICACOES_SETOR/NT-EPE-DPG-DEA-2022-01_Investimentos%20GLP%20e%20Outros%20Usos.pdf (last acess: 11 June 2026), 2022. a
EPE: Balanço Energético Nacional – Relatório Síntese, Empresa de Pesquisa Energética, https://www.epe.gov.br/sites-pt/publicacoes-dados-abertos/publicacoes/PublicacoesArquivos/publicacao-748/topico-681/BEN_S%C3%ADntese_2023_PT.pdf (last access: 11 June 2026), 2023. a, b
Fischer, M. L., Chan, W. R., Delp, W. W., Jeong, S., Rapp, V. H., and Zhu, Z.: An Estimate of Natural Gas Methane Emissions from California Homes, Environ. Sci. Technol., 52, 10205–10213, https://doi.org/10.1021/acs.est.8b03217, 2018. a, b
Gioda, A.: Residential fuelwood consumption in Brazil: Environmental and social implications, Biomass Bioenerg., 120, 367–375, https://doi.org/10.1016/j.biombioe.2018.11.014, 2019. a
IBGE: São Paulo – Panorama, Instituto Brasileiro de Geografia e Estatística, https://cidades.ibge.gov.br/brasil/sp/sao-paulo/panorama (last access: 23 January 2025), 2025. a
INMET: Normais Climatológicas do Brasil. Período: 1991–2020, Ministério da Cultura e Agropecuária. Governo Federal do Brasil, https://portal.inmet.gov.br/normais (last access: 23 July 2025), 2023. a
IPCC: 2006 IPCC Guidelines for National Greenhouse Gas Inventories, Intergovernmental Panel on Climate Change, https://www.ipcc-nggip.iges.or.jp/public/2006gl/ (last access: 23 July 2025), 2006. a, b
IPCC: 2019 Refinement to the 2006 IPCC Guidelines for National Greenhouse Gas Inventories, Intergovernmental Panel on Climate Change, https://www.ipcc-nggip.iges.or.jp/public/2019rf/index.html (last access: 11 June 2026), 2019. a, b, c, d, e
IPCC: Chapter 3: Mitigation Pathways Compatible with Long-term Goals, in: Climate Change 2022: Mitigation of Climate Change, Contribution of Working Group III to the Sixth Assessment Report of the Intergovernmental Panel on Climate Change, Intergovernmental Panel on Climate Change, Cambridge University Press, Cambridge, https://www.ipcc.ch/report/ar6/wg3/chapter/chapter-3/ (last access: 26 February 2025), 2022a. a, b, c
IPCC: Chapter 9: Sectoral Approaches to Mitigation, in: Climate Change 2022: Mitigation of Climate Change, 1st edn., Intergovernmental Panel on Climate Change, 1–42, https://www.ipcc.ch/report/ar6/wg3/chapter/chapter-9/ (last access: 26 February 2025), 2022b. a
Lebel, E., Gilman, J., Zebian, H., and Holmquist, B.: Methane and Nitrogen Oxides Emissions from Natural Gas Stoves, Cooktops, and Ovens in Residential Homes, Environ. Sci. Technol., 56, 2529–2539, https://doi.org/10.1021/acs.est.1c04707, 2022. a, b, c, d, e, f
MCTI: Relatório de Resultados do Inventário Nacional de Emissões e Remoções de Gases de Efeito Estufa, https://www.gov.br/mcti/pt-br/acompanhe-o-mcti/sirene/publicacoes/LO_GIZ_RESULTADOINVENTARIO_00_PAGINASINDIVIDUAIScompactado.pdf (last access: 23 January 2025), 2020. a, b, c, d, e
Merrin, Z. and Francisco, P. W.: Unburned Methane Emissions from Residential Natural Gas Appliances, Environ. Sci. Technol., 53, 5473–5482, https://doi.org/10.1021/acs.est.8b05323, 2019. a, b
NIOSH: Methane Exposure Limits and Guidelines, U.S. Centers for Disease Control and Prevention (CDC), U.S. National Institute for Occupational Safety and Health, https://www.cdc.gov/niosh/ (last access: 24 February 2025), 2022. a, b, c
NIOSH: Workplace Safety & Health Topics, U.S. Centers for Disease Control and Prevention (CDC), National Institute for Occupational Safety and Health, https://www.cdc.gov/niosh/topics/default.html (last access: 11 June 2026), 2025. a
OSHA: Carbon Dioxide – Health Effects and Occupational Exposure Limits, U.S. Occupational Safety and Health Administration, https://www.osha.gov/chemicaldata/183 (last access: 11 June 2026), 2021. a
Petrobras: Assistência Técnica, Gás Liquefeito De Petróleo, Informações Técnicas, Petrobras, https://petrobras.com.br/quem-somos/assistencia-tecnica (last access: 23 January 2025), 2022. a, b
SEEG: Lacunas de Dados Primários para Estimativas de Emissões de Gases de Efeito Estufa: Avanços Necessários e Recomendações, Sistema de Estimativas de Emissões de Gases de Efeito Estufa, Observatório do Clima, https://seeg.eco.br/wp-content/uploads/2024/03/SEEG-LACUNAS-DADOS.pdf (last access: 23 July 2025), 2021. a
SEEG: Emissões do Estado e do Município de São Paulo, Sistema de Estimativa de Emissões de Gases de Efeito Estufa, Observatório do Clima, https://seeg.eco.br (last access: 11 June 2026), 2024. a, b, c
SVMA: Inventário de Emissões e Remoções Antrópicas de Gases de Efeito Estufa do Município de São Paulo 2010 – 2018, Secretaria Municipal do Verde e do Meio Ambiente. São Paulo (Município), São Paulo, Coordenação: Laura Lucia Vieira Ceneviva. Compilação geral: Fábio Pedó. Núcleo de Assessoria Técnica em Mudanças Climáticas da SVMA, ISBN 978-65-87274-08-9, https://drive.prefeitura.sp.gov.br/cidade/secretarias/upload/meio_ambiente/Invent%C3%A1rio%20GEE%202010-2018%20-%20vers%C3%A3o%20final(1).pdf (last access: 11 June 2026), 2022. a, b, c
U.S. EPA: List of Designated Reference and Equivalent Methods, Tech. rep., United States Environmental Protection Agency, Office of Air Quality Planning and Standards, https://www3.epa.gov/ttnamti1/files/ambient/criteria/AMTIC_List_June_2017_update_6-19-2017.pdf (last access: 1 July 2025), 2017. a
WHO: WHO global air quality guidelines: particulate matter (PM2.5 and PM10), ozone, nitrogen dioxide, sulfur dioxide and carbon monoxide, World Health Organization, https://www.who.int/publications/i/item/9789240034228 (last access: 11 June 2026), 2021. a, b
WMO: No. 20 – 28 October 2024: The State of Greenhouse Gases in the Atmosphere Based on Global Observations through 2023, https://library.wmo.int/records/item/69057-no-20-28-october-2024 (last access: 11 June 2026), 2024. a, b
WRI: 4 Charts Explain Greenhouse Gas Emissions by Sector, World Resources Institute, https://www.wri.org/insights/4-charts-explain-greenhouse-gas-emissions-countries-and-sectors (last access: 25 February 2025), 2024. a