the Creative Commons Attribution 4.0 License.
the Creative Commons Attribution 4.0 License.
 | 21 Dec 2018
Low-pressure gas chromatography with chemical ionization mass spectrometry for quantification of multifunctional organic compounds in the atmosphere
Hannah M. Allen
John D. Crounse
Eric Praske
Anke C. Noelscher
Paul O. Wennberg
Oxygenated volatile organic compounds (OVOCs) are formed during the oxidation of gas-phase hydrocarbons in the atmosphere. However, analytical challenges have hampered ambient measurements for many of these species, leaving unanswered questions regarding their atmospheric fate. We present the development of an in situ gas chromatography (GC) technique that, when combined with the sensitive and specific detection of chemical ionization mass spectrometry (CIMS), is capable of the isomer-resolved detection of a wide range of OVOCs. The instrument addresses many of the issues typically associated with chromatographic separation of such compounds (e.g., analyte degradation). The performance of the instrumentation is assessed through data obtained in the laboratory and during two field studies. We show that this instrument is able to successfully measure otherwise difficult-to-quantify compounds (e.g., organic hydroperoxides and organic nitrates) and observe the diurnal variations in a number of their isomers.
- Article
(5512 KB) - Full-text XML
-
Supplement
(719 KB) - BibTeX
- EndNote


The composition of the atmosphere is determined through a dynamic array of chemical emission, transport, deposition, and photochemical processing. Our ability to accurately predict future trends in both air quality and climate change depends on understanding these processes. Of particular interest is the photooxidation of non-methane hydrocarbons (NMHCs), which influence the distributions of key atmospheric constituents such as ozone (O3) and secondary organic aerosol (SOA). While decades of research have provided much insight into the link between atmospheric composition and chemistry, significant knowledge gaps still persist and the atmospheric degradation pathways of many NMHCs remain poorly understood.
The gas-phase oxidation of NMHCs is typically initiated by one of several atmospheric oxidants (i.e., OH, NO3, or O3) converting these hydrocarbons into oxygen-containing, often multifunctional, intermediates. These first-generation oxygenated volatile organic compounds, or OVOCs, can undergo further transformations through a number of competing physical and photochemical sinks (Atkinson and Arey, 2003; Mellouki et al., 2015), each of which can have a unique effect on the atmosphere. Some OVOCs can undergo photochemical fragmentation to smaller species, often through conversion of NO to NO2 leading to local ozone formation, while others (such as those with longer atmospheric lifetimes) can be transported downwind prior to oxidation, extending their effects to regional and global scales. Chemical oxidation can also cause OVOCs to increase their functionality, creating large low-volatility, multifunctional products that partition into the particle phase and contribute to the formation and growth of aerosol. In addition, it has been shown that significant portions of OVOCs can be removed from the atmosphere through fast deposition processes (Nguyen et al., 2015), which can greatly affect the chemical cycling of many important compounds.
It is the relative importance of each possible sink that establishes the dominant tropospheric fate of these compounds and thereby the impact of their hydrocarbon precursors (Koppmann and Wildt, 2008). This seemingly straightforward relationship can quickly become complicated, however, especially for larger compounds (> C3). A prime example of this can be seen during the OH oxidation of isoprene, a highly abundant and reactive biogenic VOC, which produces six isomeric peroxy radicals (RO2). Changes in the relative abundance of these radicals can result in vastly different ratios of its OVOC products (Orlando and Tyndall, 2012; Teng et al., 2017; Wennberg et al., 2018), allowing isoprene to have a profound effect on ozone or SOA through its bimolecular reaction products – isoprene hydroxy nitrates (IHNs) and isoprene hydroxy hydroperoxides (ISOPOOHs), respectively – or the OH radical that is recycled during the subsequent chemistry of products formed from the unimolecular RO2 reaction channel (Peeters et al., 2014). These structural effects are also apparent throughout the later-generation chemistry of isoprene and other NMHCs and the outputs of global chemistry transport models can be quite sensitive to this isomer-specific chemistry. For example, ozone production, in particular, has been shown to be highly dependent on the assumed yields and reaction rates of specific organic nitrate isomers (Squire et al., 2015), which together determine the net NOx recycling capabilities of each compound.
Despite its importance, our understanding of this intricate chemistry has been hindered by the lack of instrumentation capable of providing isomer-resolved measurements of important OVOCs. Recent progress has been made in this respect for laboratory studies (Bates et al., 2014, 2016; Lee et al., 2014; Praske et al., 2015, 2018; Schwantes et al., 2015; Teng et al., 2015, 2017). Analytical techniques for ambient measurements, however, suffer from either high detection limits and/or large instrumental losses of these reactive analytes (Apel et al., 2003, 2008; Clemitshaw, 2004; Vairavamurthy et al., 1992), and so the focus has typically been on smaller, more abundant compounds (Goldan et al., 2004; Hellén et al., 2017; Koppmann and Wildt, 2008; Mellouki et al., 2003).
Gas chromatography (GC) can reach the detection limits needed to measure a variety of larger OVOCs by preconcentrating analytes prior to separation and utilizing detection methods such as flame ionization detection (FID) or electron impact mass spectrometry (EI-MS) (Ras et al., 2009). As a result, this technique is increasingly popular and has been or is currently being developed for the in situ detection of carbonyls (Apel et al., 2003; Zhao et al., 2013), organic acids (Hellén et al., 2017), organic nitrates (Mills et al., 2016), and other oxygenated organic compounds (Clemitshaw, 2004; Goldan et al., 2004; Koppmann and Wildt, 2008; Lerner et al., 2017; Millet et al., 2005; Roukos et al., 2009). Nevertheless, these field-deployable GC techniques come with their own analytical challenges as the non-specificity of common detectors such as GC–FID and overall difficulty in differentiating fragmentation patterns of isobaric and isomeric species with GC–MS can create data sets that hide the intricacies of crucial structure–activity relationships of individual compounds. In addition, the multifunctional nature of these compounds makes them highly reactive, increasing the likelihood that they will be lost or converted into different species through surface-enhanced reactions that can occur at various stages of GC analysis. Converted species can be subsequently detected (Rivera-Rios et al., 2014); thus identifying such artifacts necessitates authentic calibrations even for species not being targeted. Due to the lack of commercially available standards for many species of interest, this can quickly become labor intensive or simply not feasible, leading to large uncertainties in these types of measurements and much confusion regarding chemical mechanism elucidation.
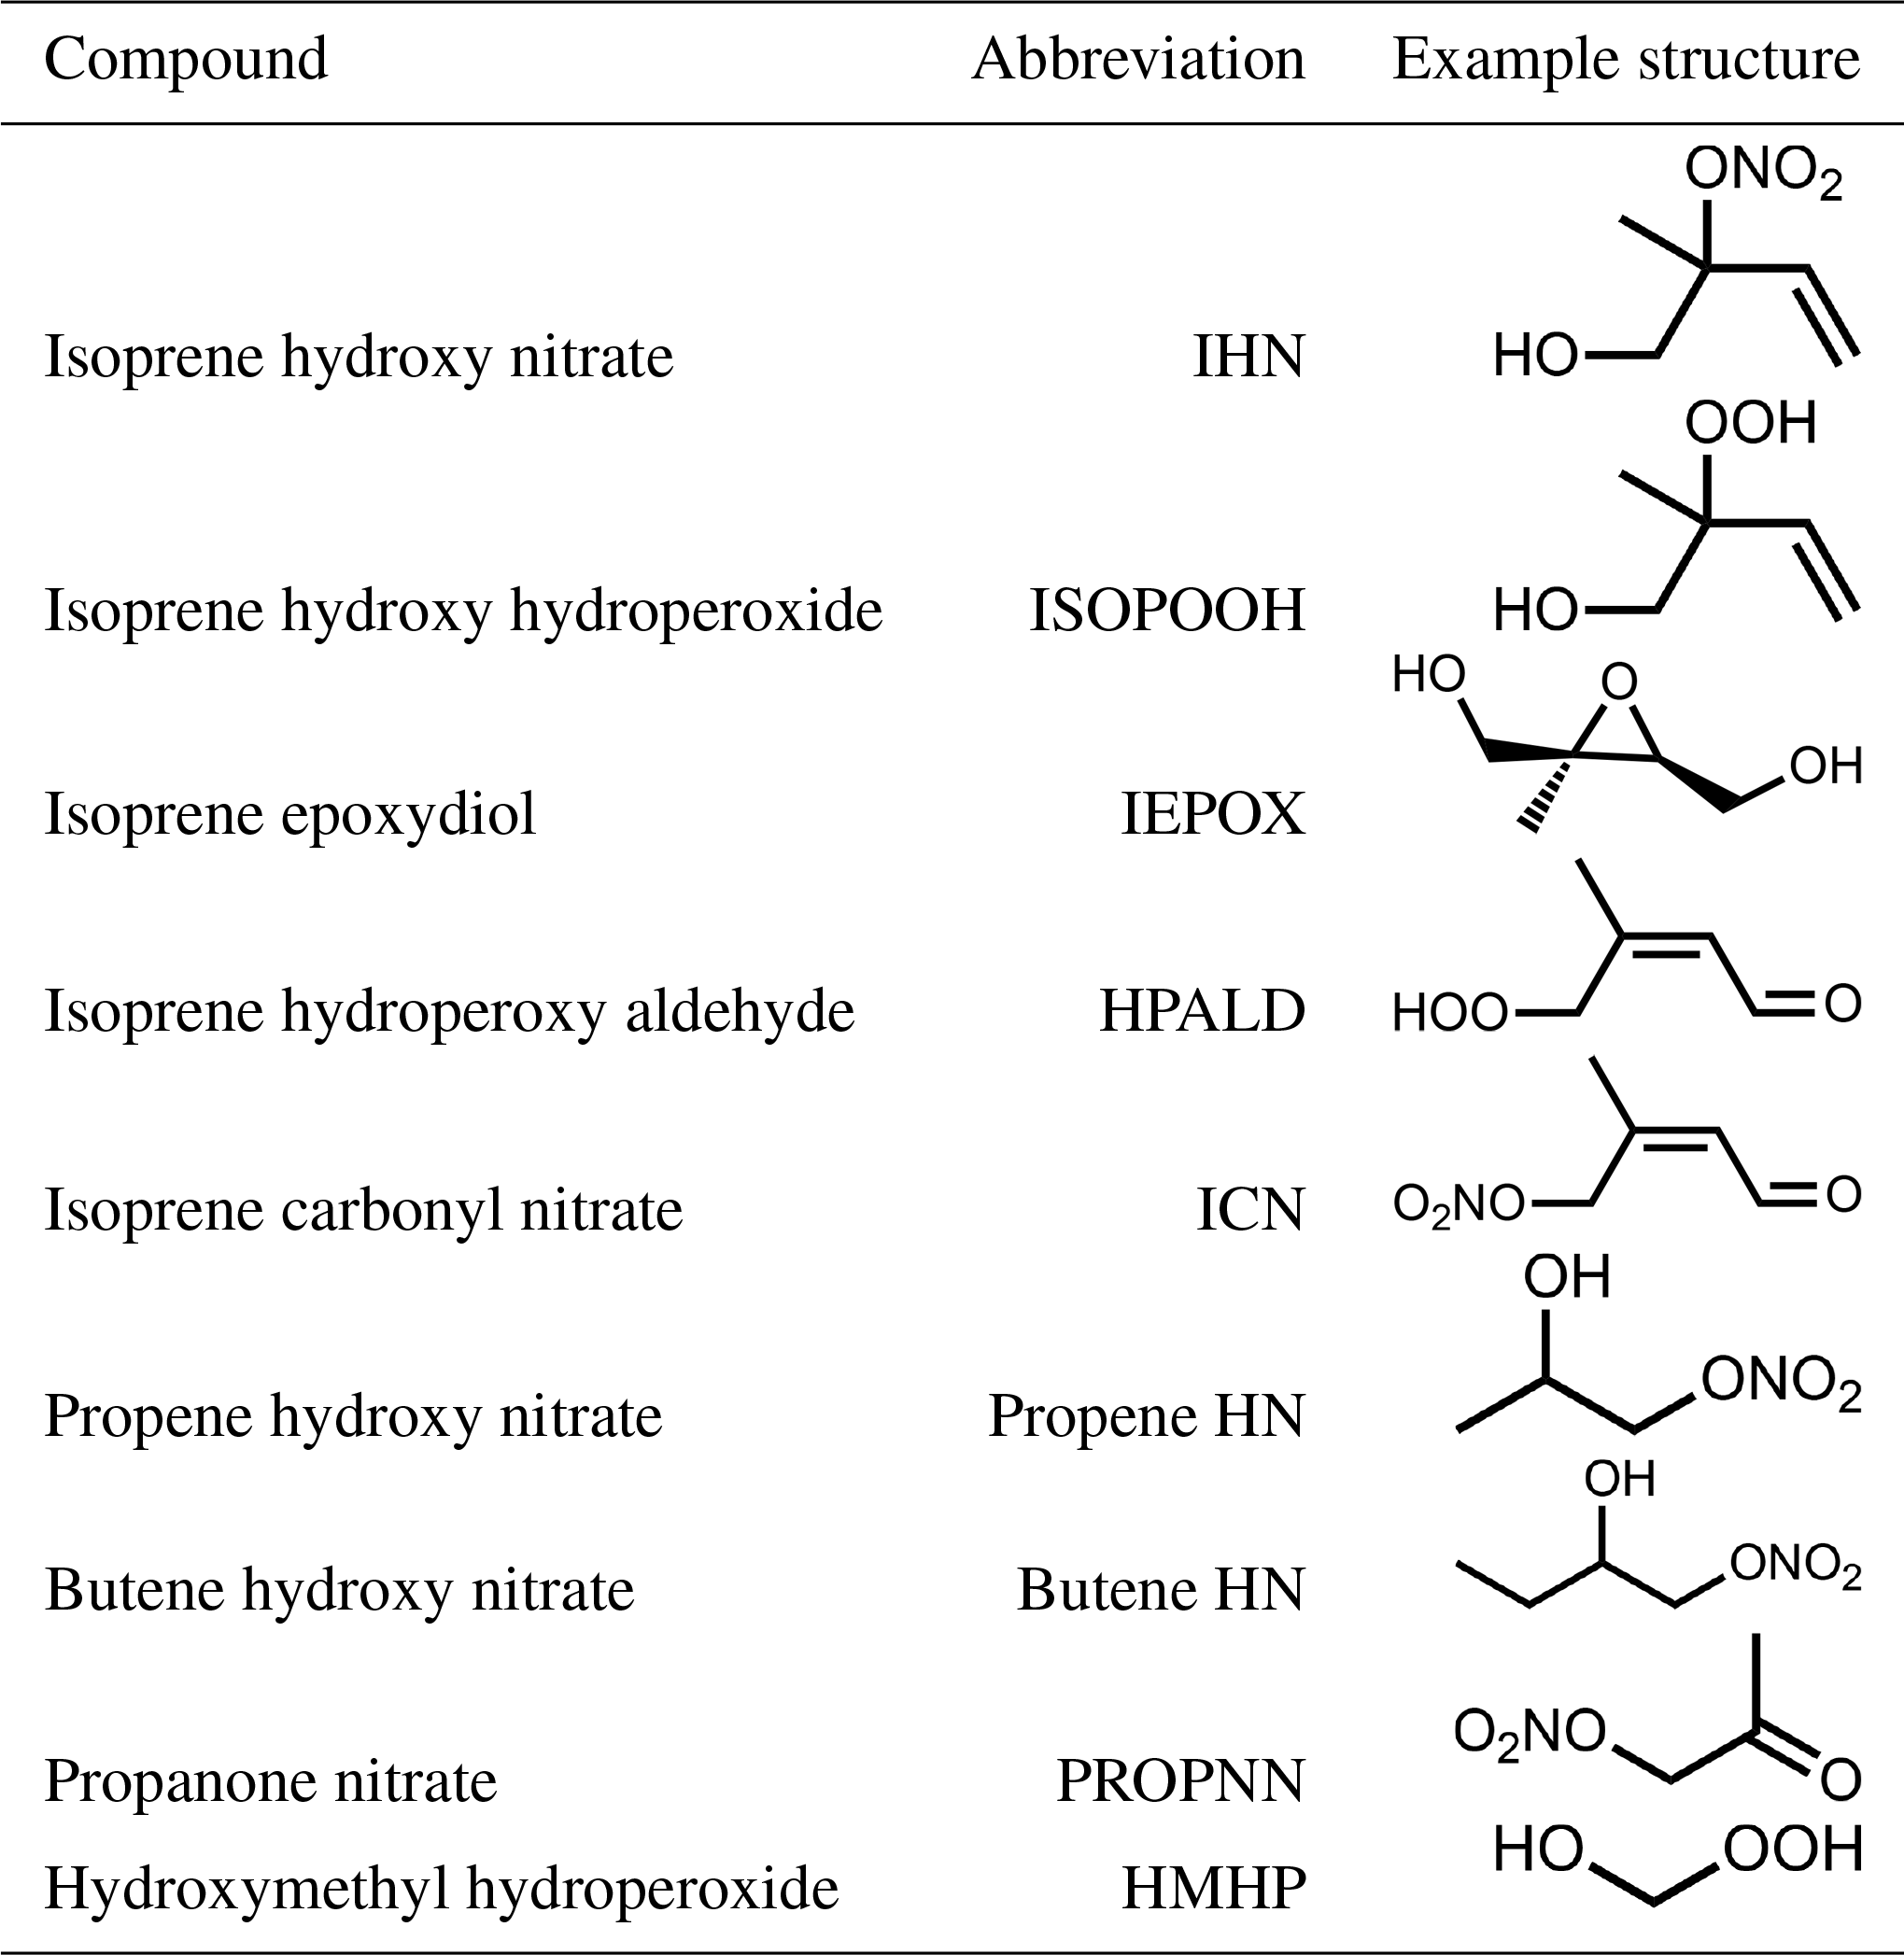
Here, we present the development and deployment of a new GC method that uses the highly sensitive detection of chemical ionization mass spectrometry (CIMS) for the near-real-time detection of a number of OVOCs. With this instrumentation, we address many of the historical issues associated with the use of GC for atmospheric field sampling, allowing for the preservation of difficult-to-measure compounds and enabling isomer-resolved measurements of a wide array of compounds. Compounds discussed in this study are shown in Table 1. To distinguish among isomers of hydroxynitrates, ISOPOOH, HPALD, and isoprene carbonyl nitrates (ICNs), we employ an abbreviated naming scheme in which the first number denotes the carbon position where the oxidant originally adds to the parent alkene and the second denotes the position of the additional functional group (e.g., for 1,2-IHN the hydroxy group is located on the first carbon of the isoprene backbone (C1), followed by a nitrooxy group at C2).
The GC high-resolution time-of-flight (HRToF) CIMS integrates the use of a metal-free, low-pressure gas chromatography (LP-GC) instrument positioned upstream of a HRToF-CIMS (Tofwerk and Caltech). This combination allows for two main sampling modes: (1) direct atmospheric sampling for the real-time quantification of gas-phase species (hereafter, direct CIMS sampling) and (2) GC–CIMS analysis for the collection, separation, and quantification of ambient isomer distributions of select OVOCs. The overall design of this instrumentation is based upon an existing test bed that has been used in previous laboratory studies (Bates et al., 2014; Lee et al., 2014; Schwantes et al., 2015; Teng et al., 2015, 2017). However, in those studies, the GC prototype required a short length of the column to be manually submerged into a chilled isopropanol bath, a setup that is cumbersome, if not impossible, to use outside of a laboratory setting. These studies were also performed under very low humidities. Here, we have field-hardened this design such that GC operation is automated and chromatography is reproducible under a variety of field conditions. A simplified schematic of the GC-HRToF-CIMS is shown in Fig. 1, highlighting the main flow paths of direct CIMS sampling (orange) as well as GC trapping (blue and purple) and eluting (red and purple). Details of the GC automation are discussed in Sect. 2.2.
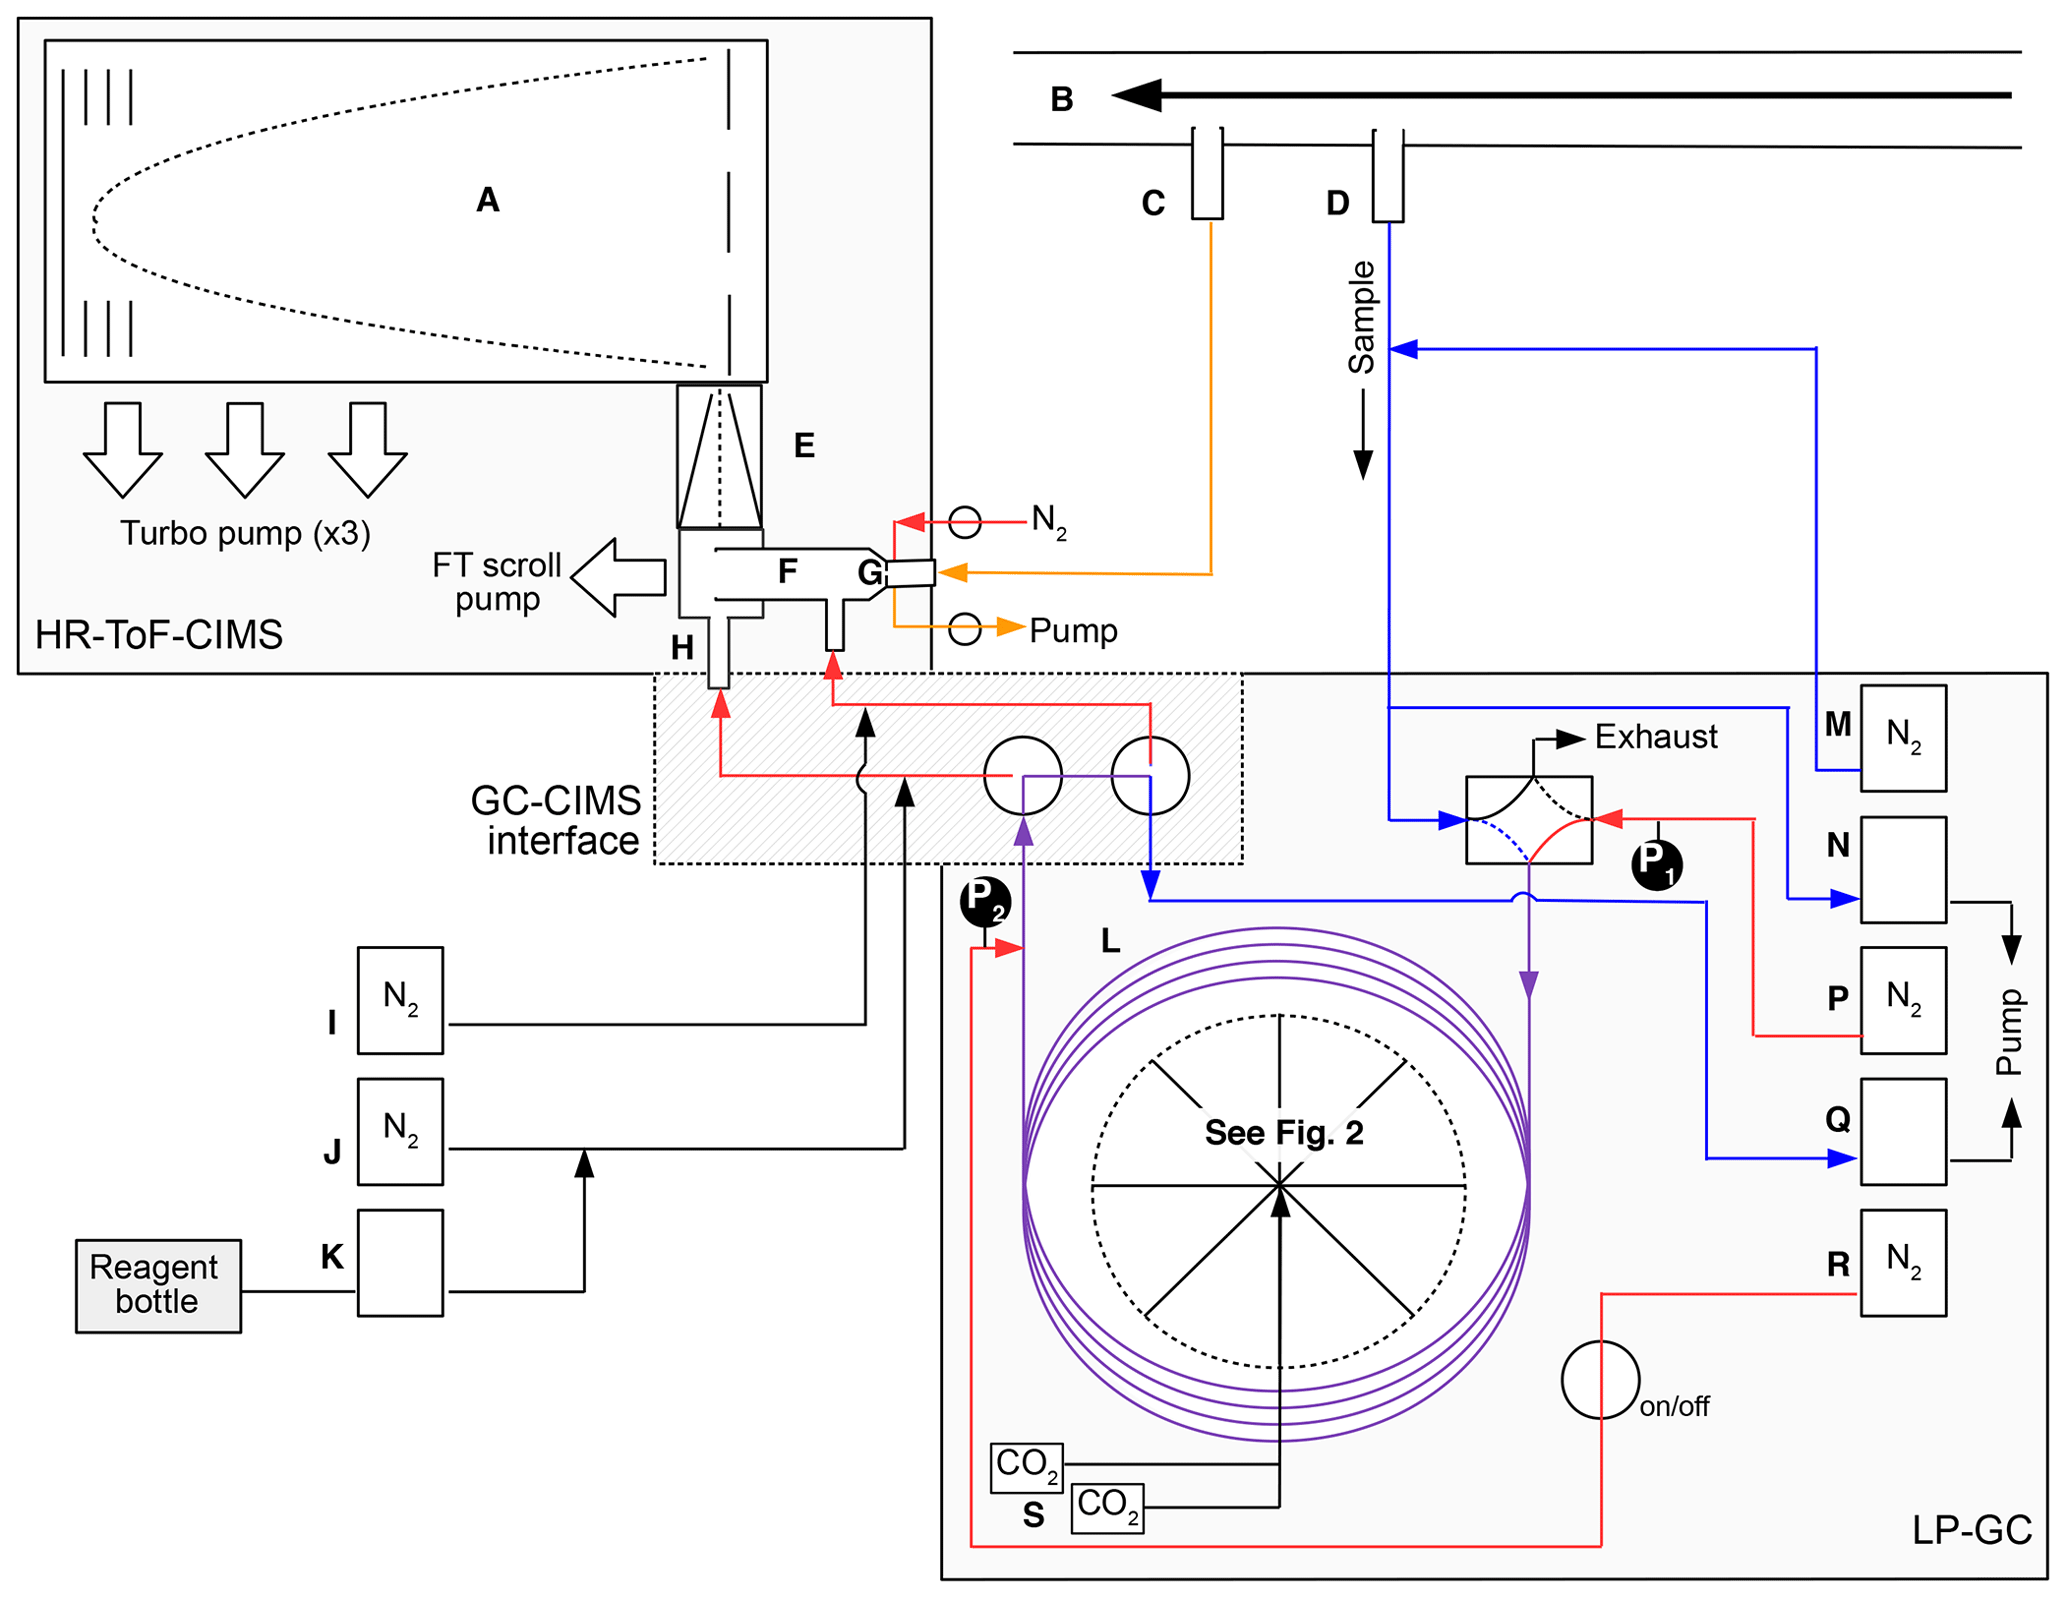
Figure 1A simplified instrument schematic of GC-HRToF-CIMS showing the HRToF-CIMS, the LP-GC, and the interface between the two systems. The main components are (A) time-of-flight mass spectrometer, (B) Teflon-coated glass inlet, (C) CIMS sampling port, (D) GC–CIMS sampling port, (E) hexapole ion guide, (F) Teflon-coated glass flow tube, (G) critical orifice, (H) 210-Po ionization source, (I) CIMS dilution flow, (J) CIMS ion source dilution flow, (K) CF3OOCF3 reagent flow, (L) GC column and cryotrap, (M) GC dilution flow, (N) GC sample intake pump, (P) GC column flow, (Q) GC bypass pump, (R) GC N2 pickup flow, and (S) CO2 solenoid valves. Pressure gauges at the head and tail of the column are denoted by P1 and P2, respectively. Select instrument flow states are differentiated by the various line colors, for which orange represents the flow path during direct CIMS sampling, blue represents the path GC trapping, and red represents the path during GC elution. Analytical lines that are used during both GC trapping and eluting are purple. Diagram is not to scale.
2.1 HRToF-CIMS
The HRToF-CIMS builds upon methods developed with a previous custom-built quadrupole CIMS (Crounse et al., 2006). Ambient air is drawn at high flow rate (∼2000 slpm, P∼1 atm) through a custom Teflon-coated glass inlet (3.81 cm I.D. × 76.2 cm long; Fig. 1B). A small fraction of this flow is subsampled perpendicular to the main flow in order to discriminate against large particles and debris and directed to the CIMS, the GC, or a zeroing system through short lengths of 6.35 mm O.D. PFA tubing. When measured directly by the CIMS, ambient air, diluted with dry N2, flows through a fluoropolymer-coated (Cytonix PFC801A) glass flow tube (Fig. 1F) to ensure a well-mixed gas stream prior to chemical ionization by CF3O− reagent ions (m∕z 85). The flow tube pressure is held at 35 mbar and samples ambient air at a constant flow rate of 180 sccm as regulated by a critical orifice (Fig. 1G). This ambient air is then diluted by a factor of 10 with dry N2 (Fig. 1I). Two valves located upstream of this orifice ensure a constant mass flow through the flow tube by pumping on the inlet (∼0.5 slpm). When the instrument switches to a different analysis mode (e.g., performs a GC or zeroes), these valves are toggled to overfill the flow tube with dry nitrogen and prevent ambient air from being sampled through this flow path.
The CF3O− ion chemistry has been described in detail elsewhere (Amelynck et al., 2000a, b; Crounse et al., 2006; Huey et al., 1996; Hyttinen et al., 2018; Paulot et al., 2009a, b; St. Clair et al., 2010). Briefly, CF3O− is formed by passing 380 sccm of 1 ppmv CF3OOCF3 in N2 through a cylindrical tube (Fig. 1H) containing a layer of polonium-210 (NRD LLC P-2021, initial activity: 370 MBq). Alpha particles produced from the radioactive decay of the polonium react with the N2 gas to produce electrons that react rapidly with CF3OOCF3 to produce CF3O− ions, which, in turn, react with analytes by forming clusters (m∕z = analyte mass + 85) or fluoride-transfer (m∕z = analyte mass + 19) product ions. This method allows for the detection of small organic acids and other oxygenated multifunctional compounds with high sensitivity (LOD ≈ 10 pptv during direct sampling for 1 s integration period) and minimal fragmentation.
Following ionization, the ions are directed via a conical hexapole ion guide into the high-resolution mass spectrometer (Tofwerk), which collects data for masses between m∕z 19 and m∕z 396 at 10 Hz time resolution. The HRToF-CIMS has a mass resolving power of ∼3000 m/Δm, allowing for the separation of some ions with different elemental composition but the same nominal mass.
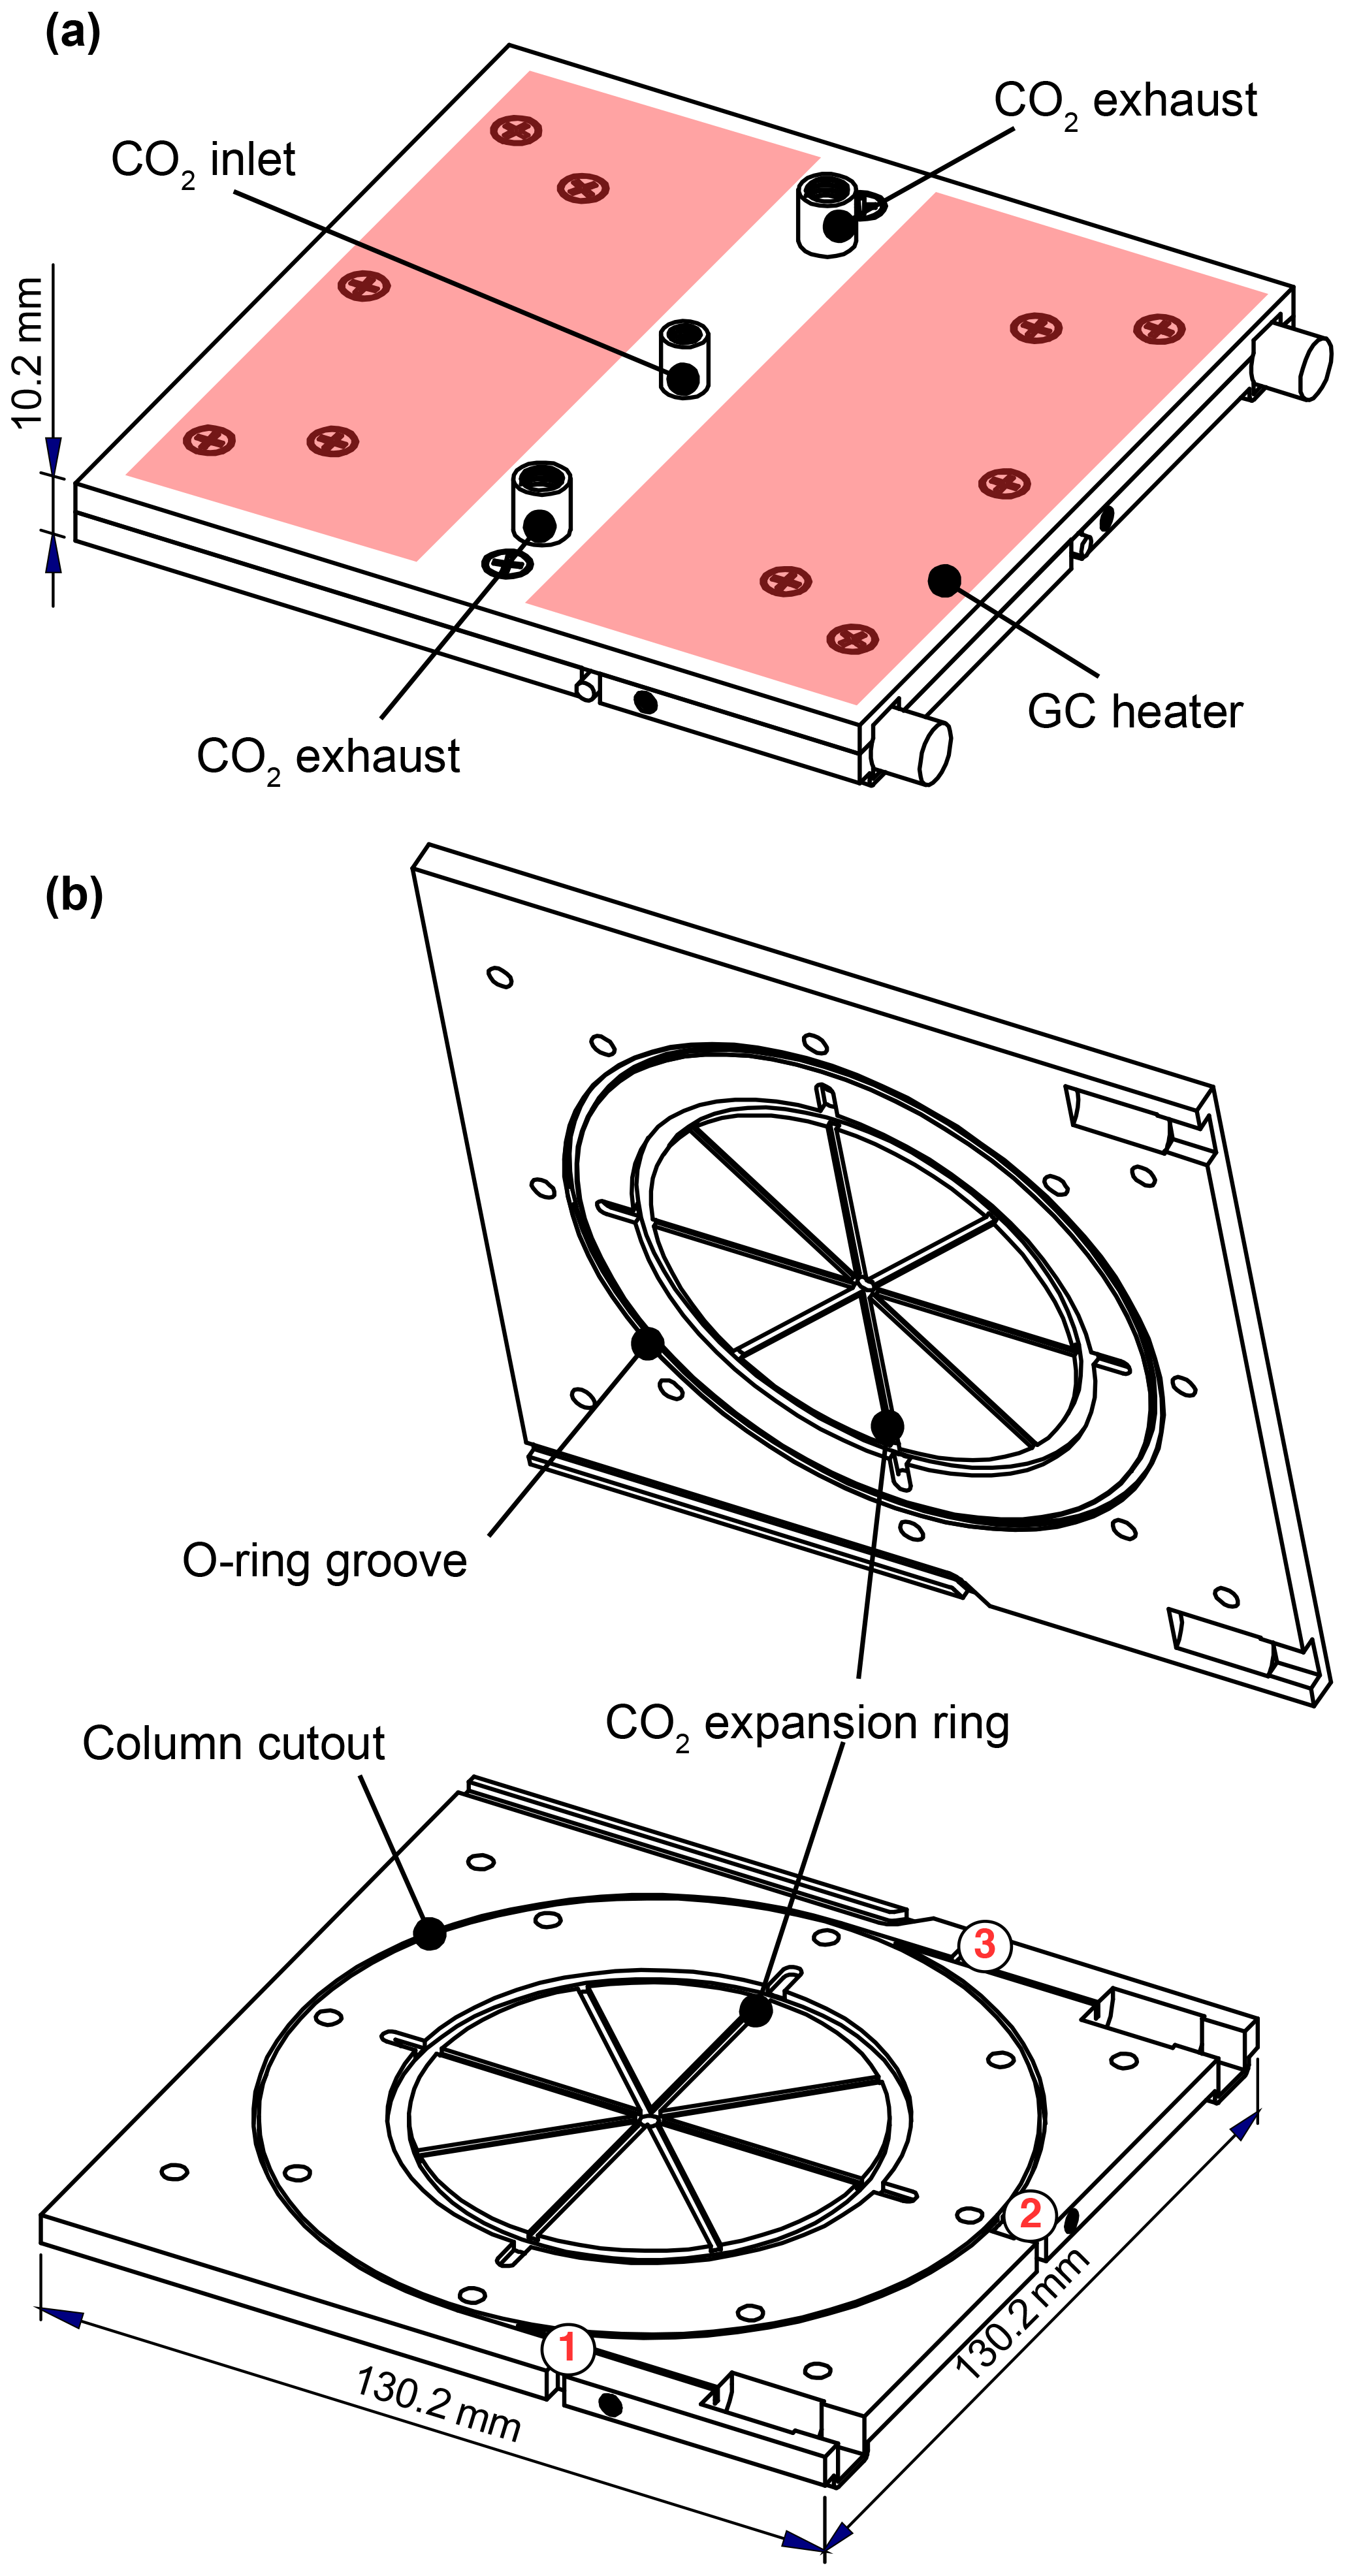
Figure 2Schematic of the GC cryotrap and heating unit. Column sits in a groove machined into one plate, providing good thermal contact. CO2 enters from the center of both plates and expands in the eight radial spokes before exiting through four exhaust ports. Heaters are adhered to the outside of the GC assembly; two of these heaters are shown above in red. The temperature is measured at three locations near the column: (1) near the inlet of the column, (2) on the column ring, and (3) near the outlet of the column.
2.2 GC
2.2.1 Design and automation
Chromatographic separation of analytes is achieved on a short (1 m) megabore column encased between two aluminum plates. These plates measure 130 mm × 130 mm × 5 mm (total mass = 466 g), creating the compact design shown in Fig. 2. The column is housed within a rectangular groove (0.8 mm wide × 2.4 mm deep) machined into the bottom plate, which serves to hold the column in place and provides for good thermal contact with the metal as it loops 2.5 times around the plate. The temperature of the metal assembly can be controlled over a large range (−60 to 200 ∘C; maximum heating rate of 42 ∘C min−1) using a combination of CO2 coolant and an electrical heating system that consists of a temperature ramping controller (Watlow F4 series), heaters (∼400 W; KH series, Omega; Fig. 2a), and three resistance temperature detectors (RTDs, F3102, Omega; Fig. 2b, numbered). Sample collection and elution are controlled using automated solenoid valves (NResearch, Inc.) to direct gas to one of a number of vacuum outlets (Fig. 1F, H, and Q). These processes occur in parallel with direct CIMS sampling to minimize interruptions in data collection.
The GC is cooled through the evaporation and expansion of liquid CO2, which enters from the center of each plate and flows along eight radial grooves. An O-ring seal forces the CO2 to exit through ports located near the radius of the column. The movement of the CO2 from the center to the outside of the plate establishes a temperature gradient in the same direction. Symmetry enables the entire column to remain at a similar temperature, in spite of this gradient. In contrast, a previous version of this GC assembly used during this instrument's first deployment allowed CO2 to enter from a single point along the column diameter (see Supplement Fig. S1), resulting in large temperature gradients across the column and degradation of the chromatography (e.g., irregular peak shapes).
The CO2 flow is controlled by two solenoid valves (Series 9, Parker; Fig. 1S) connected to ∼29 cm × 0.25 mm I.D. and ∼35 cm × 0.15 mm I.D. PEEK restrictors. With both valves open, a total CO2 flow rate of 25 slpm (as gas) is admitted to cool the GC assembly to −20 ∘C within the allotted 10 min period. During trapping, only the solenoid valve connected to the 0.15 mm I.D. restrictor remains open to minimize CO2 usage. Fine control over the GC temperature was accomplished by utilizing a proportional-integral-derivative (PID) control loop with the heaters and the RTD located on the column ring (Fig. 2, red no. 2 on the diagram). Additional efficiency was gained by insulating the GC assembly with Nomex™ felt and wrapping the felt with Kapton tape to prevent water vapor from diffusing to and condensing on the cold plates, as well as placing the entire instrument in a temperature-controlled, weatherproofed enclosure (see Sect. 2.4). Altogether, this resulted in reproducible temperature profiles with minimal temperature gradients across the column (less than 2 ∘C) during field operation (see Fig. S2).
2.2.2 Operating parameters
To initiate sample collection, ambient air is subsampled from the main instrument inlet (1 slpm; Fig. 1N) and diluted by a factor of 15 to 30 (Fig. 1M), depending on the relative humidity (RH) of the sample. The diluted air is pulled through the pre-cooled 0.53 mm I.D. RTX-1701 megabore column (Restek) by a flow-controlled pump (220 sccm; Fig. 1Q) and targeted compounds are cryofocused on the head of the column over a 10 min period at −20 ∘C (as discussed in later sections, the choice of the dilution and trapping temperature is a compromise between adequately cryofocusing the maximum amount of analyte while avoiding the collection of water). Following collection, a four-port Teflon solenoid valve (SH360T042, NResearch) is switched, allowing N2 carrier gas to enter the column at a constant flow rate of 5 sccm (Horiba Z512, Fig. 1P), and two three-way valves (225T032, NResearch) are toggled to direct the column effluent to either the flow tube (Fig. 1F) or the ion source (Fig. 1H) of the mass spectrometer – in both configurations, the entire length of column is held under low-pressure conditions (<260 mbar at P1 [Fig. 1]). Compounds are then separated on the column using the following automated temperature program: a 3 min temperature ramp to 20 ∘C (∼13 ∘C min−1), followed by a 3 ∘C min−1 ramp to 50 ∘C, followed by a 10 ∘C min−1 increase to 120 ∘C for a total temperature ramping time of 20 min. Following completion of the temperature program, the column is baked at 120 ∘C for an additional 2 min to remove remaining analytes.
As mentioned above, connecting the GC outlet directly to the mass spectrometer allows the entire column to remain at sub-ambient pressures during elution (180 mbar (into ion source) or 260 mbar (into flow tube) at P1). This allows for low-pressure chromatography, which provides several advantages over conventional GC methods (Sapozhnikova and Lehotay, 2015). For instance, low pressures support the use of short, large bore columns without significant loss in peak separation. This becomes especially advantageous during cryotrapping as this larger I.D. column allows for a greater volume of analytes to be sampled, beneficially impacting the instrument signal-to-noise ratio. In addition, low-pressure conditions also allow for faster analysis times at lower elution temperatures (Table 2). The decrease in analysis time provides this instrument with sufficient time resolution to capture diurnal variations in measured species (one GC cycle per hour), while lower elution temperatures allow this method to be applied for analysis of thermally labile species, as discussed in later sections.
Mills et al. (2016)Mills et al. (2016)Table 2Comparison of elution temperature (∘C) and retention time (minutes, in parentheses) for isoprene nitrates.
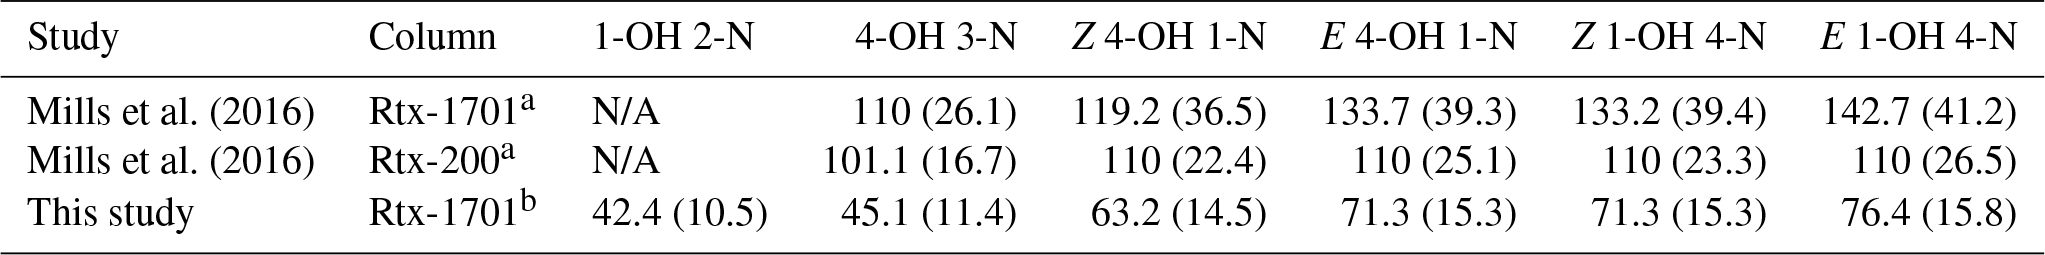
a Column is 30 m, 0.32 mm I.D., 1 µm phase thickness. b Column is 1 m, 0.53 mm I.D., 3 µm phase thickness
2.3 GC–CIMS interface
Following the column, a 100–200 sccm N2 pickup flow (Fig. 1R) is added to the 5 sccm column flow to decrease the residence time in the PFA tubing connecting the GC to the mass spectrometer. As mentioned above, solenoid valves direct the analytes into the CIMS instrument, either through the flow tube (similar to direct CIMS sampling) or directly into the ion source. Unlike direct ambient sampling, it is possible to pass the GC flow through the ion source as oxygen is not retained on the column during trapping. In other cases, oxygen that enters the ion source is ionized () and causes interferences at many m∕z values.
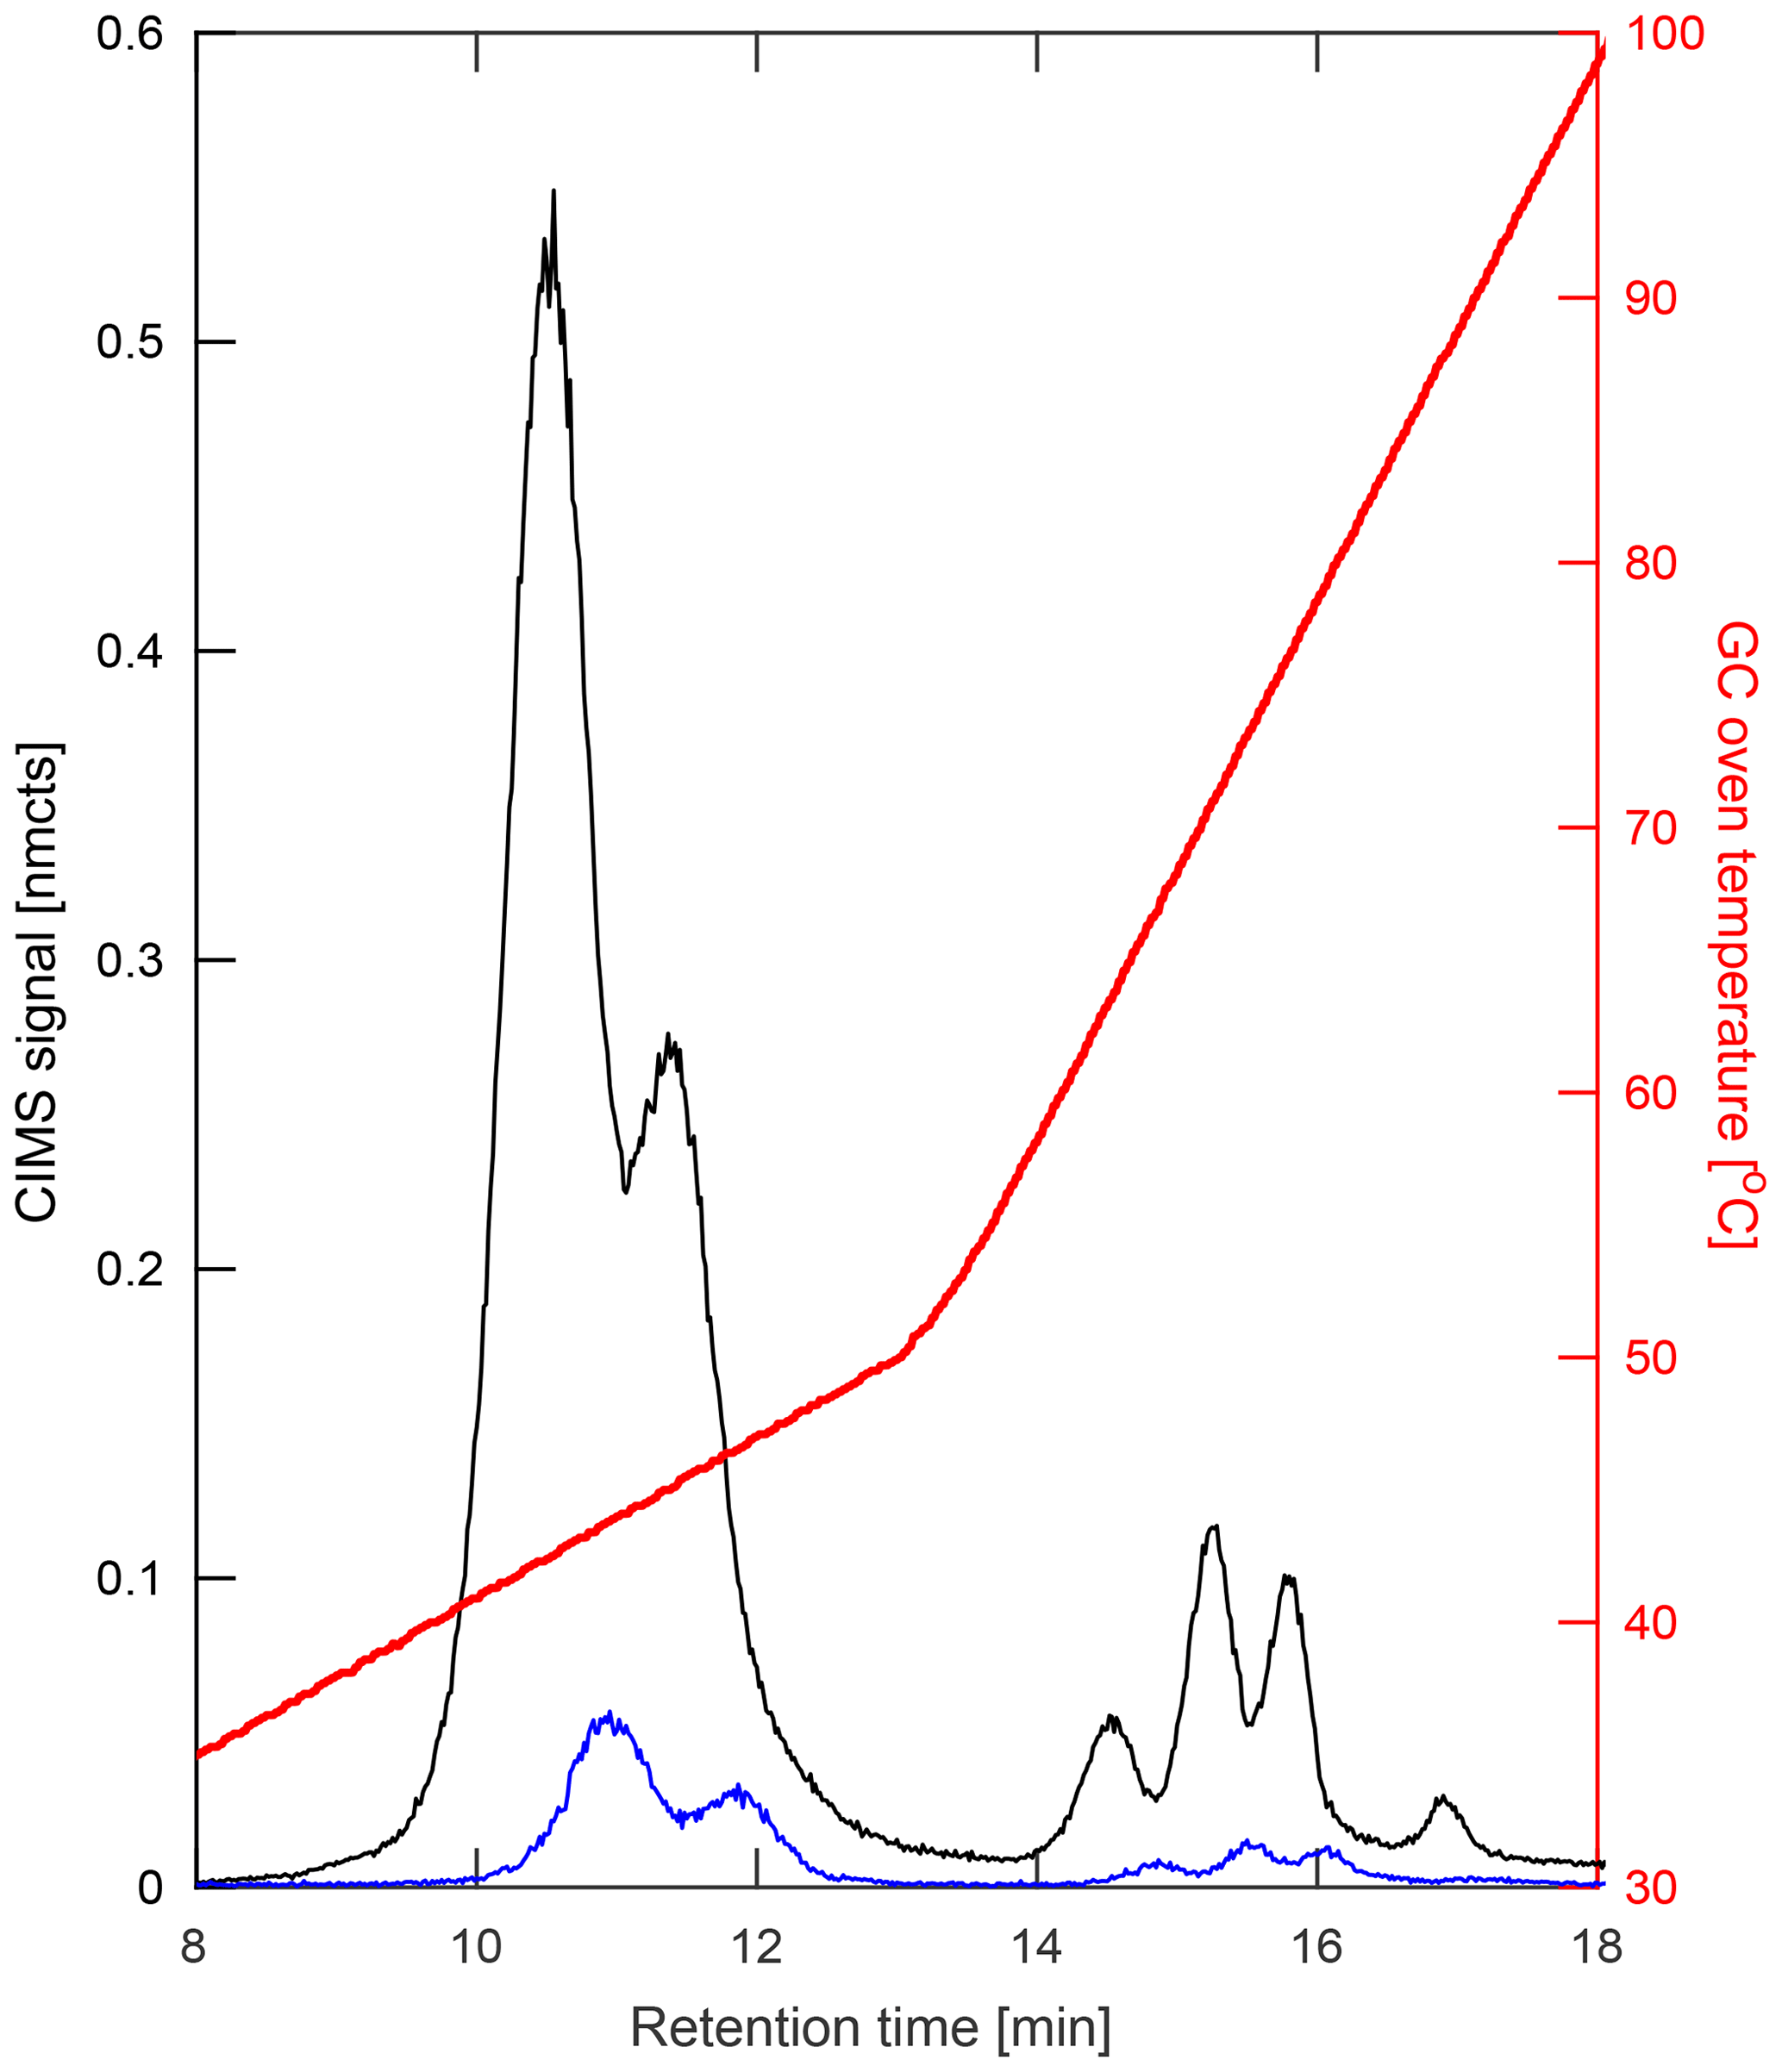
Figure 3Comparison of chromatograms of the IHN isomers obtained from the two different GC analysis modes in which the same amount of analyte is collected on the column but is directed into either the ion source (black) or flow tube (blue). GCs that are directed into the ion source result in approximately a 10-fold signal increase compared to flow tube GC analysis. In addition, compounds analyzed via the ion source typically elute at lower temperatures compared to flow tube analysis, an advantage for sampling fragile multifunctional compounds.
Figure 3 shows a comparison of two chromatograms obtained by these different analysis modes. Introduction via the flow tube (hereafter FT mode; Fig. 3, blue) allows for interaction of analytes with only CF3O− (and CF3O−-derived) reagent ions, providing a straightforward comparison to the direct CIMS samples as well as quantification of the GC transmission of analytes. However, due to tubing and gas flow configurations, the pressure within the column is greater under FT mode than when directed to the ion source region. Therefore, compounds tend to elute later and at higher temperatures, making introduction into the ion source (hereafter IS mode; Fig. 3, black) the preferred analysis mode when separating more thermally labile compounds in the current instrument configuration.
IS mode also creates an enhancement in instrument sensitivity due to the increase in analyte–reagent ion interaction time (as the analytes can interact with CF3O− as soon as it forms, rather than mixing with the ions downstream) and overall drier conditions. The enhancement in sensitivity is quantified through comparison to the direct CIMS measurements, which show a multiplicative enhancement factor that is nonlinearly dependent on the gas flow entering the ion source. For the instrument flows used in this work, the ion source enhancement was determined to be 9.8±0.8, which was determined by comparing peak areas produced when operating in FT vs. IS mode (see Supplement). Additional discrepancies between IS mode and direct CIMS measurements may result from analyte interactions with the metal walls of the ionizer. In addition, direct electron attachment to analytes (often followed by fragmentation) can occur in the ion source, though differences between the two GC modes are typically explained within error by the enhancement factor. These fragment ions, however, provide additional structural information. For example, different fragment ions may arise from the fragmentation of a primary nitrate versus a tertiary nitrate (see Fig. S6).
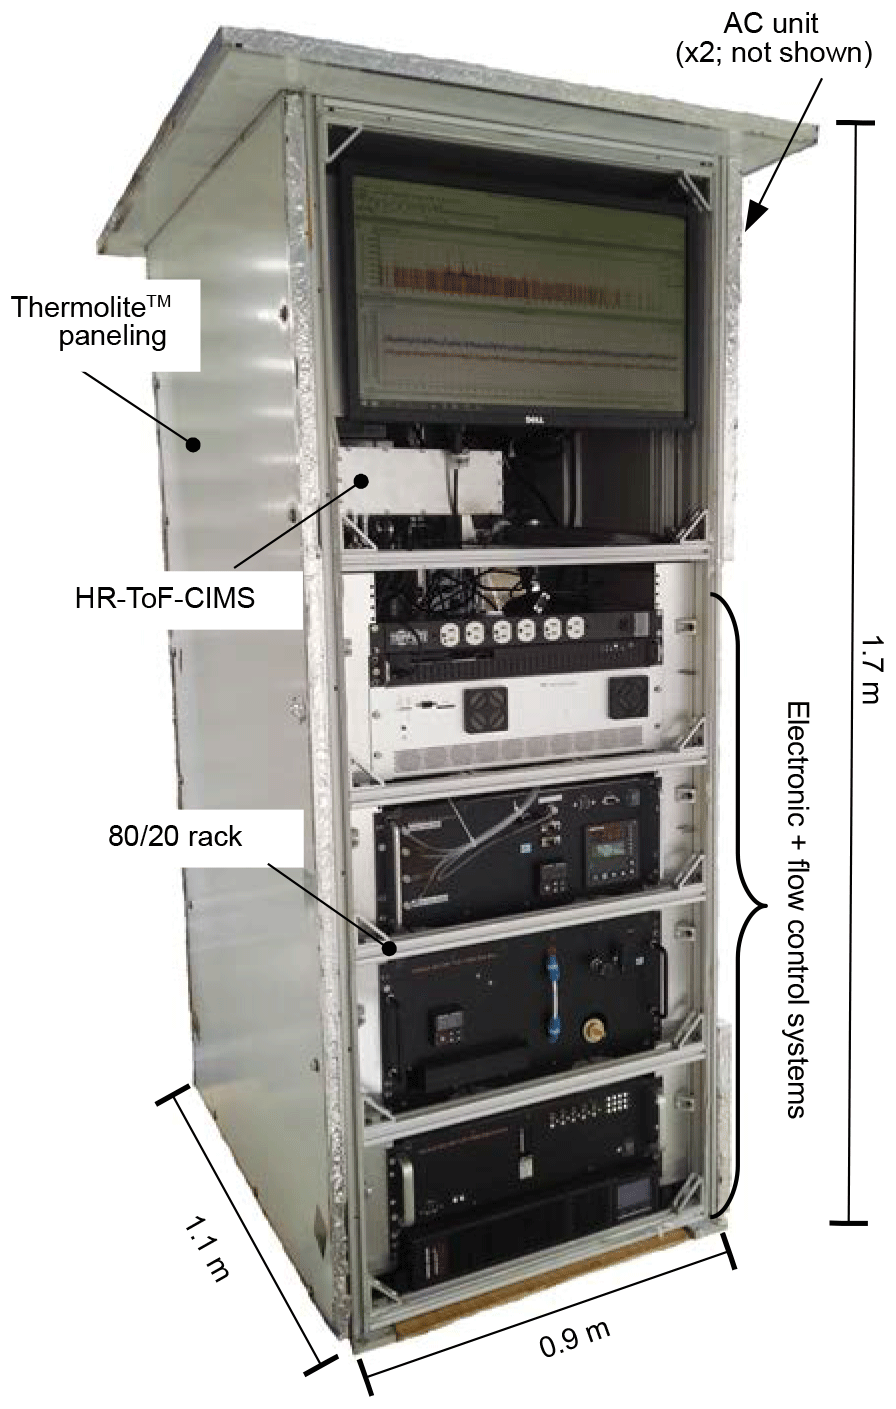
Figure 4The weatherproofed and temperature-controlled enclosure in which the instrument resides during field sampling. The front panel of the enclosure is removed in this photo.
2.4 Instrument housing and supporting equipment
The GC-HRToF-CIMS was placed in a weatherproofed, temperature-controlled enclosure during field sampling to protect the instrument electronics and allow for efficient GC cooling. In total, the instrument enclosure measured 1.1 m × 1.7 m × 0.9 m (), taking up a footprint of approximately 1 m2 (Fig. 4). Weatherproofing was created by using Thermolite™ insulated paneling (Laminators, Inc.) that covered the aluminum instrument rack (80∕20, Inc.) and was aided by weather stripping placed between the panels and the rack. For temperature control, two Ice Qube HVAC units (IQ1700B and IQ2700B, Blade series, cooling power = 498 and 791 W, respectively) were attached to one side of the enclosure to remove the heat produced by the instrument. During the range of ambient temperatures experienced during these studies (8.7–37.8 ∘C), the internal temperature of the enclosure remained at or below 30 ∘C under normal operating conditions.
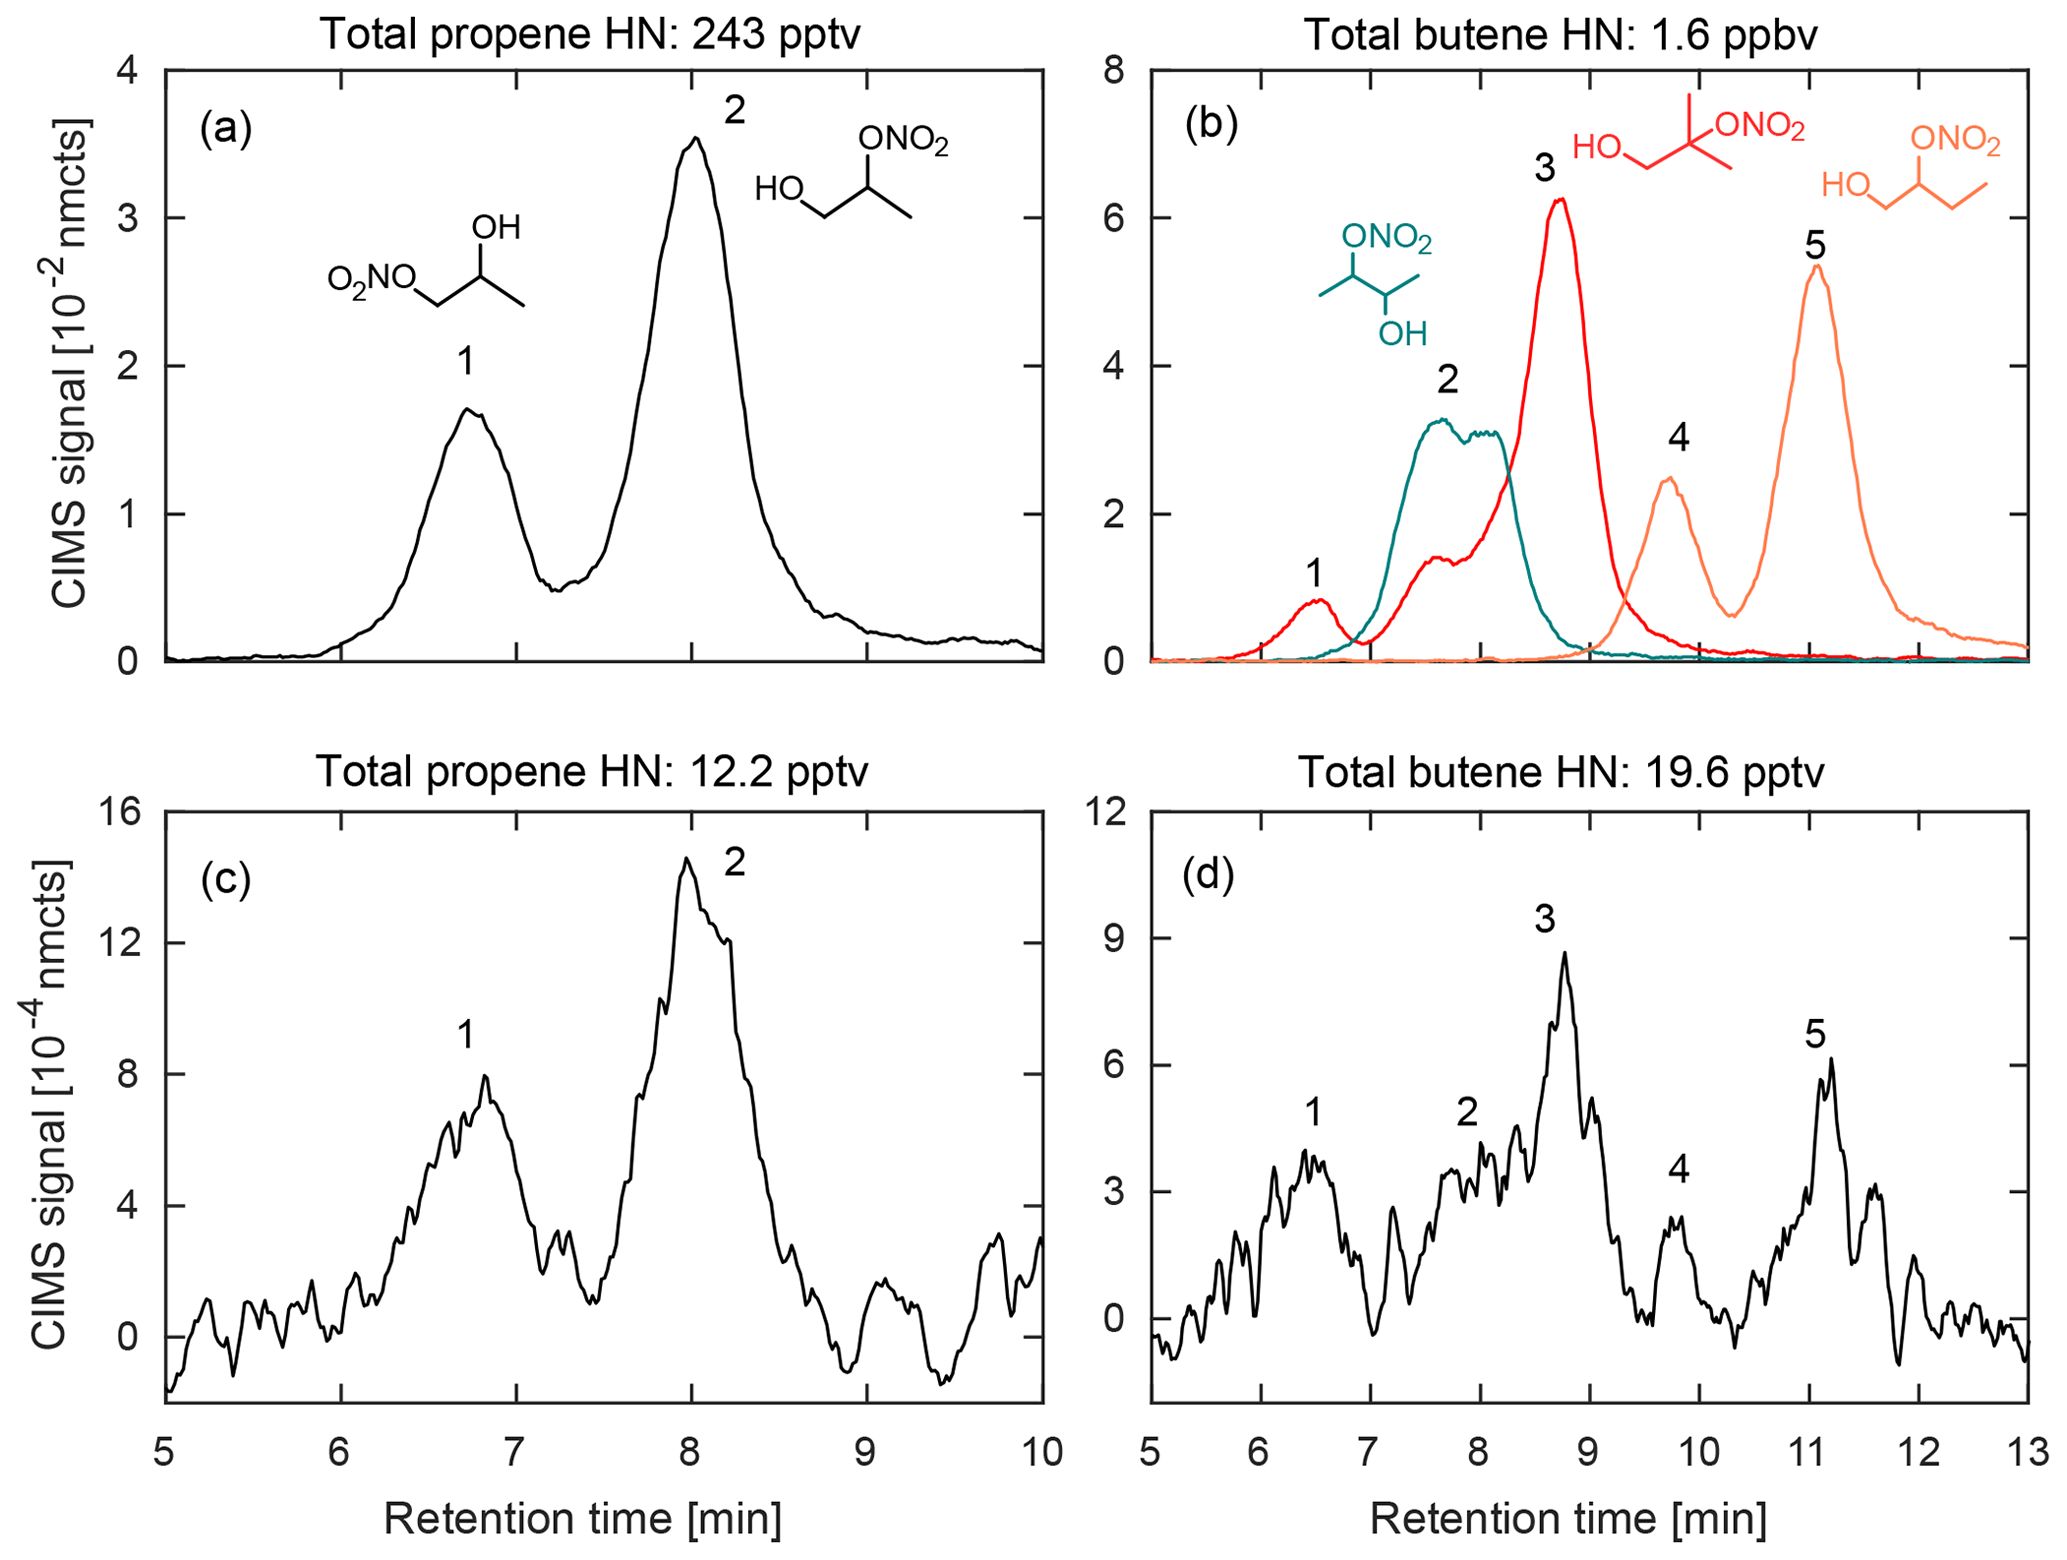
Figure 5Comparison of hydroxy nitrates formed during chamber experiments (a–b) from propene (left) and three structural isomers of butene (right; 1-butene (orange), 2-butene (teal), and 2-methyl-propene (red); dominant hydroxynitrate structures shown) with the corresponding m∕z signal observed during a 2017 field study in Pasadena, CA (c–d). Data shown are a 10 s average.
Along with the instrument enclosure, two scroll pumps (nXDS 20i, Edwards) were located separately from the instrument in their own weather-resistant container and were used to back the three turbomolecular pumps (TwisTorr 304 FS, Agilent) and the flow tube attached to the mass spectrometer. A weather station was also co-located with the instrument during the two field studies. It included sensors for air temperature, RH, solar irradiance, wind direction, wind speed, and atmospheric pressure.
2.5 Instrument calibration
Instrument sensitivity was assessed in the laboratory using a select number of commercially available compounds. These experiments were performed using authentic standards for hydrogen cyanide (HCN), sulfur dioxide (SO2), hydroxyacetone (HAc), and glycolaldehyde (GLYC). The absolute concentrations of these compounds were quantitatively determined by Fourier transform infrared (FTIR) spectroscopy before undergoing dilution and CIMS sampling (see Supplement for additional details regarding calibration procedures). However, because many compounds of interest are not commercially available and difficult to synthesize and purify, these four standard gases were simultaneously sampled on the cToF-CIMS (which uses the same chemical ionization technique) to directly compare the compound sensitivities between these two instruments. On average, the cToF-CIMS was observed to be 1.4 times more sensitive than the HRToF-CIMS for the four gases tested. We used this factor to proxy sensitivities for other compounds that had been previously determined for the cToF-CIMS through calibrations or estimated using ion–molecule collision rates as described in Paulot et al. (2009a), Garden et al. (2009), Crounse et al. (2011), Schwantes et al. (2015), and Teng et al. (2017).
For the chromatography, preliminary peak assignment was based on previous laboratory studies that were performed on the test bed this field deployable system was based upon (Bates et al., 2014; Lee et al., 2014; Nguyen et al., 2014; Praske et al., 2015; Teng et al., 2015), as detailed in the Supplement of Teng et al. (2017). Many of these studies used synthesized standards that had been developed for compounds such as ISOPOOH (Rivera-Rios et al., 2014; St Clair et al., 2016), IEPOX (Bates et al., 2014), and IHN (Teng et al., 2017), while others oxidized parent hydrocarbons in a chamber and determined elution orders based on assumptions regarding physical chemistry of reaction intermediates, as in Teng et al. (2015). However, due to differences in the analytical setups, verification of these assignments and their retention times have also been made for a number of targeted compounds through laboratory experiments described in more detail in the Supplement. The results from one of these studies is shown in Fig. 5, which compares the retention times for alkyl hydroxy nitrates derived from propene (propene HN) and three structural isomers of butene (butene HN) created in the chamber bag with chromatograms gathered in the field.
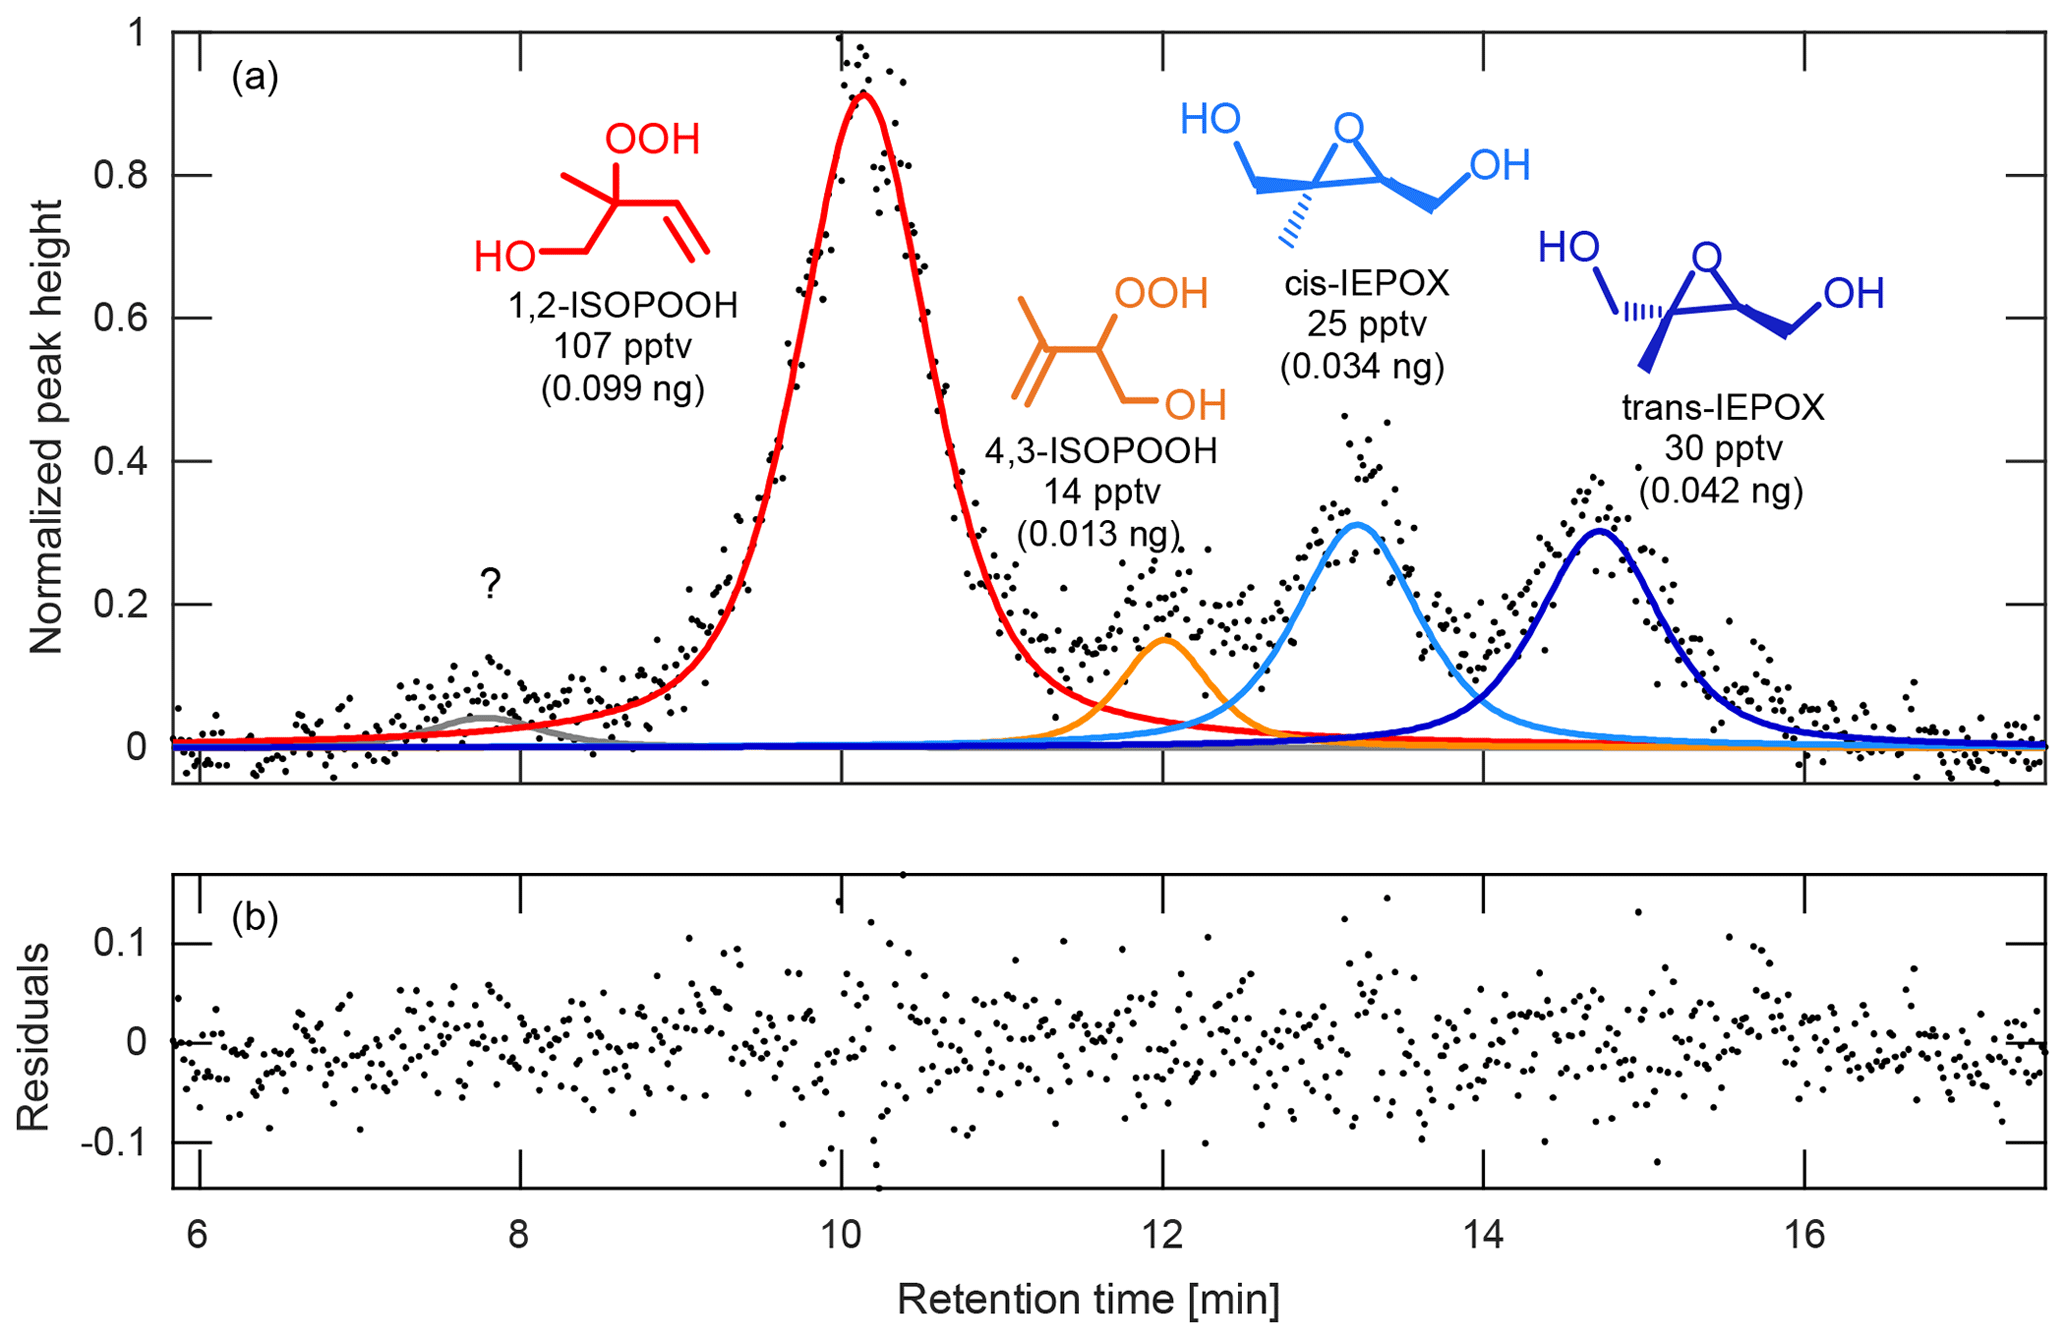
Figure 6(a) Chromatogram, peak fits, and (b) resulting fit residuals obtained from the peak-fit MATLAB function for the deconvolution and integration of ambient ISOPOOH and IEPOX isomers observed during the PROPHET 2016 field study. The isomers observed during this study were 1,2-ISOPOOH (red), 4,3-ISOPOOH (orange), cis-IEPOX (light blue), and trans-IEPOX (dark blue). In addition, an unknown peak (gray) can be seen eluting at 7.8 min prior to the ISOPOOH and IEPOX isomer species. To obtain the ambient mixing ratios, peaks are deconvoluted and integrated using an appropriate peak shape (in this case, a Gaussian–Lorentzian blend), scaled by the relative CIMS sensitivities of each isomer (see Supplement), ion source enhancement (if applicable), and estimated transmission factor, and then normalized by volume of air collected on the column. The GC signal shown here has been normalized to the largest peak height. Amounts shown in parentheses correspond to the amount of analyte trapped in the column.
2.6 Instrumental backgrounds
In the field, we use two methods to quantify the instrumental background signals caused by interfering ions present at targeted analyte masses. In the first method, the instrument undergoes a “dry zero” at which the CIMS flow tube is overfilled with dry nitrogen so that no ambient air is sampled during this time. In this method, the humidity within the instrument changes substantially compared with ambient measurements. The second method, an “ambient zero”, passes air from the main inlet through a zeroing assembly, which includes a sodium bicarbonate denuder and a scrubber filled with Pd-coated alumina pellets. The scrubbed air then enters the flow tube after instrument flows are adjusted to mimic near-ambient humidity levels. During field sampling, both zeroing methods occur twice each hour during a 6 min period that separates the CIMS and GC–CIMS measurements. The dry zero is most similar to the GC measurements and can assess the health of the instrument over the course of a campaign as these backgrounds should not change over time, while the ambient zero captures background signals that are adjusted for the water-dependent sensitivity of the compounds measured during direct CIMS sampling.
2.7 Data processing
Data from the mass spectrometer are collected using data acquisition software provided by Tofwerk (TofDaq). These data are later combined with the instrument component read-backs collected using single-board computers (Diamond Systems) and converted into a MATLAB file using in-house-developed scripts. To account for fluctuations in the reagent ion, observed mass signals are normalized to the signal associated with the isotope of the reagent ion (13CF3O−, m∕z 86) and its cluster with water (, m∕z 104). The analyte signal is defined as this normalized absolute number of counts (nmcts) recorded at m∕z.
For the chromatography, we modified an open-source MATLAB peak-fit function (O'Haver, 2017). Peak areas are determined for desired masses by subtracting a baseline and fitting the chromatograms with the appropriate peak shapes as shown in Fig. 6 for ISOPOOH and its isobaric oxidation product, isoprene epoxydiol (St Clair et al., 2016). These areas are then scaled by the relative CIMS sensitives of each isomer (see Supplement), ion source enhancement (if applicable), and a transmission factor. The resulting values are then normalized by volume of air collected on the column in order to obtain the corresponding ambient mixing ratios.
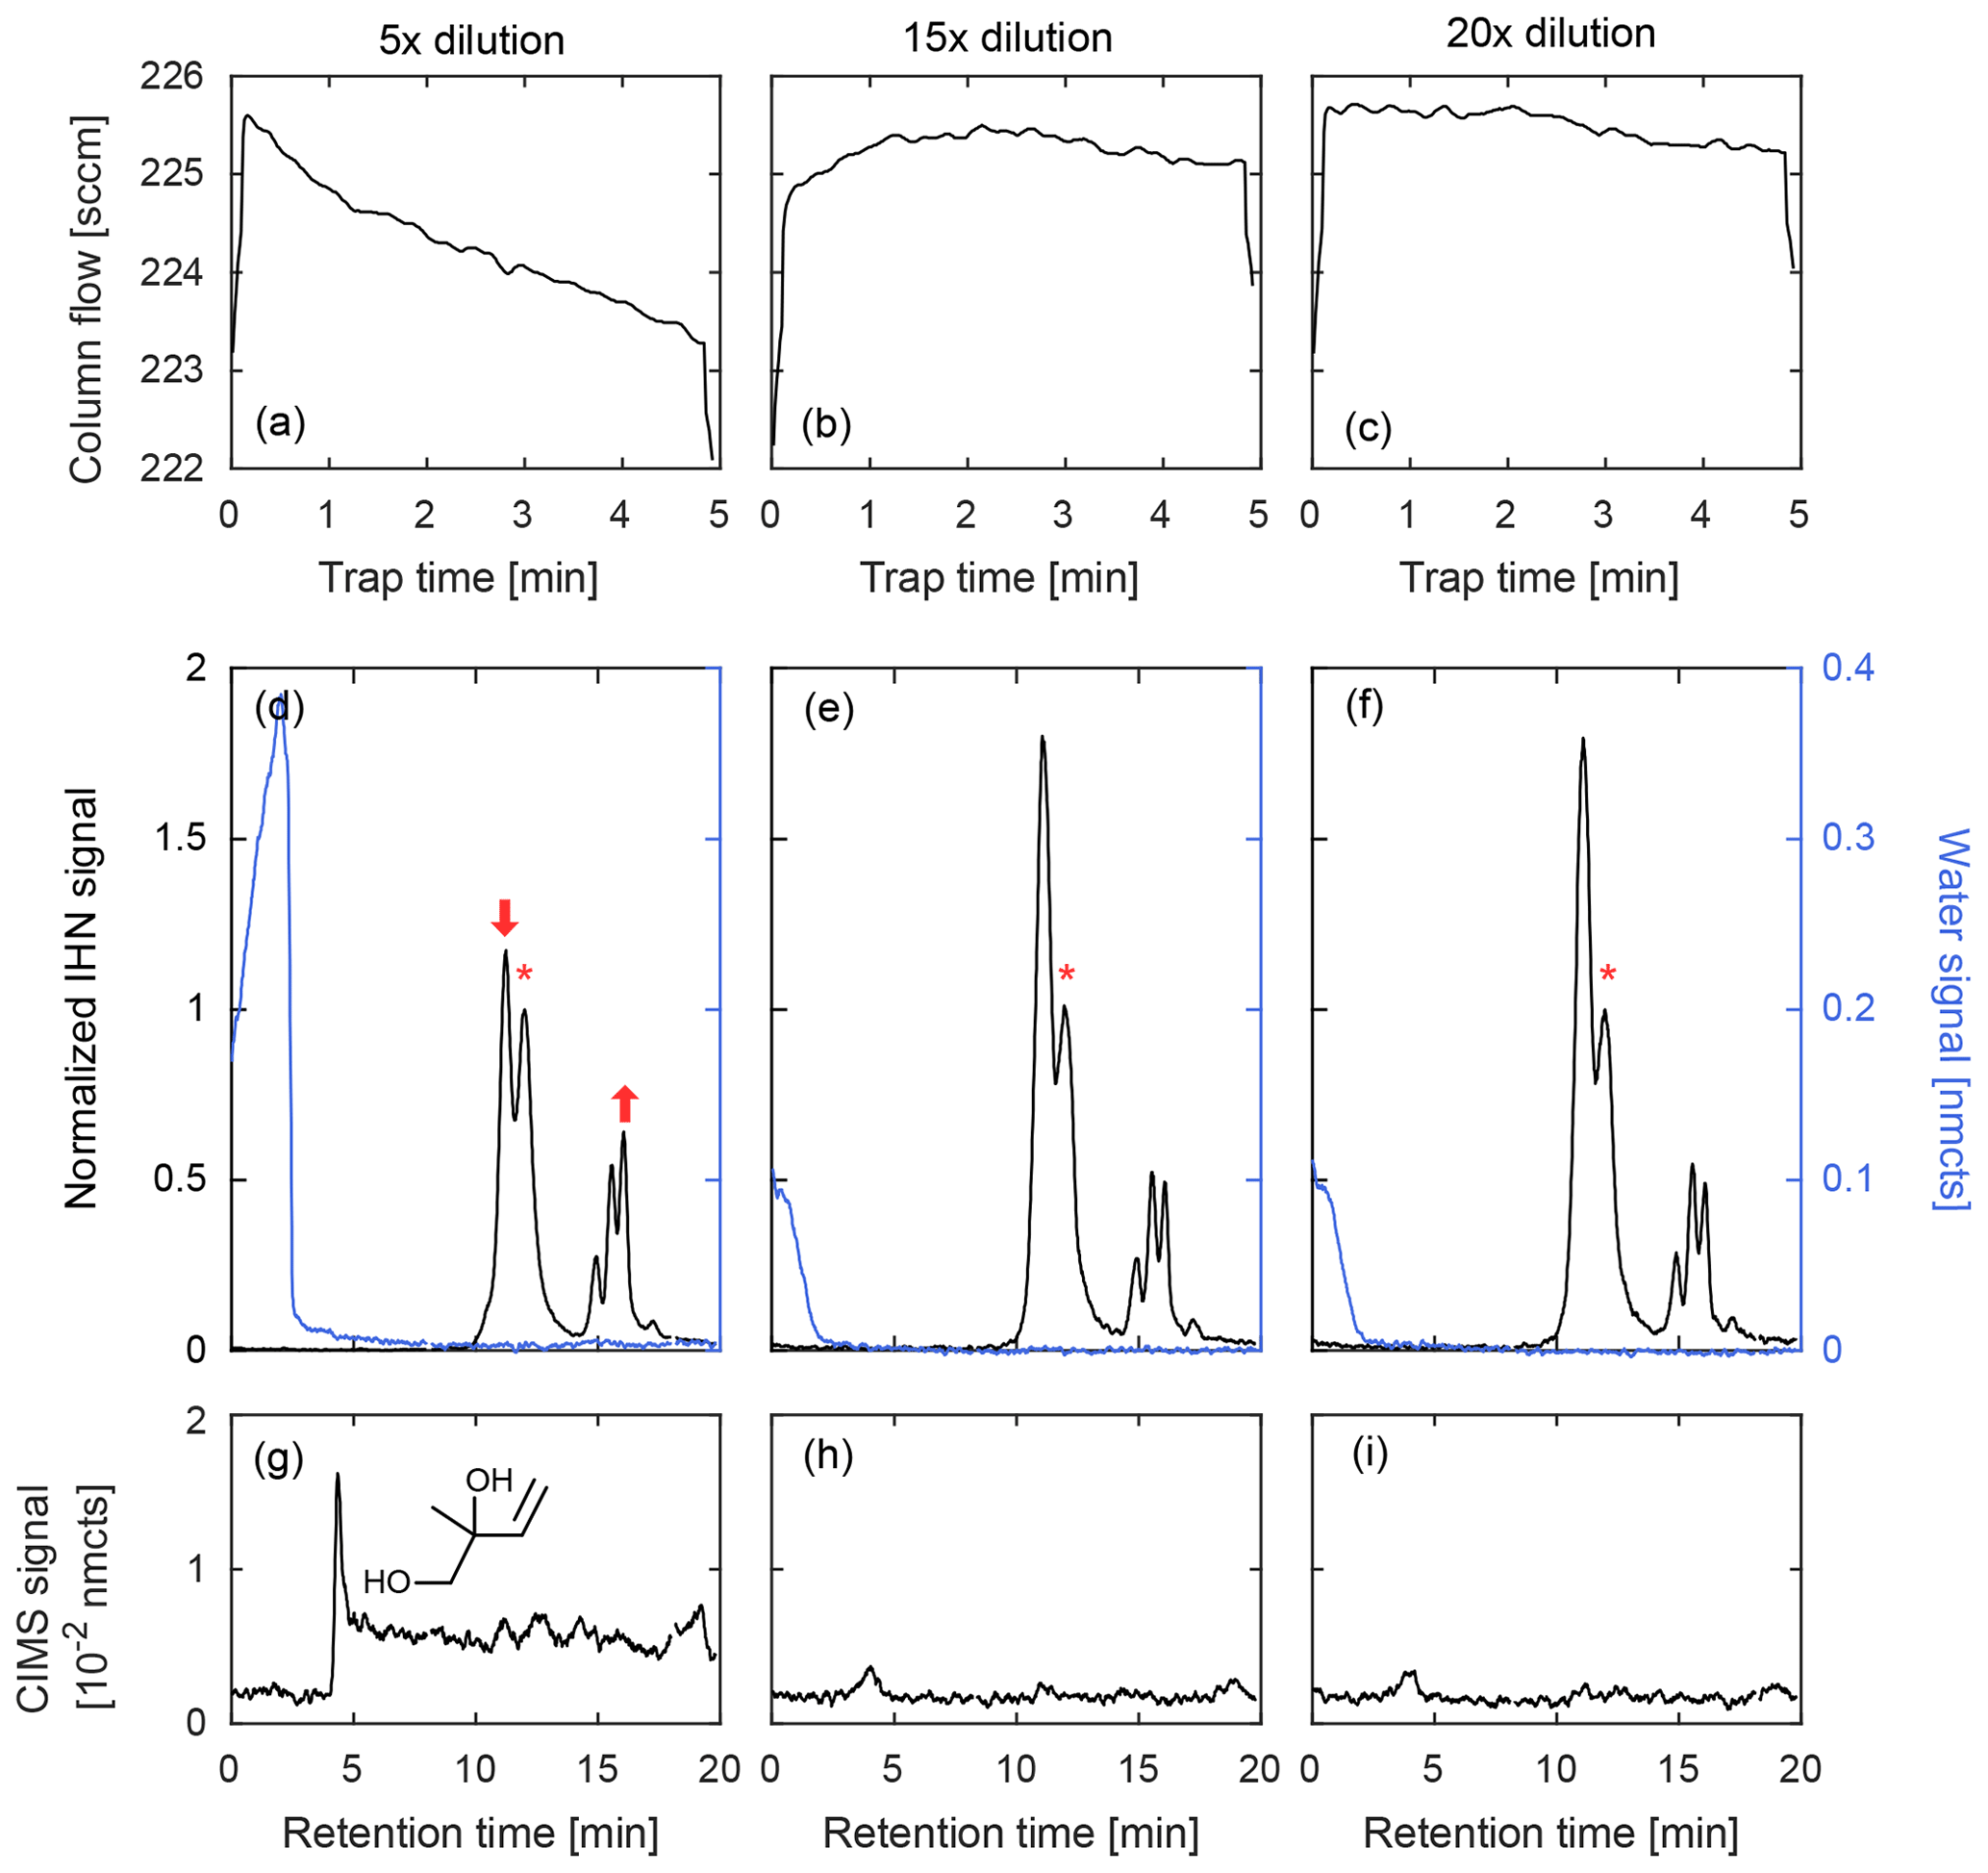
Figure 7Comparison of GC column flow (a–c) and three chromatograms (d–f) of IHN (m∕z 232, black) and water (m∕z 104, blue) at three different dilutions from a high-RH chamber experiment. The beginning of a chromatogram is marked when the temperature program initiates. When water is trapped during the lowest dilution (5×), column flow decreases (indicating an ice blockage) and the isomer distribution of IHN is dramatically altered as noted by a loss in the first peak (1,2-IHN) and increase in the last peak (E 1,4-IHN). These peak changes are marked by arrows and described relative to 4,3-IHN (*). The 1,2-isoprene diol (m∕z 187, g), an expected product of 1,2-IHN hydrolysis, is also observed in this scenario. However, when the sample is sufficiently diluted prior to trapping, the water signal quickly falls to background levels and isomer distribution is preserved with minimal diol formation. Column flow also remains relatively stable throughout the trapping period when minimal water is retained.
3.1 Sample collection
Due to their lower volatility and highly reactive nature, the accuracy and precision of ambient OVOC measurements can be greatly limited by the sample collection method. GC sampling techniques often used in atmospheric chemistry collect gas-phase compounds on solid adsorbents (e.g., TENAX®) that have been developed to combat some of the aforementioned issues (Demeestere et al., 2007; Ras et al., 2009). However, the use of OVOC-specific adsorbents has shown problems with the formation of artifacts caused by the reaction of ozone, NO2, and other compounds trapped on the sorbent surfaces (Klenø et al., 2002; Mills et al., 2016; Noziére et al., 2015) and can lead to significant analyte loss, especially for polar and/or labile compounds such as tertiary organic nitrates (as suggested in Mills et al., 2016), organic hydroperoxides, and other highly functionalized compounds. In addition, high humidity can result in increased water uptake into the sorbent materials during ambient sampling (Ras et al., 2009), requiring additional water removal steps such as the utilization of chemical scrubbers, which can react with compounds of interest (Koppmann and Wildt, 2008; Roukos et al., 2009), or trapping at above optimal temperatures, which may result in the loss of more volatile compounds (Roukos et al., 2009; Vairavamurthy et al., 1992). These issues motivate our use of dilution and cryotrapping on the column to transmit a wider range of analytes through our system.
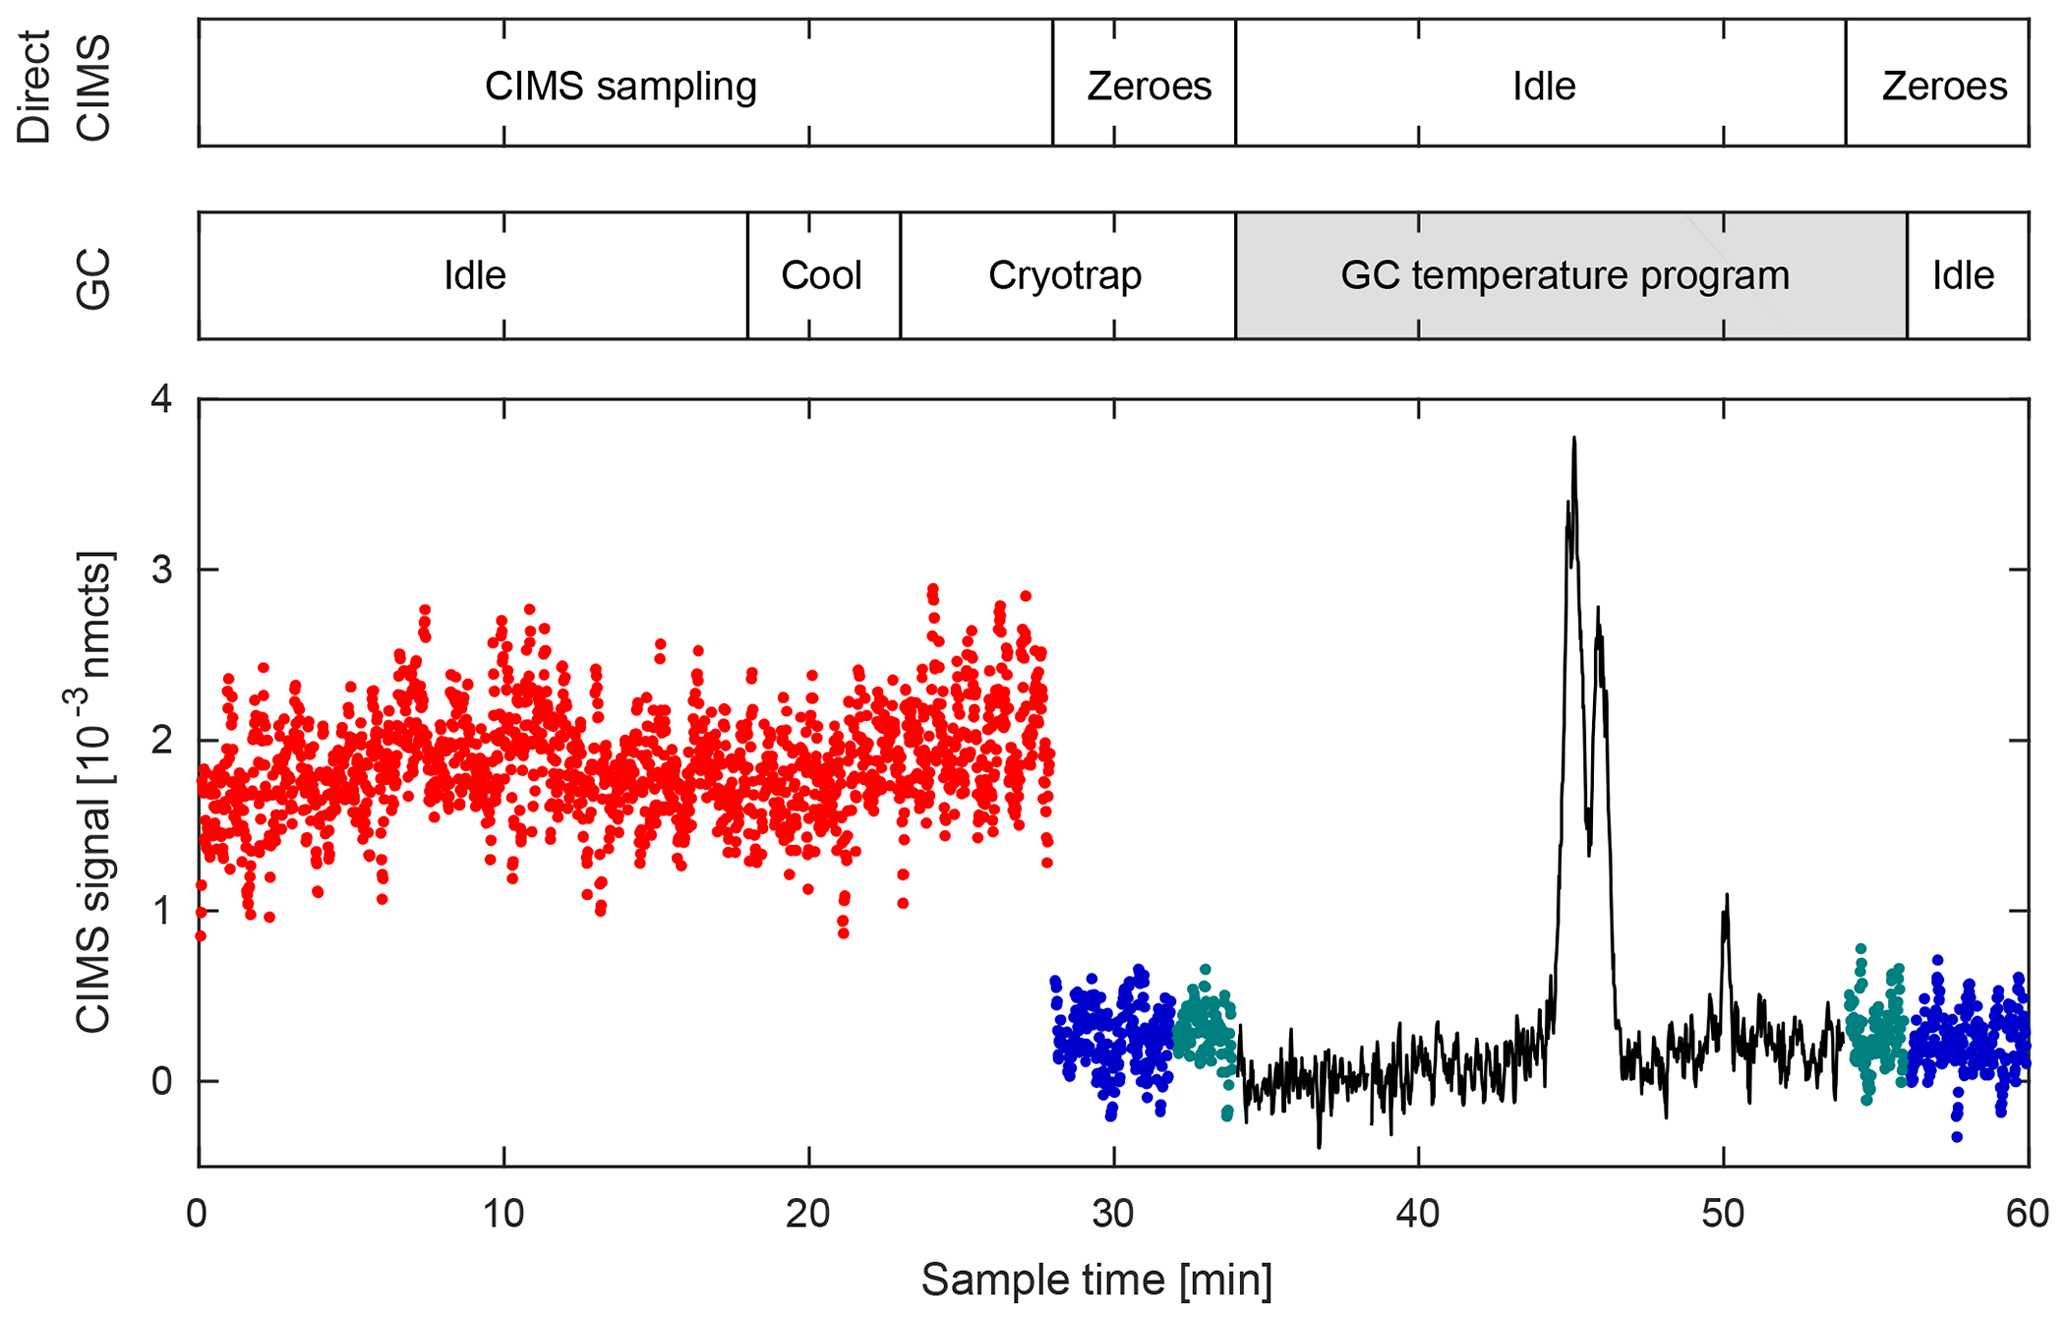
Figure 8Typical GC–CIMS sampling cycle during the 2017 field study in Pasadena, CA. Data shown for m∕z 232. Cycle has a period of 1 h in which the first half is dedicated to direct CIMS measurements (red), and the latter half measures compound signals that have undergone chromatographic separation (black). The two sampling modes are separated by a zeroing period comprised of a 4 min ambient zero (blue) and a 2 min dry zero (green). Most GC processes occur in the background during direct sampling, so as not to interrupt data collection. Data shown here are a 2 s average. Changes in the amount of flow entering the ion source during direct CIMS and GC–CIMS sampling directly correlate with the signal-to-noise ratio seen during each operating mode. The increased flow rate through the ion source during the GC sampling mode results in higher ion counts and an increased signal-to-noise ratio.
Trapping efficiency was assessed by cryofocusing a mixture of propene HN and IHN for varying amounts of time (and thus sample volumes) in order to test for linearity of the cryotrap. Results provided in the Supplement show that the GC peak area was linearly proportional to the volumes sampled, suggesting that compounds are preserved on the column during trapping (Fig. S3). Analyte breakthrough has been monitored in the laboratory by directing the GC flow into the CIMS during trapping to monitor analyte signals. For most compounds of interest (> C3), there has been no evidence of breakthrough under typical trapping conditions (−20 ∘C) when this procedure has been performed for a trapping period of up to 12 min, though we note chromatography can be significantly degraded prior to breakthrough, as the analytes spread to larger bands on the column.
Experiments were performed to determine if oxidants such as ozone and NO2 can interfere with targeted compounds trapped on the column. We oxidized isoprene under high-NOx conditions to produce IHN, as its isomer-specific reaction rate with ozone would make it apparent whether certain isomers were affected more than others. When we attempted to co-trap 100 ppb of NO2 and 200 ppb of ozone, our results show no evidence that either oxidant affects the IHN trapped on the column, even at lower dilutions (15×) and lower trapping temperatures (−50 ∘C).
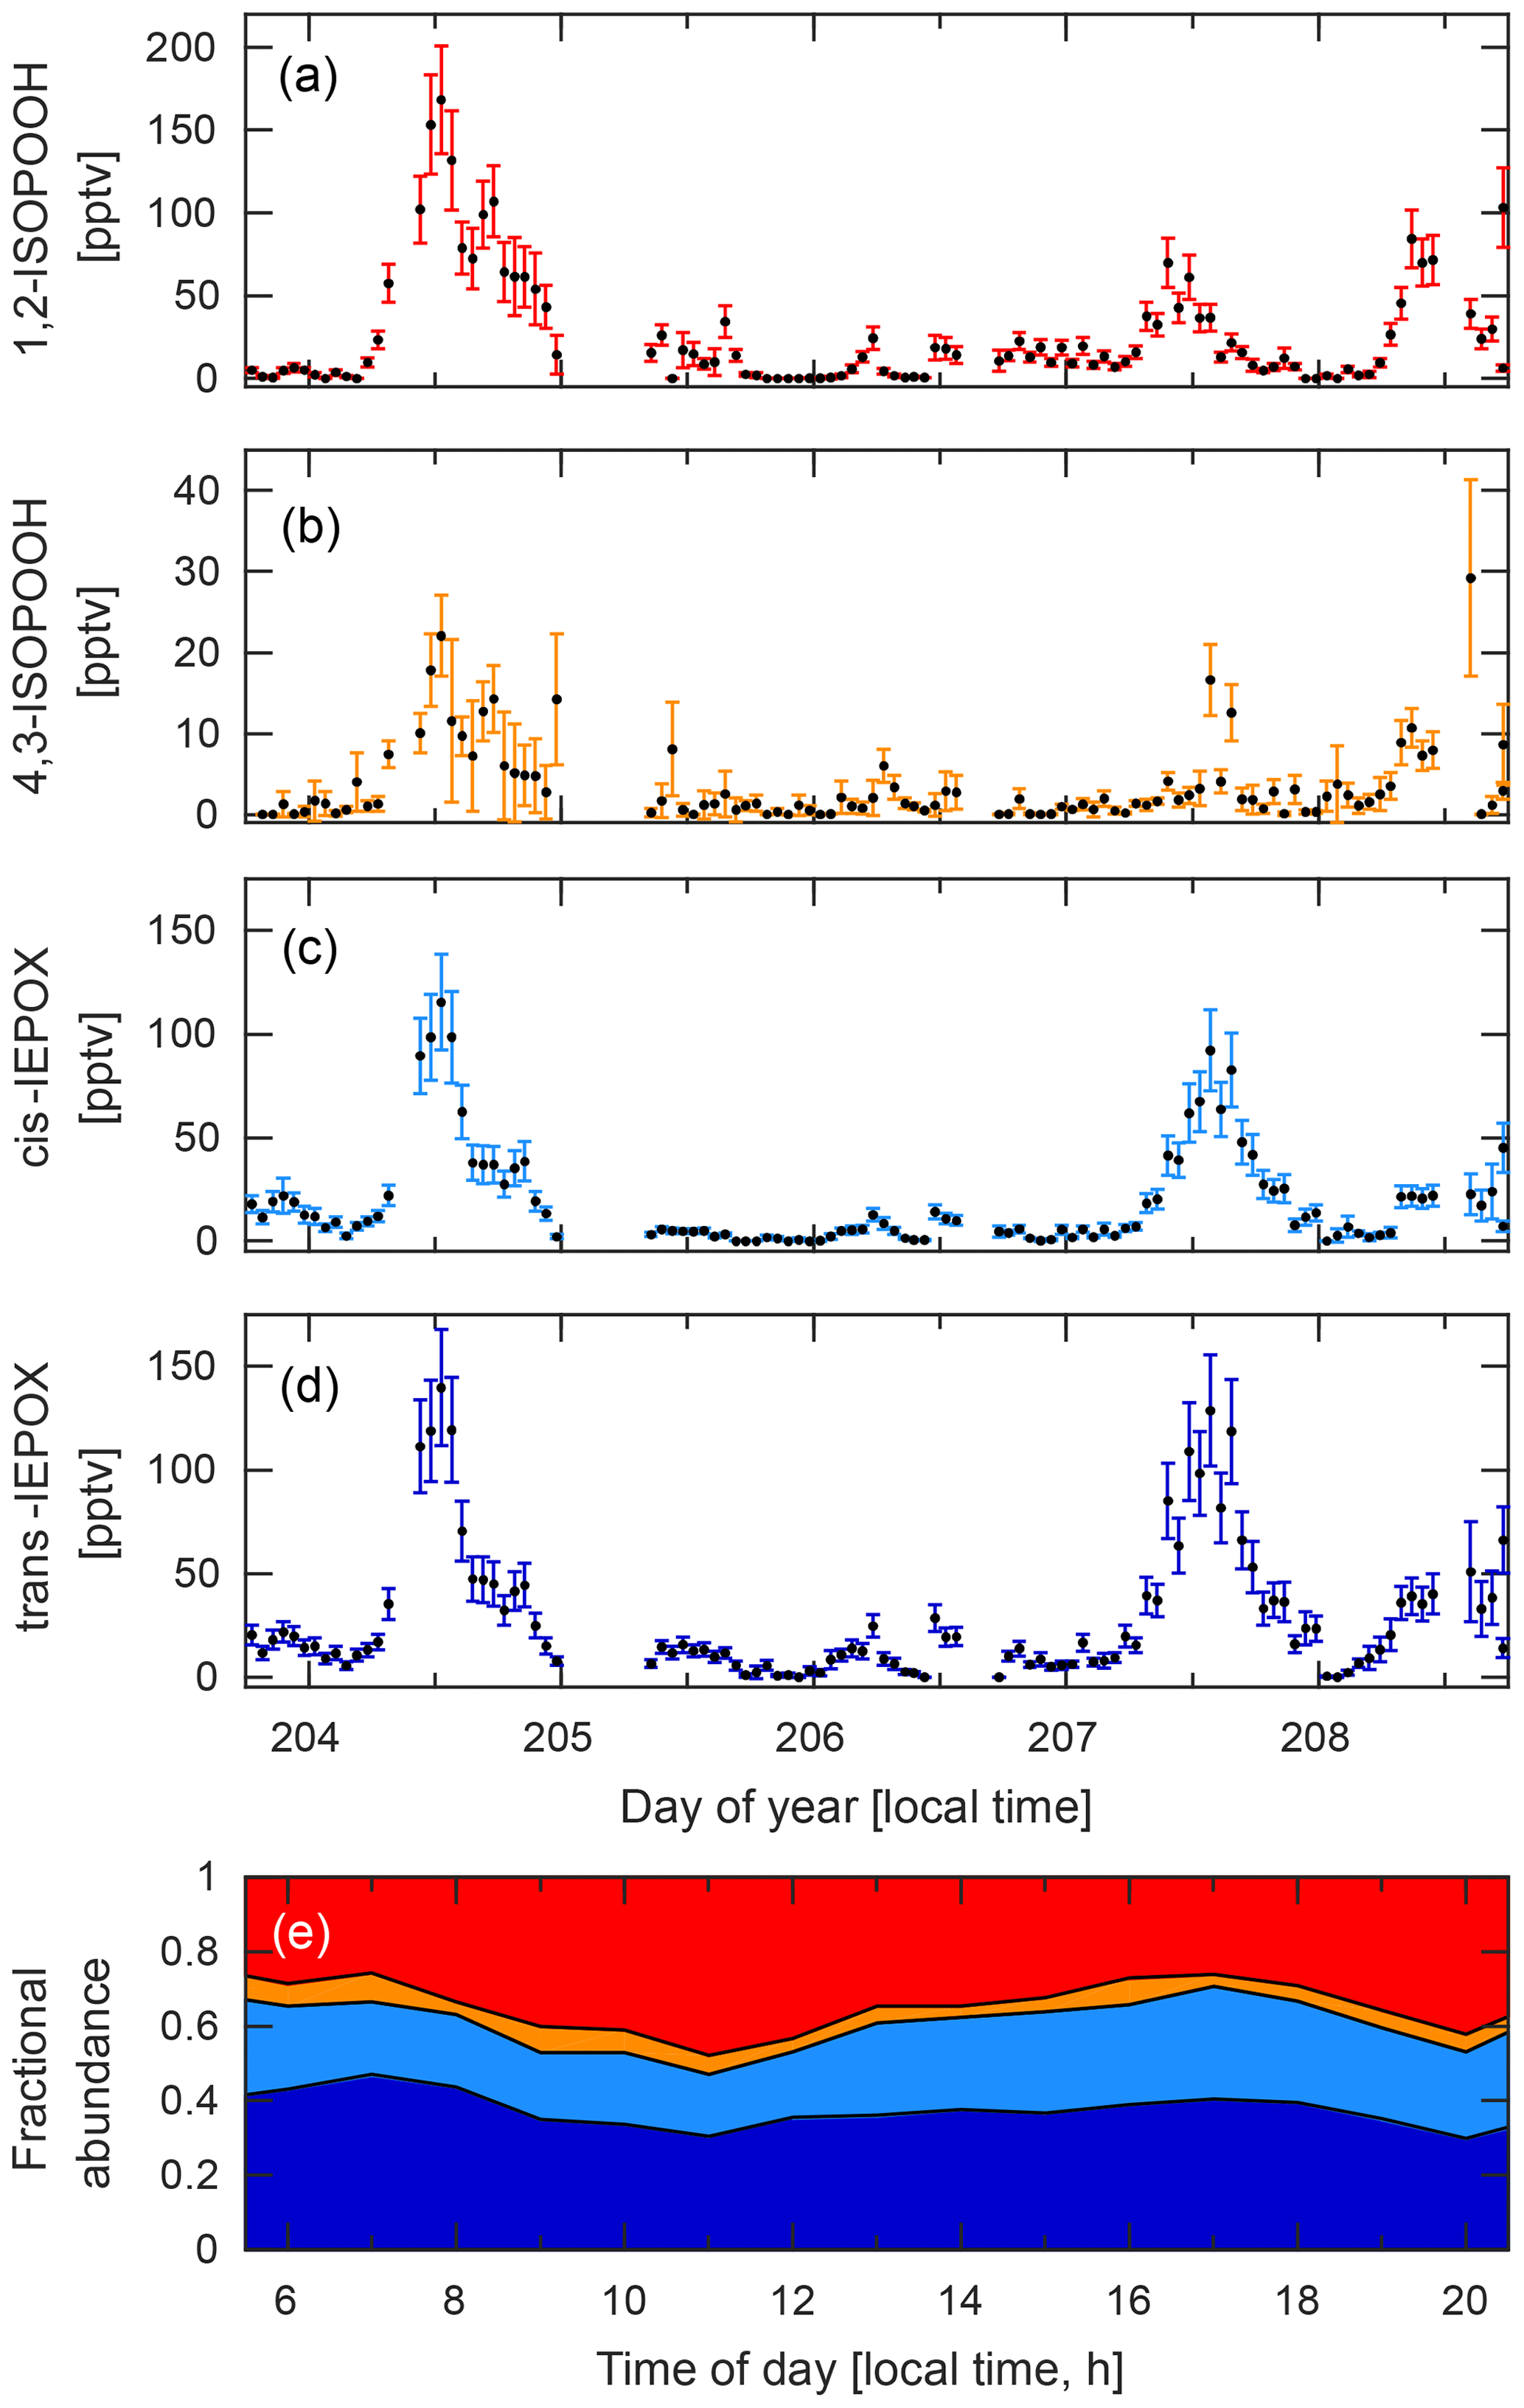
Figure 9Time series for the four isobaric species: (a) 1,2-ISOPOOH, (b) 4,3-ISOPOOH, (c) cis-IEPOX, and (d) trans-IEPOX. Data were collected during the PROPHET campaign between 22 and 27 July 2016. (e) Diurnal profile of the fractional abundance of each of these four isomers based on their hourly mean values calculated from the time series data shown here. Shaded areas correspond to 1,2-ISOPOOH (red), 4,3-ISOPOOH (orange), cis-IEPOX (light blue), and trans-IEPOX (dark blue).
3.1.1 Trapping temperature and column humidity
Our trapping temperature (−20 ∘C) was optimized on the original laboratory prototype and was chosen as a compromise between analyte retention and avoidance of water retention. We find that trapping above −20 ∘C results in degradation of the chromatography for several species, examples of which can be seen in the Supplement (Fig. S4). However, at −20 ∘C some higher-volatility compounds are not trapped efficiently, resulting in irregular peak shapes (Fig. S5). Further optimization of trapping conditions is needed in order to improve the chromatography for these species and further reduce the likelihood of water retention.
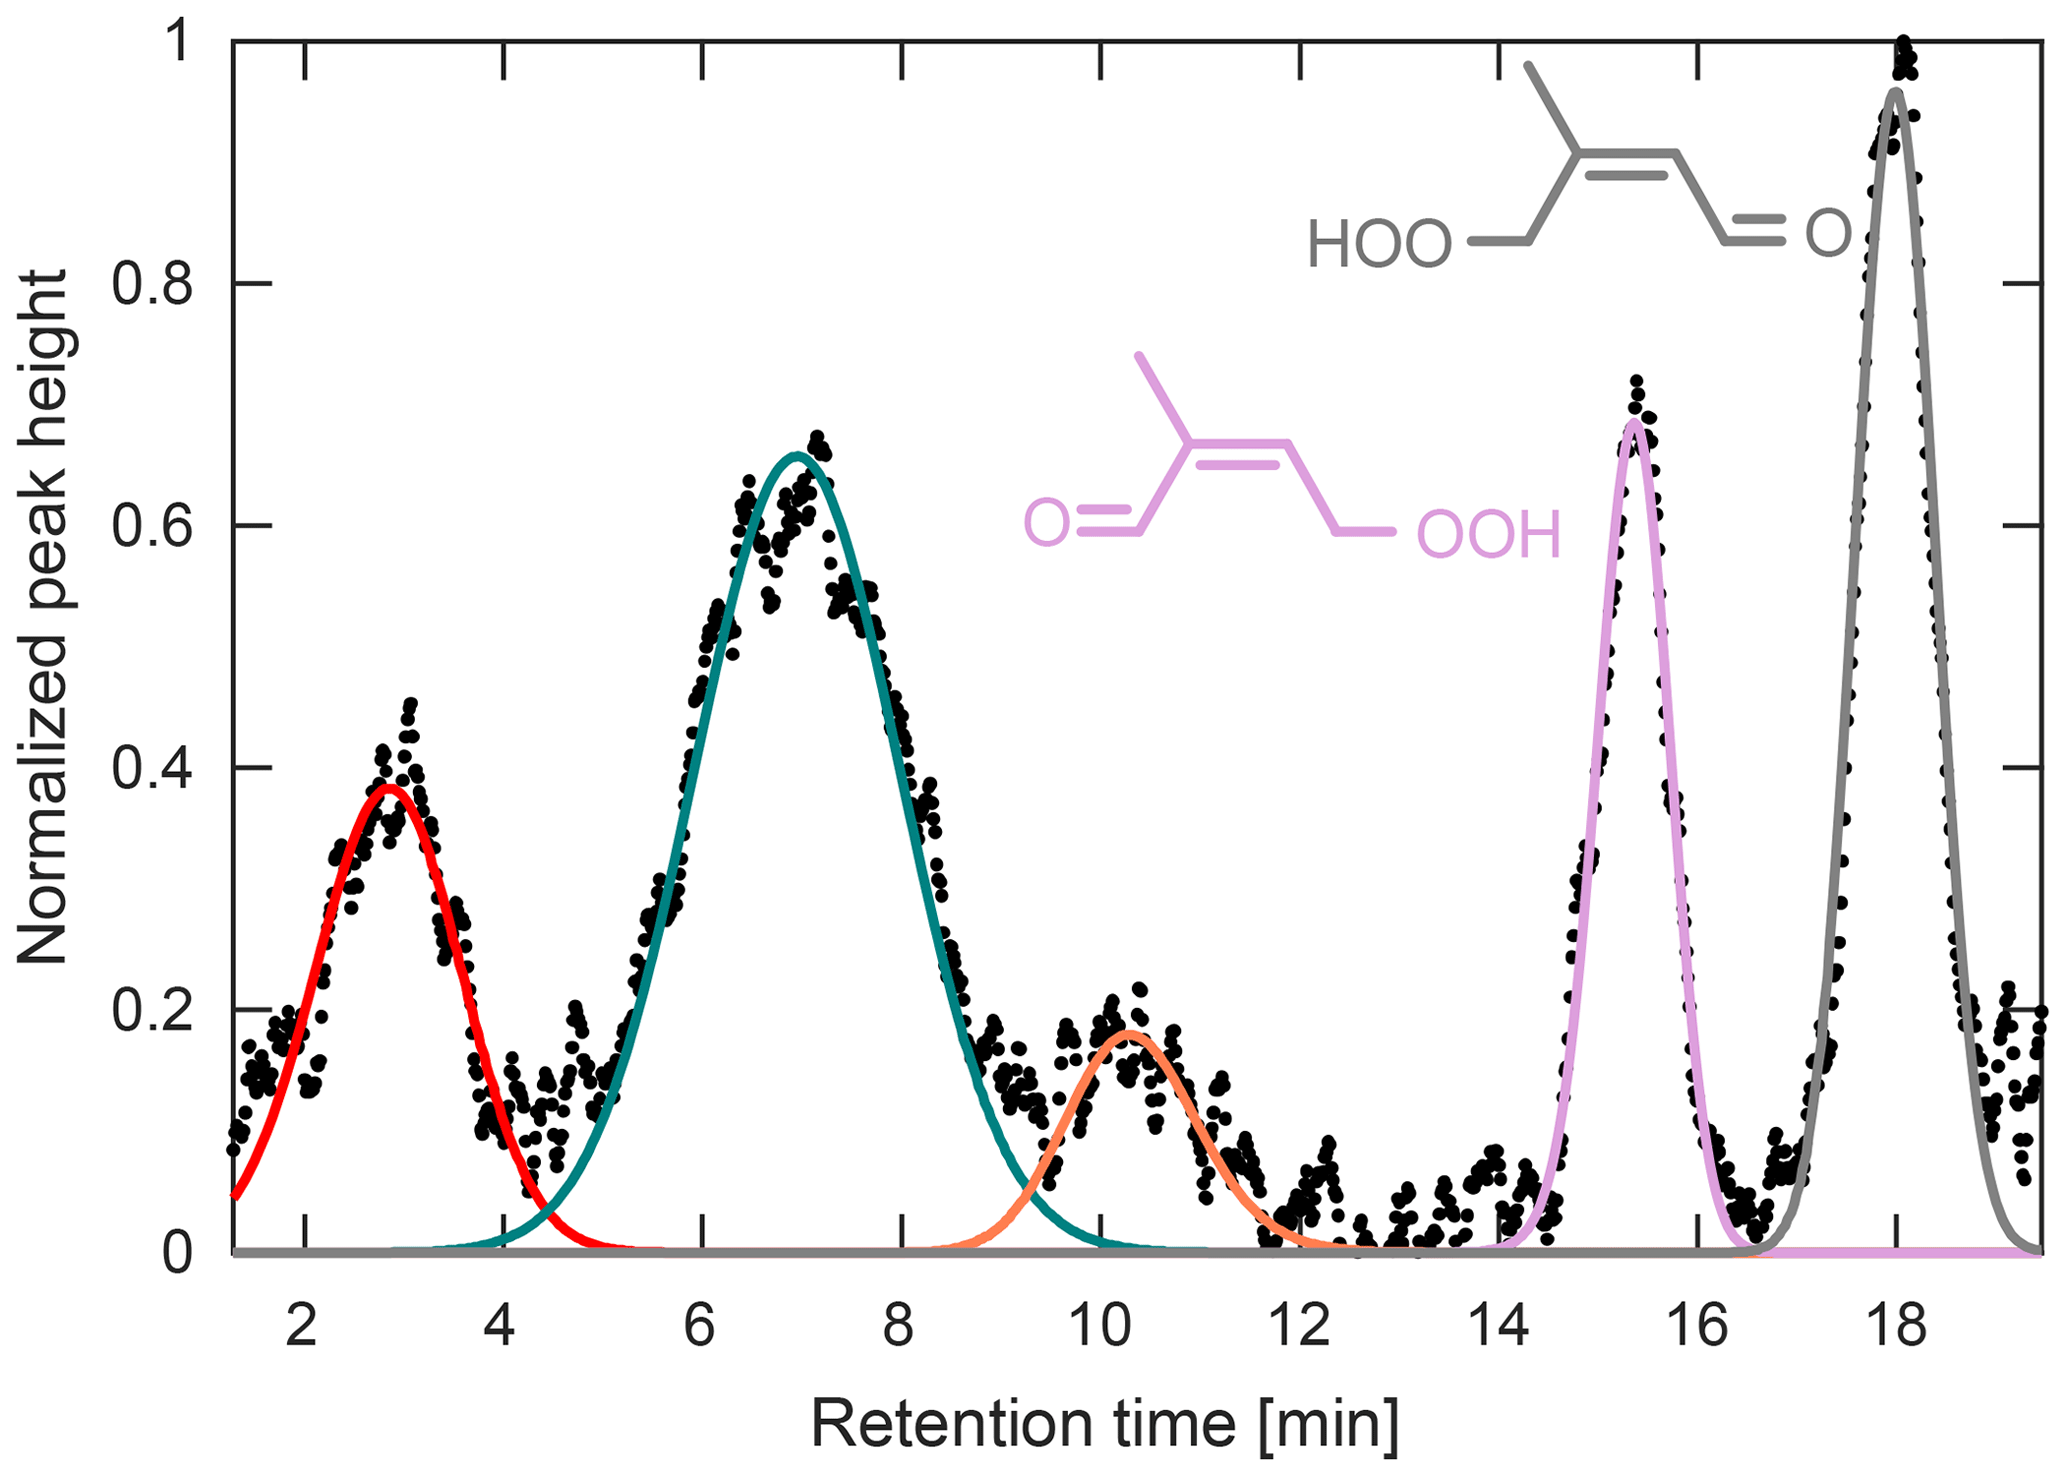
Figure 10Chromatogram obtained during the PROPHET campaign for m∕z 201. The latter two peaks have been identified previously as the two HPALD isomers (Teng et al., 2017). The three early peaks remain unidentified. GC signal has been normalized to the largest peak height.
Because compounds are trapped at sub-ambient temperatures, unless special care is taken, relative humidity inside the column can easily reach 100 % during ambient sampling. This is problematic because co-trapped water and ice clog the column, and many species of interest are highly soluble and reactive and readily hydrolyze (Koppmann and Wildt, 2008; Lee et al., 2014; Roukos et al., 2009; Teng et al., 2017). We address this issue by diluting the ambient air with dry N2 prior to cryotrapping to reduce the RH below the ice point at −20 ∘C (1.3 hPa water vapor). This is illustrated in Fig. 7 during GC analysis of IHN at high RH (∼50 %) with three different sample dilutions. When water is trapped during the lowest dilution (5×), the column flow is observed to decrease over time (Fig. 7a), indicating the formation of an ice blockage. In addition, the isomer distribution of IHN is dramatically altered, as seen by the loss of 1,2-IHN (first peak, Fig. 7d) and the corresponding formation of an isoprene diol, its hydrolysis product (Fig. 7g). However, at the two higher dilutions (15× and 20×), the column flow remains stable throughout the trapping period (Fig. 7b–c) – consistent with minimal ice formation – and the isomer distribution of IHN is preserved between the two runs (Fig. 7e–f). Though some water is retained on the column even at these higher dilutions, it was likely trapped downstream of the analytes, limiting its interactions with IHN.
During sampling, the operating dilution is chosen based on ambient RH measurements. The effectiveness of the dilution is verified by monitoring the water signal (, m∕z 104), which should quickly fall to background levels during elution when minimal water is retained (as seen in Fig. 7e–f). For the data shown here, we diluted the samples by a factor of 15 during laboratory studies and by a factor of 20 to 30 in the field studies. The high sample dilution demands a very high sensitivity to be able to adequately quantify many of the compounds of interest, which is achievable on this instrument when operating in IS mode (discussed in Sect. 2.3). Even so, ambient mixing ratios of several of the targeted analytes described here pushed the detection limits of the instrumentation, leading to increased uncertainty, especially when deconvolution was required prior to integration of chromatographic peaks.
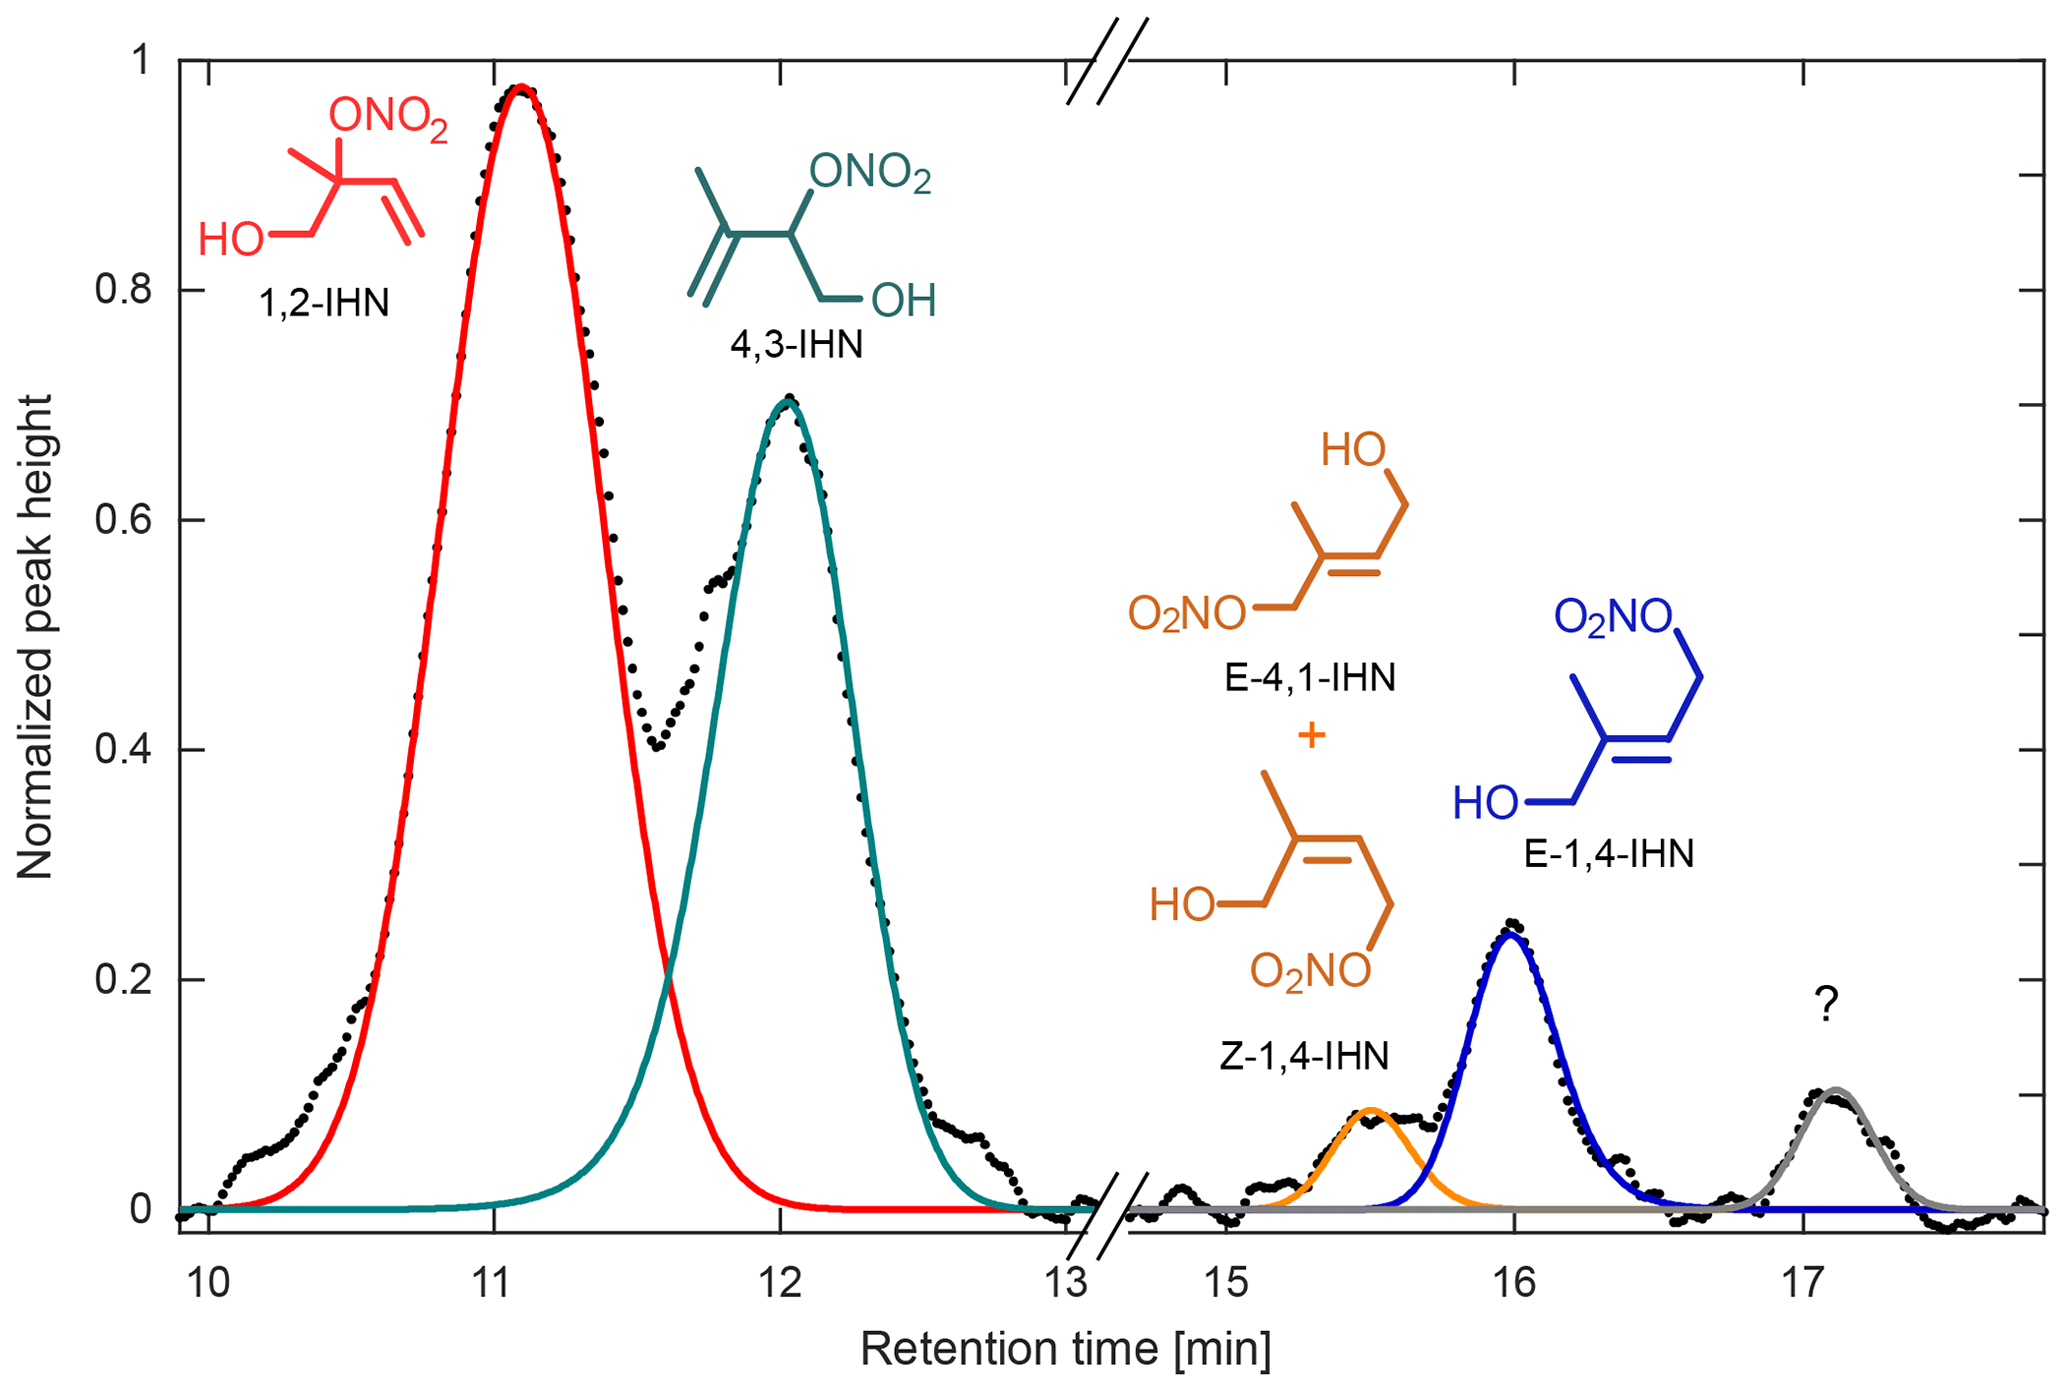
Figure 11Chromatogram obtained during the Caltech field study for m∕z 232, attributed to the IHN isomers, normalized to the largest peak height. At least four isomers of IHN were observed: 1,2-IHN (red), 4,3-IHN (green), E-4,1- and Z-1,4-IHN (coelute, orange), and E-1,4-IHN (blue). Z-4,1-IHN was not present above the instrument detection limit. An unidentified component, which likely corresponds to a species observed in laboratory isoprene oxidation studies, is present near the end of the chromatogram (gray; see Teng et al., 2017).
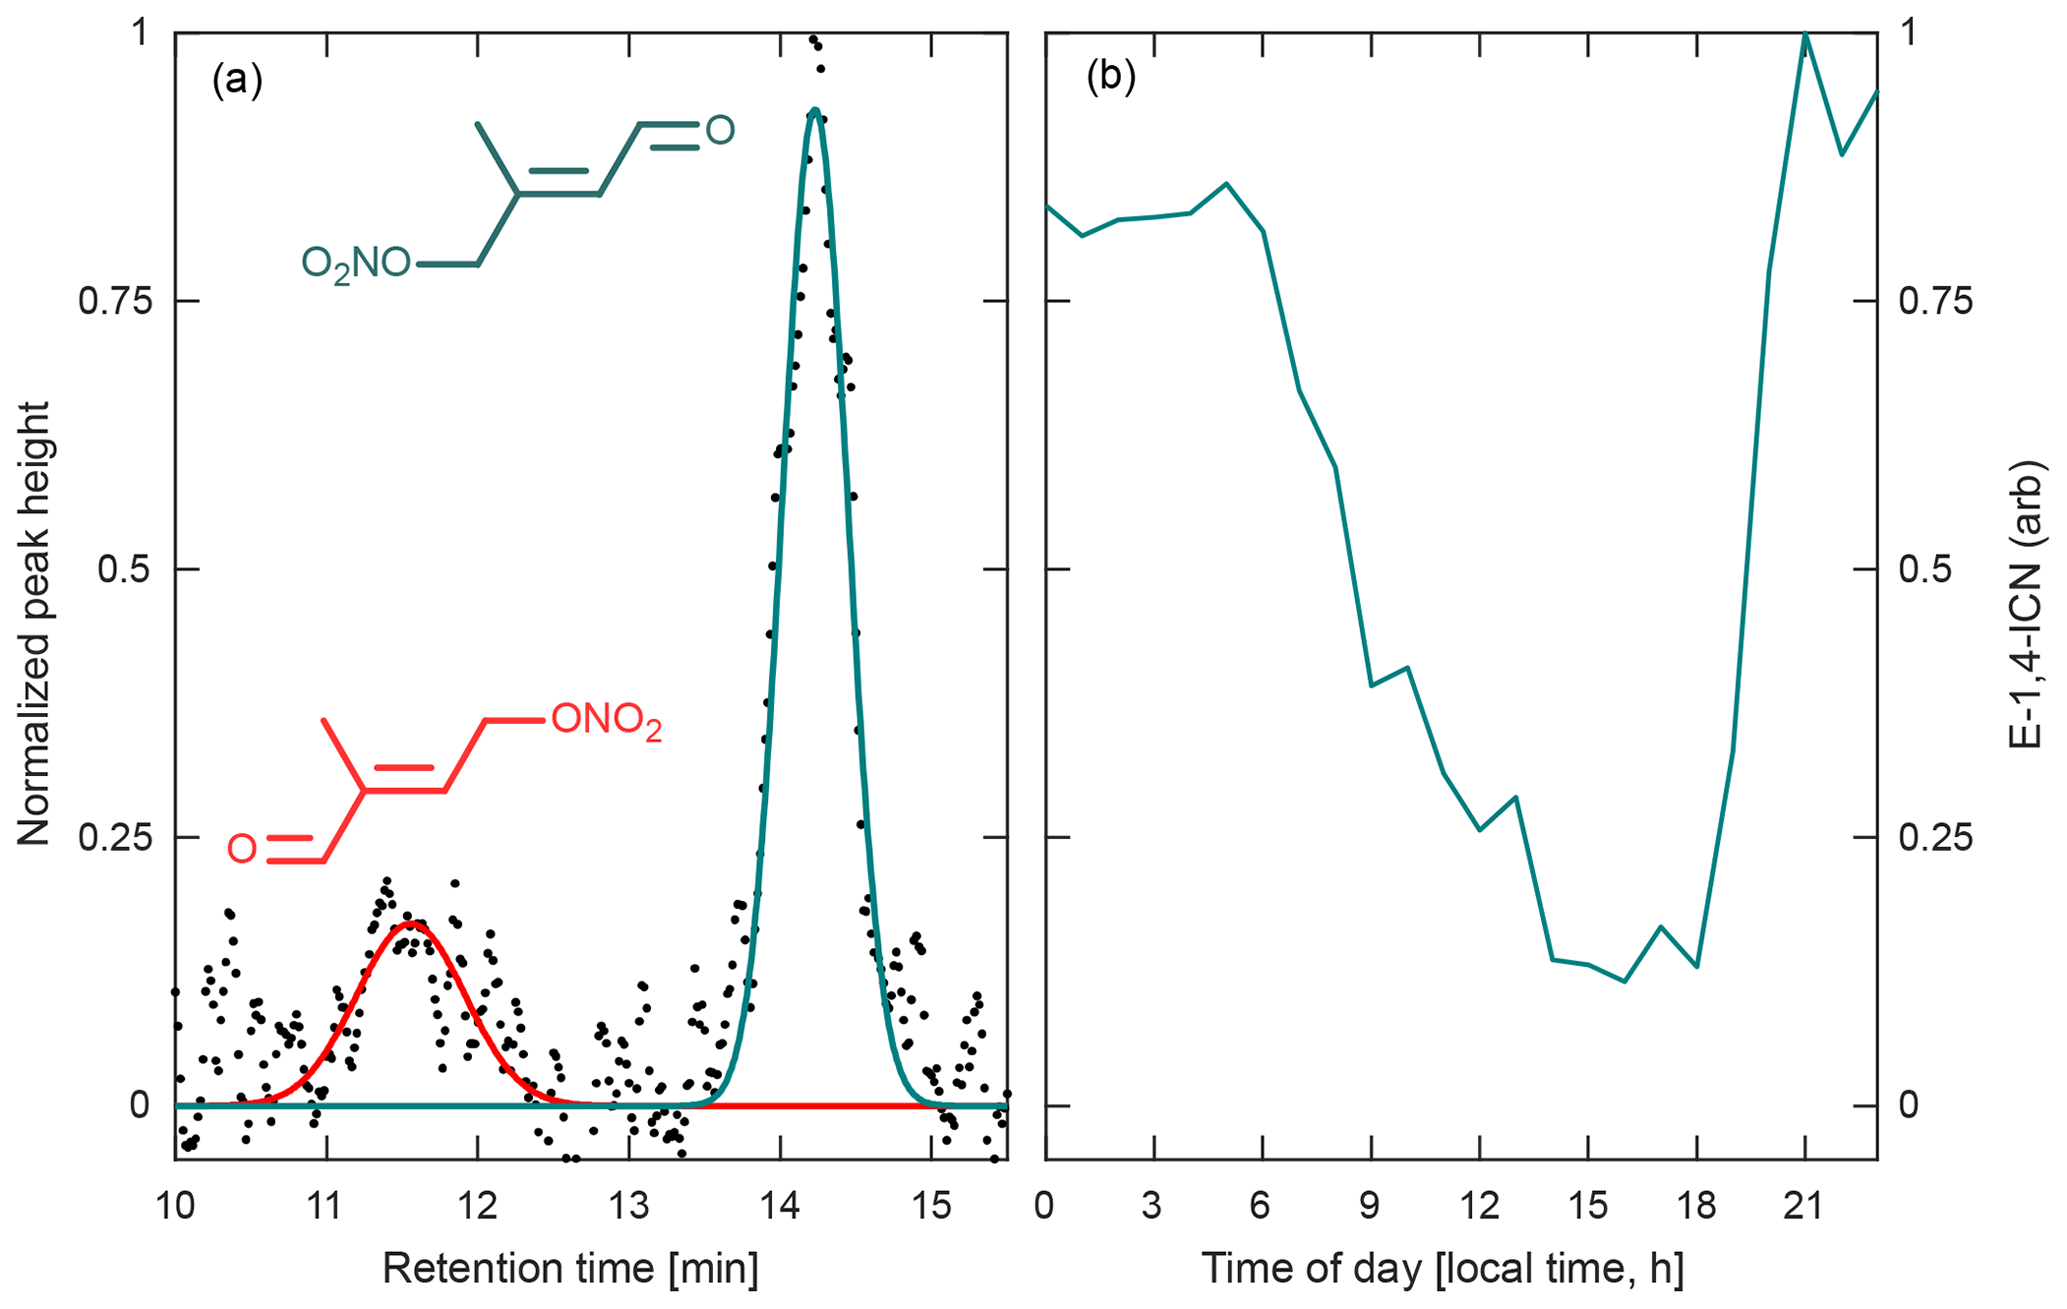
Figure 12(a) Chromatogram obtained during the Caltech field study for the two isoprene carbonyl nitrate isomers (4,1-ICN in red and 1,4-ICN in green, m∕z 230) produced by isoprene + NO3 chemistry, normalized to the largest peak height. Peak assignment is based on results from Schwantes et al. (2015). (b) Average diurnal profile of the most abundant ICN isomer, 1,4-ICN, obtained from chromatograms collected between 1 and 16 August 2017 during the Caltech field study. This profile appears to correspond with the expected formation of ICN from NO3 oxidation of isoprene in dark/dim conditions and the rapid loss in light periods.
3.2 Analyte transmission
In addition to rapid hydrolysis, many targeted OVOCs are highly susceptible to irreversible losses or chemical conversion upon contact with surfaces (Giacopelli et al., 2005; Grossenbacher et al., 2001, 2004; Hellén et al., 2017; Mills et al., 2016; Rivera-Rios et al., 2014; Xiong et al., 2015). We addressed this issue through the utilization of metal-free LP-GC. As mentioned above, this technique holds several known advantages over traditional GC methods, including elution at lower temperatures (Table 2), that make it possible to better preserve thermally labile species. In addition, all wetted instrument surfaces (with the exception of the ion source) are composed of inert materials such as PFA/PTFE Teflon, PEEK, and column-phase materials. This reduces unwanted reactions on surfaces, most notably the metal-catalyzed decomposition of compounds such as hydroxyperoxides and organic nitrates (Mills et al., 2016; Rivera-Rios et al., 2014).
Despite measures taken to improve analyte transmission, losses are still observed for some species such as hydroperoxides and epoxides. This highlights the importance of accurately quantifying analyte transmission through the GC column. Yet, for traditional GC-based measurements, transmission typically remains unknown, which can be detrimental when there is a lack of available standards and GC response factors must be based on another compound that has a similar chemical makeup but may interact differently with the column phase. However, the combination of our LP-GC system with the high sensitivity of the CIMS provides two sampling modes (direct CIMS and GC–CIMS) that automatically alternate between each other in half-hour increments. This allows us to compare individual chromatograms to CIMS measurements taken simultaneously with cryotrapping in order to assess GC transmission efficiency under field conditions, without the need for external standards. This is carried out by comparing mixing ratios calculated from direct CIMS sampling measurements and the sum of the entire chromatogram signal (normalized by the amount of air trapped), which is best performed when concentrations are high, and thus, measurement error is minimized. Using this method, we assess the transmission efficiency of IHN, which has been shown to have 100 % transmission through a similar system (Lee et al., 2014). In the field, the percent difference of IHN mixing ratios calculated from these two measurement modes was typically less than 5 %. We note that transmission less than unity can be the result of incomplete transmission of a single isomer (rather than the sum of all isomers). An example of this is in the case of ISOPOOH and IEPOX – IEPOX is transmitted more poorly through this column than ISOPOOH (Bates et al., 2014). In these cases, we use laboratory experiments to monitor discrepancies between mixing ratios obtained from direct CIMS sampling and GC–CIMS analysis and observe how these discrepancies change as we alter the isomer distribution (such as through additional oxidation of ISOPOOH). Using this method, we determine that ISOPOOH transmission is nearly 100 %, while IEPOX has a transmission of about 67 %.
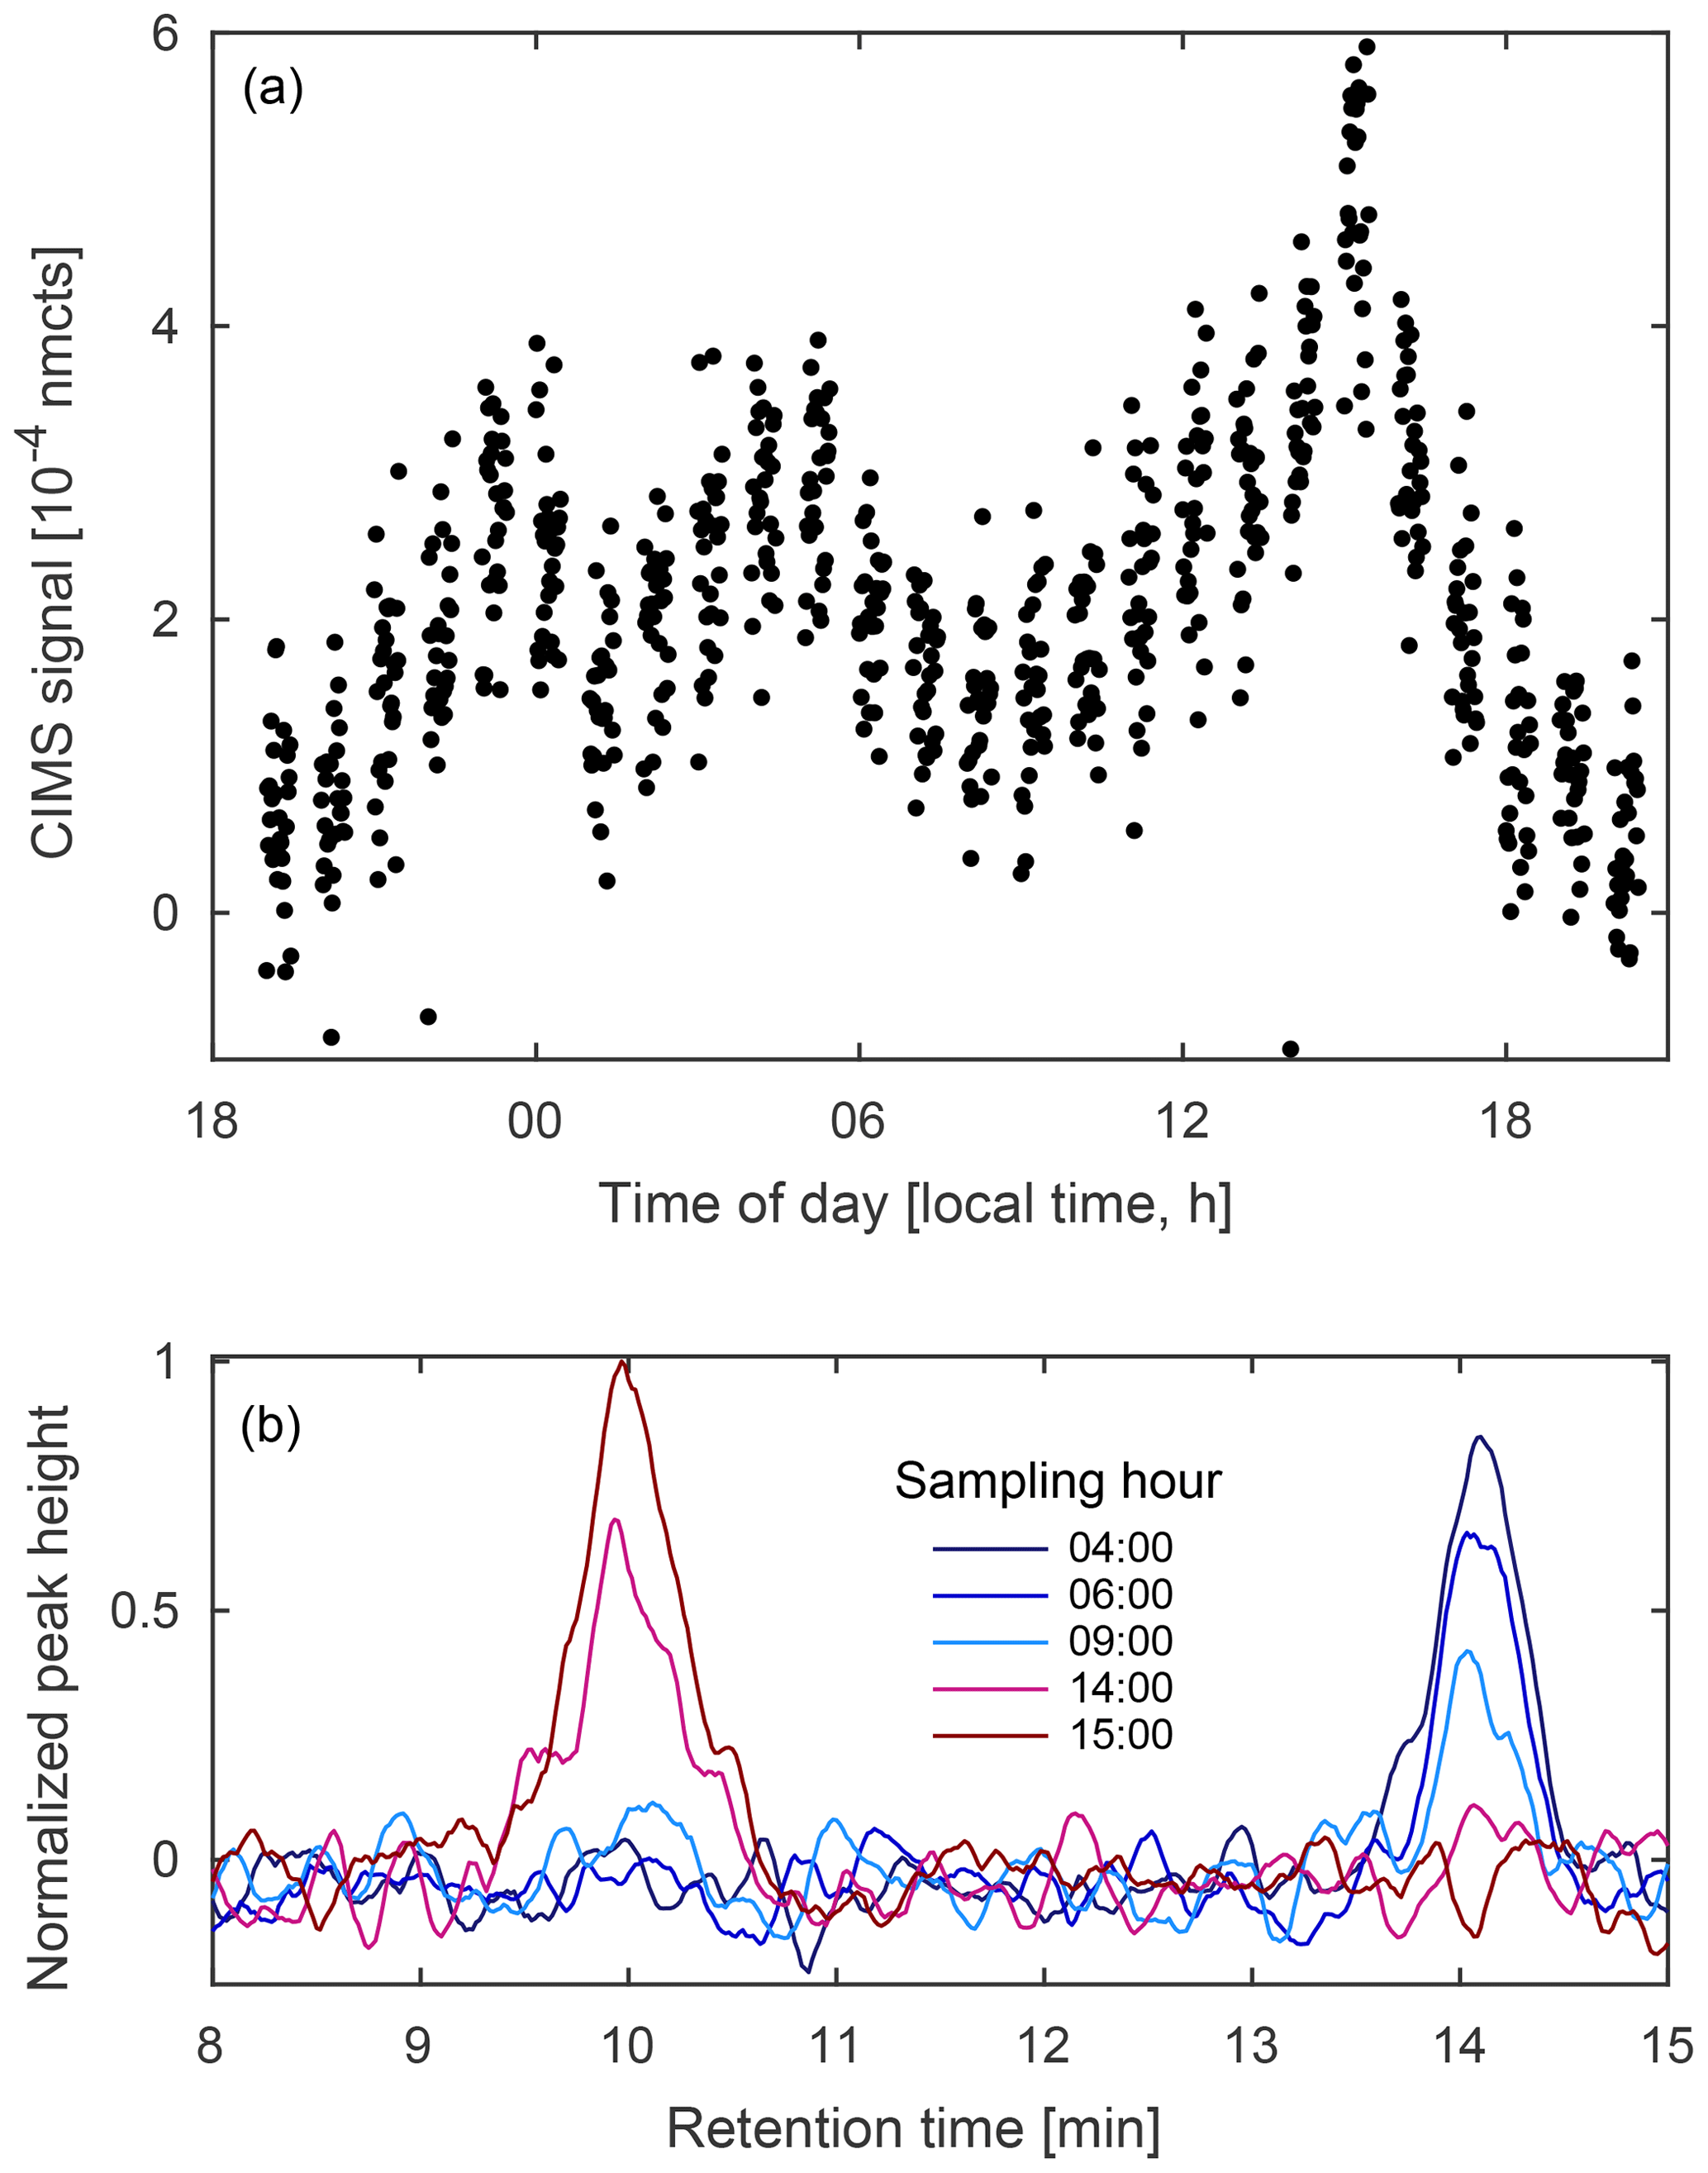
Figure 13(a) Diurnal profile of unidentified compounds observed at m∕z 236 (MW 151) from 11 to 12 August 2017 during the Caltech field study and (b) select field chromatograms from the same sampling period. The GC shows at least two compounds contribute to the signal, one more abundant at night (blue) and the other more abundant in the late afternoon (red).
The GC-HRToF-CIMS has participated in two field studies that served as a test for this analytical method. Its first deployment occurred as part of the Program for Research on Oxidants, Photochemistry, Emissions and Transport (PROPHET) campaign that occurred between 1 and 31 July 2016, when it was placed on the top of a 30 m research tower surrounded by the dense forests of rural northern Michigan. The following summer, the instrument underwent a second deployment at the California Institute of Technology (Caltech) campus in Pasadena, CA, where measurements were taken from the roof of the 44 m tall Millikan Library between 15 July and 17 August 2017. In contrast to PROPHET, Pasadena is typically characterized as a high-NOx urban environment due to its proximity to Los Angeles, though biogenic emissions have also been known to influence the area (Arey et al., 1995; Pollack et al., 2013). During both deployments, the instrument provided a near-continuous measure of OVOC concentrations, through either direct sampling or GC analysis. Interruptions in the GC measurements were primarily due to required maintenance of the cooling system (e.g., changing CO2 tanks). When the GC was operational, data were captured during 1 h cycles in which the first half was dedicated to direct CIMS measurements and the latter half measured analytes after chromatographic separation, with the collection of ambient and dry zeros interlaced between operational modes. This sampling routine is shown in Fig. 8 for a single mass (m∕z 232) collected during the 2017 Caltech field study.
At PROPHET, the low-NOx environment (Millet et al., 2018) provided ideal conditions for measuring several organic peroxides, such as ISOPOOH. However, because ISOPOOH and its oxidation product, IEPOX, are isobaric, other analytical techniques are either unable to separate these two species or rely on the relative abundances of fragment ions to determine the relative contribution of each to the observed signal (Paulot et al., 2009b). With the GC–CIMS, we were able to physically separate the isomers prior to quantification (Fig. 6), allowing real-time information regarding the distribution of these two species (Fig. 9). As such, we observed that IEPOX comprised about half of the total daytime signal (07:00–22:00 local time; Fig. 9E), a fraction that is typically estimated through models when assessing IEPOX aerosol uptake (as in Budisulistiorini et al., 2017). In addition, we are also able to differentiate the isomers that make up ISOPOOH and IEPOX, which can serve to highlight the isomer-specific chemistry of these compounds. A prime example is the observed daytime ratio of 1,2-ISOPOOH to 4,3-ISOPOOH. This ratio (∼7.6) is higher than expected when accounting only for the isomer-specific bimolecular reaction rates of the isoprene peroxy radicals (Wennberg et al., 2018). Thus, these measurements allow us to conclude that there was competitive RO2 isomerization of the 4-OH isoprene peroxy radicals (Crounse et al., 2011; Peeters et al., 2009; Teng et al., 2017) during the course of this campaign.
Other multifunctional organic peroxides were also observed during this campaign, such as those seen at m∕z 201 (Fig. 10). Though the CIMS signal at m∕z 201 has previously been assigned to the HPALDs (Crounse et al., 2011), a product of isoprene RO2 isomerization, laboratory GC studies have determined that this signal is actually composed of several compounds (Teng et al., 2017). This is consistent with field chromatograms obtained at PROPHET, which show up to five individual peaks at this mass-to-charge ratio. Using the peak assignment discussed in Teng et al. (2017), we assign the last two peaks in Fig. 10 as the 1-HPALD (purple) and 4-HPALD (gray), which together compose ∼38 % of the total GC peak area. The second peak (green) is likely the same unidentified early eluting peak seen in the Teng et al. (2017) study (which also results from isoprene RO2 isomerization). The two other peaks (red and orange) are unidentified and may result from different chemistry.
The GC-HRToF-CIMS has also demonstrated its ability to measure individual isomers of organic nitrates during its two deployments, as showcased by our IHN measurements. The two dominant isomers of IHN (1,2-IHN and 4,3-IHN) were observed at both PROPHET (with an average daytime ratio of ∼2.6) and at Caltech (with an average daytime ratio of ∼1.4). At Caltech, other IHN isomers (Fig. 11), as well as an unidentified component that has been previously observed during laboratory studies, were also quantified (Teng et al., 2017). Comparison of isomer ratios obtained from each site was used to assess the isoprene RO2 chemistry and is consistent with competitive unimolecular reaction pathways at PROPHET. Interestingly, the IHN ratio at PROPHET differed significantly from the corresponding ISOPOOH ratio despite the similar formation pathways of each pair of oxidation products. We suspect this reflects differences in their loss pathways, which will be discussed further in an upcoming paper.
In addition to IHN, the GC–CIMS also observed other large (> C3) organic nitrates. For example, evidence of isoprene + NO3 chemistry during the Caltech experiment is indicated by the nighttime increase in the signal at m∕z 230, which is assigned to the ICNs (Schwantes et al., 2015). Though only two isomers were observed during this study (Fig. 12), the distribution of these species (assigned as 4,1-ICN and 1,4-ICN) matches results from Schwantes et al. (2015) and may confirm the hypothesis that NO3 addition to the C1 carbon of isoprene is favored (Suh et al., 2001). As the distribution of the isoprene nitroxy peroxy radical (INO2) is less constrained than the OH-derived RO2 counterpart, further observations of ambient ICN isomers with the GC–CIMS may lead to improved understanding of the impact of nighttime NO3 chemistry (Schwantes et al., 2015). In addition, a suspected nitrogen-containing compound was observed at Caltech at m∕z 236 (MW 151; Fig. 13). Data obtained from direct CIMS sampling showed at least two local maxima, one occurring before sunrise and the other shortly after noon. With the addition of the GC, we find that two distinct species contribute to this instrument signal with varying contributions over the course of a day. That is, the first compound (eluting at 9.8 min) is responsible for the majority of the signal in the early afternoon, possibly indicative of production via photooxidation, whereas the second compound (eluting at 13.8 min) is most abundant between sunset and sunrise, possibly due to production from nighttime NO3 chemistry, high photolability, a short lifetime against the OH radical, or some combination thereof.
We have developed an automated GC–CIMS system that captures diurnal changes in the isomer distributions of a wide range of important OVOCs. This novel method addresses common issues typically associated with ambient GC measurements, allowing observations of compounds that have previously proven difficult to measure. We use a combination of sample dilution and temperature control to avoid the adverse effects caused by high column humidity (e.g., hydrolysis of reactive compounds). This, along with the use of LP-GC methodology, cryotrapping directly on the column, and the creation of a near-metal-free GC design, reduces analyte degradation upon contact with the instrument surfaces.
Analytical performance was assessed through a combination of laboratory studies and field campaigns. GC-HRToF-CIMS has demonstrated its ability to provide continuous reproducible measurements, effectively trapping tested species with no observable breakthrough and providing a quantitative measurement of GC transmission by utilizing its two sampling modes (direct CIMS and GC–CIMS sampling). Though additional optimization is needed to expand the number of species that can be measured using this technique, its participation in future field studies will help enable the elucidation of the chemical mechanisms of a number of species, such as the isoprene oxidation products, by providing information that will help assess how compound structure impacts their formation or atmospheric fate and thereby their effect on the global atmosphere.
Data from the 2017 Caltech study are available at https://doi.org/10.22002/D1.971 (Vasquez et al., 2018). Additional data are available upon request to the corresponding authors.
The supplement related to this article is available online at: https://doi.org/10.5194/amt-11-6815-2018-supplement.
POW, JDC, KTV, HMA, EP, and ACN designed and built the GC-HRToF-CIMS. KTV, HMA, and EP operated the instrument during PROPHET. KTV and LX operated the instrument during the Caltech field study. KTV analyzed data and KTV wrote the paper with contributions from all co-authors.
The authors declare that they have no conflict of interest.
We would like to thank Steve Bertman, Phil Stevens, and the University of
Michigan Biological Station (UMBS) for organizing the PROPHET 2016 campaign.
We are indebted to the many PROPHET participants who helped us move the
instrument to and from the top of the tower safely. We also thank the Caltech
campus and affiliated staff for accommodating the summer 2017 study. The
construction of the GC-HRToF-CIMS instrument was supported by the National Science
Foundation (AGS-1428482), with additional NSF support (AGS-1240604) provided
for the instrument field deployments. Work performed by Krystal T. Vasquez and Hannah M. Allen was
supported by the National Science Foundation Graduate Research Fellowship
(NSF GRFP). Krystal T. Vasquez also acknowledges support from an Earl C. Anthony Fellowship
in chemistry during an early portion of this study.
Edited by: Bin Yuan
Reviewed by: two anonymous referees
Amelynck, C., Schoon, N., and Arijs, E.: Gas phase reactions of CF3O− and CF3O−H2O with nitric, formic, and acetic acid, Int. J. Mass. Spectrom., 203, 165–175, https://doi.org/10.1016/S1387-3806(00)00321-3, 2000a. a
Amelynck, C., Van, A.-M., Schoon, B. N., and Arijs, E.: Gas phase reactions of CF3O− and CF3O−H2O and their relevance to the detection of stratospheric HCl, Int. J. Mass. Spectrom., 202, 207–216, https://doi.org/10.1016/S1387-3806(00)00244-X, 2000b. a
Apel, E. C., Hills, A. J., Lueb, R., Zindel, S., Eisele, S., and Riemer, D. D.: A fast-GC/MS system to measure C2 to C4 carbonyls and methanol aboard aircraft, J. Geophys. Res.-Atmos., 108, 8794, https://doi.org/10.1029/2002JD003199, 2003. a, b
Apel, E. C., Brauers, T., Koppmann, R., Bandowe, B., Boßmeyer, J., Holzke, C., Tillmann, R., Wahner, A., Wegener, R., Brunner, A., Jocher, M., Ruuskanen, T., Spirig, C., Steigner, D., Steinbrecher, R., Gomez Alvarez, E., Müller, K., Burrows, J. P., Schade, G., Solomon, S. J., Ladstätter-Weißenmayer, A., Simmonds, P., Young, D., Hopkins, J. R., Lewis, A. C., Legreid, G., Reimann, S., Hansel, A., Wisthaler, A., Blake, R. S., Ellis, A. M., Monks, P. S., and Wyche, K. P.: Intercomparison of oxygenated volatile organic compound measurements at the SAPHIR atmosphere simulation chamber, J. Geophys. Res.-Atmos., 113, D20307, https://doi.org/10.1029/2008JD009865, 2008. a
Arey, J., Crowley, D. E., Crowley, M., Resketo, M., and Lester, J.: Hydrocarbon emissions from natural vegetation in California's South Coast Air Basin, Atmos. Environ., 29, 2977–2988, https://doi.org/10.1016/1352-2310(95)00137-N, 1995. a
Atkinson, R. and Arey, J.: Atmospheric Degradation of Volatile Organic Compounds, Chem. Rev., 103, 4605–4638, https://doi.org/10.1021/cr0206420, 2003. a
Bates, K. H., Crounse, J. D., St Clair, J. M., Bennett, N. B., Nguyen, T. B., Seinfeld, J. H., Stoltz, B. M., and Wennberg, P. O.: Gas phase production and loss of isoprene epoxydiols, J. Phys. Chem. A, 118, 1237–46, https://doi.org/10.1021/jp4107958, 2014. a, b, c, d, e
Bates, K. H., Nguyen, T. B., Teng, A. P., Crounse, J. D., Kjaergaard, H. G., Stoltz, B. M., Seinfeld, J. H., and Wennberg, P. O.: Production and Fate of C4 Dihydroxycarbonyl Compounds from Isoprene Oxidation, J. Phys. Chem. A, 120, 106–117, https://doi.org/10.1021/acs.jpca.5b10335, 2016. a
Budisulistiorini, S. H., Nenes, A., Carlton, A. G., Surratt, J. D., McNeill, V. F., and Pye, H. O. T.: Simulating Aqueous-Phase Isoprene-Epoxydiol (IEPOX) Secondary Organic Aerosol Production During the 2013 Southern Oxidant and Aerosol Study (SOAS), Enviro. Sci. Technol., 51, 5026–5034, https://doi.org/10.1021/acs.est.6b05750, 2017. a
Clemitshaw, K.: A Review of Instrumentation and Measurement Techniques for Ground-Based and Airborne Field Studies of Gas-Phase Tropospheric Chemistry, Crit. Rev. Env. Sci. Tec., 34, 1–108, https://doi.org/10.1080/10643380490265117, 2004. a, b
Crounse, J. D., McKinney, K. A., Kwan, A. J., and Wennberg, P. O.: Measurement of Gas-Phase Hydroperoxides by Chemical Ionization Mass Spectrometry, Anal. Chem., 78, 6726–6732, https://doi.org/10.1021/ac0604235, 2006. a, b
Crounse, J. D., Paulot, F., Kjaergaard, H. G., and Wennberg, P. O.: Peroxy radical isomerization in the oxidation of isoprene, Phys. Chem. Chem. Phys., 13, 13607–13613, https://doi.org/10.1039/C1CP21330J, 2011. a, b, c
Demeestere, K., Dewulf, J., De Witte, B., and Van Langenhove, H.: Sample preparation for the analysis of volatile organic compounds in air and water matrices, J. Chromatogr. A, 1153, 130–144, https://doi.org/10.1016/j.chroma.2007.01.012, 2007. a
Garden, A. L., Paulot, F., Crounse, J. D., Maxwell-Cameron, I. J., Wennberg, P. O., and Kjaergaard, H. G.: Calculation of conformationally weighted dipole moments useful in ion–molecule collision rate estimates, Chem. Phys. Lett., 474, 45–50, https://doi.org/10.1016/j.cplett.2009.04.038, 2009. a
Giacopelli, P., Ford, K., Espada, C., and Shepson, P. B.: Comparison of the measured and simulated isoprene nitrate distributions above a forest canopy, J. Geophys. Res.-Atmos., 110, D01304, https://doi.org/10.1029/2004JD005123, 2005. a
Goldan, P. D., Kuster, W. C., Williams, E., Murphy, P. C., Fehsenfeld, F. C., and Meagher, J.: Nonmethane hydrocarbon and oxy hydrocarbon measurements during the 2002 New England Air Quality Study, J. Geosphys. Res.-Atmos., 109, D21309, https://doi.org/10.1029/2003JD004455, 2004. a, b
Grossenbacher, J. W., Couch, T., Shepson, P. B., Thornberry, T., Witmer-Rich, M., Carroll, M. A., Faloona, I., Tan, D., Brune, W., Ostling, K., and Bertman, S.: Measurements of isoprene nitrates above a forest canopy, J. Geophys. Res.-Atmos., 106, 24429–24438, https://doi.org/10.1029/2001JD900029, 2001. a
Grossenbacher, J. W., Barket Jr., D. J., Shepson, P. B., Carroll, M. A., Olszyna, K., and Apel, E.: A comparison of isoprene nitrate concentrations at two forest-impacted sites, J. Geophys. Res.-Atmos., 109, D11311, https://doi.org/10.1029/2003JD003966, 2004. a
Hellén, H., Schallhart, S., Praplan, A. P., Petäjä, T., and Hakola, H.: Using in situ GC-MS for analysis of C2–C7 volatile organic acids in ambient air of a boreal forest site, Atmos. Meas. Tech., 10, 281–289, https://doi.org/10.5194/amt-10-281-2017, 2017. a, b, c
Huey, L. G., Villalta, P. W., Dunlea, E. J., Hanson, D. R., and Howard, C. J.: Reactions of CF3O− with Atmospheric Trace Gases, J. Phys. Chem., 100, 190–194, https://doi.org/10.1021/jp951928u, 1996. a
Hyttinen, N., Otkjær, R. V., Iyer, S., Kjaergaard, H. G., Rissanen, M. P., Wennberg, P. O., and Kurtén, T.: Computational Comparison of Different Reagent Ions in the Chemical Ionization of Oxidized Multifunctional Compounds, J. Phys. Chem. A, 122, 269–279, https://doi.org/10.1021/acs.jpca.7b10015, 2018. a
Klenø, J. G., Wolkoff, P., Clausen, P. A., Wilkins, C. K., and Pedersen, T.: Degradation of the Adsorbent Tenax TA by Nitrogen Oxides, Ozone, Hydrogen Peroxide, OH Radical, and Limonene Oxidation Products, Environ. Sci. Technol., 36, 4121–4126, https://doi.org/10.1021/es025680f, 2002. a
Koppmann, R. and Wildt, J.: Oxygenated Volatile Organic Compounds, John Wiley & Sons, 129–172, 2008. a, b, c, d, e
Lee, L., Teng, A. P., Wennberg, P. O., Crounse, J. D., and Cohen, R. C.: On rates and mechanisms of OH and O3 reactions with isoprene-derived hydroxy nitrates, J. Phys. Chem. A, 118, 1622–1637, https://doi.org/10.1021/jp4107603, 2014. a, b, c, d, e
Lerner, B. M., Gilman, J. B., Aikin, K. C., Atlas, E. L., Goldan, P. D., Graus, M., Hendershot, R., Isaacman-VanWertz, G. A., Koss, A., Kuster, W. C., Lueb, R. A., McLaughlin, R. J., Peischl, J., Sueper, D., Ryerson, T. B., Tokarek, T. W., Warneke, C., Yuan, B., and de Gouw, J. A.: An improved, automated whole air sampler and gas chromatography mass spectrometry analysis system for volatile organic compounds in the atmosphere, Atmos. Meas. Tech., 10, 291–313, https://doi.org/10.5194/amt-10-291-2017, 2017. a
Mellouki, A., Le Bras, G., and Sidebottom, H.: Kinetics and Mechanisms of the Oxidation of Oxygenated Organic Compounds in the Gas Phase, Chem. Rev., 103, 5077–5096, https://doi.org/10.1021/cr020526x, 2003. a
Mellouki, A., Wallington, T. J., and Chen, J.: Atmospheric Chemistry of Oxygenated Volatile Organic Compounds: Impacts on Air Quality and Climate, Chem. Rev., 115, 3984–4014, https://doi.org/10.1021/cr500549n, 2015. a
Millet, D. B., Donahue, N. M., Pandis, S. N., Polidori, A., Stanier, C. O., Turpin, B. J., and Goldstein, A. H.: Atmospheric volatile organic compound measurements during the Pittsburgh Air Quality Study: Results, interpretation, and quantification of primary and secondary contributions, J. Geophys. Res.-Atmos., 110, D07S07, https://doi.org/10.1029/2004JD004601, 2005. a
Millet, D. B., Alwe, H. D., Chen, X., Deventer, M. J., Griffis, T. J., Holzinger, R., Bertman, S. B., Rickly, P. S., Stevens, P. S., Léonardis, T., Locoge, N., Dusanter, S., Tyndall, G. S., Alvarez, S. L., Erickson, M. H., and Flynn, J. H.: Bidirectional Ecosystem–Atmosphere Fluxes of Volatile Organic Compounds Across the Mass Spectrum: How Many Matter?, ACS Earth Space Chem., 2, 764–777, https://doi.org/10.1021/acsearthspacechem.8b00061, 2018. a
Mills, G. P., Hiatt-Gipson, G. D., Bew, S. P., and Reeves, C. E.: Measurement of isoprene nitrates by GCMS, Atmos. Meas. Tech., 9, 4533–4545, https://doi.org/10.5194/amt-9-4533-2016, 2016. a, b, c, d, e, f, g
Nguyen, T. B., Crounse, J. D., Schwantes, R. H., Teng, A. P., Bates, K. H., Zhang, X., St. Clair, J. M., Brune, W. H., Tyndall, G. S., Keutsch, F. N., Seinfeld, J. H., and Wennberg, P. O.: Overview of the Focused Isoprene eXperiment at the California Institute of Technology (FIXCIT): mechanistic chamber studies on the oxidation of biogenic compounds, Atmos. Chem. Phys., 14, 13531–13549, https://doi.org/10.5194/acp-14-13531-2014, 2014. a
Nguyen, T. B., Crounse, J. D., Teng, A. P., St. Clair, J. M., Paulot, F., Wolfe, G. M., and Wennberg, P. O.: Rapid deposition of oxidized biogenic compounds to a temperate forest, P. Natl. Acad. Sci. USA, 112, E392–E401, https://doi.org/10.1073/pnas.1418702112, 2015. a
Noziére, B., Kalberer, M., Claeys, M., Allan, J., D'Anna, B., Decesari, S., Finessi, E., Glasius, M., Grgić, I., Hamilton, J. F., Hoffmann, T., Iinuma, Y., Jaoui, M., Kahnt, A., Kampf, C. J., Kourtchev, I., Maenhaut, W., Marsden, N., Saarikoski, S., Schnelle-Kreis, J., Surratt, J. D., Szidat, S., Szmigielski, R., and Wisthaler, A.: The Molecular Identification of Organic Compounds in the Atmosphere: State of the Art and Challenges, Chem. Rev., 115, 3919–3983, https://doi.org/10.1021/cr5003485, 2015. a
O'Haver, T.: Peak Fitters, available at: https://terpconnect.umd.edu/~toh/spectrum/InteractivePeakFitter.htm (last access: 30 June 2018), 2017. a
Orlando, J. J. and Tyndall, G. S.: Laboratory studies of organic peroxy radical chemistry: an overview with emphasis on recent issues of atmospheric significance, Chem. Soc. Rev., 41, 6294–6317, https://doi.org/10.1039/C2CS35166H, 2012. a
Paulot, F., Crounse, J. D., Kjaergaard, H. G., Kroll, J. H., Seinfeld, J. H., and Wennberg, P. O.: Isoprene photooxidation: new insights into the production of acids and organic nitrates, Atmos. Chem. Phys., 9, 1479–1501, https://doi.org/10.5194/acp-9-1479-2009, 2009a. a, b
Paulot, F., Crounse, J. D., Kjaergaard, H. G., Kürten, A., St. Clair, J. M., Seinfeld, J. H., and Wennberg, P. O.: Unexpected Epoxide Formation in the Gas-Phase Photooxidation of Isoprene, Science, 325, 730–733, https://doi.org/10.1126/science.1172910, 2009b. a, b
Peeters, J., Nguyen, T. L., and Vereecken, L.: HOx radical regeneration in the oxidation of isoprene, Phys. Chem. Chem. Phys., 11, 5935–5939, https://doi.org/10.1039/B908511D, 2009. a
Peeters, J., Müller, J.-F., Stavrakou, T., and Nguyen, V. S.: Hydroxyl Radical Recycling in Isoprene Oxidation Driven by Hydrogen Bonding and Hydrogen Tunneling: The Upgraded LIM1 Mechanism, J. Phys. Chem. A, 118, 8625–8643, https://doi.org/10.1021/jp5033146, pMID: 25010574, 2014. a
Pollack, I. B., Ryerson, T. B., Trainer, M., Neuman, J. A., Roberts, J. M., and Parrish, D. D.: Trends in ozone, its precursors, and related secondary oxidation products in Los Angeles, California: A synthesis of measurements from 1960 to 2010, J. Geophys. Res.-Atmos., 118, 5893–5911, https://doi.org/10.1002/jgrd.50472, 2013. a
Praske, E., Crounse, J. D., Bates, K. H., Kurten, T., Kjaergaard, H. G., and Wennberg, P. O.: Atmospheric Fate of Methyl Vinyl Ketone: Peroxy Radical Reactions with NO and HO2, J. Phys. Chem. A, 119, 4562–4572, https://doi.org/10.1021/jp5107058, 2015. a, b
Praske, E., Otkjær, R. V., Crounse, J. D., Hethcox, J. C., Stoltz, B. M., Kjaergaard, H. G., and Wennberg, P. O.: Atmospheric autoxidation is increasingly important in urban and suburban North America, P. Natl. Acad. Sci. USA, 115, 64–69, https://doi.org/10.1073/pnas.1715540115, 2018. a
Ras, M. R., Borrull, F., and Marcé, R. M.: Sampling and preconcentration techniques for determination of volatile organic compounds in air samples, Trends Anal. Chem., 28, 347–361, https://doi.org/10.1016/j.trac.2008.10.009, 2009. a, b, c
Rivera-Rios, J. C., Nguyen, T. B., Crounse, J. D., Jud, W., St. Clair, J. M., Mikoviny, T., Gilman, J. B., Lerner, B. M., Kaiser, J. B., de Gouw, J., Wisthaler, A., Hansel, A., Wennberg, P. O., Seinfeld, J. H., and Keutsch, F. N.: Conversion of hydroperoxides to carbonyls in field and laboratory instrumentation: Observational bias in diagnosing pristine versus anthropogenically controlled atmospheric chemistry, Geophys. Res. Lett., 41, 8645–8651, https://doi.org/10.1002/2014GL061919, 2014. a, b, c, d
Roukos, J., Plaisance, H., Leonardis, T., Bates, M., and Locoge, N.: Development and validation of an automated monitoring system for oxygenated volatile organic compounds and nitrile compounds in ambient air, J. Chromatogr. A, 1216, 8642–8651, https://doi.org/10.1016/j.chroma.2009.10.018, 2009. a, b, c, d
Sapozhnikova, Y. and Lehotay, S. J.: Review of recent developments and applications in low-pressure (vacuum outlet) gas chromatography, Anal. Chim. Acta, 899, 13–22, https://doi.org/10.1016/j.aca.2015.10.003, 2015. a
Schwantes, R. H., Teng, A. P., Nguyen, T. B., Coggon, M. M., Crounse, J. D., St Clair, J. M., Zhang, X., Schilling, K. A., Seinfeld, J. H., and Wennberg, P. O.: Isoprene NO3 Oxidation Products from the RO2+HO2 Pathway, J. Phys. Chem. A, 119, 10158–10171, https://doi.org/10.1021/acs.jpca.5b06355, 2015. a, b, c, d, e, f, g
Squire, O. J., Archibald, A. T., Griffiths, P. T., Jenkin, M. E., Smith, D., and Pyle, J. A.: Influence of isoprene chemical mechanism on modelled changes in tropospheric ozone due to climate and land use over the 21st century, Atmos. Chem. Phys., 15, 5123–5143, https://doi.org/10.5194/acp-15-5123-2015, 2015. a
St. Clair, J. M., McCabe, D. C., Crounse, J. D., Steiner, U., and Wennberg, P. O.: Chemical ionization tandem mass spectrometer for the in situ measurement of methyl hydrogen peroxide, Rev. Sci. Instrum., 81, 095102, https://doi.org/10.1063/1.3480552, 2010. a
St. Clair, J. M., Rivera-Rios, J. C., Crounse, J. D., Knap, H. C., Bates, K. H., Teng, A. P., Jorgensen, S., Kjaergaard, H. G., Keutsch, F. N., and Wennberg, P. O.: Kinetics and Products of the Reaction of the First-Generation Isoprene Hydroxy Hydroperoxide (ISOPOOH) with OH, J. Phys. Chem. A, 120, 1441–1451, https://doi.org/10.1021/acs.jpca.5b06532, 2016. a, b
Suh, I., Lei, W., and Zhang, R.: Experimental and Theoretical Studies of Isoprene Reaction with NO3, J. Phys. Chem. A, 105, 6471–6478, https://doi.org/10.1021/jp0105950, 2001. a
Teng, A. P., Crounse, J. D., Lee, L., St. Clair, J. M., Cohen, R. C., and Wennberg, P. O.: Hydroxy nitrate production in the OH-initiated oxidation of alkenes, Atmos. Chem. Phys., 15, 4297–4316, https://doi.org/10.5194/acp-15-4297-2015, 2015. a, b, c, d
Teng, A. P., Crounse, J. D., and Wennberg, P. O.: Isoprene Peroxy Radical Dynamics, J. Am. Chem. Soc., 139, 5367–5377, https://doi.org/10.1021/jacs.6b12838, 2017. a, b, c, d, e, f, g, h, i, j, k, l, m, n
Vairavamurthy, A., Roberts, J. M., and Newman, L.: Methods for determination of low molecular weight carbonyl compounds in the atmosphere: A review, Atmos. Environ. Pt. A, 26, 1965–1993, https://doi.org/10.1016/0960-1686(92)90083-W, 1992. a, b
Vasquez, K. T., Xu, L., Allen, H. M., Praske, E., Crounse, J. D., and Wennberg, P. O.: GCHRToFCIMS – IHN GC Data from 2017 Caltech Roof Study, Version R0, https://doi.org/10.22002/D1.971, last access: 4 July 2018. a
Wennberg, P. O., Bates, K. H., Crounse, J. D., Dodson, L. G., McVay, R. C., Mertens, L. A., Nguyen, T. B., Praske, E., Schwantes, R. H., Smarte, M. D., St Clair, J. M., Teng, A. P., Zhang, X., and Seinfeld, J. H.: Gas-Phase Reactions of Isoprene and Its Major Oxidation Products, Chem. Rev., 118, 3337–3390, https://doi.org/10.1021/acs.chemrev.7b00439, 2018. a, b
Xiong, F., McAvey, K. M., Pratt, K. A., Groff, C. J., Hostetler, M. A., Lipton, M. A., Starn, T. K., Seeley, J. V., Bertman, S. B., Teng, A. P., Crounse, J. D., Nguyen, T. B., Wennberg, P. O., Misztal, P. K., Goldstein, A. H., Guenther, A. B., Koss, A. R., Olson, K. F., de Gouw, J. A., Baumann, K., Edgerton, E. S., Feiner, P. A., Zhang, L., Miller, D. O., Brune, W. H., and Shepson, P. B.: Observation of isoprene hydroxynitrates in the southeastern United States and implications for the fate of NOx, Atmos. Chem. Phys., 15, 11257–11272, https://doi.org/10.5194/acp-15-11257-2015, 2015. a
Zhao, Y., Kreisberg, N. M., Worton, D. R., Teng, A. P., Hering, S. V., and Goldstein, A. H.: Development of an In Situ Thermal Desorption Gas Chromatography Instrument for Quantifying Atmospheric Semi-Volatile Organic Compounds, Aerosol. Sci. Technol., 47, 258–266, https://doi.org/10.1080/02786826.2012.747673, 2013. a