the Creative Commons Attribution 4.0 License.
the Creative Commons Attribution 4.0 License.
All-sky assimilation of infrared radiances sensitive to mid- and upper-tropospheric moisture and cloud
Stefano Migliorini
Marco Matricardi
All-sky assimilation of infrared (IR) radiances has not yet become operational at any weather forecasting centre, but it promises to bring new observations in sensitive areas and avoid the need for cloud detection. A new all-sky IR configuration gives results comparable to (and in some areas better than) clear-sky assimilation of the same data, meaning that operational implementation is now feasible. The impact of seven upper-tropospheric water vapour (WV) sounding channels from the Infrared Atmospheric Sounding Interferometer (IASI) is evaluated in both all-sky and clear-sky approaches. All-sky radiative transfer simulations (and the forecast model's cloud fields) are now sufficiently accurate that systematic errors are comparable to those of clear-sky assimilation outside of a few difficult areas such as deep convection. All-sky assimilation brings 65 % more data than clear-sky assimilation globally, with the biggest increases in midlatitude storm tracks and tropical convective areas. However, all-sky gives slightly less weight to any one observation than in the clear-sky approach. In the midlatitudes, all-sky and clear-sky assimilation have similarly beneficial impact on mid- and upper-tropospheric dynamical forecast fields. Here the addition of data in cloudy areas is offset by the slightly lower weight given to the observations. But in the tropics, all-sky assimilation is significantly more beneficial than clear-sky assimilation, with improved dynamical short-range forecasts throughout the troposphere and stratosphere.
- Article
(36975 KB) - Full-text XML
- BibTeX
- EndNote
The author's copyright for this publication is transferred to ECMWF.
Infrared (IR) radiances from geostationary and polar-orbiting satellites are widely assimilated at operational weather forecasting centres, mostly for their sensitivity to temperature and water vapour. Cloud-affected scenes are mostly discarded with a loss of up to 80 % of available observations in a typical mid-tropospheric channel. In midlatitudes, the loss is largest where forecasts are most sensitive to initial conditions, in frontal areas (McNally, 2002). Many forecasting centres also use infrared observations above a diagnosed cloud top (e.g Pavelin et al., 2008; McNally, 2009; Pangaud et al., 2009; Lavanant et al., 2011). Some of these approaches assimilate channels with significant visibility of the cloud top but only if the cloud is overcast. But since overcast scenes are rare there is little data gained – for example, Pangaud et al. (2009) added just 3.5 % extra scenes globally. The method of Pavelin et al. (2008) assimilates scenes with fractional cloud but in practice only from channels with less than 10 % visibility of the cloud top, also restricting the amount of data that can be gained. Further, because these approaches hold the cloud information constant in the assimilation system, it is not possible to use cloud directly to improve the model initial conditions.
Greater progress has been made in using microwave radiances affected by clouds and precipitation. Most weather forecasting centres are now developing some form of all-sky microwave radiance assimilation (Geer et al., 2018, and references therein). At the European Centre for Medium-range Weather Forecasts (ECMWF) all-sky microwave radiances sensitive to water vapour, cloud, and precipitation already contribute around 20 % of the observational impact on short-range forecast skill, assessed using adjoint-based measures of forecast sensitivity (Geer et al., 2017b). This impact is as large as that from microwave temperature sounding observations, showing that observations with primarily humidity sensitivity can be used just as effectively by modern data assimilation systems as more direct observations of the dynamical state can, something which was not obvious a few years ago (Bengtsson and Hodges, 2005). In the same system, infrared radiances sensitive to water vapour contribute only around 5 % of observational impact, compared to 11 % for IR channels sensitive to temperature, ozone, and the surface. Although many factors play a role, this suggests that IR water vapour observations are under-utilized compared to their equivalents in the microwave. All-sky radiance assimilation techniques could help address this by adding observations in frontal areas and by making direct use of cloud information.
Before considering the assimilation of IR radiances in all-sky conditions it is necessary to have a forecast model and observation operator that can simulate cloudy observations with systematic errors that are substantially smaller than the (random) observation errors. Early illustrations of the capability of weather forecasting models to simulate infrared window channels in all-sky conditions were given by Chevallier et al. (2001) and Chevallier and Kelly (2002). However, their simulated brightness temperatures showed cloud features with broader spatial scales than the observations and in some areas large systematic errors. To explain these it was hypothesized that the forecast model was lacking ice water content in high clouds and also generating excessive tropical deep convection over the ocean. Increases in the horizontal resolution of forecast models mean that clouds can now be simulated on scales that are closer to those of the observations. More generally, the “model to satellite” approach for validating forecast models against all-sky IR (and other) observations is now well established and demonstrates a reasonable capability in current models (e.g Otkin et al., 2009, 2017; Matsui et al., 2014; Greenwald et al., 2016). However, whether the quality of forward-modelled cloudy IR radiances is good enough for operational data assimilation remains to be demonstrated. For example, Okamoto (2017) found insufficiently low brightness temperatures that could come from a lack of high cloud in the forecast model or insufficient scattering from high ice clouds in the observation operator. However, in the current ECMWF model, cloud biases are small outside of a few difficult situations such as maritime stratocumulus regions and shallow-convection in cold air outbreaks, at least as revealed by all-sky microwave observations (Kazumori et al., 2016).
For the observation operator, a large number of radiative transfer codes have the capability of simulating cloudy infrared radiances (e.g Aumann et al., 2018), but for use in data assimilation they require a combination of sufficient accuracy, computational efficiency, and also a tangent-linear and adjoint model capability (at least for variational data assimilation). Hence, this work uses the cloud-capable RTTOV model (Radiative Transfer for TOVS, Saunders et al., 2018) with the Chou et al. (1999) scaling approximation. Here, the absorption is scaled to account for scattering into the beam from a diffuse black body radiation field at the local temperature, decoupling the radiative transfer solution between levels. This is much faster than a full scattering solver such as a discrete ordinates approach and gives good accuracy in the IR in the absence of solar sources (Matricardi, 2005).
It has been more difficult to find an adequate model for cloud overlap in RTTOV. Cloud overlap is important to get right because multiple cloud layers are often visible within a single IR field of view (e.g. McMillin and Dean, 1982). Hence, the treatment of cloud as a single layer or even a double layer is insufficient (e.g. Prates et al., 2014). For accuracy RTTOV allows multiply overlapped cloud layers, represented using a maximum random overlap assumption along with up to around 100 independent radiative transfer columns (Matricardi, 2005). This is computationally demanding, particularly in terms of memory. Okamoto et al. (2014) had to thin observations by an additional factor of 10 to be able to afford the RTTOV cloudy IR radiative transfer within the ECMWF forecasting system. Because of this a simplified two-column cloud overlap scheme was developed to allow testing with a full complement of observations, but this generated errors of around 5–10 K in tropical convection, as will be shown later. The current work takes advantage of increased computational resources to go back to the multiple independent column approach, putting aside for the moment the need to develop a cloud overlap scheme that combines speed and accuracy.
A final area that has been difficult to get right has been the ice cloud optical properties. Differences in microphysical representations of ice clouds can lead to differences on the order of 5–10 K in simulated cloudy IR brightness temperatures (e.g. Faijan et al., 2012; Yi et al., 2016). However, the most recent RTTOV offers ice cloud optical properties that give good results in closure studies between radar and lidar retrievals and IR observations (Vidot et al., 2015). With these settings in RTTOV the combination of the ECMWF forecast model and RTTOV version 12.2 is now able to simulate all-sky radiances with great fidelity and only small remaining systematic errors, as will be shown later. This is a good starting point for assimilation of all-sky radiances.
The next consideration is the choice of channels and instruments to be assimilated. For nowcasting and local area modelling, the aim is to directly initialize clouds, and thus the infrared window channels are of interest, often taking advantage of the frequent sampling from geostationary platforms (e.g. Vukicevic et al., 2006; Okamoto, 2013; Stengel et al., 2013; Martinet et al., 2013, 2014a; Kurzrock et al., 2018). One barrier to using these channels is the “zero gradient” problem that makes it difficult for data assimilation systems to assimilate cloud information in the absence of cloud in the background (e.g. Vukicevic et al., 2004; Errico et al., 2007; Seaman et al., 2010). However, this can be mitigated in assimilation systems that can relinearize (e.g. through an “outer loop”, Bauer et al., 2010) or by various techniques that can provide a gradient even at zero (e.g. Lopez, 2011). Another barrier to assimilating window channels is that radiative transfer modelling of the surface emission is difficult, particularly in dry regions (e.g. Trigo and Viterbo, 2003).
Temperature sounding channels might seem more promising, since weighting functions can be selected that do not see the surface and help identify the vertical location of the cloud. However, these channels are still affected by the zero-gradient problem. Further, they are already used for their temperature sensitivity in clear skies, with very high accuracy requirements (on the order of 0.1 K). The assimilation of all-sky microwave temperature sounding channels has been tried but has proved difficult for reasons that also apply to the IR (Geer et al., 2012, 2018): first, the possibility of aliasing of cloud errors into the temperature field, which could destroy the main temperature analysis; second, the use of temperature channels in clear skies is often very highly developed, so that a new all-sky framework may lack of the technical features that contribute to the success of the clear-sky approach. However, operational use of microwave temperature sounders has been achieved in non-precipitating conditions (Zhu et al., 2016; Migliorini and Candy, 2019).
The IR water vapour sounding channels around the 6.5 µm water vapour band generally do not see the surface and they have more linear sensitivity to a combination of water vapour and cloud. Hence, they are most suitable for the initial development of all-sky IR assimilation (Chevallier et al., 2004; Okamoto, 2017). Microwave water vapour sounding radiances have similar properties (although they are much less sensitive to cirrus), and this has allowed the development of operational all-sky microwave assimilation with a substantial impact on forecasts (Geer et al., 2014, 2017b). A main benefit of water vapour sounding radiances is that even when the data assimilation system cannot generate a gradient with respect to cloud (the zero-gradient problem) these channels retain a sensitivity to relative humidity that acts in the same direction. So a data assimilation system can still adjust relative humidity to try to fit the observations and this will likely influence the cloud in the right direction too. For these reasons, the infrared water vapour channels have become the main target in the development of all-sky IR assimilation (e.g Otkin, 2012; Jones et al., 2013; Cintineo et al., 2016; Zhang et al., 2016; Harnisch et al., 2016; Honda et al., 2018; Okamoto et al., 2019).
The current work concentrates on the water vapour sounding channels of the Infrared Atmospheric Sounding Interferometer (IASI) because observations from two polar orbiting satellites (Metop-A and Metop-B) together provide the largest impact of any infrared water vapour (WV) data in the ECMWF system (Geer et al., 2017b). For hyperspectral IR sounders a consideration is the subset of channels selected for assimilation. The current work stays with the channels selected for clear-sky assimilation (Collard and McNally, 2009) in order to cleanly compare all-sky and clear-sky assimilation of the same data. However, there is scope to extend the channel selection to gain even more information on cloud properties (Martinet et al., 2014b) and to add more information content from water vapour sounding channels (Migliorini, 2015), which are currently sparsely utilized.
Bauer et al. (2011) and Geer et al. (2018) have reviewed the data assimilation approaches being used by operational forecasting centres for assimilating cloud- and precipitation-sensitive observations. To benefit from cloud information, a minimum requirement is to be able to update the data assimilation control vector to be able to better fit a cloudy observation. In four-dimensional variational data assimilation (4D-Var) this link is made by the tangent-linear (TL) and adjoint of the forecast model, including moist processes (e.g Tompkins and Janisková, 2004; Lopez and Moreau, 2005) and the TL and adjoint of the observation operator. Other potential links are a dedicated cloud control variable, a cloud incrementing operator (Migliorini et al., 2018), and the use of ensemble covariances (Zhu et al., 2016; Lien et al., 2016). In a 4D-Var assimilation system, using the TL and adjoint approach, Bauer et al. (2010) and Geer et al. (2014) documented through single-observation experiments how a “generalized tracing” effect allows the update of dynamical initial conditions to better fit observed cloud and precipitation in all-sky microwave water vapour sounding observations. An improved dynamical analysis then leads to improved forecasts. Cloud is not part of the control vector in this approach but because it is completely determined by the forecast model trajectory it is still part of the wider analysis. This relies on the cloud and precipitation being largely driven by the dynamics (which appears true, certainly after the first hour or two, in the ECMWF model, Geer et al., 2017a). An advantage of the ECMWF framework is the use of an outer loop update with the incremental version of 4D-Var (Courtier et al., 1994), which allows non-linear observations, such as those related to cloud and precipitation, to be assimilated (Bauer et al., 2010; Bonavita et al., 2018).
Despite the great interest in this area, all-sky IR radiances are still not assimilated at any operational centre. A pre-condition for operational implementation is that forecast scores must be improved (or at least not degraded) compared to an already very good starting point, based on the current full global observing system. All-sky assimilation is applied to satellite radiances that are already used in clear-sky conditions within a very highly developed framework. This is a more testing scenario than found in most previous investigations of all-sky IR assimilation, which have been done in the context of reduced observing systems or observing system simulation frameworks, often only for case studies, and often focusing on the analysis fits rather than the quality of subsequent forecasts. Forecast quality can be degraded by fitting cloud observations too closely, so operational all-sky assimilation tries to retain useful information on slightly broader scales while filtering out the information that would just perturb forecasts to no useful benefit (e.g. Geer and Bauer, 2011). The aim of the current work is to document the first configuration of the ECMWF system that produces comparable forecast quality to clear-sky assimilation of the same radiances, and hence could be considered for operational implementation. These small initial improvements could then be built upon, as with the development of all-sky microwave assimilation, which took many years to become a dominant part of the observing system (e.g. Geer et al., 2017b).
At ECMWF, early developments towards all-sky IR assimilation started with simulating cloudy radiances (Chevallier et al., 2001; Chevallier and Kelly, 2002) and a long-term vision (Chevallier et al., 2002) of a 4D-Var direct radiance assimilation using linearized moist physics to link a dynamical control vector with cloud variables at observation locations. Chevallier et al. (2004) investigated the combination of TL and adjoint models for moist physics and radiative transfer and Matricardi (2005) developed a first version of what became the RTTOV cloudy IR observation operator. Following the operational implementation of direct all-sky microwave radiance assimilation (Bauer et al., 2010) attempts at applying similar techniques in the IR were not successful, although Okamoto et al. (2014) devised an observation error model and demonstrated the quality of all-sky background departures by comparison to IASI observations. Later, two water vapour sounding channels from High-resolution InfraRed Sounder (HIRS) were assimilated in all-sky conditions with improvements to short-range forecasts in a high-quality forecasting system (reported in Geer et al., 2018) but it was not tested whether clear-sky assimilation of the same data could perform just as well. Attention focused again on applying the all-sky framework to the IASI water vapour channels (Migliorini et al., 2014). In the meantime, the clear-sky assimilation of IASI has been substantially improved, for example, by imager-assisted cloud detection (Eresmaa, 2014) and the use of inter-channel observation error covariance matrices (Bormann et al., 2016). Compounded by the addition of a huge amount of all-sky microwave water vapour radiances over the last few years (Geer et al., 2017b) it has become ever harder to demonstrate improvements when going to all-sky IR water vapour assimilation. To catch up with this moving target, key recent steps have been the availability of an inter-channel error covariance matrix that can scale as a function of cloud amount, representing the changing error covariance structures in clear and cloudy skies (Geer, 2019), the improved quality of RTTOV, particularly the ice-cloud representation (Vidot et al., 2015), and the availability of computer resources to run the multiple independent column radiative transfer.
The rest of the paper has the following structure. Section 2 describes how IASI observations are assimilated in clear-sky and all-sky approaches, with attention to the observation operator, observation error and data screening aspects. Section 3 establishes the model's ability to generate cloud fields and to simulate radiances that are consistent with those observed. Section 4 evaluates the results from data assimilation experiments by contrasting clear-sky and all-sky assimilation. Section 5 concludes the paper.
2.1 General framework
ECMWF makes analyses of the current state of the atmosphere to initialize a high-resolution (HRES) 10 d forecast at TCo1279 (around 8–9 km) horizontal resolution and 137 vertical levels (L137), as well as an ensemble of lower-resolution forecasts to provide the uncertainty of the HRES forecast. There are also forecast products aimed at extended and seasonal ranges. The HRES forecast is initialized from an “early delivery” 6 h window incremental 4D-Var data assimilation that itself is initialized from the main or “long-window” 12 h window 4D-Var data assimilation, both at high resolution (i.e TCo1279/L137). There is also an ensemble of lower-resolution data assimilations (EDA) to provide flow-dependent background errors for the main 4D-Var. The atmospheric analysis is complemented by separate ocean, sea ice, wave and land analyses. Further documentation can be found at http://www.ecmwf.int (last access: 7 September 2019).
Observations are assimilated from surface-based atmospheric platforms including aircraft and radiosonde, true surface observations (such as from meteorological stations and buoys), and satellites. Satellite data include scatterometers for ocean surface winds, radio-occultation bending angles, and atmospheric motion vectors, but the majority of data by volume and forecast impact are radiances from microwave and infrared satellites. As of February 2018, all-sky microwave radiances sensitive to water vapour, cloud, and precipitation were assimilated from 10 satellites, including microwave imagers and humidity sounders. Two similar sensors that have not yet been converted to all-sky assimilation were also assimilated. Microwave temperature sounding radiances were assimilated in clear skies from seven satellites (all but one using the Advanced Microwave Sounding Unit-A, AMSU-A). Infrared radiances were assimilated in clear skies and above low or overcast cloud, from polar orbiting and geostationary satellites. Radiances sensitive to temperature, ozone, and window channels were assimilated from four hyperspectral sounders in polar orbits: IASI on Metop-A and Metop-B, Cross-track Infrared Sounder (CrIS) on Suomi-NPP, and Advanced InfraRed Sounder (AIRS) on Aqua. Infrared water vapour sounding radiances were assimilated from the four hyperspectral sounders and, additionally, from five geostationary satellites. See, e.g. Geer et al. (2017b) for further details on satellite radiance usage.
The experiments used in this work are run at reduced horizontal resolution (TCo399, about 25 km) and with the 10 d forecast initialized directly from a 12 h long-window analysis. The EDA is not re-run so that the background errors do not change between experiments. This is the standard framework used for testing at ECMWF. Experience shows that results from the lower-resolution testing tend to be replicated at higher resolution, even in the case of all-sky developments, suggesting that the changing scales of cloud represented by the model (at least between 25 and 9 km grid resolutions) do not have a great effect on the use of all-sky observations. In these experiments, cycle 45r1 is used, the operational version since June 2018. Two periods of testing have been run, from 1 June to 31 August 2017 and from 1 December 2017 to 28 February 2018.
2.2 Clear-sky IASI assimilation
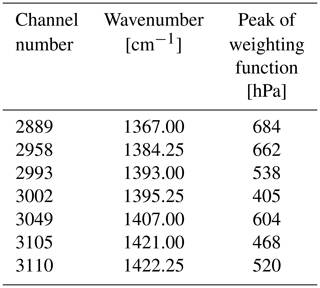
ECMWF assimilates 191 of the 8461 channels available from IASI, currently from two polar orbiting satellites, Metop-A and Metop-B. The channel selection is described by Collard and McNally (2009) but with a more recent addition of ozone sensitive channels (Han and McNally, 2010; Dragani and McNally, 2013). All IASI channels have a spectral width of 0.25 cm−1. Information on the atmospheric temperature profile and the surface is provided by 165 channels at wavenumbers between approximately 649 and 875 cm−1. The more recently added ozone sensitivity comes from 16 channels between 1014 and 1062 cm−1. There are seven mid- and upper-tropospheric water vapour channels between 1367 and 1422 cm−1 that are the target of all-sky assimilation in the current work. Finally, there are three lower tropospheric moisture channels between 1990 and 2015 cm−1 for which all-sky assimilation will not be tested, due to their relatively high surface sensitivity. Table 1 gives the details of the seven mid- and upper-tropospheric water vapour channels investigated in this work, together with a global mean peak of the weighting function. Geer (2019) examines the weighting functions of these channels in more detail.
Table 1Details of the seven IASI mid- and upper-tropospheric water vapour channels assimilated at ECMWF.
IASI observations are subject to a series of thinning and quality control steps. Many of these will be examined in more detail later in the context of all-sky assimilation, so only brief details are given here. IASI measures a 2 by 2 matrix of observations but a pre-thinning stage keeps only one, prioritizing the warmest scene as an initial way to screen for clouds. Within the main assimilation system, cloud is detected and removed using a combination of the McNally and Watts (2003) approach and imager cloud detection (Eresmaa, 2014). When cloud is detected, the aim is to discard only those channels with cloud sensitivity, keeping those that sound higher levels in the atmosphere. A small number of scenes detected as being completely overcast are, however, retained to be assimilated using a diagnosed cloud top as a lower boundary (McNally, 2009). However, this is only applied to channels below 875 cm−1, thus the WV channels are not involved. As a by-product of the McNally and Watts (2003) cloud detection, channels that may be sensitive to the surface over land are excluded. This is done by removing any channel that has more than a 1 % sensitivity to a hypothetical overcast cloud placed at roughly 500 m above the model surface. Aerosol-affected scenes are also detected and removed. A background departure check removes any observation which differs from the model background by more than 2.5 times the expected value (the square root of the sum of estimated background error and observation error variances in observation space). The remaining set of observations is thinned in roughly 100 km boxes with priority given to observations with the smallest window channel background departures as an additional way to exclude potentially cloudy scenes. All remaining channels are assimilated over ocean and land but avoiding areas affected by sea ice for channels over 875 cm−1, which includes the WV channels. Outer scan positions are discarded generally.
A globally constant observation error covariance matrix is used, which includes correlations between all the different channels of one observation (Bormann et al., 2016). Variational bias correction (VarBC) is applied, in common with most other satellite observation types (Auligné et al., 2007) with a globally constant predictor, four air mass predictors based on layer thicknesses across four different ranges, and a third-order polynomial in the instrument scan position. The surface skin temperature is treated as a sink variable in observation space, allowing the window channels to update the potentially erroneous first-guess skin temperature. Hyperspectral infrared observations are also assimilated from AIRS and CrIS using similar configurations to IASI.
2.3 All-sky IASI assimilation
2.3.1 Observation operator
Version 12.2 of RTTOV is used in this study (Saunders et al., 2018) with the cloudy IR modelling originally developed by Matricardi (2005), which uses the Chou et al. (1999) scaling of the absorption to account for scattering into the beam.
The inputs to RTTOV are the model's vertical profiles of pressure, temperature, specific humidity, ozone, hydrometeor variables (to be described shortly), and surface parameters, including skin temperature. The ECMWF model moist physics represents four hydrometeor types: cloud water, cloud ice, large-scale rain, and large-scale snow. Convective rain and snow can also be diagnosed from the convection scheme, as has been done for all-sky microwave assimilation (Bauer et al., 2010). However, for all-sky infrared simulations, no precipitation is given to RTTOV on the assumption that precipitation is always deeply shrouded within cloud and hence unimportant to the radiative transfer. The cloud is not assumed to cover the whole model grid box but rather is partitioned according to a cloud fraction that is also a vertical profile. However, the cloud water and cloud ice mixing ratios are stored as grid-box averages, so they must be divided by the layer cloud fraction to get the in-cloud mixing ratio, the required input variable for the RTTOV IR cloudy simulations. The cloud fraction is also passed into RTTOV for the cloud overlap scheme.
In RTTOV, cloud water optical properties are fixed and come from the so-called “OPAC” clouds defined by Matricardi (2005), with maritime and continental cloud types selected according to the land sea mask, and for each of these a stratus or cumulus type is selected based on the local Convective Available Potential Energy (CAPE), as described by Okamoto et al. (2014). The effect of water cloud microphysical details on infrared radiances is small (see, e.g. Matricardi, 2005; Geer et al., 2017a), and the sensitivity to these microphysical choices is expected to be small, particularly for mid- and upper-tropospheric water vapour sounding channels.
Cloud ice optical properties are pre-tabulated as a function of temperature and ice water content (Vidot et al., 2015). These are based on the ensemble model of six ice particle habits defined by Baran and Labonnote (2007). Single-particle optical properties have been computed from these, taking into account the non-spherical nature of these particles (Baran et al., 2011). To compute bulk optical properties, the particle size distribution of Field et al. (2007) is used, but it is adjusted to follow the mass-dimensional relationship of Cotton et al. (2013). Vidot et al. (2015) chose this ice cloud optical model based on closure studies between lidar and radar ice cloud retrievals and observed brightness temperatures.
The cloud overlap scheme has been documented by Matricardi (2005), where it is known as the “streams” method, but here we describe it as “multiple independent column” radiative transfer, which helps avoid confusion with the streams used in some scattering radiative transfer solvers. This scheme distributes clouds in the vertical according to maximum random overlap and then finds a set of independent columns that can exactly represent this distribution, with each column containing only homogeneous cloud (i.e. on any one layer, the cloud fraction is either zero or 1). More typical multiple independent column approaches use a fixed set of columns covering equal fractions of the grid box. The RTTOV scheme instead uses exactly the number of columns required to represent all permutations of cloud layers, with each column representing the appropriate fraction of the grid box. The required number of columns varies from one scene to the next, and typically increases with the number of vertical levels in the input data, so that a complicated cloud profile from the ECMWF model (on 137 levels) can require up to around 100 columns. This results in high memory usage and hence made it hard to accommodate in earlier testing at ECMWF (Okamoto et al., 2014).
To allow testing to progress, a cheap “Cfrac max simple streams” (CMSS) approach was added to RTTOV that has not previously been documented but has been tested as part of the intercomparison of Aumann et al. (2018). This scheme represents the grid box (or equivalently, satellite field of view) as just two independent columns, one clear and one cloudy, as has been done for the all-sky microwave (Geer et al., 2009). The area occupied by the cloudy column is given by an effective cloud fraction that, for the IR CMSS scheme, is computed as the maximum cloud fraction in the atmosphere above 750 hPa. This scheme was intended as a stopgap for use with high-peaking channels and assumes that, in this case, cloud overlap and multiple cloud layers are unimportant.
Both the multiple column and CMSS scheme are tested later, indicating that CMSS has large errors even for upper-tropospheric channels. Hence, the multiple column approach has been used throughout the rest of this work. This is possible due to increasing supercomputing resources and, in particular, due to the increased availability of memory for the observation operator that is a side-effect of the move to increased resolution for the forecast model. In terms of supercomputer usage at ECMWF, the multiple independent column radiative transfer is approximately 34 times more expensive than standard RTTOV clear-sky radiative transfer. This could be affordable in the HRES operational configuration, where the observation operator is a small fraction of the total cost. However, the relative cost of observation processing becomes larger as the forecast model resolution decreases, so this could push up the cost of lower-resolution systems like the EDA and the low-resolution experiments used for development. For example, at the testing resolution used here (TCo399), the all-sky experiments are 20 % more costly than the clear-sky experiments. It should be possible to make the all-sky radiative transfer less costly in future, for example, by using a smaller number of carefully chosen streams (O'Dell et al., 2007).
2.3.2 Observation errors
The observation error model has proved a critical part of getting all-sky IR assimilation to work at ECMWF, and due to the complexity of the work it has been described separately (Geer, 2019). For a clean separation, the error correlations are set to zero between the seven WV channels and the other IASI channels that remain in the clear-sky assimilation path. Hence, the seven WV channels are treated as an independent block in the full IASI error covariance matrix. The effect of zeroing the correlations between the seven WV channels and others has been tested in the clear-sky framework but is not significant (not shown).
The new error model combines the inflation of error variances as a function of a symmetric cloud proxy variable (Geer and Bauer, 2011; Okamoto et al., 2014) with a model for error correlations that also varies as a function of cloud amount. The latter is needed because error correlations are typically much stronger in cloudy skies (Bormann et al., 2011; Okamoto et al., 2019), and further, the existing clear-sky implementation of IASI assimilation uses a correlated observation error model with great benefit to forecast quality (Bormann et al., 2016). Situation-dependent variability of error standard deviations and correlations is achieved by applying symmetric error scaling to the leading eigenvalue of an otherwise fixed observation error covariance matrix that was fitted to all-sky IASI background departures. For clear-sky observations this gives covariances similar to those already used for clear-sky assimilation. For example, in both approaches the error correlations for clear-sky observations approach zero between the top and bottom sounding of the seven channels. In these clear scenes, the all-sky model gives error standard deviations between 1.5 and 1.9 K, depending on channel, compared to 1.1 to 1.6 K in the operational clear-sky model (Geer, 2019, see Fig. 17). In fully cloudy situations the observation error standard deviations reach 10 to 22 K depending on channel, and correlations between the top- and bottom-peaking channels are around 0.98. It was found that use of the raw error covariance matrix had undesirable side-effects, with enhancement of gravity wave activity in the analysis and amplification of subtle inter-channel biases. These issues were mitigated by inflating the trailing eigenvalues of the error covariance matrix.
In the implementation chosen here, an eigenvalue floor of 1.0 is used, so that eigenvalues smaller than 1.0 are increased to 1.0. Geer (2019) also tested a floor at 0.37. Measured by the fit to humidity observations, this was marginally better but fits to some other observations, such as atmospheric motion vectors and radiosonde temperatures, slightly favoured the inflation to 1.0 over 0.37. Forecast scores were not significantly different between the two choices. An inflation of 1.0 was chosen for this work as it represents a slightly more cautious use of all-sky observations. This level of eigenvalue inflation has contributed to the increase in error standard deviations (in brightness temperatures) compared to the clear-sky assimilation.
To perform the symmetric error inflation in cloudy scenes, a number of cloud proxy variables have already been proposed. That of Harnisch et al. (2016) was considered, but it uses a fixed reference temperature to represent clear-sky brightness temperatures. This does not work for global data assimilation, as the typical clear-sky brightness temperature varies by many tens of kelvin. Adaptive Observation Error Inflation (AEOI, Minamide and Zhang, 2017) was also considered, but it generated a non-Gaussian probability density function (PDF) of background departures. The PDF went well above Gaussian around ±1 and significantly below the Gaussian both outside this range, and at 0 (not shown). It was concluded that the AEOI, as tested here, gave excessive weight to small background departures and insufficient weight to larger ones. Hence, the Okamoto et al. (2014) cloud proxy was chosen, which uses the average of the modelled and observed cloud effect, where cloud effect is computed as the difference between the all-sky and simulated clear-sky brightness temperatures. However, there are some minor adaptations here. First, we use the cloud effect in channel 2889 (the lowest-peaking channel) to determine observation errors for the whole block of seven WV channels, Second, Okamoto et al. used the absolute value of the cloud effect, but here we allow both positive and negative values, noting that the differences are minor. It was also important to activate variational quality control (VarQC), which has previously proven beneficial for all-sky microwave assimilation (Geer and Bauer, 2011). Similar settings were used here, i.e. a prior probability of gross error of 0.5. The way to implement VarQC alongside correlated observation errors is not obvious and was solved by applying VarQC to the eigentransformed departures. More details of the implementation of VarQC and the correlated error model are given by Geer (2019). Together with the slightly larger error standard deviations, even for clear scenes, the use of VarQC means that any one all-sky observation will not have as high weight in the analysis as that same observation assimilated in the clear-sky framework. This is explored in Sect. 4.3.
2.3.3 Data selection
Many investigators have suggested removing cloudy scenes that may be difficult to assimilate. For example, Martinet et al. (2013) and Okamoto et al. (2014) removed inhomogeneous scenes based on high-resolution cloud masks from co-located imagers. There are disadvantages to selecting observations in this way. First, a lot of data are lost, with Martinet et al. finding homogeneous scenes were only 14 % of a dataset that had already been selected for overcast cloud. Second, data selection can bias the sample of background departures available for assimilation. Okamoto et al. showed that selection creates a non-Gaussian, lopsided PDF of departures. Another approach is to keep only the clear–clear and cloudy–cloudy sample, excluding situations where the model and observed cloud states disagree (e.g. Polkinghorne and Vukicevic, 2011). However, a main purpose of the “symmetric” observation error model is to treat mismatches between the observed and modelled cloud as representation error, boosting observation error in these situations but still allowing them to contribute to an improved analysis. In the current work we follow the strategy successfully adopted for all-sky microwave assimilation, so that all scenes are made available for data assimilation no matter the state of cloud in the observations or model (Bauer et al., 2010).
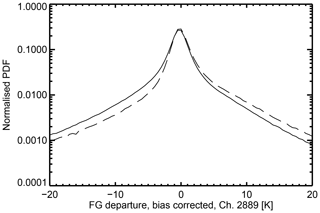
Figure 1PDFs of bias-corrected background departures from 1 to 20 June 2017 in channel 2889 (the lowest peaking of the WV sounding weighting functions). The solid line is the sample prior to box thinning and the dashed line is after box thinning. Thinning removes 75 % of remaining data, but the PDFs have been normalized in order to compare their shapes.
However, there is one impediment to achieving perfectly symmetrical all-sky PDF of background departures. The IASI observations are currently thinned to prioritize cloud-free scenes in a “hole hunting” strategy. This thinning cannot easily be turned off as it is an essential part of the usage of the temperature, ozone, and window channels of IASI in clear skies. The all-sky channels need to come from the same observations as the clear-sky channels so they can use the dynamically estimated (sink variable) skin temperature that is controlled by the window channels. The first stage, pre-thinning, applies to the 2 by 2 sets of IASI fields of view (FOVs). The warmest of the these first three FOVs is selected, always discarding the fourth FOV due to quality issues. “Warmest” is judged using an average brightness temperature across 100 window channels. The second stage, box thinning, selects one observation per thinning box of roughly 100 km, taking the observation with the smallest clear-sky background departure in IASI channel 2239 (a window channel at 1204.5 cm−1). This removes an average of 75 % of data that is remaining after all prior thinning and quality checks. Figure 1 shows the effect on the PDF of the background departures. Thinning selects a sample that is on average warmer than before, and it reduces the cold tail (cloudy observations, clear model) while boosting the warm tail (clear observations, cloudy model). After thinning there is still a substantial cold tail, only slightly smaller than the warm tail, and hence there remains a mostly symmetric PDF for all-sky water vapour assimilation. Indeed the PDF prior to thinning was slightly lopsided in the other direction, so neither is perfectly symmetrical. To explain the relatively small effect of box thinning, it is possible that high ice clouds generally have broad spatial scales so that cloudy observations are still often the only ones available within any 100 km box.
Figure 2 gives a broader summary of the screening used for all-sky IASI assimilation. The same screening applies to all seven WV channels so they can always be treated as a block for the purposes of the observation error model. Although in practice an observation can trigger more than one screening failure (for example, surface sensitivity and aerosol contamination) in this figure they have been treated as if screening were a progressive process. Hence, observations failing blacklisting, surface sensitivity, or a background departure check (in that order) are not included in the later tests, and the total fraction of observations in the six panels adds up to 100 %. The pre-thinning stage is not represented in the figure.
Blacklisting (Fig. 2a) eliminates all data over sea ice and outside scan positions (1–10 and 108–119), which accounts for the minimum level of blacklisting losses of around 17 %. There is also blacklisting for the last 15 min of data in the assimilation window, which explains the greater rejection of observations falling near the dateline and prime meridian. This is because the TL and adjoint moist physics operators are not run on the last model time step in the data assimilation, so all-sky assimilation cannot be done.
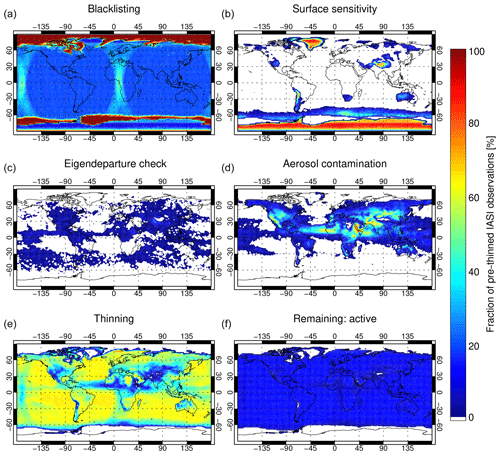
Figure 2Percentage of IASI all-sky observations failing quality and thinning checks (a–e) and percentage used actively in data assimilation (f), from 1 to 20 June 2017. The total in every latitude–longitude binning box adds up to 100 %.
Scenes in which the surface is visible are excluded (Fig. 2b), based on the clear-sky surface-to-space transmittance from RTTOV. If this is greater than 0.1 in the lowest-peaking channel (2889) then all the WV channels are discarded. This eliminates high areas (the Andes, the Himalaya, all of Antarctica) and locations and times where the atmosphere is particularly dry, such as along the ice edge in the Southern Ocean, over Australia, and occasionally in northern Siberia. This transmittance-based criterion differs from the method used in the clear-sky assimilation, which is based on a repurposed cloud detection approach, and produces slightly different results (see below).
The background check that is applied in clear-sky assimilation is turned off and replaced by a check on the size of the background eigendeparture across the seven WV channels. In the absence of background error (or in practice, assuming that background error is relatively small compared to representation error) these background eigendepartures should be distributed according to a Gaussian with zero mean and standard deviation of 1 (Geer, 2019). Hence, if any of the eigendepartures are outside the range ±3, all the channels are discarded. Figure 2c shows the eigendeparture QC is active in predominantly cloudy areas such as the inter-tropical convergence zone (ITCZ) and storm tracks. This suggests that large eigendepartures are mostly associated with cloudy scenes where the observation error model does not generate large enough observation errors.
Aerosol detection (Fig. 2d) remains the same as that for clear-sky channels. The remaining data are presented to the 100 km box thinning that prioritizes warm window channel brightness temperatures and is most active in areas that have not already suffered substantial data loss, such as in the subtropics over ocean (Fig. 2e). Around 15 % of the starting sample are retained for all-sky assimilation (Fig. 2f; see also Fig. 3c for a version with a more appropriate colour scale.)
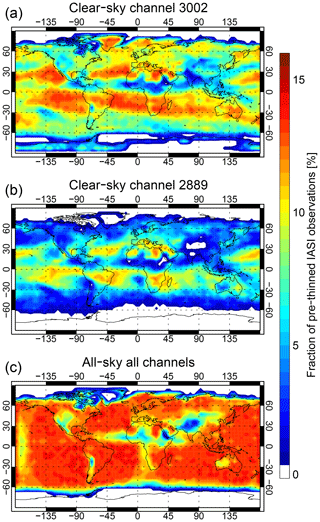
Figure 3Percentage of actively assimilated IASI observations in clear skies in (a) channel 2889 and (b) channel 3002 and (c) in all channels for all-sky assimilation, from 1 to 20 June 2017.
Figure 3a and b examine the number of observations available for clear-sky assimilation in the lowest and highest peaking of the WV channels, 2889 and 3002, respectively. All-sky assimilation (Fig. 3c) is able to provide a uniform coverage over most of the globe between 60∘ N and 60∘ S, whereas outside of the subtropical subsidence regions, clear-sky assimilation loses many observations to cloud. All-sky assimilation brings more observations throughout the midlatitude storm tracks, which better targets the most sensitive areas for growing forecast errors (McNally, 2002). The major losses for all-sky are in regions affected by aerosols (tropical Africa and parts of the Middle East and Asia) and at high latitudes where the surface becomes visible. Due to the transmittance-based surface screening, no all-sky data are assimilated over Antarctica or the higher parts of Greenland, where some observations are allowed in the clear-sky approach. There is no fundamental reason for this other than the choice of different surface screening approaches; in any future comparisons it would be better to use the same surface screening in both clear-sky and all-sky experiments.
Figure 4 quantifies data usage on a zonal basis, further summarizing the main patterns already seen in Fig. 3. For the highest-peaking channel, 3002, clear-sky assimilation retains 8 % of data and all-sky assimilation is able to boost this to 13 % in the storm tracks at 50∘ S. In the ITCZ, data usage goes from 6 % to 11 % with all-sky assimilation, showing the biggest relative impact is in the tropics. Globally (Table 2), all-sky assimilation brings 2.3 times more observations than the clear-sky approach in the lower-peaking channel 2889 but only 1.3 times in the highest-peaking channel, 3002. This shows that clear-sky assimilation still provides a reasonable coverage of observations in the storm tracks. On average across all seven channels, all-sky brings 1.65 times more data. This is a consequence of starting with mid- and upper-tropospheric channels in which cloud is relatively less prevalent; all-sky could bring bigger increases to the lower-peaking channels in future.
Figure 5a and b compare simulated and observed channel 2889 brightness temperatures over the North Atlantic area for a single analysis cycle. The figure is composed of observations from both Metop-A and Metop-B, hence the off-vertical striping in some areas, most prominently in the lower half of the plot, where there are gaps between the swaths of one satellite that are filled with data from the other. Because the in-fill data have a different zenith angle (and also because of the different validity times) they have slightly different brightness temperatures. This figure uses all available data after pre-thinning, and does not impose any data selection other than (Fig. 6d) the clear-sky cloud detection.
Table 2Global percentage of observations remaining for assimilation in the IASI WV channels during 1–20 June 2017.
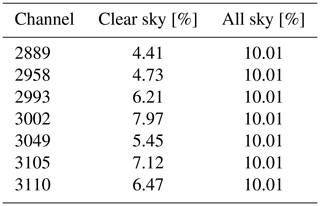
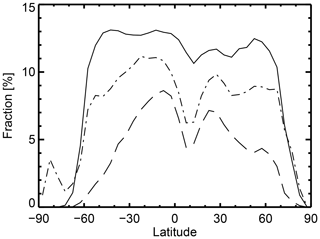
Figure 4Percentage of actively assimilated IASI observations in clear-sky in channel 2889 (dashed) and 3002 (dotted–dashed) and in all-sky assimilation (solid), which is the same for all channels, from 1 to 20 June 2017.
The coldest brightness temperatures in Fig. 5a and b (200 K and below in the tropics, and down to around 230 K in midlatitudes) tend to indicate high cloud. Taking a synoptic to mesoscale viewpoint, cloud patterns are generally well represented in the background when compared to the real observations. This is true even in the ITCZ, where low observed brightness temperatures (TBs) of around 200 K indicate convection embedded in the broader high-humidity ITCZ region, which has TBs of around 260 K. Around 5–10∘ N, between South America and Africa, there is a string of around five areas of low TB that suggest organized convection (Fig. 5a). The model (Fig. 5b) creates a string of similar features but with TBs closer to 230 K, and with no agreement at the finest scales but reasonable agreement on the broader location of the convection. The simulated brightness temperatures in these five systems are generally warmer than observed, but this is not a general feature of the model. For example, on this plot the convective systems over South America and the eastern Pacific are modelled with brightness temperatures that are as low as observed. Further, when departures are averaged over longer timescales in the Atlantic ITCZ, biases are small and in the opposite direction (simulations colder than observed). In contrast to the good quality of the synoptic and mesoscale cloud layout, the finest scales reveal many errors and misplacements, which will ultimately be modelled as representation error in the observation error model. Finally, in the vicinity of convection, the observations appear to have finer scales than the simulations, though a comparison at the full horizontal resolution of the ECMWF system (9 km rather than 25 km) would be expected to have a better match of scales but possibly greater mislocation error.
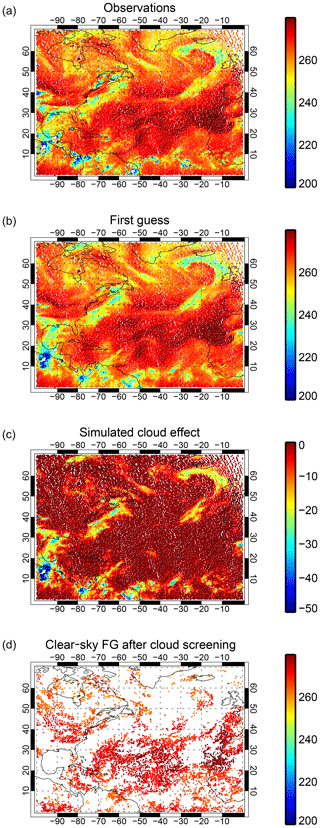
Figure 5Observations and simulated brightness temperatures, in kelvin, from IASI channel 2889 on Metop-A and Metop-B between 21:00 UTC on 31 May 2017 and 09:00 UTC on 1 June 2017. VarBC bias correction is applied to the simulated brightness temperatures in panels (b) and (d). The cloud effect in panel (c) is computed as the simulated clear-sky minus all-sky brightness temperature.
Figure 5c shows the simulated cloud effect, i.e. the difference between simulated all-sky TB and a simulated TB ignoring the presence of hydrometeors. In midlatitudes, in this channel, clouds decrease brightness temperatures by up to around 20 K in the major frontal systems but by as little as 5 K in other areas that may correspond to thinner cirrus, or simply areas that are so moist that the clear-sky TB would already be so cold that adding an opaque cloud would not change the brightness temperatures by much. In contrast, in the tropics, convection can decrease brightness temperatures by at least 50 K. The simulated cloud effect helps confirm that most of the coldest brightness temperatures in Fig. 5a and b (e.g. TB <250 K) are affected by cloud. These areas also match well with those that would be discarded by cloud screening in the clear-sky approach (Fig. 5d). However, cloud screening also seems to identify some areas as cloud-affected that appear to be clear based on Fig. 5a–c: for example, in the mid-Atlantic (around 45∘ N, 40∘ W) and in an area around the Azores. Comparing Fig. 5b and d shows how much additional information all-sky assimilation should be able to bring.
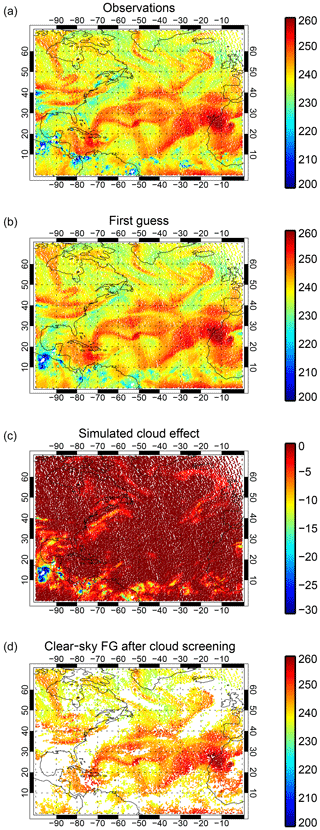
Figure 6 As in Fig. 5 but for channel 3002.
Figure 6 repeats the comparison but for the highest-peaking of the assimilated water vapour channels, channel 3002. The effect of cloud on midlatitude brightness temperatures is much smaller at around 5 K (Fig. 6c) and air masses with low brightness temperatures around 230 K (Fig. 6a and b) can be produced equally from a moist air mass and clear skies or with a combination of moisture and cloud. Hence, cloud has a more subtle effect on the radiances. The reduced importance of clouds is also recognized by the clear-sky cloud detection (Fig. 6d), which removes a much smaller sample of data in areas that are more consistent with the patterns of cloud in the simulated cloud effect (Fig. 6c). As seen in Sect. 2.3.3, even without all-sky assimilation, a good proportion of available data can be assimilated.
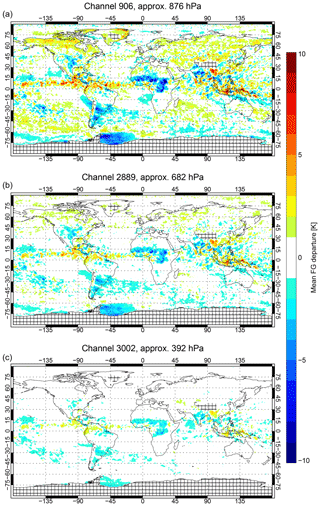
Figure 7Mean all-sky background departures from Metop-A (using operational bias correction) sampled over 1–20 June 2017 in three IASI channels. Cross-hatching indicates excluded areas.
Figure 7 shows the mean all-sky background departures over a 20 d period at the beginning of June 2017 from the passive monitoring experiments. Rather than apply the full all-sky screening, here all available IASI observations have been included, removing only those affected by orography over 2500 m, and by removing the whole of Antarctica. Negative biases around the Antarctic continent, particularly in the Weddell Sea, are likely due the problems of modelling surface emission from sea ice, helping justify the exclusion of sea ice areas during the data assimilation. Figure 7a shows the results from channel 906 at 871.25 cm−1, which is not assimilated in the current work. This is a low-peaking channel with relatively large biases due to it seeing into the boundary layer and the higher contrast between brightness temperatures in clear skies and cold, high cloud tops. However, the lowest-peaking assimilated all-sky channel (2889, Fig. 7b) and highest peaking (3002, Fig. 7c) show much smaller biases, with very few areas showing more than 2–4 K biases. The bias patterns are in many areas just less extreme versions of those in the low-peaking channel.
Some of the main all-sky IR biases are consistent with those previously seen in the all-sky microwave. For example, a lack of cloud over the marine stratocumulus regions (e.g. in areas off the coasts of Chile and Angola) would lead to the modelled brightness temperatures being too warm, and could explain the negative biases in these areas. Such a pattern would be consistent with the results of Kazumori et al. (2016) based on all-sky microwave imager radiances. There also appears to be a lack of cloud, mostly likely deep convective cloud (whether due to extent or frequency is not clear), over continental regions such as the midwestern United States, India, Brazil, Argentina and central Africa. Based on all-sky microwave comparisons, Geer and Baordo (2014) have already hypothesized a lack of convection over land areas and Chambon and Geer (2017) have illustrated a too-early onset and lack of overnight convection in central Africa. In the inter-tropical convergence zone between 180 and 0∘ W there appears to be slightly too much convection, which might be consistent with the need of Geer and Baordo (2014) to use quite low-scattering cloud optical properties for all-sky microwave over the ocean. However, other biases, such as the small negative biases in the South Pacific Convergence Zone (SPCZ) and the positive biases in southern storm tracks (here mainly in the lowest-peaking channel) remain to be explained. A full examination of these results would require a separate study but could provide valuable information on model cloud biases. Further, the possibility of constraining cloud and precipitation properties simultaneously from infrared and microwave supports the strategy of assimilating (or at least monitoring) as many cloud-sensitive radiances as possible to help understand model biases (Geer et al., 2017a).
As far as all-sky assimilation goes, biases reach 2–4 K only in predominantly cloud-affected areas. In these areas the observation error model will assign error standard deviations of up to 10 to 20 K, meaning that the biases will not have much weight in the analysis and will be unlikely to have a large effect. In the case of all-sky microwave assimilation, observations with cloud-related biases that are a much larger proportion of the observation error can still often be assimilated with benefit to forecasts (Lonitz and Geer, 2017). Hence, for the current work on all-sky IR there should be no need to apply a cloud-related bias correction like that of Otkin et al. (2018) or to exclude observations with excessively large biases, such as is done in cold-air outbreak regions in the all-sky microwave (Lonitz and Geer, 2015). However, the biases in the low-peaking channel 906 might be too large in some areas for successful data assimilation, helping confirm the selection of higher-peaking water vapour sounding channels for initial exploitation within all-sky IR.
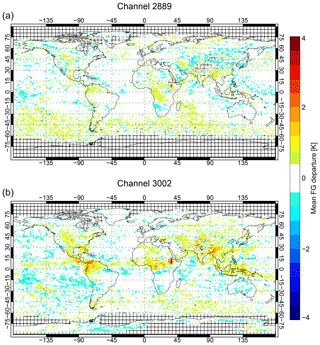
Figure 8 Mean clear-sky background departures in channels 2889 and 3002 (using operational bias correction) sampled over 1–20 June 2017. The sample is composed only of actively assimilated observations from Metop-A.
In these WV channels the all-sky biases are not so much larger than the biases present in the clear-sky assimilation of the same data, shown in Fig. 8. It has been necessary to reduce the range of the colour scale compared to the all-sky figure, but outside of the particular areas of all-sky bias discussed above, such as the ITCZ and convection over land, biases are comparable. However, in the clear-sky data in channel 3002, the ITCZ and subtropical land areas actually show a systematic positive bias of around 1 K, where undetected cloud would produce a negative bias. This suggests that cloud detection is highly effective but that (due to selecting the warmest observations and by selecting clear-sky scenes) it creates a sample of observations that is biased slightly warm compared to the background. One of the advantages of all-sky assimilation is to avoid creating artificial sampling biases between model and observations (Bauer et al., 2010).
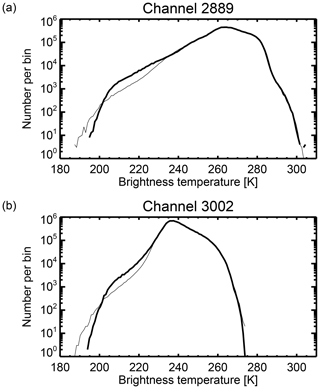
Figure 9 Histograms of brightness temperatures from observation (thick) and bias-corrected background simulation (thin) for lowest- (a) and highest-peaking (b) WV channels. Based on all available observations from 1 to 20 June 2017 excluding only high orography (>2500 m) and Antarctica.
A final illustration of the quality of the all-sky radiative transfer is given by the brightness temperature histogram comparison in Fig. 9. Because of the spatial and temporal mismatches between observations and simulations on small scales, this helps check if the simulations represent the same “climate” of brightness temperatures. Down to around 230 K, the agreement is almost exact, but the simulations then underpredict the occurrence of brightness temperatures between 200 and 230 K. This is likely caused by the underprediction of convection over land areas revealed in the negative biases in Fig. 7 but could also come from scale mismatch. The simulations generate many more brightness temperatures below 200 K than are present in the observations. The same problem is seen in Fig. 5, where observations are completely missing in the cores of intense convection systems, for example, over northeastern Brazil. This is a problem of the observation pre-processing, which currently rejects the whole observation whenever negative radiances are generated in any channel of the instrument. The shortwave channels of IASI (above around 1900 cm−1) often record negative radiances at the low brightness temperatures associated with the most intense deep convection. In future, this check will be relaxed, but it only affects a very small number of observations, thus it should not affect the present results much. Going back to the bigger picture, comparing Fig. 9a and b shows that similar patterns of agreement are present in the lowest- and highest-peaking WV channels (and the intermediate channels too, not shown). Agreement is not perfect but good enough for attempting all-sky assimilation.
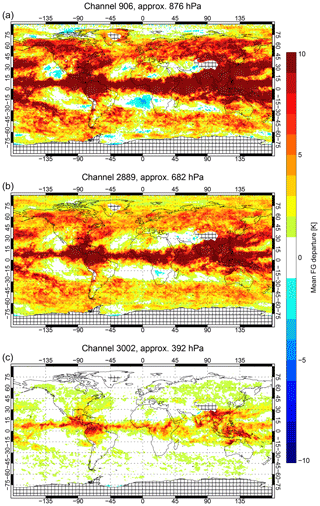
Figure 10Mean all-sky background departures, as in Fig. 7 but using the CMSS cloud overlap. To retain the same colour bar as the other figure, many biases have been allowed to go off scale.
After the work of Okamoto et al. (2014), attempts at all-sky assimilation at ECMWF have used the CMSS cloud overlap rather than multiple independent columns. Figure 10 shows the background departures using the CMSS cloud overlap. In the highest-peaking channel, where cloud has the least effect on the brightness temperatures, biases are 5–10 K in tropical convective areas. In lower-peaking channels, biases are larger still. In earlier testing, biases did not appear so big because they were compensated for by a reduced radiative effect of ice clouds coming from earlier choices of ice microphysical assumptions (e.g. those from Matricardi, 2005). This comparison to multiple independent columns (Fig. 7) shows that the CMSS approximation is highly inaccurate and illustrates the importance of correctly representing the cloud fraction and cloud overlap in all-sky infrared radiative transfer.
4.1 In the full observing system
All-sky and clear-sky assimilation have been tested with a set of three experiments (Table 3) based on the system configurations described earlier. The seven WV channels from Metop-A and Metop-B IASI are activated in either clear-sky or all-sky and these experiments are compared to a “No WV7” control that contains all other observations except the seven WV channels. To be clear, this means that all other IASI channels currently assimilated in the clear-sky approach (see Sect. 2.2) remain active. Further, data usage in the “clear-sky” experiment is the same as in the operational system. Experiments have been run for a total of 6 months over two separate periods, June–August 2017 and December 2017–February 2018, which are combined in the results shown here.
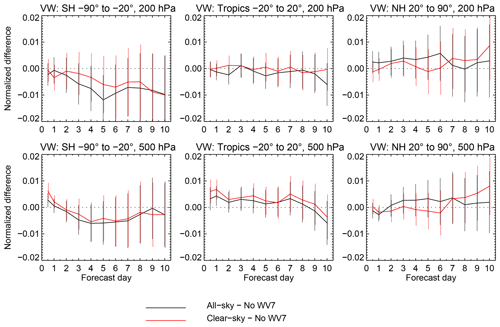
Figure 11Change in vector wind RMSE due to assimilation of the seven IASI WV channels using either the clear-sky approach (red) or all-sky approach (black). Change in RMSE is relative to an experiment in which the seven IASI WV channels are not assimilated, normalized by the RMSE of the no-observation experiment. Error bars indicate 95 % confidence range with a S̆idák correction for eight independent tests, following Geer (2016).
Figure 11 shows the change in vector wind root-mean-square error (RMSE) resulting from the assimilation of the seven IASI WV channels, with verification carried out against each experiment's own analysis. Assimilating the WV channels has generally less than a 1 % impact on these scores in either direction, and rarely are the differences significantly different from neutral. A similar picture is seen in other variables, such as geopotential height, temperature and relative humidity (not shown). There are no statistically significant differences between clear-sky and all-sky assimilation, but all-sky assimilation has a statistically significant impact on Southern Hemisphere (SH) day 5 winds where clear-sky does not. To interpret this, either of the all-sky or clear-sky configurations could have created a significant improvement in forecast quality, but by chance it was the all-sky configuration here. This illustrates the effect of chaotic variability in forecast scores that makes it hard to verify such small changes (Geer, 2016).
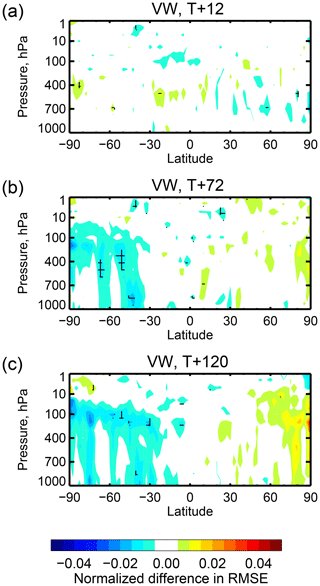
Figure 12Normalized change in vector wind RMSE due to assimilation of the seven IASI WV channels using the all-sky approach, relative to the No WV7 experiment. Cross-hatching indicates 95 % statistical significance with a S̆idák correction assuming there are 20 independent hypothesis tests being made in one latitude–pressure diagram. Normalization is by the errors in the No WV7 experiment.
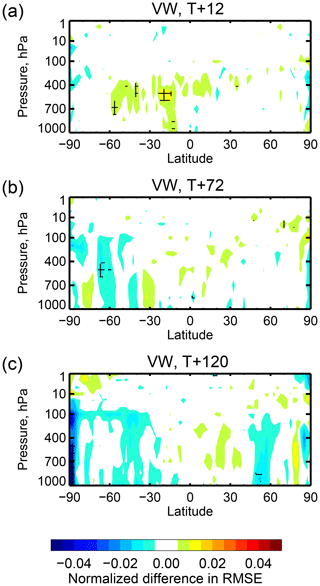
Figure 13Normalized change in vector wind RMSE due to assimilation of the seven IASI WV channels using the clear-sky approach, as for Fig. 12.
The changes in forecast scores, relative to the No WV7 experiment, are resolved by latitude and by pressure level in Figs. 12 and 13. Again, all-sky assimilation appears to provide slightly more benefit than clear-sky through the forecast range to day 5 (T+120; T is used in this context to represent forecast initialization time) especially in the SH but without that difference being statistically significant (not shown). At mid-range (T+72 and T+120) there are areas of significant improvement in wind forecasts in the SH coming from all-sky assimilation (temperature and geopotential height have similar impact, not shown). However, in the day 5 Northern Hemisphere (NH) scores, clear-sky assimilation is slightly better than all-sky assimilation, though neither clear-sky nor all-sky assimilation is significantly different from the control. At short range (T+12) the clear-sky assimilation has slightly larger RMSEs than the control. Since the verification reference is the experiment's own analysis, this is not an independent measure of forecast quality, and equally it can be interpreted as a change in the size of the data assimilation increments. Compared to the control these have become slightly larger with clear-sky assimilation.
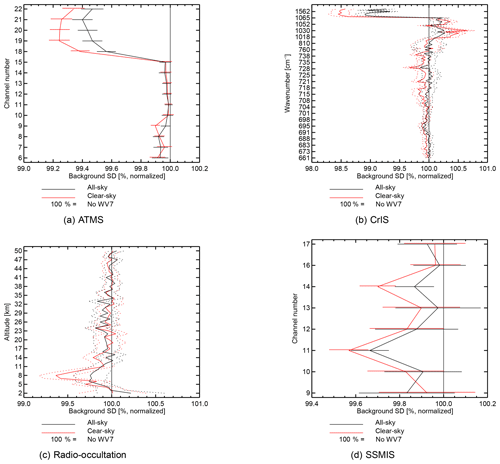
Figure 14Global standard deviation of bias-corrected background departures computed between the 12 h forecast and a selection of assimilated observations with mostly humidity and temperature sensitivity: (a) temperature and humidity sounder ATMS, (b) hyperspectral IR sounder CrIS, (c) radio occultation, and (d) All-sky microwave imager and sounder SSMIS. The 95 % confidence interval is represented either by error bars or dotted lines. Results are computed over the combined 6-month experimental period.
The 12 h forecast can also be verified using the background departure standard deviation against other observations. By this measure, both all-sky assimilation and clear-sky assimilation give significant improvements in fits related to moisture, wind and temperature. Figure 14 shows the normalized changes in background fit for a selection of observation types that offer humidity information. Short-range humidity fits are improved by around 0.6 % against Advanced Technology Microwave Sounder (ATMS, channels 18–22, Fig. 14a) and by 1 %–1.5 % against CrIS humidity channels (the 10 or so channels with the highest wavenumber, Fig. 14b). However, the results with all-sky assimilation are slightly worse than with clear-sky assimilation. A similar picture is seen in fits to geostationary WV radiances and AIRS (not shown) and GPSRO fits in the troposphere (this is the zone where GPSRO is sensitive to humidity, Fig. 14c). Against all-sky microwave channels, all-sky and clear-sky assimilation have beneficial effects without any overall advantage to one technique or the other. SSMIS channels 11 and 14 are not fit so well in the all-sky experiment, but in other channels the all-sky and clear-sky impacts are similar (Fig. 14d). Further, other all-sky instruments show a small advantage for the all-sky assimilation (not shown). There is likely a small deterioration in short-range humidity forecasts in the all-sky experiments compared to the clear sky, but the deterioration appears to be larger in the clear-sky areas.
In Fig. 14b, fits to CrIS channels around 1050 cm−1 are degraded by both clear-sky and all-sky but with clear-sky causing a bigger degradation. These channels are sensitive to ozone absorption, suggesting that the ozone analysis is being affected by assimilation of the water vapour sounding channels. Without exploring this degradation in detail, if all-sky assimilation has a smaller effect than clear sky, most likely it comes from a reduced weight being given to the observations.
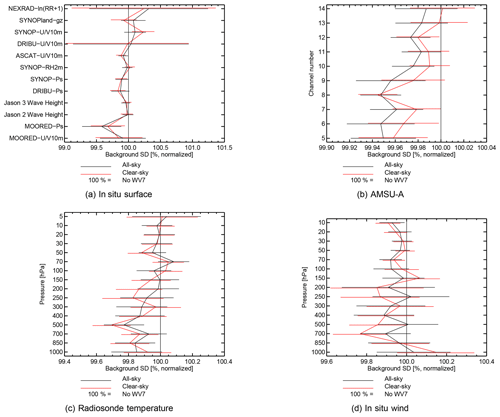
Figure 15As in Fig. 14 but for another selection of observing systems with pressure, wind and temperature sensitivity: (a) surface observations; (b) microwave temperature sounder AMSU-A; (c) temperature radiosondes; and (d) in situ wind measurements from sondes, profilers, and aircraft
Figure 15 includes observations that have sensitivity to wind, temperature, and pressure. Both clear-sky and all-sky assimilation improve fits to these observations with a broadly similar impact. For example, there are beneficial impacts on surface pressure, measured against land stations (“SYNOP”) and drifting and moored buoys (“DRIBU” and “MOORED-BUOYS”, Fig. 15a), and on tropospheric temperature, as measured by AMSU-A with its temperature sounding channels (Fig. 15b) and more directly by radiosondes (Fig. 15c). Winds are improved in both troposphere and stratosphere, with the impact clearest in the stratosphere against in situ wind observations (Fig. 15d). Figure 14a and c also give information on the temperature forecast – for example, in ATMS channels 6–9, which are mid-tropopause to tropopause-level temperature sounding channels, and in the stratospheric fits to GPSRO. ATMS channel 9 is not improved so much with all-sky as it is with clear-sky. However, the equivalent AMSU-A channel 8 shows no such effect, suggesting it is not a major issue. Again the broadest picture is of equivalence between the impact of all-sky and clear-sky assimilation of the seven WV channels.
Adding the seven WV sounding channels, whether in clear sky or all sky, has a relatively minor effect on the utilization of the other IASI channels that remain active in the clear-sky approach (not shown; see additional figures in the interactive discussion). Background fits to lower-tropospheric temperature channels are slightly improved in either case, and the number of observations used remains within around ±0.5 % of the control, except for reductions of 2 %–3 % with all-sky assimilation that affect just a few channels. Since these changes are minor, and arise from detailed interactions between quality control, thinning, and screening that are hard to untangle, they have not been investigated further.
The background fits have also been computed in latitude bands. In the extratropics the picture is similar to what was seen in the global results, but in the tropics all-sky assimilation is significantly better than clear-sky assimilation. The temperature forecast is improved, as shown by a clear and significant improvement in AMSU-A channels 9–10 (Fig. 16) and ATMS channel 8 (not shown) compared to the clear-sky experiment. The differences between all-sky and clear-sky experiments in tropical own-analysis scores at T+12 in the tropics (i.e. between Figs. 12 and 13) may be linked and may also have come from this genuine advantage of the all-sky assimilation.
Based on the observational verification of the 12 h forecast, and the reduced root-mean-square (rms) increments revealed in the 12 h own-analysis forecast verification, it seems that the overall size of increments and constraint of the short-range forecast have in general become slightly weaker with all-sky particularly in the humidity field. However, the constraint on the large-scale mass field (T, pressure, wind) is similar to clear sky in midlatitudes and slightly stronger in the tropics.
4.2 In the absence of other observations
Because it has been difficult to identify statistically significant differences between the clear-sky and all-sky assimilation, an alternative approach has been used to evaluate them. In this section a framework is used in which all atmospheric observations apart from the seven IASI water vapour channels are discarded. In a cycling data assimilation system, this would result in forecasts that would rapidly deteriorate in quality and any comparisons would be of questionable value. Observations that can benefit a low-quality system may yet degrade a high-quality one. The solution (e.g. Geer et al., 2014) is to do data assimilation without cycling, taking the background from a high-quality parent experiment: this is a framework known as re-initialization. For the current work, the parent experiments are the all-sky and clear-sky experiments from the last section, which assimilate IASI water vapour assimilation along with the rest of the global observing system. It was important to use a consistent parent, for example, full clear-sky assimilation was the parent for re-initialized clear sky, so that appropriate VarBC bias corrections could be used in each case. For the verification reference, we used the full cycling experiment from which the seven all-sky WV channels have been excluded, No WV7. This is the fairest choice as using either of the parents assigns spuriously better scores to the assimilation approach used in the chosen parent: for example, verifying against the full clear-sky system suggests that clear-sky assimilation is significantly better than all-sky assimilation (not shown). To quantify the benefit of assimilating the seven WV channels, they are compared to a third re-initialized experiment in which no atmospheric observations are assimilated at all. This is a necessary normalization step as, even if all other atmospheric observations have been discarded, the forecasts can be improved by the surface analysis components (snow, waves, sea surface temperature), which have not been switched off in any of the re-initialization experiments. These experiments have only been run for 2 months (June–July 2017), but this is sufficient to get much clearer statistical significance than with the cycling data assimilation.
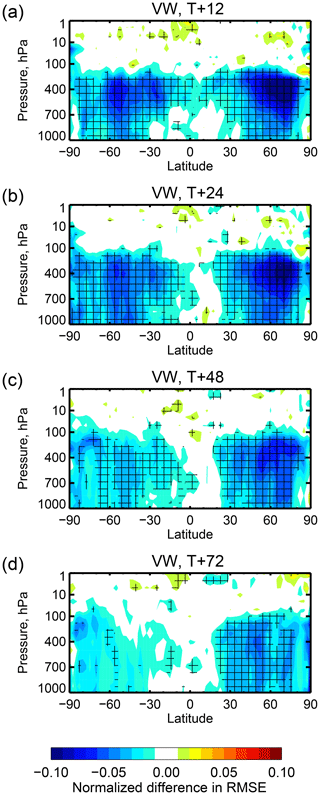
Figure 17Change in vector wind RMSE due to assimilation of the seven IASI WV channels using the clear-sky approach. Change in RMSE is relative to an experiment in which no observations are assimilated, normalized by the RMSE of the no-observation experiment. Cross-hatching indicates 95 % statistical significance assuming that there are 20 independent hypothesis tests being made in one latitude–pressure diagram.
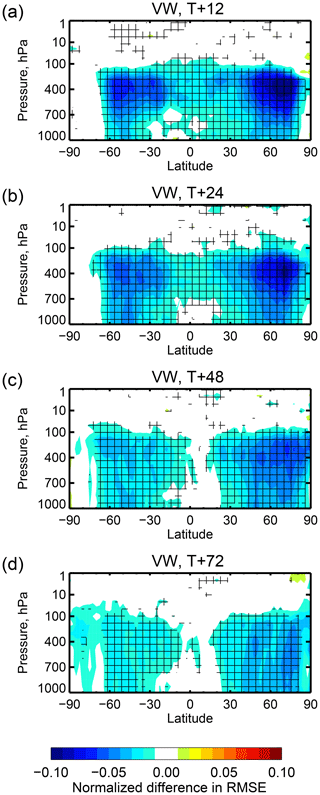
Figure 18Change in vector wind RMSE due to assimilation of the seven IASI WV channels using the all-sky approach. Other details are the same as in Fig. 17.
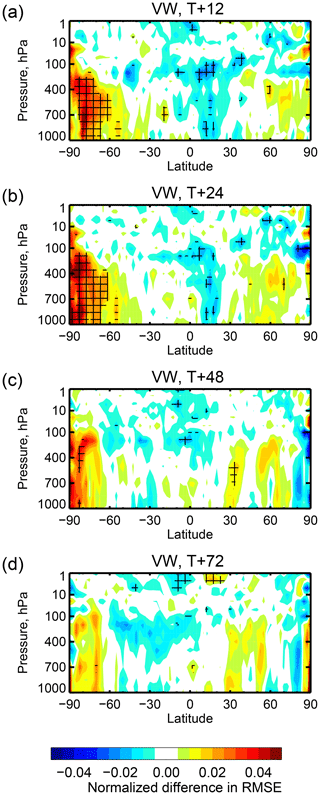
Figure 19 Difference in vector wind RMSE between using the all-sky and clear-sky approach to assimilate seven IASI WV channels. Other details are the same as in Fig. 17.
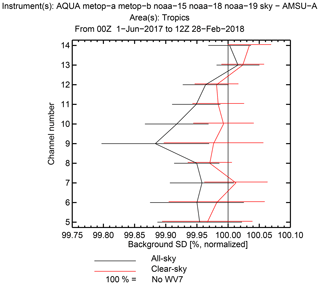
The impact of the seven water vapour channels on their own is shown in Figs. 17 and 18, with the difference between them in Fig. 19. In both frameworks the WV channels reduce predominantly mid- and upper-tropospheric wind errors, as would be expected from the 4D-Var tracer effect (Peubey and McNally, 2009; Geer et al., 2014), and there is also clear impact on low-level winds in midlatitudes. On a hemispheric basis, these improvements average out to around 5 % (not shown). All-sky is significantly better than clear-sky in the tropics and subtropics, confirming results from the previous section. Here, clear-sky assimilation has some impact in the upper troposphere, but the extent of impact from the all-sky assimilation is much broader in the vertical, reaching from near the surface up to 70 hPa. The benefit of all-sky assimilation for tropical winds is retained at least as far as forecast day 2 (T+48), whereas it is lost in clear-sky assimilation after day 1. In the midlatitudes, the clear-sky assimilation has a slight advantage in the NH and all-sky in the SH, but neither has a clear statistically significant advantage over the other. These results confirm the picture seen in the cycling data assimilation experiments: beyond the early forecast range, all-sky and clear-sky produce similar improvements in forecast scores in the midlatitudes.
One unexpected result is seen south of 60∘ where clear-sky assimilation has a beneficial impact that is not obtained from all-sky assimilation. This means the results of all-sky assimilation are significantly worse in these areas compared to clear-sky (Fig. 19). This appears to be coming from the additional data assimilated in the clear-sky framework over Antarctica (Fig. 4). This is not a true difference between clear-sky and all-sky assimilation as it results only from the different decisions made in the screening of surface-sensitive channels over land. Also, no such effect is seen in the full observing system experiments, where likely many other observation types contribute in this area.
4.3 Weight of observations
Figure 4 has shown that all-sky brings many more observations than clear-sky assimilation. Hence, the question arises why its impact on forecasts is in some aspects smaller than clear sky, particularly in the early forecast range in the midlatitudes. Section 2.3.2 has explained how in clear scenes, observation error standard deviations are a little larger than those used in the clear-sky observation error matrix. This is only a few percent in four upper peaking channels but by 20 %, 50 %, and 70 % for the increasingly deep sounding channels. However, the use of VarQC also reduces the weight given to observations in the all-sky framework. With the settings used here, the maximum possible VarQC weight is 0.8 and most observations will receive smaller weights than this.
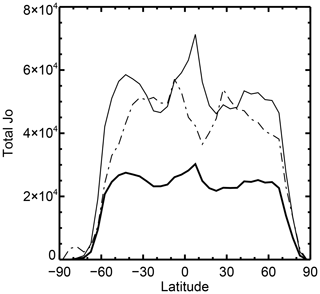
Figure 20Total of the IASI WV channel contribution to the background observational cost function for Metop-A from 1 to 20 June 2017, accumulated in 5∘ latitude bins: clear-sky (dotted and dashed line), all-sky before VarQC (thin solid line) and after applying VarQC (thick solid line; this is a hypothetical calculation since VarQC is not applied until later in the minimization).
Figure 20 assesses the weight given to observations in the analysis by looking at the estimated contribution of the seven IASI channels to the observational cost function at the start of the minimization, i.e. at background (see Geer, 2019, and references therein for details). This is not the complete picture, as the observations' impact also depends on the relative size of the background errors, but if background errors were constant and homogenous, variations in the observational cost function would indicate changes in the relative weight of the observations. Computing the cost function for clear-sky assimilation of the seven water vapour channels is difficult as the observation errors are correlated with most other IASI channels, so there is no easy way to separate their contributions. But accepting the cross-correlations are not too important, they can be set to zero when making an offline estimate of the WV channel contribution, as shown here. In the all-sky experiments where VarQC is applied we assess its effect by including it in offline calculations of the background cost function. This is not strictly correct since VarQC is only activated later in the minimization, but it is otherwise hard to find a common basis to compare the experiments. The figure also shows the all-sky cost function at background without the application of VarQC. The estimated cost function contributions are accumulated for plotting in latitude bins over the same 20 d period as examined earlier.
Figure 20 shows the clear-sky observational cost function contribution varies strongly as a function of latitude. Since the clear-sky observation error covariance matrix is constant, it is the data selection (both of location and channel usage) that controls this pattern. Hence, the clear-sky contribution follows the observational coverage shown in Fig. 4, with a dip in the tropics and increasingly less contribution towards the higher latitudes. We first examine the all-sky cost function contribution before VarQC, which allows the data selection and observation error choices to be directly compared to clear-sky assimilation. The global contribution of all-sky is comparable with the clear-sky but the geographical pattern is reversed, with relatively bigger contributions in the tropics and in the storm-track latitudes around 50∘ N and 50∘ S. All-sky puts greater weight on cloudy areas, and this is very obvious in latitude–longitude versions of these figures (not shown). Since all-sky brings around 65 % more observations globally, then the weight given to any one observation must have been reduced. This is of course expected from the construction of the all-sky error covariance matrix. From this point, applying VarQC (using the background departure) nearly halves the cost function for all-sky. However, since VarQC is adaptive and its effect changes as the analysis progresses, most observations will eventually end up with greater weight than we have estimated by applying VarQC to the background departures. Hence, the true contribution of all-sky assimilation to the cost function is difficult to assess but it must still be globally lower than from clear-sky assimilation.
If all-sky assimilation gives forecast impacts similar to clear-sky but with substantially less total weight in the cost function, this deserves examination. Bormann et al. (2016) showed that any change in the weight of the clear-sky IASI data, either up or down, would reduce the quality of the short-range forecast. In all-sky assimilation the impact of the clear-sky observations has likely been reduced and new data in cloudy conditions has likely made up the difference. Forecast errors are more sensitive to the initial conditions in cloudy areas (McNally, 2002) and background errors are typically larger (e.g. Bonavita et al., 2012) so the cloudy observations could have more impact on forecasts despite their smaller weight in the cost function. A similar effect is seen for all-sky microwave imager observations, where the adjoint-based forecast impact per observation is much larger in the cloudy sample than in the clear sample (Geer et al., 2017b). Confirmation of this effect for IASI would require either adjoint-based forecast sensitivity calculations or experiments that assimilate the clear and cloudy parts of the all-sky sample separately. However, this will have to be left for further work.
The aim of this work was to show that all-sky IR assimilation can be at least as beneficial as clear-sky assimilation of the same data in a high-quality operational forecasting system. Previous work has shown benefit from all-sky IR assimilation in short test cases and in research systems, but it has been difficult to get beneficial impacts in the ECMWF system where the clear-sky use of the data is already so well developed (such as with the use of inter-channel error correlations) and in which all-sky microwave observations with similar sensitivities to water vapour and cloud are already heavily exploited. Compared to earlier work (e.g. Okamoto et al., 2014) a number of developments have allowed all-sky assimilation to be successful. The quality of model-simulated all-sky brightness temperatures is much better now, with improved cloud ice optical properties (Vidot et al., 2015) and the ability, thanks to increased supercomputing resources, to use the full multiple independent column cloud overlap (Matricardi, 2005). It is now possible to simulate all-sky IR brightness temperatures with great realism, particularly for the water vapour sounding channels where systematic errors between model and observations are rarely more than a few kelvin and mostly close to zero. The fidelity of the forecast model is also very important, since with a different forecast model but the same radiative transfer Okamoto (2017) saw systematic errors of around 10 K in cloudy areas. Another main development, needed to keep up with advances in clear-sky IR assimilation, has been to develop an observation error covariance model with situation-dependence, in order to represent how inter-channel error correlations get stronger and error variances get larger, in cloudy areas (Geer, 2019).
Both clear-sky and all-sky assimilation of the IASI mid- and upper-tropospheric water vapour sounding channels are beneficial to mid- and upper-tropospheric winds, temperature and humidity, as well as to surface pressure and geopotential height. The impact on dynamical fields likely comes through the 4D-Var humidity and hydrometeor tracing mechanism that has been demonstrated with geostationary IR sounders and all-sky microwave humidity channels (Peubey and McNally, 2009; Geer et al., 2014). All-sky IR assimilation is no better than clear-sky assimilation in the midlatitudes, but there is a small improvement over clear-sky assimilation in the tropics. This is a starting point from which all-sky IR assimilation could be made operational and developed progressively in the same way that all-sky microwave observations have taken many years to become an important part of the observing system (Geer et al., 2017b).
To examine the detailed results in the tropics, the short-range forecast from all-sky assimilation is significantly closer to AMSU-A temperature sounding radiances than the clear-sky approach is, particularly at tropopause level. In the absence of other observations, re-initialization experiments show improved forecasts out to at least day 3 in the tropics through the full depth of troposphere and stratosphere, with the biggest impacts also found at tropopause level. The benefit of all-sky assimilation likely comes from the doubling of available IASI WV observations in these areas, particularly in the vicinity of the ITCZ. There are biases in the background departures in the tropics, locally reaching 2–4 K in the lowest-peaking channel (2889) but at most 1–2 K in the upper peaking channel (3002). These biases likely come from the forecast model producing excessive deep-convective cloud over ocean and insufficient deep-convective cloud over land. However, observation error variances and correlations are inflated as high as 10 to 20 K in these areas, so the biases are not too important. Arguably more important are the sampling biases revealed in clear-sky assimilation of channel 3002 in the tropics. Here there are positive biases reaching 1 K in many parts of the ITCZ for a channel that is assimilated with roughly 1.5 K observation error. These positive biases are consistent with an approach that rejects cloudy observations and naturally creates a sample of data that is not representative. One of the big advantages of all-sky assimilation (Bauer et al., 2010) is that it presents the data assimilation with an unbiased sample of data even at the cost of becoming more sensitive to systematic errors in modelled cloud amounts, or in the cloudy radiative transfer.
In the midlatitudes, the question is how all-sky IR assimilation can bring substantially more data, particularly in frontal areas, but produce results that are no better than clear-sky assimilation. However, the weight given to any single observation in the all-sky framework is smaller than in clear-sky. The all-sky observation error covariance model gives larger error standard deviations than used in the clear-sky assimilation, even for observations considered completely clear. This is in part because the trailing eigenvalues of the covariance matrix are inflated to avoid problems of bias amplification and excessive gravity wave generation in the stratosphere. The activation of VarQC further down-weights the data. With additional work it might be possible to boost the weight of the observations by adjusting the details of observation error and VarQC. However, the all-sky error model is already the result of much exploratory testing and tuning (Geer, 2019). It could be helpful to put more weight on clear-sky observations but this is not guaranteed to succeed. For example, although there is a 100 km thinning box, in practice the clear-sky assimilation has much longer thinning scales in areas where data are rejected due to clouds. Hence, the assimilation of more data through all-sky assimilation may challenge the assumption of spatially uncorrelated observation errors, and thus require decreased observational weights overall. Also, a downside of all-sky assimilation is that including cloud in the observation operator increases modelling uncertainty even for observations that would have been treated as clear in the clear-sky system (Geer et al., 2012). Nevertheless, the error model would be one of the main targets for future improvement.
Even if it is hard to get more direct benefit from all-sky IR assimilation in the midlatitudes, there are additional reasons to move towards all-sky IR assimilation. First, the cirrus information content is currently unique because all-sky microwave sees mainly the larger precipitation-sized ice particles. This sensitivity could be exploited for model verification. Second, all-sky assimilation removes the need for the cloud detection that is currently a time-consuming and difficult aspect of using IR observations. This might be a particular benefit for the assimilation of non-hyperspectral IR radiances such as those coming from geostationary sensors. Without the possibility of using the McNally and Watts (2003) approach, cloud detection is more difficult and may be less accurate for these sensors. Also, all-sky assimilation provides a more representative sample of observations to the assimilation system. Finally, lower-peaking IR channels (whether sensitive to temperature, humidity, or window channels) lose increasingly more data to cloud detection, which could give all-sky assimilation greater potential benefit to forecasts through increased observational coverage.
To proceed to operational implementation, all-sky IR assimilation now needs to be merged with some even more recent progress in the clear-sky framework. As shown by Migliorini (2015) there is more information that can be extracted from the humidity sounding channels of hyperspectral imagers. Adding more WV sounding channels in the clear-sky framework has subsequently shown substantial benefits (Kirsti Salonen, personal communication, 2019) Second, principal component, reconstructed radiance, or transformed retrieval assimilation can exploit the full spectrum (Matricardi and McNally, 2014; Prates et al., 2016) and is also close to being operationally viable with very substantial impact (Marco Matricardi, personal communication, 2019). Hence, it will be necessary to re-implement the all-sky framework in one of these two new approaches, with more work required if the reconstructed radiance framework is chosen. It will be necessary to implement and verify cloudy radiative transfer in the principle component RTTOV (PC-RTTOV). Further, given the strong correlations between all channels in the observation error covariance matrix for reconstructed radiances, it will be a challenge to develop a situation-dependent all-sky error covariance model. It may be difficult to limit all-sky assimilation to just the humidity sounding channels.
A second problem is the continuing high cost of the multiple independent columns radiative transfer in RTTOV. This work has confirmed the need for such an accurate representation of cloud overlap for IR radiative transfer by comparison to the large errors resulting from more approximate techniques. For example, using the CMSS effective cloud fraction gives systematic errors of at least 5 to 10 K in regions where multiple independent column radiative transfer is almost unbiased with respect to real observations. This costs around 34 times more than clear-sky radiative transfer in the ECMWF system, which is affordable for operational high-resolution assimilation where observations are a minor part of the total cost of data assimilation. However, it would increase the cost of assimilation done at lower model resolution, such as the operational EDA, as well as research work. Hence, there remains a need for a faster but equally accurate overlap scheme. In principle it may not be necessary to use independent column radiative transfer with the Chou-scaling approximation. The cloud overlap and level-to-space transmittance could be computed independently for each level, using an appropriate overlap formulation. Alternatively it may be possible to use fewer, but carefully chosen, independent columns, following O'Dell et al. (2007).
The RTTOV observation operator is copyrighted by EUMETSAT but is available free of charge to registered users via https://www.nwpsaf.eu/site/software/rttov/ (last access: 10 September 2019). The ECMWF data assimilation system is copyrighted by ECMWF and access to these systems (and the data provided by them) is possible through agreement with its member state national hydrometeorological organizations. The data are forecast fields and observation feedbacks from the experiments that may eventually be deleted due to their very large file sizes. Experiment IDs in the ECMWF MARS archiving system (for authorized users) are h0db and h18n for the all-sky experiment, h09a and h180 for the clear-sky and h0bn and h181 for No WV7. Re-initialized experiments are, respectively, h1qv, h21i, and h1qw for all sky, clear sky, and no observations.
AG contributed to the writing, methodology, investigation, software, and visualization. SM contributed to the methodology, software, investigation, and writing. MM contributed to the methodology and software
The authors declare that they have no conflict of interest.
Thanks are due to Reima Eresmaa, Niels Bormann, Tony McNally, and Stephen English for suggestions, discussions, and reviews.
This paper was edited by Andrew Sayer and reviewed by five anonymous referees.
Auligné, T., McNally, A. P., and Dee, D. P.: Adaptive bias correction for satellite data in a numerical weather prediction system, Q. J. Roy. Meteor. Soc., 133, 631–642, 2007. a
Aumann, H. H., Chen, X., Fishbein, E., Geer, A., Havemann, S., Huang, X., Liu, X., Liuzzi, G., DeSouza-Machado, S., Manning, E. M., Masiello, G., Matricardi, M., Moradi, I., Natraj, V., Serio, C., Strow, L., Vidot, J., Wilson, R. C., Wu, W., Yang, Q., and Yung, Y. L.: Evaluation of Radiative Transfer Models with Clouds, J. Geophys. Res.-Atmos., 123, 6142–6157, 2018. a, b
Baran, A., Bodas-Salcedo, A., Cotton, R., and Lee, C.: Simulating the equivalent radar reflectivity of cirrus at 94 GHz using an ensemble model of cirrus ice crystals: a test of the Met Office global numerical weather prediction model, Q. J. Roy. Meteor. Soc., 137, 1547–1560, 2011. a
Baran, A. J. and Labonnote, L.-C.: A self-consistent scattering model for cirrus. I: The solar region, Q. J. Roy. Meteor. Soc., 133, 1899–1912, 2007. a
Bauer, P., Geer, A. J., Lopez, P., and Salmond, D.: Direct 4D-Var assimilation of all-sky radiances: Part I. Implementation, Q. J. Roy. Meteor. Soc., 136, 1868–1885, 2010. a, b, c, d, e, f, g, h
Bauer, P., Auligné, T., Bell, W., Geer, A., Guidard, V., Heillette, S., Kazumori, M., Kim, M.-J., Liu, E. H.-C., McNally, A. P., Macpherson, B., Okamoto, K., Renshaw, R., and Riishøjgaard, L.-P.: Satellite cloud and precipitation assimilation at operational NWP centres, Q. J. Roy. Meteor. Soc., 137, 1934–1951, 2011. a
Bengtsson, L. and Hodges, K.: On the impact of humidity observations in numerical weather prediction, Tellus, 57A, 701–708, 2005. a
Bonavita, M., Isaksen, L., and Hólm, E.: On the use of EDA background error variances in the ECMWF 4D-Var, Q. J. Roy. Meteor. Soc., 138, 1540–1559, https://doi.org/10.1002/qj.1899, 2012. a
Bonavita, M., Lean, P., and Holm, E.: Nonlinear effects in 4D-Var, Nonlin. Processes Geophys., 25, 713–729, https://doi.org/10.5194/npg-25-713-2018, 2018. a
Bormann, N., Geer, A., and Bauer, P.: Estimates of observation error characteristics in clear and cloudy regions for microwave imager radiances from NWP, Q. J. Roy. Meteor. Soc., 137, 2014–2023, 2011. a
Bormann, N., Bonavita, M., Dragani, R., Eresmaa, R., Matricardi, M., and McNally, A.: Enhancing the impact of IASI observations through an updated observation-error covariance matrix, Q. J. Roy. Meteor. Soc., 142, 1767–1780, 2016. a, b, c, d
Chambon, P. and Geer, A. J.: All-sky assimilation of Megha-Tropiques/SAPHIR radiances in the ECMWF numerical weather prediction system, Tech. Memo. 802, ECMWF, Reading, UK, 2017. a
Chevallier, F. and Kelly, G.: Model Clouds as Seen from Space: Comparison with Geostationary Imagery in the 11-µm Window Channel, Mon. Weather Rev., 130, 712–722, 2002. a, b
Chevallier, F., Bauer, P., Kelly, G., Jakob, C., and McNally, T.: Model clouds over oceans as seen from space: Comparison with HIRS/2 and MSU radiances, J. Climate, 14, 4216–4229, 2001. a, b
Chevallier, F., Bauer, P., Mahfouf, J.-F., and Morcrette, J.-J.: Variational retrieval of cloud profile from ATOVS observations, Q. J. Roy. Meteor. Soc., 128, 2511–2525, 2002. a
Chevallier, F., Lopez, P., Tompkins, M. A., Janisková, M., and Moreau, E.: The capability of 4D-Var systems to assimilate cloud-affected satellite infrared radiances, Q. J. Roy. Meteor. Soc., 130, 917–932, 2004. a, b
Chou, M.-D., Lee, K.-T., Tsay, S.-C., and Fu, Q.: Parameterization for Cloud Longwave scattering for use in Atmospheric Models, J. Climate, 12, 159–169, 1999. a, b
Cintineo, R. M., Otkin, J. A., Jones, T. A., Koch, S., and Stensrud, D. J.: Assimilation of Synthetic GOES-R ABI Infrared Brightness Temperatures and WSR-88D Radar Observations in a High-Resolution OSSE, Mon. Weather Rev., 144, 3159–3180, 2016. a
Collard, A. and McNally, A.: The assimilation of infrared atmospheric sounding interferometer radiances at ECMWF, Q. J. Roy. Meteor. Soc., 135, 1044–1058, 2009. a, b
Cotton, R., Field, P., Ulanowski, Z., Kaye, P. H., Hirst, E., Greenaway, R., Crawford, I., Crosier, J., and Dorsey, J.: The effective density of small ice particles obtained from in situ aircraft observations of mid-latitude cirrus, Q. J. Roy. Meteor. Soc., 139, 1923–1934, 2013. a
Courtier, P., Thépaut, J.-N., and Hollingsworth, A.: A strategy for operational implementation of 4D-Var, using an incremental approach, Q. J. Roy. Meteor. Soc., 120, 1367–1387, 1994. a
Dragani, R. and McNally, A. P.: Operational assimilation of ozone-sensitive infrared radiances at ECMWF, Q. J. Roy. Meteor. Soc., 139, 2068–2080, 2013. a
Eresmaa, R.: Imager-assisted cloud detection for assimilation of Infrared Atmospheric Sounding Interferometer radiances, Q. J. Roy. Meteor. Soc., 140, 2342–2352, 2014. a, b
Errico, R. M., Bauer, P., and Mahfouf, J.-F.: Issues regarding the assimilation of cloud and precipitation data, J. Atmos. Sci., 64, 3785–3798, 2007. a
Faijan, F., Lavanant, L., and Rabier, F.: Towards the use of cloud microphysical properties to simulate IASI spectra in an operational context, J. Geophys. Res.-Atmos., 117, D22205, https://doi.org/10.1029/2012JD017962, 2012. a
Field, P. R., Heymsfield, A. J., and Bansemer, A.: Snow Size Distribution Parameterization for Midlatitude and Tropical Ice Clouds, J. Atmos. Sci., 64, 4346–4365, 2007. a
Geer, A. J., Ahlgrimm, M., Bechtold, P., Bonavita, M., Bormann, N., English, S., Fielding, M., Forbes, R., Robin Hogan, E. H., Janisková, M., Lonitz, K., Lopez, P., Matricardi, M., Sandu, I., and Weston, P.: Assimilating observations sensitive to cloud and precipitation, Tech. Memo. 815, ECMWF, Reading, UK, 2017a. a, b, c
Geer, A. J., Baordo, F., Bormann, N., English, S., Kazumori, M., Lawrence, H., Lean, P., Lonitz, K., and Lupu, C.: The growing impact of satellite observations sensitive to humidity, cloud and precipitation, Q. J. Roy. Meteor. Soc., 143, 3189–3206, https://doi.org/10.1002/qj.3172, 2017b. a, b, c, d, e, f, g, h
Geer, A. J.: Significance of changes in forecast scores, Tellus A, 68, 30229, https://doi.org/10.3402/tellusa.v68.30229, 2016. a, b
Geer, A. J.: Correlated observation error models for assimilating all-sky infrared radiances, Atmos. Meas. Tech., 12, 3629–3657, https://doi.org/10.5194/amt-12-3629-2019, 2019. a, b, c, d, e, f, g, h, i, j
Geer, A. J. and Baordo, F.: Improved scattering radiative transfer for frozen hydrometeors at microwave frequencies, Atmos. Meas. Tech., 7, 1839–1860, https://doi.org/10.5194/amt-7-1839-2014, 2014. a, b
Geer, A. J. and Bauer, P.: Observation errors in all-sky data assimilation, Q. J. Roy. Meteor. Soc., 137, 2024–2037, 2011. a, b, c
Geer, A. J., Bauer, P., and O'Dell, C. W.: A revised cloud overlap scheme for fast microwave radiative transfer, J. Appl. Meteorol. Clim., 48, 2257–2270, 2009. a
Geer, A. J., Bauer, P., and English, S. J.: Assimilating AMSU-A temperature sounding channels in the presence of cloud and precipitation, Tech. Memo. 670, ECMWF, Reading, UK, 2012. a, b
Geer, A. J., Baordo, F., Bormann, N., and English, S.: All-sky assimilation of microwave humidity sounders, Tech. Memo. 741, ECMWF, Reading, UK, 2014. a, b, c, d, e
Geer, A. J., Lonitz, K., Weston, P., Kazumori, M., Okamoto, K., Zhu, Y., Liu, E. H., Collard, A., Bell, W., Migliorini, S., Chambon, P., Fourrié, N., Kim, M.-J., Köpken-Watts, C., and Schraff, C.: All-sky satellite data assimilation at operational weather forecasting centres, Q. J. Roy. Meteor. Soc., 144, 1191–1217, https://doi.org/10.1002/qj.3202, 2018. a, b, c, d
Greenwald, T. J., Pierce, R. B., Schaack, T., Otkin, J., Rogal, M., Bah, K., Lenzen, A., Nelson, J., Li, J., and Huang, H.-L.: Real-time simulation of the GOES-R ABI for user readiness and product evaluation, B. Am. Meteorol. Soc., 97, 245–261, 2016. a
Han, W. and McNally, A.: The 4D-Var assimilation of ozone-sensitive infrared radiances measured by IASI, Q. J. Roy. Meteor. Soc., 136, 2025–2037, 2010. a
Harnisch, F., Weissmann, M., and Periáñez, Á.: Error model for the assimilation of cloud-affected infrared satellite observations in an ensemble data assimilation system, Q. J. Roy. Meteor. Soc., 142, 1797–1808, 2016. a, b
Honda, T., Miyoshi, T., Lien, G.-Y., Nishizawa, S., Yoshida, R., Adachi, S. A., Terasaki, K., Okamoto, K., Tomita, H., and Bessho, K.: Assimilating all-sky Himawari-8 satellite infrared radiances: A case of Typhoon Soudelor (2015), Mon. Weather Rev., 146, 213–229, 2018. a
Jones, T. A., Otkin, J. A., Stensrud, D. J., and Knopfmeier, K.: Assimilation of satellite infrared radiances and Doppler radar observations during a cool season observing system simulation experiment, Mon. Weather Rev., 141, 3273–3299, 2013. a
Kazumori, M., Geer, A. J., and English, S. J.: Effects of all-sky assimilation of GCOM-W/AMSR2 radiances in the ECMWF numerical weather prediction system, Q. J. Roy. Meteor. Soc., 142, 721–737, https://doi.org/10.1002/qj.2669, 2016. a, b
Kurzrock, F., Cros, S., Ming, F. C., Otkin, J. A., Hutt, A., Linguet, L., Lajoie, G., and Potthast, R.: A Review of the Use of Geostationary Satellite Observations in Regional-Scale Models for Short-term Cloud Forecasting, Meteorol. Z., 27, 277–298, https://doi.org/10.1127/metz/2018/0904, 2018. a
Lavanant, L., Fourrié, N., Gambacorta, A., Grieco, G., Heilliette, S., Hilton, F., Kim, M.-J., McNally, A., Nishihata, H., Pavelin, E., Rabier, F.: Comparison of cloud products within IASI footprints for the assimilation of cloudy radiances, Q. J. Roy. Meteor. Soc., 137, 1988–2003, 2011. a
Lien, G.-Y., Miyoshi, T., and Kalnay, E.: Assimilation of TRMM Multisatellite Precipitation Analysis with a Low-Resolution NCEP Global Forecast System, Mon. Weather Rev., 144, 643–661, 2016. a
Lonitz, K. and Geer, A.: New screening of cold-air outbreak regions used in 4D-Var all-sky assimilation, EUMETSAT/ECMWF Fellowship Programme Research Report 35, ECMWF, Reading, UK, 2015. a
Lonitz, K. and Geer, A.: Effect of assimilating microwave imager observations in the presence of a model bias in marine stratocumulus, EUMETSAT/ECMWF Fellowship Programme Research Report 44, ECMWF, Reading, UK, 2017. a
Lopez, P.: Direct 4D-Var assimilation of NCEP stage IV radar and gauge precipitation data at ECMWF, Mon. Weather Rev., 139, 2098–2116, 2011. a
Lopez, P. and Moreau, E.: A convection scheme for data assimilation: Description and initial tests, Q. J. Roy. Meteor. Soc., 131, 409–436, 2005. a
Martinet, P., Fourrié, N., Guidard, V., Rabier, F., Montmerle, T., and Brunel, P.: Towards the use of microphysical variables for the assimilation of cloud-affected infrared radiances, Q. J. Roy. Meteor. Soc., 139, 1402–1416, 2013. a, b, c
Martinet, P., Fourrié, N., Bouteloup, Y., Bazile, E., and Rabier, F.: Toward the improvement of short-range forecasts by the analysis of cloud variables from IASI radiances, Atmos. Sci. Let., 15, 342–347, 2014a. a
Martinet, P., Lavanant, L., Fourrié, N., Rabier, F., and Gambacorta, A.: Evaluation of a revised IASI channel selection for cloudy retrievals with a focus on the Mediterranean basin, Q. J. Roy. Meteor. Soc., 140, 1563–1577, 2014b. a
Matricardi, M.: The inclusion of aerosols and clouds in RTIASI, the ECMWF fast radiative transfer model for the infrared atmospheric sounding interferometer, Tech. Memo. 474, ECMWF, Reading, UK, 2005. a, b, c, d, e, f, g, h, i
Matricardi, M. and McNally, A.: The direct assimilation of principal components of IASI spectra in the ECMWF 4D-Var, Q. J. Roy. Meteor. Soc., 140, 573–582, 2014. a
Matsui, T., Santanello, J., Shi, J., Tao, W.-K., Wu, D., Peters-Lidard, C., Kemp, E., Chin, M., Starr, D., Sekiguchi, M., and Aires, F.: Introducing multisensor satellite radiance-based evaluation for regional Earth System modeling, J. Geophys. Res.-Atmos., 119, 8450–8475, 2014. a
McMillin, L. M. and Dean, C.: Evaluation of a new operational technique for producing clear radiances, J. Appl. Meteorol., 21, 1005–1014, 1982. a
McNally, A.: A note on the occurrence of cloud in meteorologically sensitive areas and the implications for advanced infrared sounders, Q. J. Roy. Meteor. Soc., 128, 2551–2556, 2002. a, b, c
McNally, A.: The direct assimilation of cloud-affected satellite infrared radiances in the ECMWF 4D-Var, Q. J. Roy. Meteor. Soc., 135, 1214–1229, 2009. a, b
McNally, A. and Watts, P.: A cloud detection algorithm for high-spectral-resolution infrared sounders, Q. J. Roy. Meteor. Soc., 129, 3411–3423, 2003. a, b, c
Migliorini, S.: Optimal ensemble-based selection of channels from advanced sounders in the presence of cloud, Mon. Weather Rev., 143, 3754–3773, 2015. a, b
Migliorini, S. and Candy, B.: All-sky satellite data assimilation of microwave temperature sounding channels at the Met Office, Q. J. Roy. Meteor. Soc., 145, 867–883, 2019. a
Migliorini, S., Geer, A., Matricardi, M., and English, S.: All-sky assimilation of selected water vapour infrared IASI channels at ECMWF: strategy and initial trials, 19th International TOVS Study Conference, available at: https://cimss.ssec.wisc.edu/itwg/itsc/itsc19/program/posters/9p_07_migliorini.pdf (last access: 7 September 2019), 2014. a
Migliorini, S., Lorenc, A. C., and Bell, W.: A moisture-incrementing operator for the assimilation of humidity-and cloud-sensitive observations: formulation and preliminary results, Q. J. Roy. Meteor. Soc., 144, 443–457, 2018. a
Minamide, M. and Zhang, F.: Adaptive Observation Error Inflation for Assimilating All-sky Satellite Radiance, Mon. Weather Rev., 145, 1063–1081, https://doi.org/10.1175/MWR-D-16-0257.1, 2017. a
O'Dell, C. W., Bauer, P., and Bennartz, R.: A fast cloud overlap parametrization for microwave radiance assimilation, J. Atmos. Sci., 64, 3896–3909, 2007. a, b
Okamoto, K.: Assimilation of overcast cloudy infrared radiances of the geostationary MTSAT-1R imager, Q. J. Roy. Meteor. Soc., 139, 715–730, 2013. a
Okamoto, K.: Evaluation of IR radiance simulation for all-sky assimilation of Himawari-8/AHI in a mesoscale NWP system, Q. J. Roy. Meteor. Soc., 143, 1517–1527, https://doi.org/10.1002/qj.3022, 2017. a, b, c
Okamoto, K., McNally, A. P., and Bell, W.: Progress towards the assimilation of all-sky infrared radiances: an evaluation of cloud effects, Q. J. Roy. Meteor. Soc., 140, 1603–1614, 2014. a, b, c, d, e, f, g, h, i, j, k
Okamoto, K., Sawada, Y., and Kunii, M.: Comparison of assimilating all-sky and clear-sky infrared radiances from Himawari-8 in a mesoscale system, Q. J. Roy. Meteor. Soc., 145, 745–766, https://doi.org/10.1002/qj.3463, 2019. a, b
Otkin, J. A.: Assimilation of water vapor sensitive infrared brightness temperature observations during a high impact weather event, J. Geophys. Res.-Atmos., 117, D19203, https://doi.org/10.1029/2012JD017568, 2012. a
Otkin, J. A., Greenwald, T. J., Sieglaff, J., and Huang, H.-L.: Validation of a large-scale simulated brightness temperature dataset using SEVIRI satellite observations, J. Appl. Meteorol. Clim., 48, 1613–1626, 2009. a
Otkin, J. A., Lewis, W. E., Lenzen, A. J., McNoldy, B. D., and Majumdar, S. J.: Assessing the accuracy of the cloud and water vapor fields in the Hurricane WRF (HWRF) Model using satellite infrared brightness temperatures, Mon. Weather Rev., 145, 2027–2046, 2017. a
Otkin, J. A., Potthast, R., and Lawless, A. S.: Nonlinear Bias Correction for Satellite Data Assimilation Using Taylor Series Polynomials, Mon. Weather Rev., 146, 263–285, 2018. a
Pangaud, T., Fourrié, N., Guidard, V., Dahoui, M., and Fabier, F.: Assimilation of AIRS radiances affected by mid to low level clouds, Mon. Weather Rev., 137, 4276–4292, https://doi.org/10.1175/2009MWR3020.1, 2009. a, b
Pavelin, E. G., English, S. J., and Eyre, J. R.: The assimilation of cloud-affected infrared satellite radiances for numerical weather prediction, Q. J. Roy. Meteor. Soc., 13, 737–749, 2008. a, b
Peubey, C. and McNally, A. P.: Characterization of the impact of geostationary clear-sky radiances on wind analyses in a 4D-Var context, Q. J. Roy. Meteor. Soc., 135, 1863 – 1876, 2009. a, b
Polkinghorne, R. and Vukicevic, T.: Data assimilation of cloud-affected radiances in a cloud-resolving model, Mon. Weather Rev., 139, 755–773, 2011. a
Prates, C., Migliorini, S., English, S., and Pavelin, E.: Assimilation of satellite infrared sounding measurements in the presence of heterogeneous cloud fields, Q. J. Roy. Meteor. Soc., 140, 2062–2077, 2014. a
Prates, C., Migliorini, S., Stewart, L., and Eyre, J.: Assimilation of transformed retrievals obtained from clear-sky IASI measurements, Q. J. Roy. Meteor. Soc., 142, 1697–1712, 2016. a
Saunders, R., Hocking, J., Turner, E., Rayer, P., Rundle, D., Brunel, P., Vidot, J., Roquet, P., Matricardi, M., Geer, A., Bormann, N., and Lupu, C.: An update on the RTTOV fast radiative transfer model (currently at version 12), Geosci. Model Dev., 11, 2717–2737, https://doi.org/10.5194/gmd-11-2717-2018, 2018. a, b
Seaman, C. J., Sengupta, M., and Haar, T. H. V.: Mesoscale satellite data assimilation: Impact of cloud-affected infrared observations on a cloud-free initial model state, Tellus A, 62, 298–318, 2010. a
Stengel, M., Lindskog, M., Undén, P., and Gustafsson, N.: The impact of cloud-affected IR radiances on forecast accuracy of a limited-area NWP model, Q. J. Roy. Meteor. Soc., 139, 2081–2096, 2013. a
Tompkins, A. M. and Janisková, M.: A cloud scheme for data assimilation: Description and initial tests, Q. J. Roy. Meteor. Soc., 130, 2495–2517, 2004. a
Trigo, I. F. and Viterbo, P.: Clear-sky window channel radiances: A comparison between observations and the ECMWF model, J. Appl. Meteorol., 42, 1463–1479, 2003. a
Vidot, J., Baran, A. J., and Brunel, P.: A new ice cloud parameterization for infrared radiative transfer simulation of cloudy radiances: Evaluation and optimization with IIR observations and ice cloud profile retrieval products, J. Geophys. Res.-Atmos., 120, 6937–6951, 2015. a, b, c, d, e
Vukicevic, T., Greenwald, T., Zupanski, M., Zupanski, D., Vonder Haar, T., and Jones, A.: Mesoscale cloud state estimation from visible and infrared satellite radiances, Mon. Weather Rev., 132, 3066–3077, 2004. a
Vukicevic, T., Sengupta, M., Jones, A., and Haar, T. V.: Cloud-resolving satellite data assimilation: Information content of IR window observations and uncertainties in estimation, J. Atmos. Sci., 63, 901–919, 2006. a
Yi, B., Yang, P., Liu, Q., Delst, P., Boukabara, S.-A., and Weng, F.: Improvements on the ice cloud modeling capabilities of the Community Radiative Transfer Model, J. Geophys. Res.-Atmos., 121, 13577–13590, https://doi.org/10.1002/2016JD025207, 2016. a
Zhang, F., Minamide, M., and Clothiaux, E. E.: Potential impacts of assimilating all-sky infrared satellite radiances from GOES-R on convection-permitting analysis and prediction of tropical cyclones, Geophys. Res. Lett., 43, 2954–2963, 2016. a
Zhu, Y., Liu, E. H., Mahajan, R., Thomas, C., Groff, D., van Delst, P., Collard, A., Kleist, D., Treadon, R., and Derber, J.: All-Sky Microwave Radiance Assimilation in the NCEP's GSI Analysis System, Mon. Weather Rev., 144, 4709–4735, https://doi.org/10.1175/MWR-D-15-0445.1, 2016. a, b
all-skyassimilation started with data from the microwave part of the spectrum, with substantial benefit to the quality of operational forecasts. The current work shows a framework in which cloudy infrared data, with its stronger and more non-linear sensitivity, can also benefit operational-quality forecasts.


