the Creative Commons Attribution 4.0 License.
the Creative Commons Attribution 4.0 License.
 | 18 May 2020
Characterization of anthropogenic organic aerosols by TOF-ACSM with the new capture vaporizer
Yan Zheng
Xi Cheng
Keren Liao
Yaowei Li
Yong Jie Li
Ru-Jin Huang
Weiwei Hu
Shiyi Chen
Limin Zeng
Douglas R. Worsnop
A new capture vaporizer (CV) has been developed and used recently in the Aerodyne aerosol mass spectrometer (AMS) and aerosol chemical speciation monitor (ACSM) instead of the standard vaporizer (SV) to reduce the particle bounce. It is important to characterize the CV performance in different environments. In this study, we characterized specific organic aerosols (OAs) from vehicle, cooking, biomass burning, and coal burning emissions by a time-of-flight ACSM (TOF-ACSM) with the CV. Their corresponding marker ions that have been defined in the previous SV-based analysis are still valid in the CV mass spectra. Spectra of OAs from cooking and vehicle exhaust show similarities in distinct alkyl fragments but different ratios of m∕z 55 and 57. Ions related to polycyclic aromatic hydrocarbons are present in the OA spectra obtained from burning lignite and bituminous coal but not in the spectra obtained from burning anthracite. Although the relative intensities of m∕z 60 and 73 are much lower in the CV spectra than in the SV spectra for biomass burning OA, they are still relatively greater compared with the spectra for other sources. Our data suggest an atmospheric background of f60 of below 0.03 % for CV. Moreover, we deployed the CV TOF-ACSM along with a SV AMS in urban Beijing during the winter of 2017 to characterize ambient OA with strong anthropogenic influences. The CV TOF-ACSM shows a collection efficiency (CE) of about unity. The CV and SV data show consistent mass concentrations of sulfate, nitrate, ammonium, and OA. Six OA factors are identified by the positive matrix factorization (PMF) analysis for both the CV and the SV data. The SV and CV PMF factors show good correlations in mass concentrations. The SV and CV factors related to coal combustion and cooking differ significantly in loadings, explained by the PMF uncertainty and the lack of understanding of the relative ionization efficiency and CE for primary OA. The CV factors related to secondary sources show greater loadings than the SV factors, which may be associated with the changes in signal-to-noise ratios of various ions in the PMF analysis. Our results support improved mass quantification and useful source identification by the CV for ambient particles in the polluted urban environment. The difference in factor loadings between SV and CV should be considered when interpreting or comparing the PMF results among studies.
- Article
(3716 KB) - Full-text XML
-
Supplement
(2367 KB) - BibTeX
- EndNote


The aerodyne aerosol mass spectrometer (AMS) and aerosol chemical speciation monitor (ACSM) have been widely used for online quantification of nonrefractory (NR) aerosol components in the troposphere (Jimenez et al., 2009). These components, e.g., sulfate, nitrate, ammonium, chloride, and organic aerosol (OA), are flash vaporized under 600 ∘C, ionized by electron impact, and then quantified by mass spectrometers having various mass resolution (Jimenez et al., 2003; Decarlo et al., 2006; Ng et al., 2011; Fröhlich et al., 2013). The 2-dimensional mass spectra can be further used in factor analysis to identify OA sources (Zhang et al., 2005; Lanz et al., 2007; Ulbrich et al., 2009). The commonly identified factors include hydrocarbon-like OA (HOA), cooking OA (COA), biomass burning OA (BBOA), coal combustion OA (CCOA), isoprene epoxydiols-derived secondary organic aerosol (IEPOX-SOA), nitrogen-enriched OA (NOA), and various types of oxidized OA (OOA) (Jimenez et al., 2009; Zhang et al., 2011; Sun et al., 2013; Chen et al., 2015; Hu et al., 2015; Elser et al., 2016).
The majority of AMSs and ACSMs use the standard vaporizer (SV) that has an inverted cone shape covered by porous tungsten. Particles may bounce on the SV, and hence the AMS and ACSM data are often corrected by collection efficiency (CE). The CE depends on the particle composition and the sampling-line relative humidity (RH) and affects the accuracy of the mass quantification of AMS and ACSM (Crosier et al., 2007; Matthew et al., 2008). A composition-based calculation has been widely used to derive CE for the SV instruments (Middlebrook et al., 2012). In recent years, the capture vaporizer (CV) with inner cavity has been developed to reduce the particle bounce (Xu et al., 2017). The CE values of ammonium nitrate, NH4NO3, ammonium sulfate, (NH4)2SO4, sodium nitrate, NaNO3, and ammonium chloride, NH4Cl for the CV are much greater than those for the SV. For example, the CE for (NH4)2SO4 is 0.8–0.9 for the CV compared with ∼0.4 for the SV (Hu et al., 2017a; Xu et al., 2017). Hu et al. (2017b) showed that ambient particles in forest and suburban regions have a CE of about unity for the CV AMS and quadrupole ACSM, which is twice that of the typical CE of 0.5 for the SV instruments (Hu et al., 2017b).
Although the CV improves the mass quantification, the cavity of CV increases the residence time of particles in the vaporizer and leads to prolonged thermal decomposition. The fragmentation of aerosol species in the CV becomes different from that in the SV. For instance, the ratio of NH4NO3 particles is 1 order of magnitude lower for CV (i.e., 0.04–0.07) than that for SV (i.e., 0.3–0.7) (Fry et al., 2009; Bruns et al., 2010; Farmer et al., 2010; Xu et al., 2017; Hu et al., 2017a). Similarly, the ratios of , , and to SO+ of (NH4)2SO4 particles are much lower for CV (i.e., < 0.05) than those for SV (i.e., 0.11–0.38) (Hu et al., 2017a). For OA, the CV-based mass spectra show enhanced fragmentation to small ions. Such enhancement is less pronounced for hydrocarbon-like fragments () than for oxygen-containing fragments () and seems stronger for laboratory-generated biogenic SOA than for ambient OA (Hu et al., 2018a). Good correlations of the relative intensities of important tracer fragments (e.g., f43, f44, f82, and f91) between the SV and the CV spectra are observed, while poor correlations are shown for fragments having low signal-to-noise ratios in the CV (e.g., f60). Besides, prominently elevated CO+ signals were observed for squalene OA in the CV spectra but not in the SV spectra, possibly caused by unknown interactions between the species and the surface with molybdenum oxides (Hu et al., 2018a).
Because of the differences in the fragmentation patterns, it is important to know how well the CV instruments characterize various types of OA in different ambient environments. Hu et al. (2018b) has tested the CV performance in the biogenic dominant and downwind regions. The results suggest reliable mass quantification and sufficient OA source apportionments for HOA, IEPOX-SOA, and OOAs. There is still lack of measurements by the CV instruments in polluted urban areas where anthropogenic OA sources such as CCOA, BBOA, COA, and NOA may contribute substantially. In this study, we investigated the CV mass spectra for specific types of anthropogenic OA produced by vehicle emissions, cooking emissions, biomass burning, coal burning, and aromatic photooxidation. We deployed both of the CV TOF-ACSM and SV AMS along with other instruments to measure ambient particles in urban Beijing during the winter of 2017. Detailed comparisons for the mass quantification and the source apportionments were made between the CV and the SV data sets.
2.1 Measurements of specific types of OA
The CV-based mass spectra of typical primary OA were obtained by using the TOF-ACSM to sample the air from the exhaust or the atomized air from water solutions of particle filter samples. For the former, the TOF-ACSM was installed in a mobile lab powered by a lithium iron phosphate battery to sample (a) the vehicle exhaust in the De Sheng Kou tunnel located on the G7 highway (40.289∘ N, 116.185∘ E) in Beijing, (b) the cooking exhaust near a kitchen ventilator of a large campus cafeteria, and (c) the flaming-phase exhaust from a common residential stove when burning three types of coals (i.e., anthracite, lignite, and bituminous coal). These measurements were performed during clean days (i.e., PM2.5 < 35 µg m−3) to minimize the influence of the background air on the particle composition of the exhaust. The on-road fleet measurements for vehicle exhaust were conducted from 23:00 to 00:00 UTC+8 when over 90 % of the traffic fleet consisted of heavy-duty vehicles that were mainly diesel-fueled in the tunnel. As shown in Fig. S1 in the Supplement, the OA mass spectra of the three types of exhaust significantly differ from the mass spectra of background air. We did not subtract the spectra of background air from the exhaust spectra because of the lack of information about dilution ratios. Marker ions that are widely used to indicate different types of OA in the analysis of SV spectra have much greater signals in the exhaust spectra than in the spectra of background air. For example, a high abundance of serial alkyl fragments (e.g., m∕z 57) for vehicles, a high f55∕f57 ratio for cooking, and high peaks at m∕z 115, 128, 152, 165, 178, and 189 (i.e., fragmented polycyclic aromatic hydrocarbon, PAH, ions) for coal combustion are strongly present, which is in line with previous studies (Canagaratna et al., 2004; Schneider et al., 2006; Mohr et al., 2009; He et al., 2010; Bruns et al., 2015).
For offline measurements, quartz filter samples were collected while burning wheat, rice, and corn straws as well as bituminous coal and anthracite in a combustion chamber during flaming state (Tian et al., 2015, 2018). A portion of these samples (i.e., about 0.526 cm2 in each filter) were sonicated in 10 mL ultrapure water (Milli-Q, 18.2 MΩ cm) for 20 min at 30 ∘C, filtered through 0.45 µm nylon membrane, nebulized by an atomizer (TSI, 3076), and dried through a Nafion dryer (Perma Pure, MD-700) before being sampled by the TOF-ACSM. The resulting mass spectra represent the water-soluble portion of BBOA (i.e., > 65 % of the mass) and CCOA (i.e., < 20 % the mass). Moreover, anthropogenic SOAs were produced in an Aerodyne potential aerosol mass (PAM) oxidation flow reactor by the photooxidation of toluene and benzene and were sampled by the CV TOF-ACSM. The initial precursor concentrations were about 40 ppbv for toluene and 100 ppbv for benzene. The SOA mass loadings were about 1.9 to 3.3 µg m−3. The OH exposure was about 2.69×10¹⁰ and 1.20×10¹⁰ molecules cm−3 s, and the NO:HO2 ratio was about 1.4 and 1.9 for toluene and benzene, respectively, which are estimated by the calculations of PAMchem model on the basis of the calibration on SO2 (Lambe et al., 2017). Details are provided in Sect. A of the Supplement.
2.2 Ambient measurements and data processing
Ambient measurements were carried out at Peking University Urban-Atmosphere Environment Monitoring Station (PKUERS) from 14 December 2017 to 21 January 2018. This station consists of three air-conditioned roof sites (one eight-floor site and two six-floor sites) in a campus building located between the fourth and the fifth north ring roads in Beijing, representing a typical urban environment influenced by anthropogenic emissions (Hu et al., 2016). Particles were detected by the CV TOF-ACSM, the SV AMS, and the scanning mobility particle sizer (SMPS; TSI, 3080), which were placed in the eight-floor site (39.99∘ N, 116.32∘ E, 80 m above sea level and 30 m above the ground). At the same site, the concentrations of volatile organic compounds were measured by an IONICON proton transfer reaction quadrupole interface time-of-flight mass spectrometer (PTR-QiTOF). Detailed descriptions of the PTR-QiTOF measurements are provided elsewhere (Huang et al., 2019). The meteorological parameters including temperature, RH, barometric pressure, wind speed, and wind direction were acquired by a weather station at the same site (Met One Instruments Inc., 083E, 092, 010C, and 020C). Gas pollutants were measured at one of the six-floor sites by the Thermo Scientific analyzers including CO (48i-TL), NO-NO2-NOx (42i-TL), SO2 (43i-TL), and O3 (49i-TL). All data refer to the local time (UTC+8).
The SV AMS is a long time-of-flight AMS (LTOF-AMS) equipped with regular aerodynamic lens for submicron particles (PM1). We installed a cyclone (URG, 2000-30ED) in front of the SV AMS that had a sampling flow rate of 3 L min−1 to remove coarse particles (i.e., size-cut at ∼2.5 µm). The CV TOF-ACSM is equipped with an aerodynamic lens for measuring particles having an aerodynamic diameter of less than 2.5 µm (PM2.5) (Xu et al., 2017). The TOF-ACSM has a different sampling line. For the purpose of comparison, a PM1 cyclone (URG, 2000-30EHB) was installed in front of the TOF-ACSM. The sampling flow rate was 16.7 L min−1 in the first half of every hour when the TOF-ACSM samples PM1 and then 4.8 L min−1 for the other half of every hour to sample PM2.5. For both instruments, ambient aerosols were sampled through electrolytic polished stainless steel tubes (0.95 cm outer diameter) with the residence time of less than 5 s. The inlet RH is about 12 %–45 %, with only 15 % of the values higher than 40 %.
The CV TOF-ACSM data have a time resolution of 2 min and were processed in Tofware (Tofwerk version 2.5.13). A CE of 1 was applied. The SV AMS data have a time resolution of 1 min and were processed in Igor (WaveMetrics version 6.37) toolkits, Squirrel (version 1.60B), and PIKA (version 1.20B). Composition-dependent CE values for the SV AMS are calculated by the methods introduced by Middlebrook et al. (2012), showing an average CE value of 0.50±0.01 (1σ) and occasionally greater values of up to 0.6 (Fig. S2). We therefore applied a single CE value of 0.5 to the AMS data herein, which is sufficient to achieve reasonable agreements between the AMS and the SMPS data (Fig. S3). For both instruments, calibrations of ionization efficiency (IE) and relative IE (RIE) followed the standard procedures described in previous studies by using 300–350 nm pure NH4NO3 and (NH4)2SO4 (Canagaratna et al., 2007; Fröhlich et al., 2013). The temperature and pressure during calibration were 293.7 K and 101.82 KPa, which represent the reference conditions of mass concentrations reported herein. Moreover, the PMF analysis was conducted on the organic mass spectra by using the Igor PMF evaluation tool (PET, version 3.00B) (Paatero and Tapper, 1994; Ulbrich et al., 2009). For the TOF-ACSM, the unit-mass-resolution (UMR) data between m∕z 12 and 200 were used in the PMF analysis. For the LTOF-AMS, the UMR and high-resolution (HR, a mass resolution of > 5000) data were used separately in the PMF analysis. The UMR PMF used the spectra between m∕z 12 and 200, while the HR PMF analysis used the spectra between m∕z 12 and 130. Details of the PMF analysis are provided in Sect. B of the Supplement.
Tables S1 and S2 in the Supplement list the instrument specifications (e.g., IE, RIE, and CE) and the detection limits of each species respectively. Although our TOF-ACSM is less sensitive than the instrument deployed by Fröhlich et al. (2013) perhaps due to different detectors, the detection is sufficient given the high concentrations of fine particles in Beijing. The LTOF-AMS shows lower detection limits for ammonium and chloride and somewhat greater detection limits for sulfate, nitrate, and OA compared with the V-mode HR-TOF-AMS (Decarlo et al., 2006). Moreover, the sulfate fragmentation for the CV TOF-ACSM is modified based on the measurements of pure (NH4)2SO4 particles (Table S3 and Fig. S4). The differences in sulfate fragmentation among studies suggest instrument dependency. Each CV instrument needs its own modifications. We applied the RIE values of 1.3 and 1.4 for chloride and OA, respectively, both of which are the same as the default values used for the SV instruments (Hu et al., 2017b; Xu et al., 2018). The RIE for nitrate is set to be 1.05, which is slightly lower than the value of 1.1 for the SV instruments (Xu et al., 2018). For sulfate, we applied the RIE value of 1.6 on the basis of the calibration with pure (NH4)2SO4 particles. Previous studies reported different sulfate RIEs for the CV instruments, for example, 1.5±0.3 for a quadrupole AMS (Xu et al., 2017), 1.7 to 2.4 for three TOF-AMS, and ∼1 for a quadrupole ACSM (Hu et al., 2017b). Such different RIEs suggest that the sulfate detection is sensitive to the vaporizer and the instrument itself. Similarly, different RIE values for sulfate have been reported for the SV instruments (Budisulistiorini et al., 2014). Moreover, the calibration of pure (NH4)2SO4 and NH4NO3 particles suggests the RIE of 3.7 for ammonium for the CV TOF-ACSM herein, which is lower than the previous finding of 5.2±0.6 (Xu et al., 2017). By contrast, the RIE values for ammonium for the SV instruments are generally 3.5–6.0 (typically an RIE of 4.0 is applied) (Canagaratna et al., 2007). In this study, the good agreement on the ammonium concentrations between the SV AMS and the CV TOF-ACSM indicates that the RIE values of ammonium are reliable.
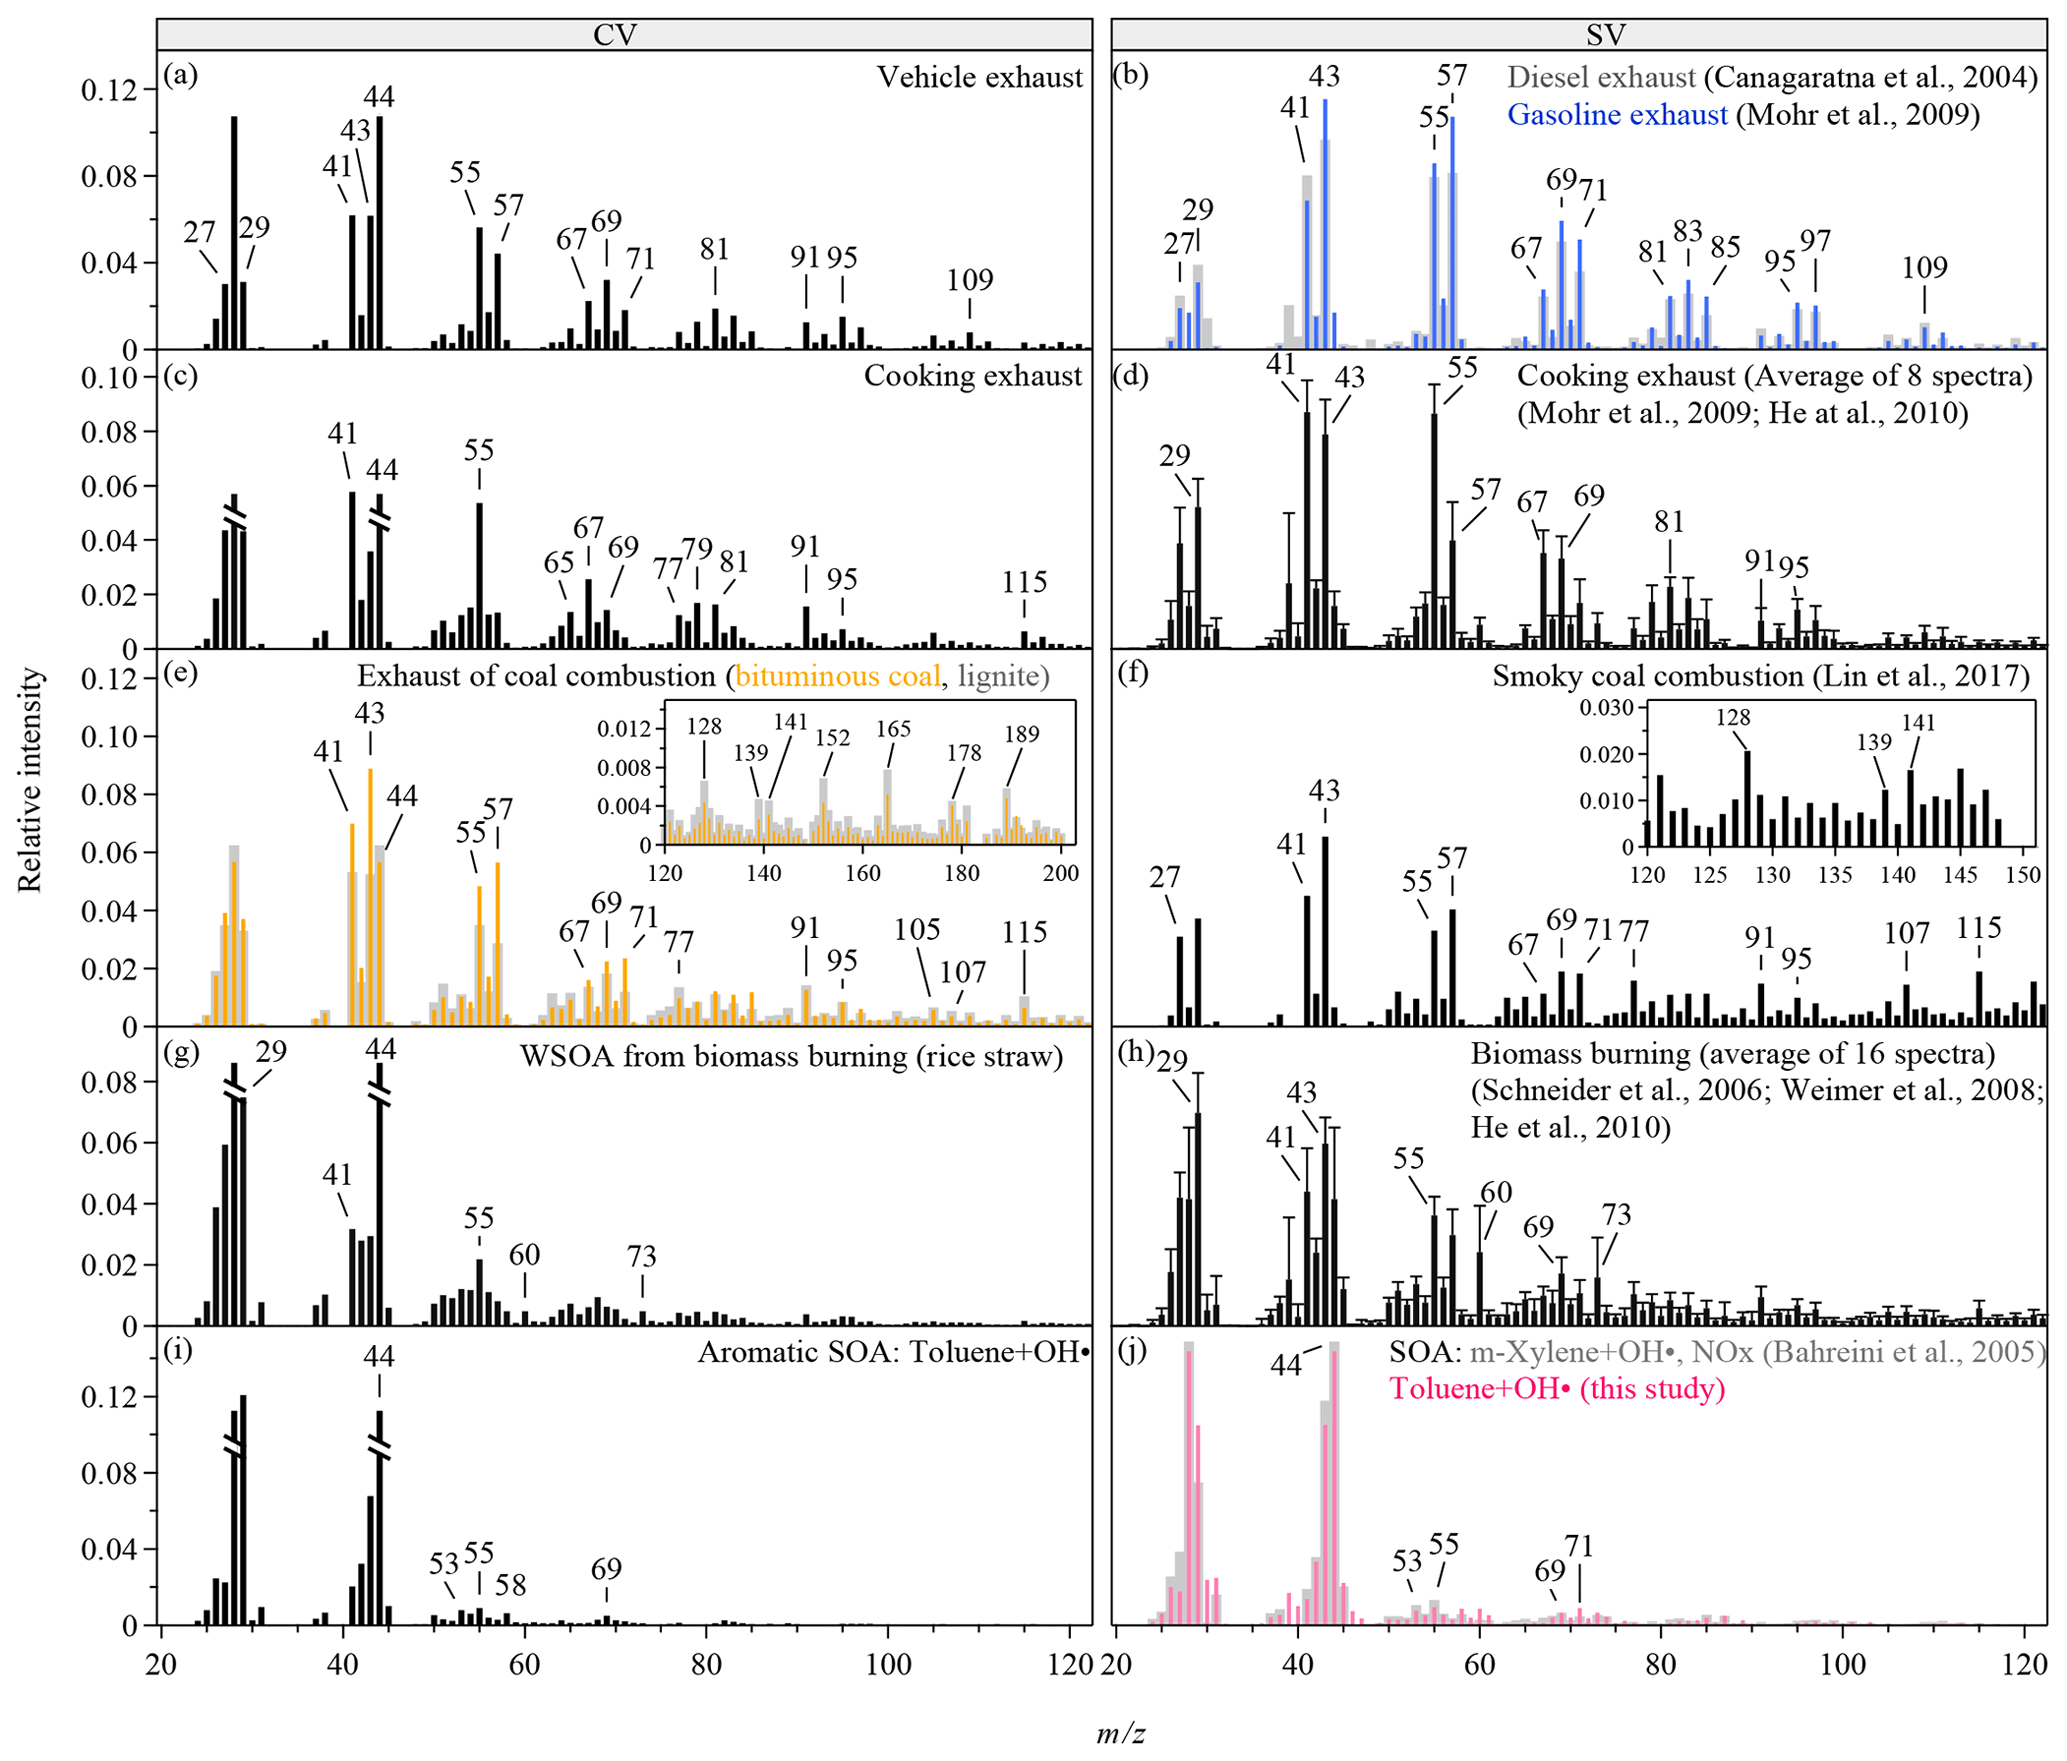
Figure 1Mass spectra of OA produced from various anthropogenic sources. The CV spectra are obtained from the TOF-ACSM in this study. The SV spectra are taken from literature and the AMS spectral database (Ulbrich, I. M., Handschy, A., Lechner, M., and Jimenez, J. L., http://cires.colorado.edu/jimenez-group/AMSsd/, last access: 7 May 2019). The intensities of m∕z 28 and 18 are calculated as 100 % and 22.5 % of the intensity of m∕z 44 for all the spectra (Aiken et al., 2008). In panels (c), (g), and (i), the relative intensities of m∕z 28 and 44 are truncated to half of the original intensities. The error bars in panels (d) and (h) show 1 standard deviation of the relative intensities reported in the reference spectra and only the upper sides of the bars are shown. Mass spectra are shown for the m∕z range of 20 to 120. The inserts in panels (e)–(f) show extended m∕z ranges for the corresponding spectra.
3.1 Mass spectra of anthropogenic OA
Figure 1 shows the mass spectra of five types of anthropogenic OA for CV and SV. The CV mass spectra have much higher signals at m∕z 44 and lower relative intensities of many large m∕z's than the SV spectra have (Fig. S5), which is consistent with previous findings for pure oxygenated organic compounds, chamber biogenic SOA, and ambient OA in the southeast US (Hu et al., 2018a, b). Enhanced thermal decomposition and hot surface collisions in the CV may explain such changes. The marker ions defined in the previous SV-based analysis are still distinct from their adjacent peaks in the CV spectra, suggesting that the CV instruments may work for characterizing anthropogenic OA. For example, the alkyl fragments (i.e., typically and series at m∕z 29, 41, 43, 55, 57, 67, 69, 71 etc.) are still prominent in the CV spectra for vehicle exhaust (Fig. 1a), although their relative intensities are about half of their relative intensities in the SV spectra (Figs. 1b and S5a) (Canagaratna et al., 2004; Mohr et al., 2009). The high signal at m∕z 44 is probably due to the influence of background air as well as the enhanced thermal decomposition (Fig. S1a).
The high signal at m∕z 55 has been used as a marker for COA (Mohr et al., 2009; He et al., 2010). As shown in Fig. 1c and Table S4, the f55∕f57 ratio of 4.05 is much greater than that for other types of anthropogenic OA (0.86–3.24) and is close to the ratio of 4.76 reported for the CV spectra of oleic acid, a common component of cooking oils (Hu et al., 2018a; Orsavova et al., 2015). The OA spectra of cooking and vehicle exhaust show similarities in distinct alkyl fragments. Meanwhile, the OA spectra for cooking exhaust shows some PAH fragments (Fig. S1b), similar to the spectra for coal burning. This is probably because the cafeteria often cooks meat at high temperatures, and this leads to the production of PAHs (Phillips, 1999). The f55∕f57 ratio in the CV spectra is much greater than the ratios of 2.34±0.59 in the SV spectra (Figs. 1d and S5b), showing a stronger difference between COA and other primary OA in the CV spectra than in the SV spectra.
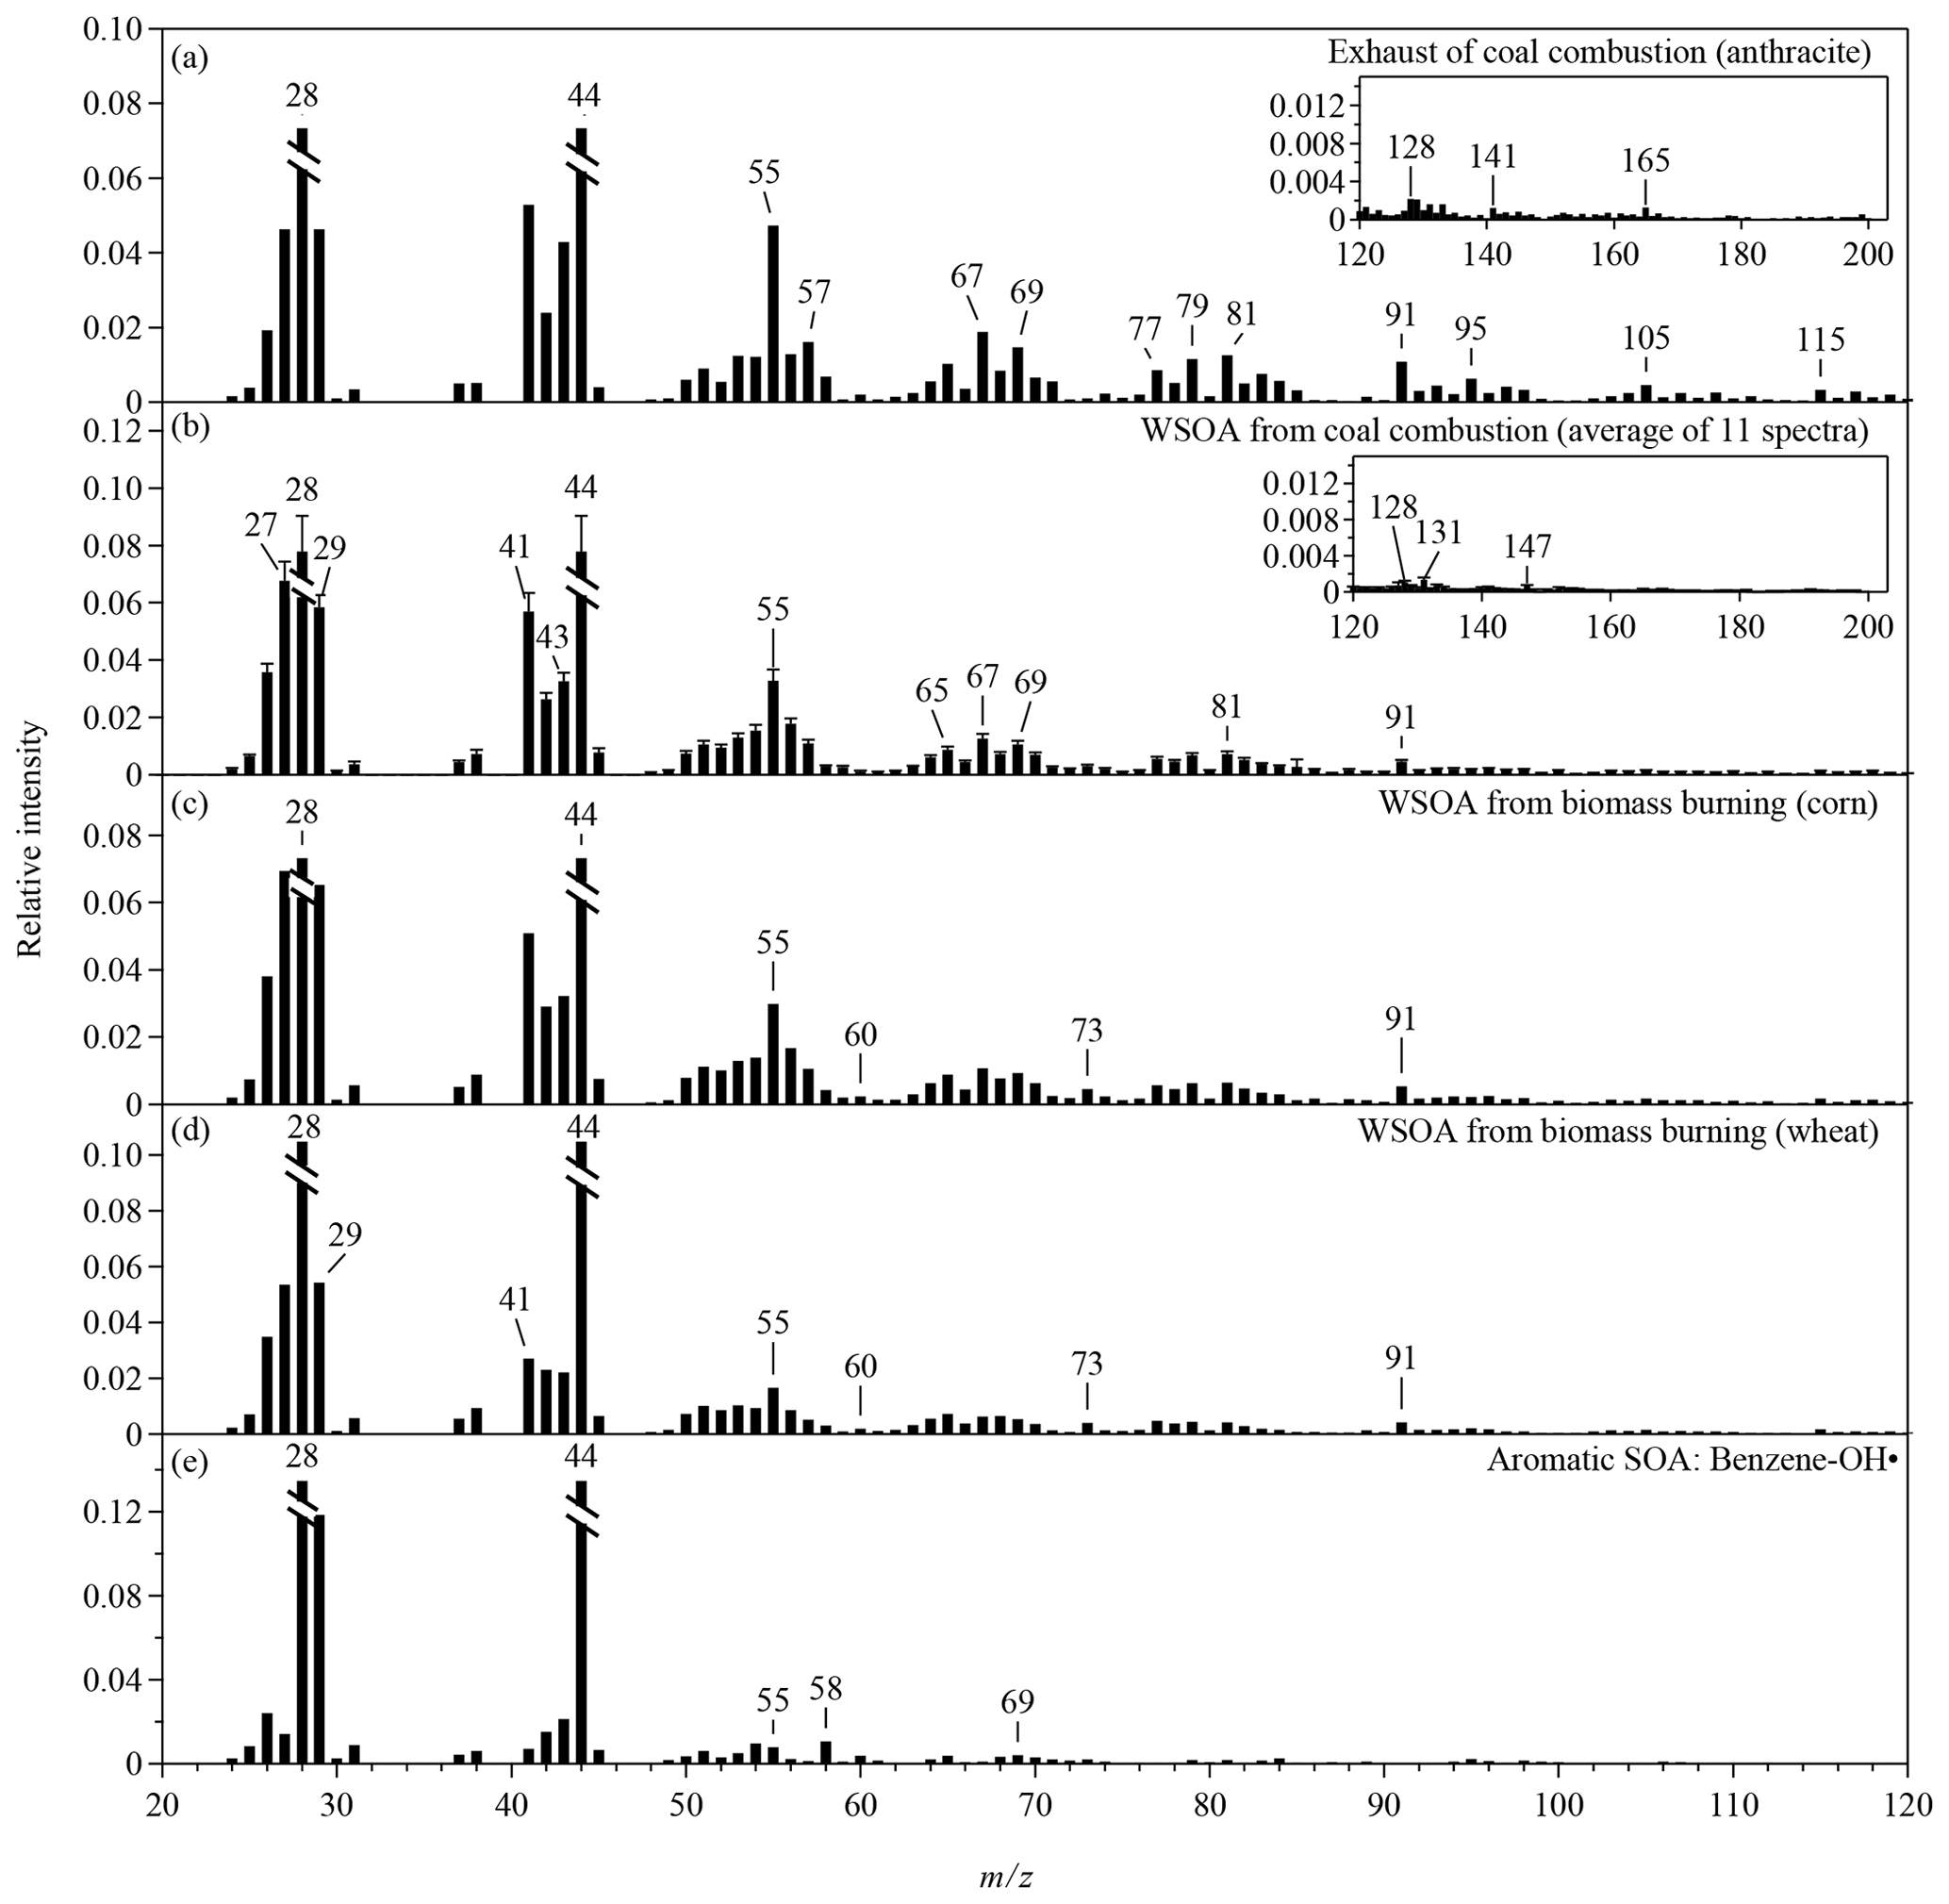
Figure 2The CV mass spectra of anthropogenic OA that are not included in Fig. 1. The intensities of m∕z 28 and 18 are calculated as 100 % and 22.5 % of the intensity of m∕z 44 for all the spectra (Aiken et al., 2008). The relative intensities of m∕z 28 and 44 in all panels are truncated to half of the original intensities. Mass spectra are shown for the m∕z range of 20 to 120. The inserts in panels (a)–(b) show extended m∕z ranges for the corresponding spectra.
For coal combustion, three types of coal, including lignite, bituminous coal, and anthracite, were burned in this study (Figs. 1e and S1c). Alkyl fragments in the spectra for coal burning are less prominent than for vehicle and cooking exhaust. The PAH-related ions clearly present in the spectra for lignite and bituminous coal, which is consistent with the SV spectra for smoky coal burning (Lin et al., 2017). The relative intensities of these ions in the CV spectra are several times lower than those in the SV spectra (Figs. 1f and S5c). Anthracite has the least amounts of impurities. As expected, the signals of PAH-related fragments are insignificant in the spectrum for anthracite (Fig. 2a), which may cause difficulties in separating this source from vehicle exhaust by PMF analysis. PAH characteristics are also absent in the CV spectra for the water-soluble portion of coal-burning OA along with much weaker signals of alkyl fragments compared with the CV spectra for coal-burning exhaust (Fig. 2b). The insoluble portion of the coal-burning OA is perhaps the main contributor of the particle-phase PAH and the alkyl fragments. The CV spectra for the water-soluble portion of the three types of coal-burning OA are similar to each other.
The spectra for BBOA are typically characterized by high signal intensities of ion peaks at m∕z 60 and 73, which are tracer ions for levoglucosan (Weimer et al., 2008; Schneider et al., 2006; He et al., 2010). Figure 1g shows the CV spectra for the water-soluble BBOA, which consists of over 65 % of the BBOA mass. The relative intensities of the two tracer ions (f60 and f73) in the CV spectra are significantly lower than those in the SV spectra (Figs. 1h and S5d). Similar reduction was observed for the CV spectra of laboratory-generated levoglucosan, explained by the enhanced thermal decomposition (Hu et al., 2018a). The values of f60 and f73 depend on the straw type (Figs. 1g and 2c–d). The CV spectrum for rice straw has the greatest f60 (0.48 %) and f73 (0.48 %), followed by the spectra for corn (f60=0.23 %, f73=0.46 %) and wheat (f60=0.19 %, f73=0.41 %). The CV-based f60 values for the other four types of anthropogenic OA are listed in Table S4. Most of these OAs have lower f60 than BBOA except for benzene SOA. Thef60 values of several chamber biogenic SOAs are also low (0.01 %–0.025 %) in the CV spectra (Hu et al., 2017b). Therefore, f60 and f73 may be still used as the markers for BBOA in the CV spectra. However, f60 and f73 may decrease because of aging. Difficulties in separating BBOA from SOA may occur for aged air masses. The atmospheric background of f60 in the SV spectra is about 0.3 % (Docherty et al., 2008; Cubison et al., 2011). We expect a much lower threshold in the CV spectra. Another feature in the BBOA spectra is the high f29 values for both CV and SV, which may originate from abundant carbohydrates in biomass (Schneider et al., 2011).
The CV and the SV spectra for aromatic SOAs are dominated by the signals at m∕z 29, 43, and 44 (Figs. 1i–j and 2e). The total relative intensities of ions at m∕z > 50 for aromatic SOAs are 3–7 times lower than those for primary OA, making aromatic SOA quite distinguishable. The SV spectra for various types of SOA produced by the ozonolysis or photooxidation of biogenic or anthropogenic precursors are similar in terms of the three major peaks and the relative contributions of ions at m∕z > 50 (Kroll et al., 2009; Chhabra et al., 2010; Chen et al., 2015; Robinson et al., 2011; Li et al., 2017). Some SOA has unique features, for example, a distinct peak at m∕z 82 (C5H6O+) for IEPOX-SOA (Hu et al., 2015). Studies that characterize the laboratory-generated SOA by the CV instruments are however limited. Hu et al. (2018a) reported the CV spectra of the SOA from the oxidation of α-pinene and Δ-carene by nitrate radicals and the ozonolysis of α-pinene. Our study shows the CV mass spectra of two anthropogenic SOA produced by the photooxidation of benzene and toluene. In comparison with the SV spectra, the CV spectra show much greater signal at m∕z 44, lower signal at m∕z 43, and slightly greater signal at m∕z 29 (Fig. S6). Some ions at m∕z > 50 have greater relative intensities in the CV spectra than in the SV spectra, but more ions have lower relative intensities which may be explained by the enhanced thermal decomposition and hot surface collisions.
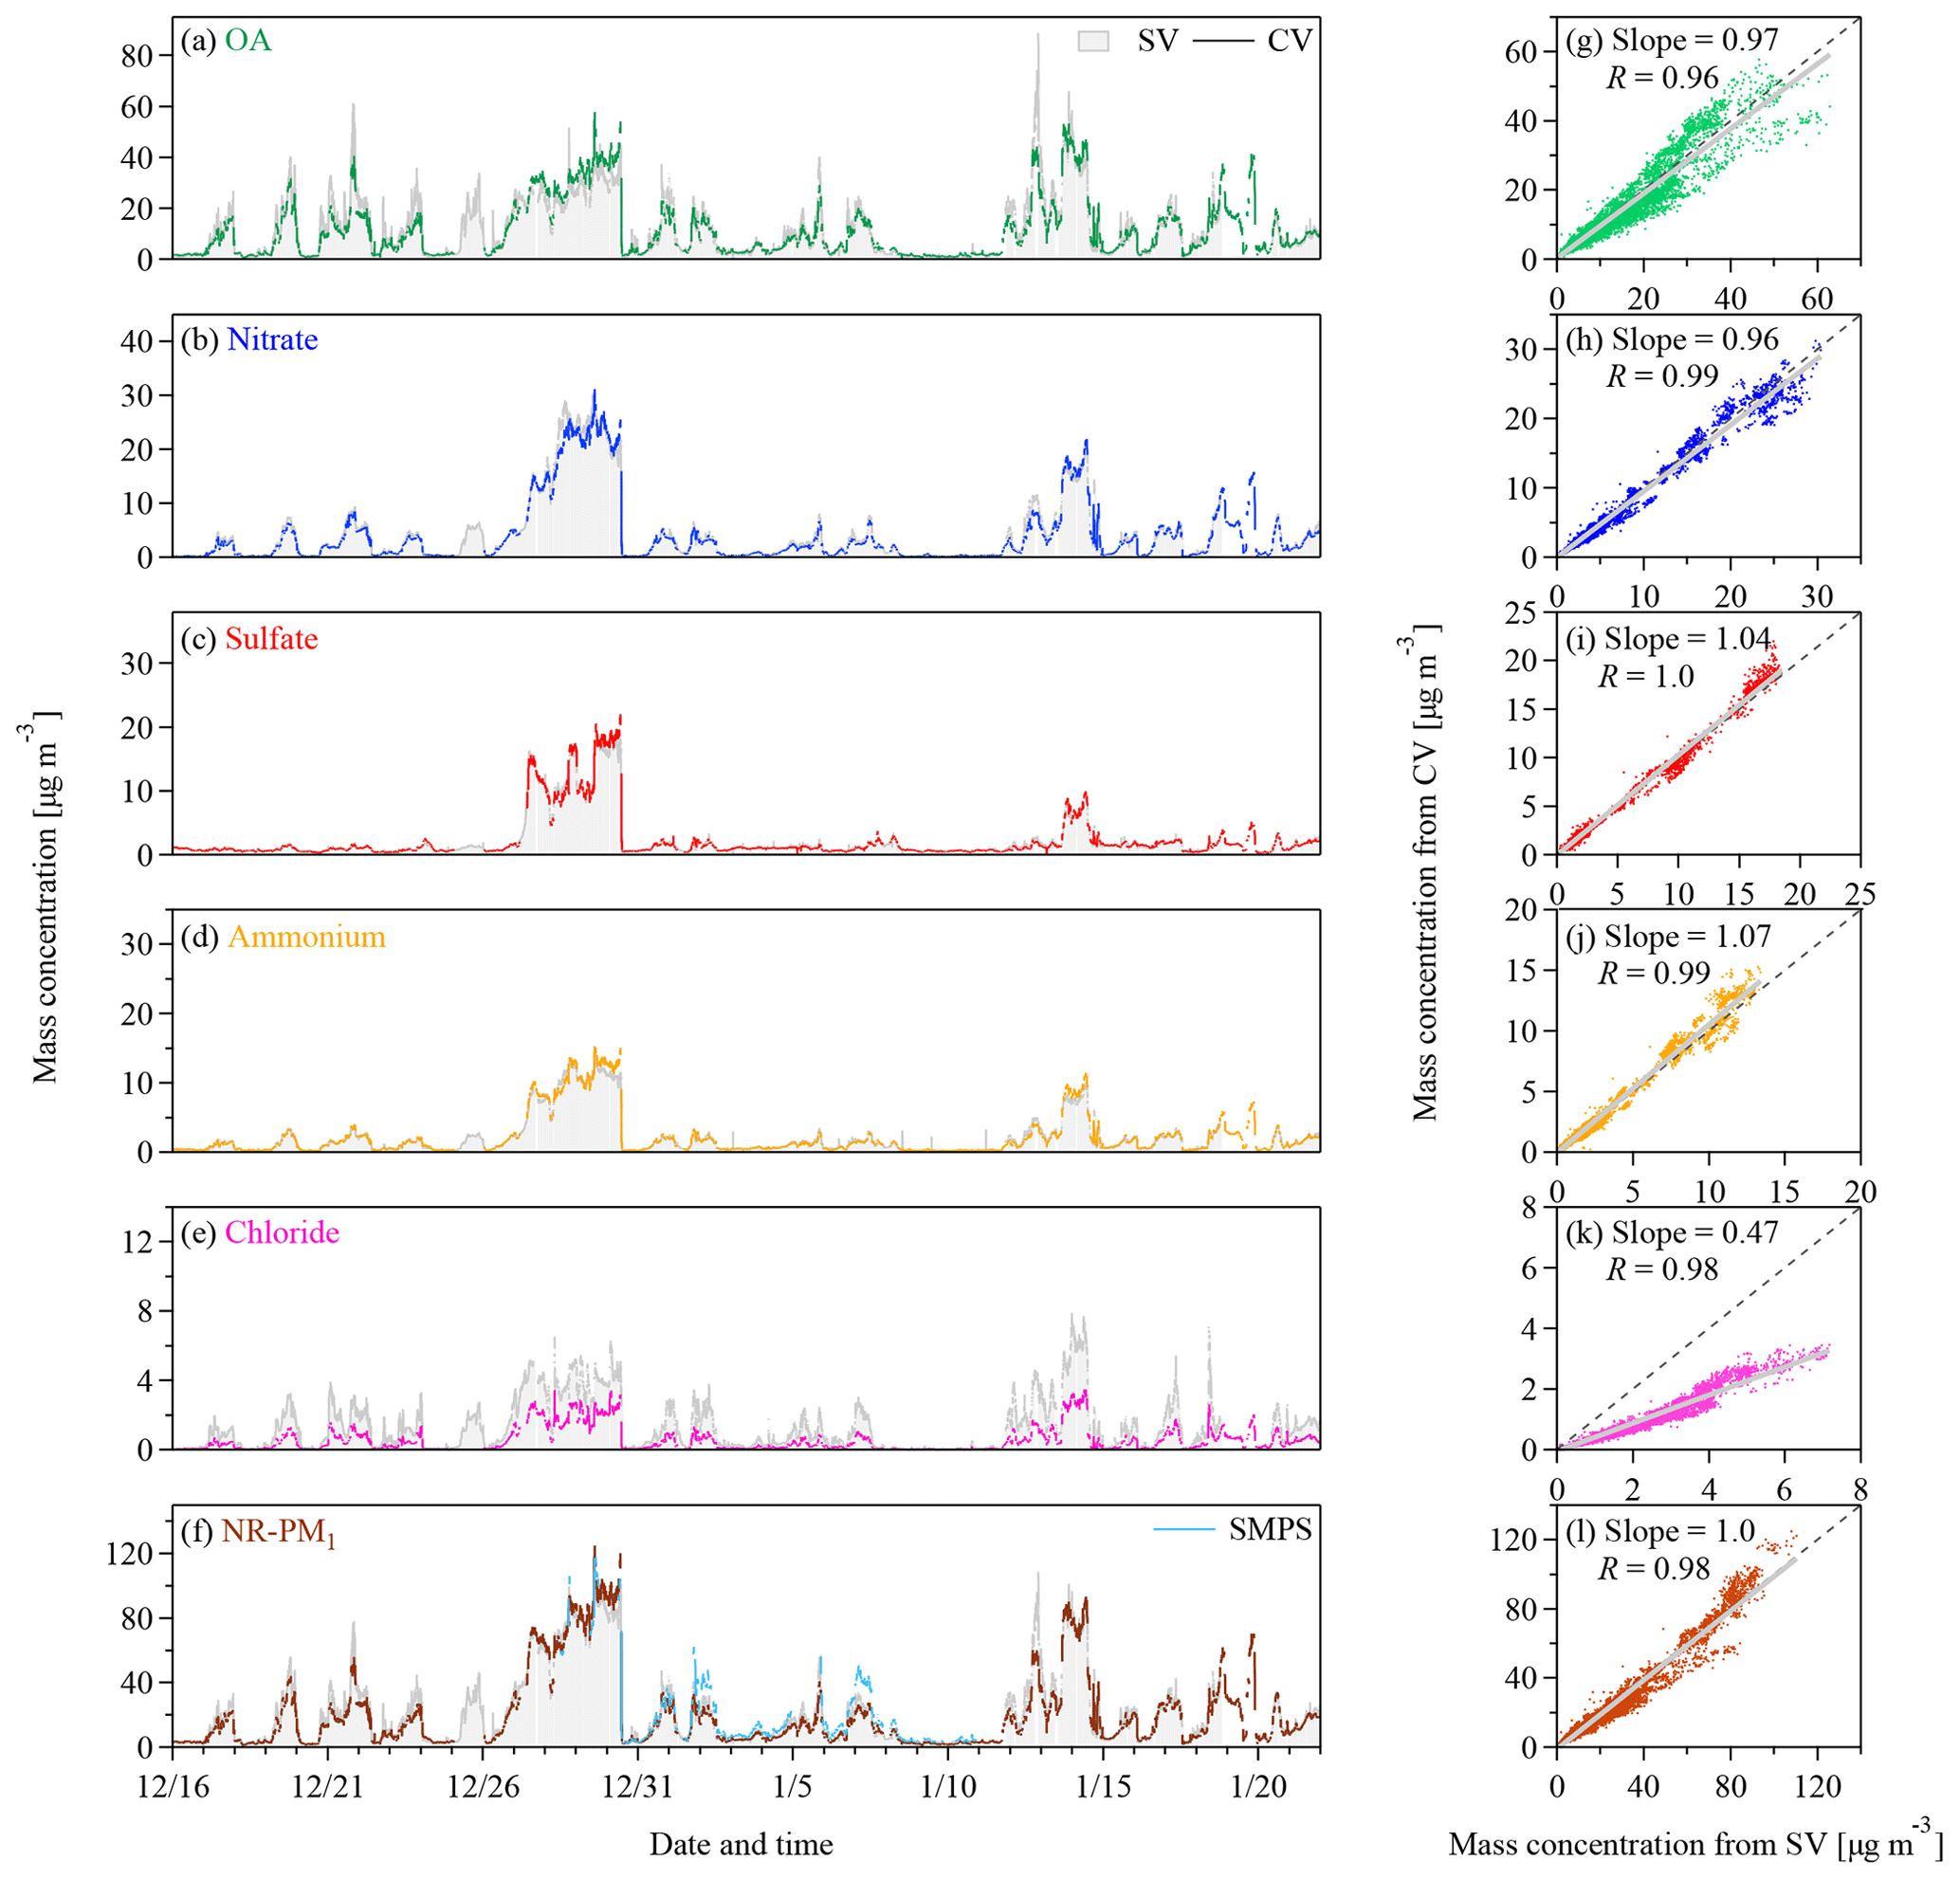
Figure 3(a–f) Time series and (g–l) scatter plots of the mass concentrations of OA, nitrate, sulfate, ammonium, chloride, and the sum of them (i.e., total NR-PM1) measured by the CV TOF-ACSM and the SV AMS. Panel (f) also shows the mass concentrations of PM1 derived from the SMPS measurements for an assumption of spherical particles with an effective density of 1350 kg m−3. The grey lines in the scatter plots represent the orthogonal distance regressions with intercepts. The slopes and the correlation coefficients (Pearson's R) are shown in the legend.
3.2 Mass quantification in the polluted urban environment
Figure 3 shows the time series of the mass concentrations of NR-PM1 and its components from the ambient measurements in Beijing. The campaign-average concentrations of OA, sulfate, nitrate, ammonium, and chloride measured by the CV TOF-ACSM are 11.3±11.3, 2.2±3.6, 4.1±5.9, 2.2±3.0, and 0.56±0.71 µg m−3 (average ± 1 standard deviation), respectively. The concentrations of these species agree well with the SV AMS results except for chloride. Because chloride only contributes to about 7 % of the NR-PM1 mass, the difference in chloride concentrations would not affect the comparison of the NR-PM1 mass between the CV and the SV measurements significantly. As shown in Figs. 2f and S2, the NR-PM1 mass concentrations measured by the CV and SV instruments are consistent with each other and also agree well with the SMPS data with assumptions of spherical particles and an effective density of 1350 kg m−3. The results support the CE of unity and good mass quantifications of ambient aerosols under highly polluted urban conditions by the CV TOF-ACSM.
The regression slope for chloride between the CV and the SV measurements is 0.47, while the R value is 0.98. Hu et al. (2017b) showed similar results (i.e., a slope of 0.52) when sampling in the US. The signal intensity of was about 0.1 % of the intensity of HCl+ at m∕z 36 during the measurement period, which should not affect the chloride quantification in the CV UMR analysis. An artifact chloride signal may present when the SV and CV instruments sample high concentrations of nitrate, explained by the possible reactions between the gaseous nitric acid evaporated from ammonium nitrate and the residual chloride salts on the vaporizer (Hu et al., 2017b; Drewnick et al., 2015). During the measurement period, such a chloride artifact should be less than 0.16 µg m−3 based on the empirical estimation (i.e., 0.2 %–0.5 % of the nitrate mass) (Hu et al., 2017b). The TOF-ACSM and the AMS herein are relatively new instruments that contain less residuals (e.g., chloride salts). Our data suggest even smaller chloride artifacts (i.e., 0.13 % and 0.2 % of the nitrate mass for the CV TOF-ACSM and the SV AMS, respectively) (Fig. S7). Besides, the mass quantification can be affected by the product of RIE and CE. Hu et al. (2017a) showed that the CE values of ammonium chloride are 0.25 and 0.35 for the SV and CV AMS, respectively. If the chloride particles are externally mixed as indicated by the different modes in the mass size distributions of species during the non-haze periods of the measurements (Fig. S8), the lower chloride CE for the SV than for the CV instruments suggests a greater correction for the CV than for the SV chloride concentrations. Such a correction may lead to a better agreement for chloride. However, information about the mixing state, the exact formula, and the RIE of chloride particles is limited.
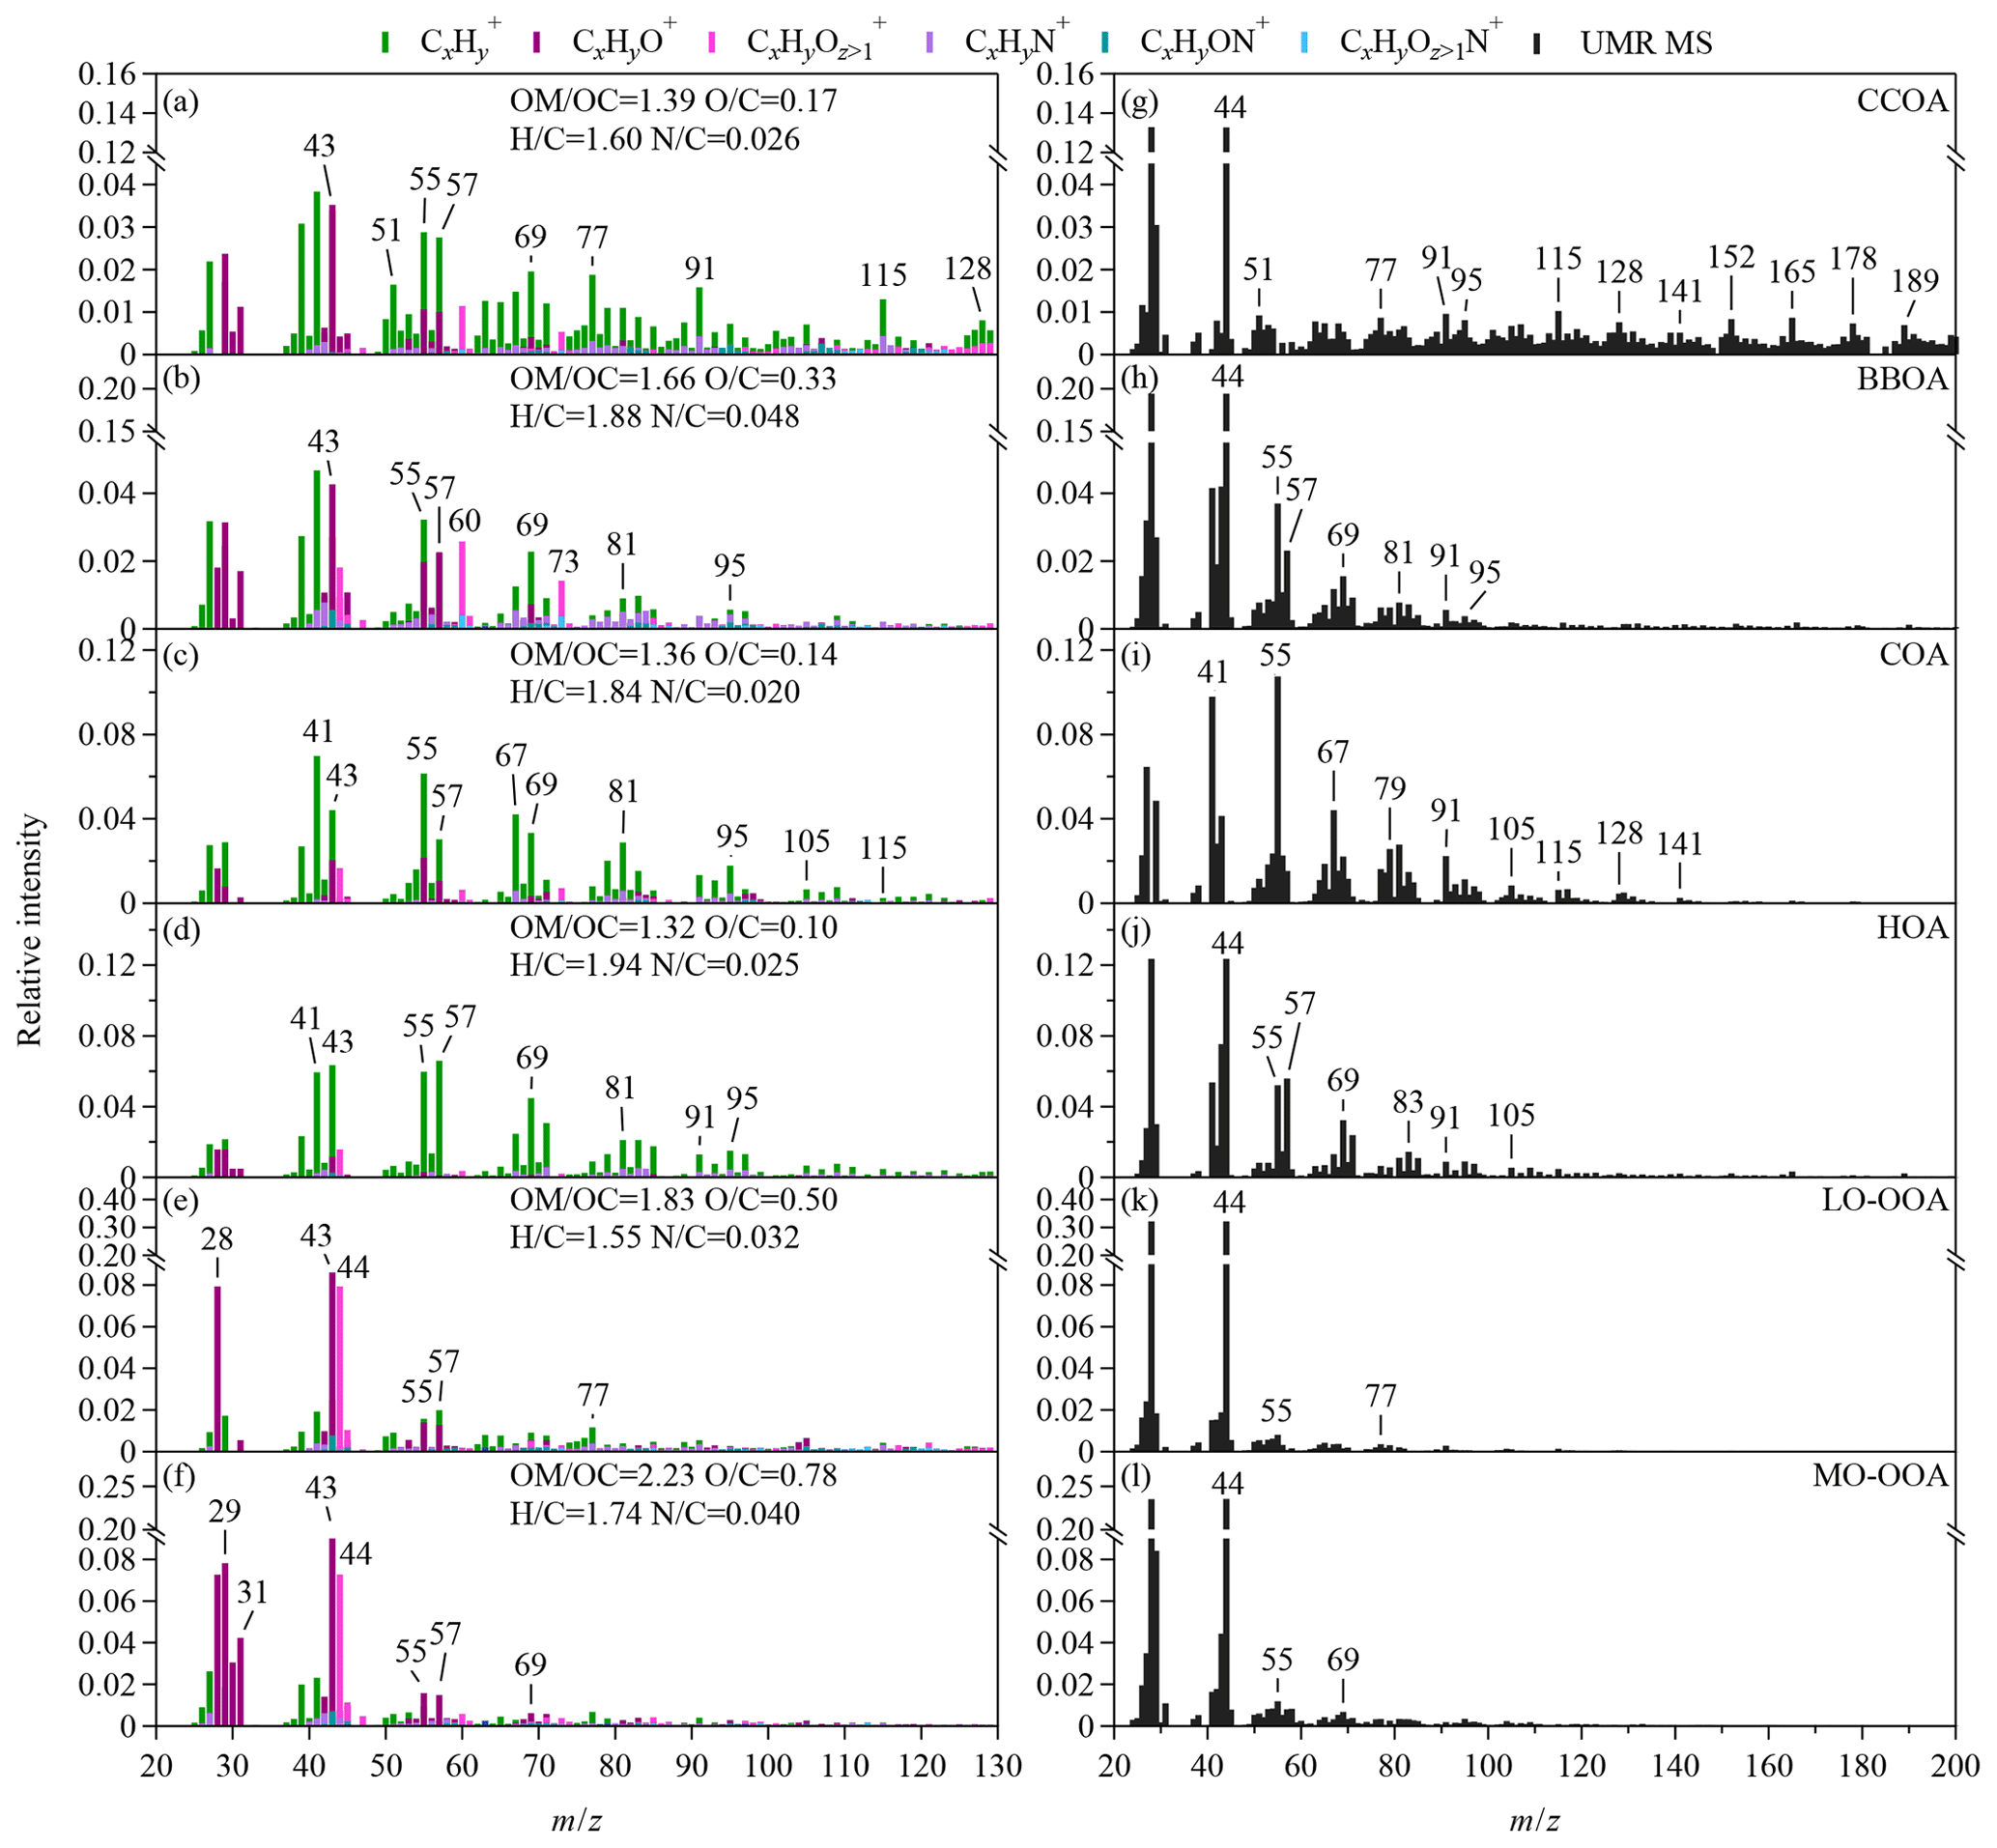
Figure 4Mass spectra of the statistical OA factors, CCOA, BBOA, COA, HOA, LO-OOA, and MO-OOA that are identified by the PMF analysis. The high-resolution intensity bars in panels (a)–(f) are color-coded by the contribution of various ion families (i.e., fragments containing C, H, O, or N for subscripts of x, y, and z), as determined from the analysis of the SV AMS data. The elemental ratios of atomic hydrogen-to-carbon (H∕C), oxygen-to-carbon (O∕C), and nitrogen-to-carbon (N∕C) ratios and the organic-mass-to-organic-carbon ratios (OM∕OC) of each factor are calculated from the SV AMS data on the basis of the “Improved-Ambient” method (Canagaratna et al., 2015). The UMR bars in panels (g)–(l) are calculated from the CV TOF-ACSM data. The m∕z range of 12 to 20 was included in the PMF analysis although not shown.
3.3 OA source apportionment in the polluted urban environment
We conducted the PMF analysis on the OA spectra from the UMR and HR SV AMS data and the UMR mass spectra from the CV TOF-ACSM data. Six statistical factors were identified and labeled as CCOA, BBOA, COA, HOA, less oxidized OOA (LO-OOA), and more oxidized OOA (MO-OOA) (Fig. 4). The mass spectra and the elemental ratios of the SV PMF factors are similar to the previous findings in winter in Beijing (Fig. 4a–f and Table S5). The spectra of HOA, COA, and CCOA factors are dominated by the signals of ions and hence show low atomic oxygen-to-carbon ratios (O∕C). The CCOA factor is characterized by the rich contribution of alkyl ions and distinctive PAHs fragments (Fig. 4a, g). The BBOA factor shows greater relative intensities of m∕z 60 (i.e., mostly ) and 73 (i.e., mostly ) compared with other primary factors (Fig. 4b, h). The O∕C ratio of the BBOA factor (0.33) is greater than the ratios of freshly emitted BBOA (0.18–0.26) but lower than the ratios of two OOA factors (He et al., 2010), indicating some degree of aging during transport. The atomic nitrogen-to-carbon ratio (N∕C) for the BBOA factor is also greater than for other OA factors. Similar high N∕C ratios for BBOA have been reported in the Beijing and Pearl River Delta regions (Sun et al., 2016; Huang et al., 2011). The COA factor is characterized by the high f55∕f57 ratio among factors (Fig. 4c, i). The f55∕f57 ratio of 6.99 in the CV COA factor is greater than the ratio for the cafeteria cooking exhaust (Table S4). The HOA factor is characterized by the predominant contribution of the alkyl family (i.e., typically and ) (Fig. 4d, j). In general, the CV PMF factors show similar spectral features to the corresponding the anthropogenic primary OA (Figs. S10 and S11). The average values of f60 andf73 in the CV BBOA factor are 0.084 % and 0.079 %, respectively, which are 2–6 times lower than in the CV spectra of water-soluble BBOA from crop burning (Figs. 1 and 2). The reduced f60 and f73 are consistent with the greater O∕C ratios of the BBOA factor. Because of the reduction in tracer ion signals, the PMF identification of BBOA from the CV data may be more uncertain than from the SV data.
The spectra of LO-OOA and MO-OOA factors show more abundant oxygenated ions and thus greater O∕C ratios. The mass spectra of the two OOA factors are dominated by the CxHyO+ and families (Fig. 4e–f). MO-OOA has greater O∕C ratios and a higher oxidation state than LO-OOA does. The ratios of f44 () to f43 (C2H3O+) are however similar for the two OOA factors in both of the SV and CV data sets, suggesting that pathways other than atmospheric aging perhaps contribute to the higher oxidation state of MO-OOA (Kroll et al., 2011). The greater O∕C ratios are mainly contributed by greater f29 (CHO+), f30 (CH2O+), and f31 (CH3O+) (Fig. S10). The CH1–3O+ fragments may come from various molecules, e.g., the SOA produced by the reactive uptake of glyoxal (Ge et al., 2012; Chhabra et al., 2010). Sun et al. (2016) showed that a similar OOA factor from the PMF analysis correlated well with CH2O+ and RH and suggest this factor may be related to aqueous processing. Further investigations are needed to understand the origin of this factor. The relative intensities of f29, f30, andf31 are greater in the CV MO-OOA spectra than in the CV LO-OOA spectra (Fig. 4k–l), and the differences in f29, f30, andf31 between the two OOA factors are much smaller in the CV PMF results than in the SV PMF results (Fig. S9).
The diurnal patterns of the PMF factors for CV and SV are similar to each other (Fig. S12). The patterns are also consistent with the previous findings in Beijing (Hu et al., 2016; Sun et al., 2013). For example, the CCOA loading shows the strongest nighttime enhancement at 02:00–04:00 UTC+8, which is consistent with residential coal burning in the suburban area of Beijing. The COA loading shows peak concentrations at noon and in the evening. The diurnal patterns of HOA are consistent with the morning and evening rush-hour enhancements. Another peak in the earlier morning occurs later than the CCOA nighttime enhancement (04:00 UTC+8), which may be caused by emissions of heavy-duty diesel trucks that are only allowed to enter the city after 12:00 UTC+8. Regional transport perhaps predominantly contributes to the BBOA in Beijing, and hence the BBOA diurnal patterns show some similarity to CCOA. The diurnal variations in the OOA loadings are different from the primary OA factors. LO-OOA shows elevated mass concentrations in the afternoon (Fig. S13), indicating that the formation of LO-OOA may be photochemically driven (Hu et al., 2016; Sun et al., 2013, 2016). MO-OOA has a relatively flat diurnal pattern (Fig. S12).
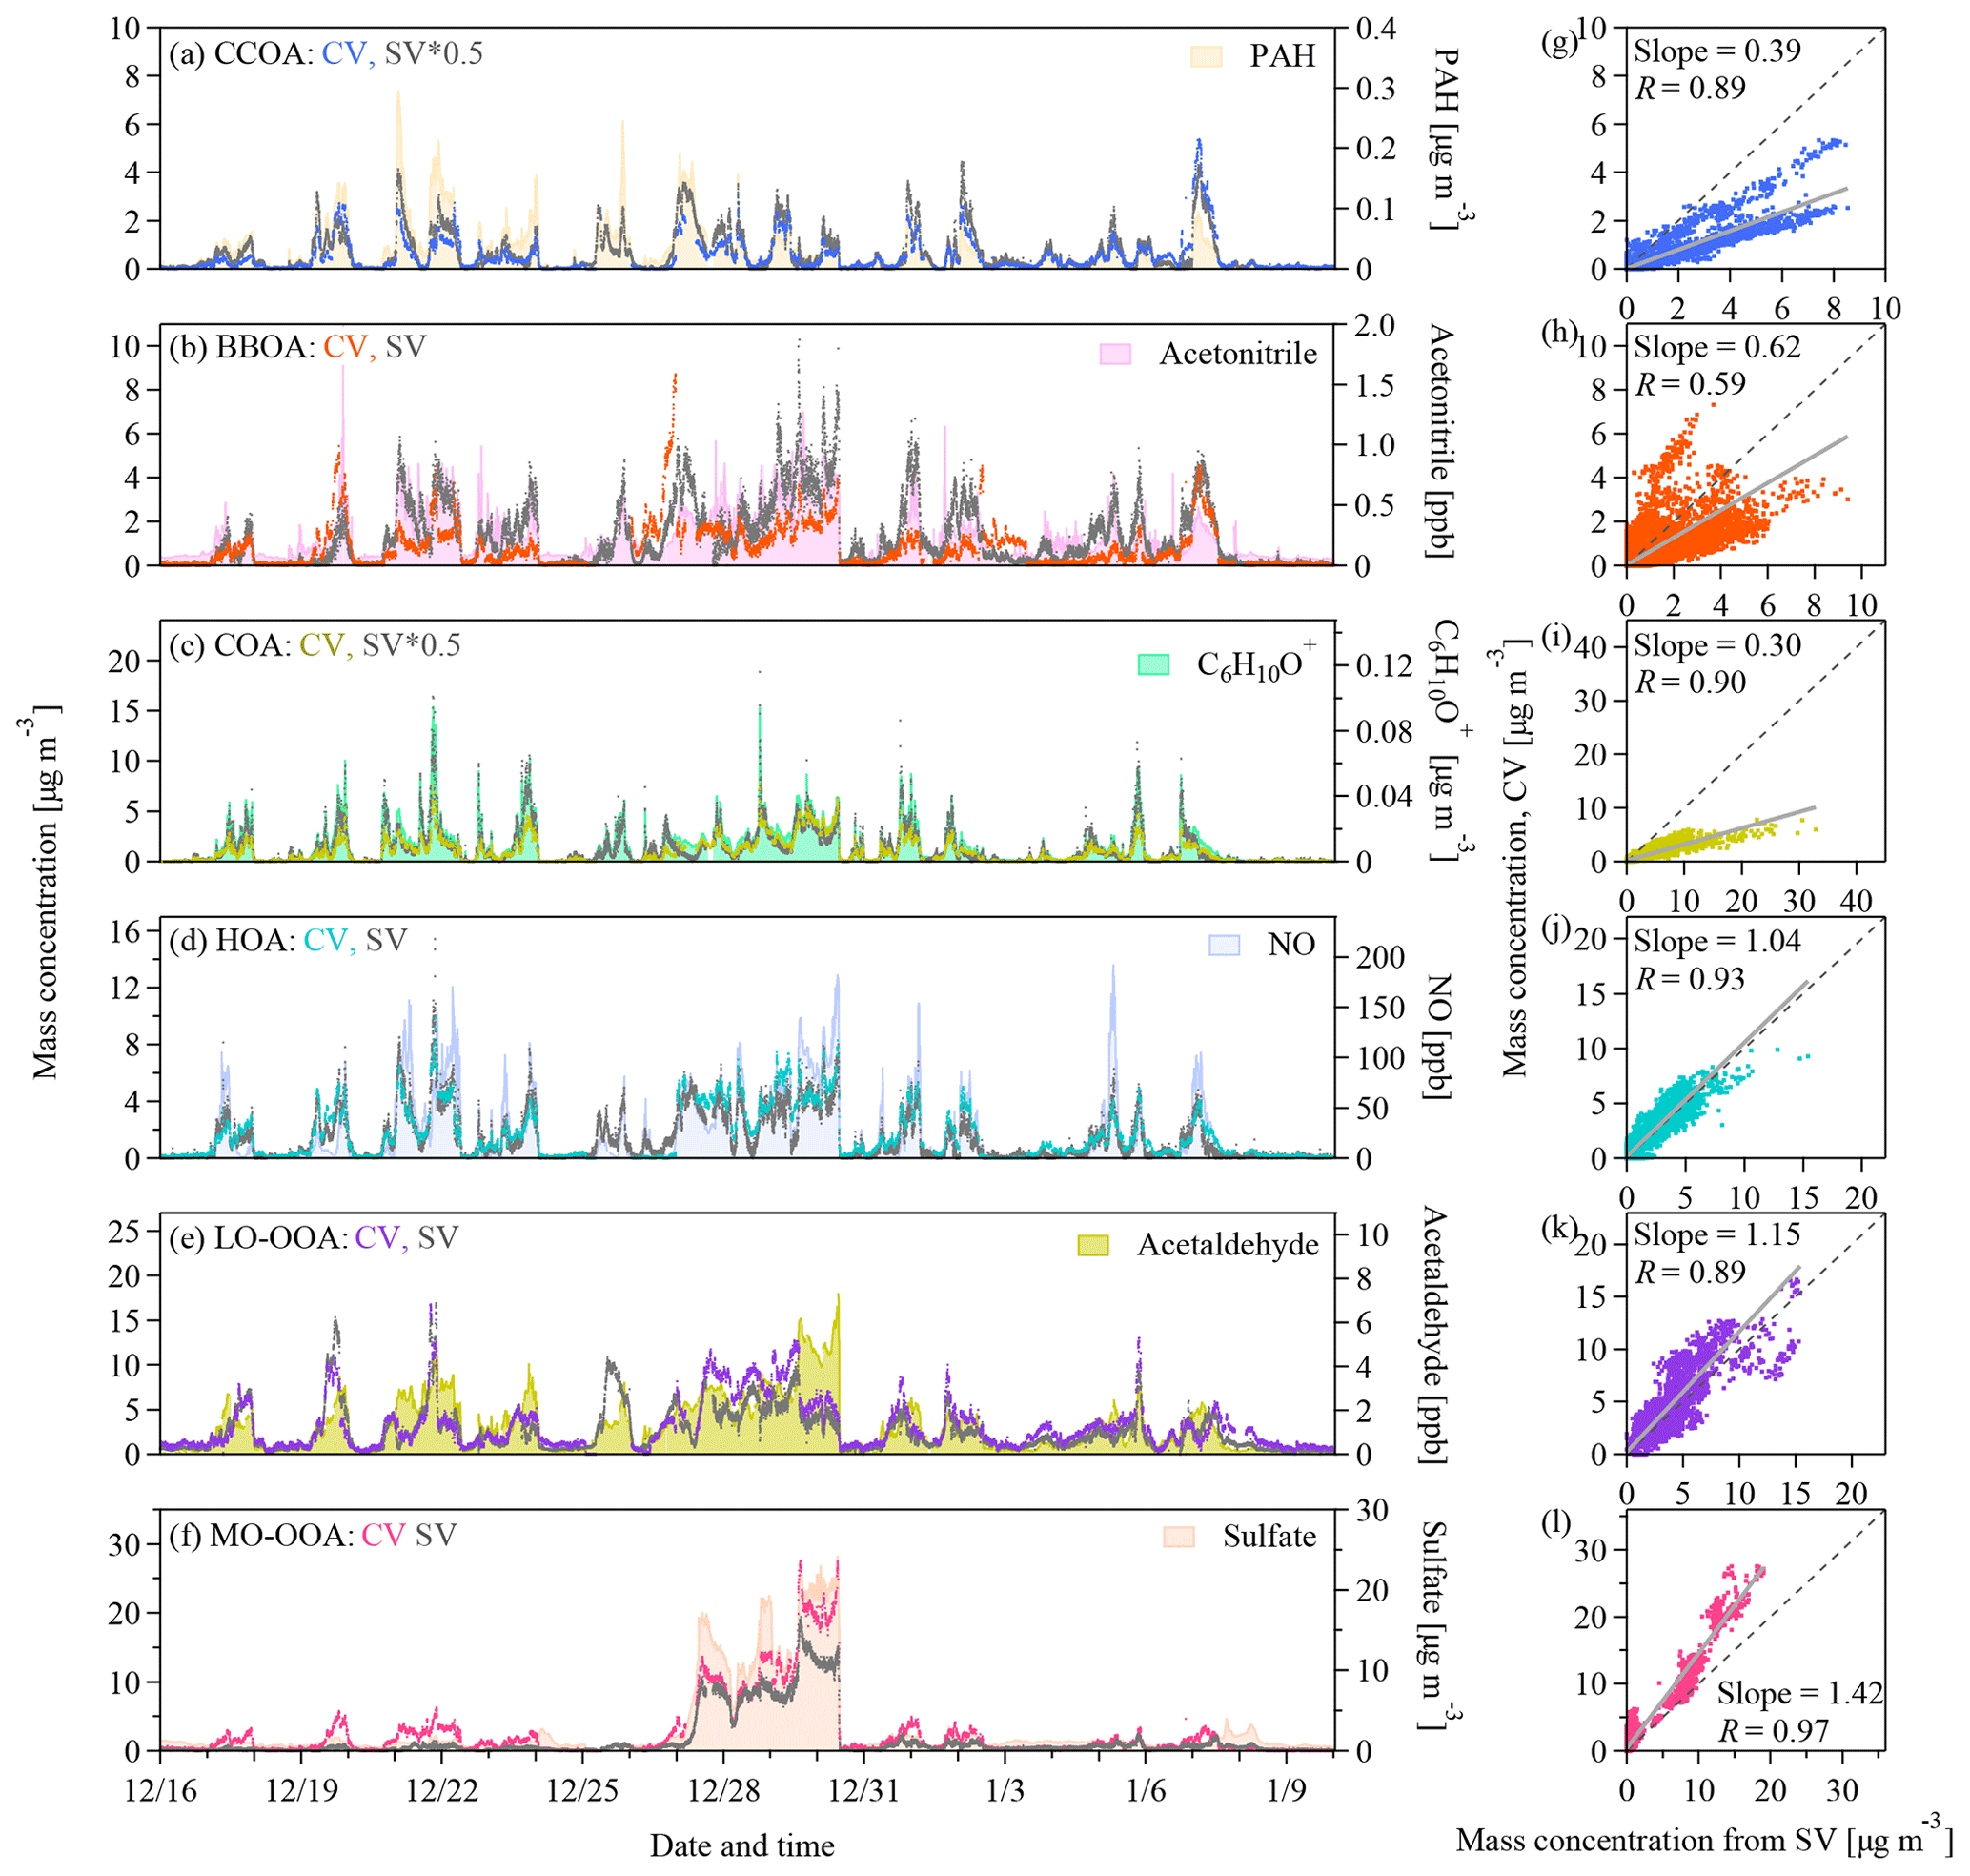
Figure 5(a–f) Time series and (g–l) scatter plots of the mass concentrations of the six OA factors identified by the PMF analysis on the UMR–CV and HR–SV data sets as well as the time series of the potential tracers. The grey lines in the scatter plots represent the orthogonal distance regressions with intercepts. The slopes and the Pearson's R values are shown in the legend. PAH refers to the particle-phase PAH concentrations detected by the SV AMS.
Figure 5a–f show the time series of the mass concentrations of each statistical PMF factor. Figure 6a–f show the correlation coefficients of the time series of the factor loadings with those of potential tracers. The temporal variation in the CCOA loadings tracked that of the particle-phase PAH concentrations detected by the SV AMS (Figs. 5a and 6a) (Dzepina et al., 2007). The time series of BBOA tracked that of acetonitrile (RSV=0.73) (Figs. 5b and 6b). The O∕C ratio of BBOA suggests some degree of aging, which may affect the correlation with acetonitrile. Consistently the scatter plot of f44 versus f60 shows that f60 decreases as f44 increases (Fig. S13). Our data suggest that the atmospheric background of f60 in the CV spectra should be < 0.03 %. The COA loadings correlate well with the signals of the marker ions of C5H8O+ and C6H10O+ proposed by Sun et al. (2011) (Figs. 5c and 6c). The time series of HOA tracked the NO concentrations. Although both BBOA and HOA show good correlations with many tracers, the difference between the two factors in the time series is quite clear (e.g., on 19, 25, 27 December and so on). As for OOAs, the LO-OOA loadings only show moderate correlations with the tracers in Fig. 6e, and MO-OOA shows large mass enhancements during the haze episodes (Fig. 5f). The MO-OOA loading correlates well with secondary species like sulfate, nitrate, and ammonium as well as RH (Fig. 6f). As described previously, whether this factor is related to aqueous processing remains unclear.

Figure 6Pearson's R values for (a–f) the correlations between the time series of the concentrations of the six OA factors that are identified by the PMF analysis on the CV and SV data sets and potential tracers and (g–l) the correlations between the time series of the concentrations of each OA factor from the CV data and the six OA factors from the SV data. PAH refers to the particle-phase PAH concentrations detected by the SV AMS.
The time series of the mass concentrations of the CV and SV PMF factors tracked each other, although the loadings of some factors differ. As shown in Fig. 5g–l, the correlation coefficients are 0.9 or greater except for BBOA (R=0.59). Additionally, each of the CV PMF factors shows the best correlation with the corresponding SV factors except for BBOA (Fig. 6g–l). The difference in mass resolution between the UMR and the HR PMF analysis may affect the PMF results. Figures S12 and S14 show the comparison of the PMF factors derived from the UMR and HR SV data. The differences in the diurnal variations in the loadings of the UMR–SV vs. HR–SV PMF factors are small (Fig. S12). Good correlations with R values of 0.85 to 0.98 in Fig. S14 indicate that mass resolution is perhaps not the main reason for the difference between CV BBOA and SV BBOA in Fig. 5h. The slopes between UMR and HR PMF results of the SV data range from 0.66 to 1.16, suggesting that the separate PMF analysis on the same data with different mass resolution may lead to a loading uncertainty of about 20 % for primary OA factors and about 40 % for OOAs. A plausible explanation for the low correlation coefficient for BBOA in Fig. 5h is that the low signal-to-noise ratios of the tracer ions lead to insufficient separation of BBOA from other factors in the PMF analysis of the CV data. As described previously, the f60 and f73 values in the CV spectra are much lower than in the SV spectra because of prolonged thermal decomposition. Aging further reduced f60 andf73, resulting in noisier f60 andf73 in the CV data than in the SV (Fig. S15). For the same reason, the CV BBOA factor has weaker temporal correlation with acetonitrile than the SV BBOA factor does (RCV=0.48 vs. RSV=0.73).
The signal-to-noise ratios of the tracer ions for other primary OA factors and the OOA factors are much greater than those of the BBOA factor. Although the correlations are generally good, the regression slopes for the CV vs. SV loadings are about 1.0 for HOA, 0.4 for CCOA, 0.3 for COA, 1.15 for LO-OOA, and 1.42 for MO-OOA (Fig. 5g–l). Some difference in particle transmission efficiency exist between the two instruments, which may contribute to the loading discrepancies between the CV and SV PMF factors. Specially, the CV TOF-ACSM uses the PM1 cyclone in line with a PM2.5 lens, and the SV AMS has a standard PM1 lens. The PM2.5 lens has 10 %–20 % lower transmission efficiency for 100–200 nm (vacuum aerodynamic diameter) particles (Xu et al., 2017). The PM1 cyclone has 50 % transmission efficiency at 1.0 µm (aerodynamic diameter), whereas the standard PM1 lens has 35 %–40 % transmission efficiency for particles having vacuum aerodynamic diameter of 0.8–1.0 µm (Liu et al., 2007). These differences are however small compared to the instrument and PMF uncertainties, which is consistent with the good comparisons of species loadings discussed in Sect. 3.2. Moreover, CE and RIE affect the calculation of the mass loadings. The RIE for COA (SV) may be 1.56 to 3.06, which is greater than the default value of 1.4 (Reyes-Villegas et al., 2018). Another study showed that the CV and SV instruments may have different RIEs for OAs having a low carbon oxidation state (e.g., less than −1.0) (Xu et al., 2018). There is lack of information about the RIE for CCOA, but the carbon oxidation state of CCOA and COA are both low (−1.26 and −1.56, respectively). A combination of externally mixing, large CE for SV (> 0.5), and greater RIE in SV than CV may explain the low slopes for CCOA and COA in Fig. 5g, i. Yet related information is limited. Another contributor is the PMF uncertainty. Enhanced thermal decomposition alters the mass spectra (Sect. 3.1). The CV spectra have much more abundant f44 and its related ions. The changes in the mass spectra lead to different weighting of the ions related to various factors in the PMF analysis and hence perhaps affect the PMF analysis of factor loadings. Hu et al. (2018b) also showed that the slopes for MO-OOA and LO-OOA (CV vs. SV) are 1.46 and 0.59, respectively for the aircraft study in South Korea, 1.20 and 0.67, respectively for the study in the southeast US. The slopes for MO-OOA and LO-OOA in our study are both greater than 1.0 (Fig. 5k–l). The greater OOA concentrations are balanced by the lower loadings of CCOA and COA, and therefore the total OA loadings are consistent with each other between the CV and SV data sets (Fig. 3a).
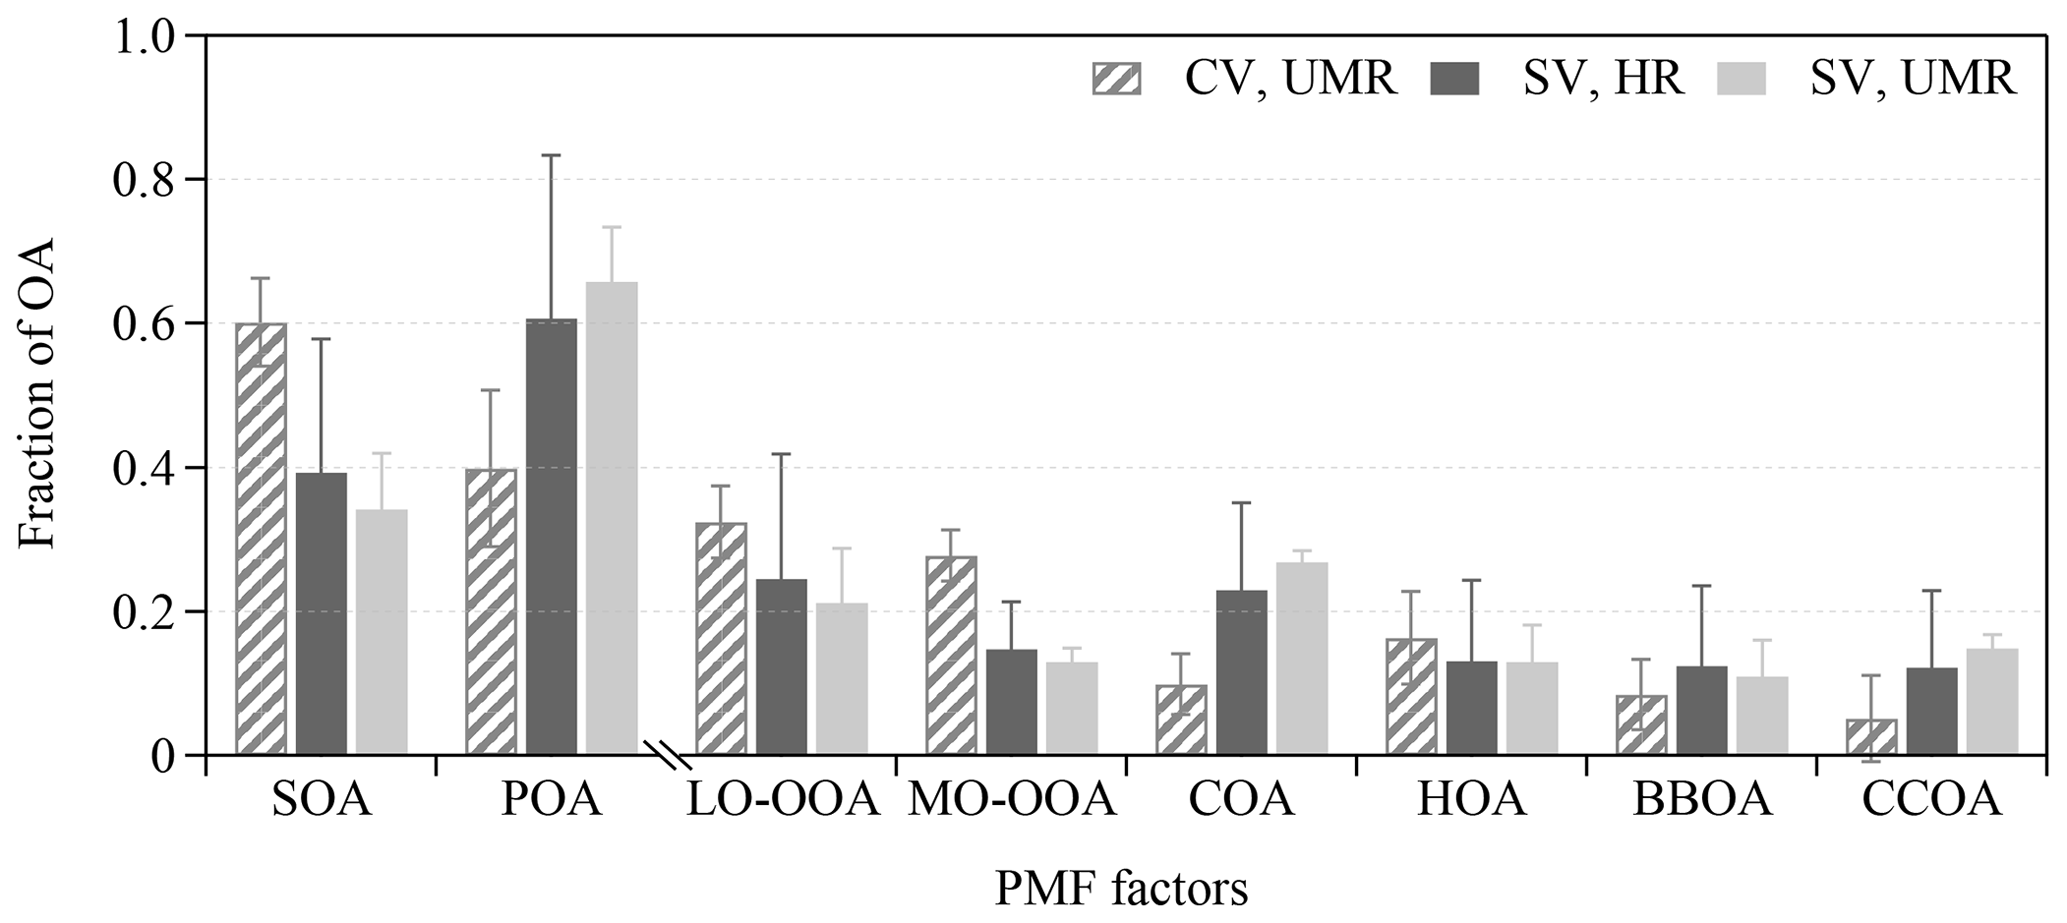
Figure 7The average fractional contribution to the OA mass by each of the six statistical PMF factors. The uncertainty bars are calculated from the bootstrapping analysis (Table S12).
Figure 7 shows the fractional contribution of the campaign-average concentrations of each statistical PMF factor to the OA mass. The SV PMF results from HR (and UMR) data suggest 12 % (11 %) of BBOA, 12 % (15 %) of CCOA, 23 % (27 %) of COA, 13 % (13 %) of HOA, 15 % (13 %) of MO-OOA, and 25 % (21 %) of LO-OOA, meaning about 60 % of primary OA and 40 % of OOAs. The results are similar to the previous findings in winter in Beijing except for the low fraction of CCOA. Previous studies indicate 20 %–30 % of CCOA during 2010 to 2013 (Hu et al., 2016; Sun et al., 2013, 2014, 2016). The decrease in the CCOA contribution is consistent with the stringent emission control of residential coal burning during 2016 to 2017. If the RIE of COA is underestimated, the COA loading might be overestimated, and the mass fraction of COA should be lower. The CV PMF results suggest 8 % of BBOA, 5 % of CCOA, 10 % of COA, 16 % of HOA, 28 % of MO-OOA, and 32 % of LO-OOA, which means about 40 % of primary OA factors and 60 % of OOAs. BBOA is not well identified by the CV PMF analysis because of the low signal-to-noise ratio of tracer ions. The reasons for different factor loading levels between CV and SV is unclear. Changes in the mass spectra may contribute to the PMF uncertainties. Figure 7 shows that the bootstrap uncertainties in PMF are lower in the UMR–CV than in the HR–SV analysis. Hu et al. (2018b) showed lower CV bootstrap uncertainty for the study in the southeast US and greater uncertainty in the CV for the South Korean aircraft and Billerica studies.
In this study, we showed the CV mass spectra of typical anthropogenic OA, including vehicle exhaust, cooking exhaust, coal combustion emission, water-soluble OA from crop burning, and aromatic SOA. The marker ions for various sources defined in the previous SV-based analysis are still distinct from adjacent peaks in the CV mass spectra. Cooking and vehicle exhaust show similarities in distinct alkyl fragments but very different f55∕f57 ratios in the OA spectra. The PAH-related ions are clearly present in the spectra for lignite and bituminous coal but not for anthracite. Although f60 and f73 are significantly lower in the CV spectra for water-soluble BBOA, they are still greater than most of the other OA and work as BBOA tracers. We also examined the performance of CV for mass quantification of nonrefractory chemical species and source apportionment of OA in Beijing. The concentrations and temporal variations in OA, sulfate, nitrate, and ammonium derived from the CV data agree well with the SV results. Our results support the CE of about unity and good mass quantifications of ambient particles by the CV TOF-ACSM. Moreover, six statistical factors are identified, including CCOA, BBOA, COA, HOA, and two OOAs (LO-OOA and MO-OOA) by the PMF analysis on both CV and SV data. Our data suggest an atmospheric background of f60 of below 0.03 % for CV. Despite the loading difference for some PMF factors, the good correlations of the mass concentrations of the CV and SV factors as well as the similarity between the mass spectra of ambient OA factors and the spectra of specific anthropogenic OA indicate effective PMF analysis with the CV in polluted urban environments like Beijing. The loading uncertainty in the PMF analysis is estimated to be about 20 % for primary OA factors and about 40 % for OOAs. Our CV-based PMF results show less fractional contribution of primary OA factors and greater contributions of OOAs than the SV. Such a difference may affect the interpretation of results and the comparisons among studies. We recommend adding “CV-” as the prefix of the PMF factor names for future CV-based AMS, ACSM, or TOF-ACSM studies to differentiate them from the published results from traditional SV-based instruments. Further information about the particle mixing state, CE (SV), and RIE of primary OA may help understanding the loading difference in the CV and SV PMF factors.
Data presented in this paper are available upon request to the corresponding author.
The supplement related to this article is available online at: https://doi.org/10.5194/amt-13-2457-2020-supplement.
QC, TZ, and YZ designed the study. YZ, XC, KL, and YL conducted the measurements. YL, RJH, SC, and LMZ provided data or samples. QC and YZ analyzed the data. QC and YZ prepared the paper with contributions from all authors.
The authors declare that they have no conflict of interest.
This work was supported by the National Natural Science Foundation of China (91544107, 41875165, and 51861135102) and the State Key Joint Laboratory of Environment Simulation and Pollution Control (15Y02ESPCP and 16Y01ESPCP). The authors gratefully acknowledge Mikinori Kuwata and Manjula Canagaratna for helpful discussion.
This research has been supported by the National Natural Science Foundation of China (grant nos. 91544107, 41875165, and 51861135102).
This paper was edited by Jun Wang and reviewed by two anonymous referees.
Aiken, A. C., Decarlo, P. F., Kroll, J. H., Worsnop, D. R., Huffman, J. A., Docherty, K. S., Ulbrich, I. M., Mohr, C., Kimmel, J. R., and Sueper, D.: O∕C and OM∕OC ratios of primary, secondary, and ambient organic aerosols with high-resolution time-of-flight aerosol mass spectrometry, Environ. Sci. Technol., 42, 4478–4485, 2008.
Bruns, E. A., Perraud, V., Zelenyuk, A., Ezell, M. J., Johnson, S. N., Yu, Y., Imre, D., Finlayson-Pitts, B. J., and Alexander, M. L.: Comparison of FTIR and particle mass spectrometry for the measurement of particulate organic nitrates, Environ. Sci. Technol., 44, 1056–1061, https://doi.org/10.1021/es9029864, 2010.
Bruns, E. A., Krapf, M., Orasche, J., Huang, Y., Zimmermann, R., Drinovec, L., Močnik, G., El-Haddad, I., Slowik, J. G., Dommen, J., Baltensperger, U., and Prévôt, A. S. H.: Characterization of primary and secondary wood combustion products generated under different burner loads, Atmos. Chem. Phys., 15, 2825–2841, https://doi.org/10.5194/acp-15-2825-2015, 2015.
Budisulistiorini, S. H., Canagaratna, M. R., Croteau, P. L., Baumann, K., Edgerton, E. S., Kollman, M. S., Ng, N. L., Verma, V., Shaw, S. L., Knipping, E. M., Worsnop, D. R., Jayne, J. T., Weber, R. J., and Surratt, J. D.: Intercomparison of an Aerosol Chemical Speciation Monitor (ACSM) with ambient fine aerosol measurements in downtown Atlanta, Georgia, Atmos. Meas. Tech., 7, 1929–1941, https://doi.org/10.5194/amt-7-1929-2014, 2014.
Canagaratna, M. R., Jayne, J. T., Ghertner, D. A., Herndon, S., Shi, Q., Jimenez, J. L., Silva, P. J., Williams, P., Lanni, T., Drewnick, F., Demerjian, K. L., Kolb, C. E., and Worsnop, D. R.: Chase studies of particulate emissions from in-use New York City vehicles, Aerosol Sci. Technol., 38, 555–573, https://doi.org/10.1080/02786820490465504, 2004.
Canagaratna, M. R., Jayne, J. T., Jimenez, J. L., Allan, J. D., Alfarra, M. R., Zhang, Q., Onasch, T. B., Drewnick, F., Coe, H., and Middlebrook, A.: Chemical and microphysical characterization of ambient aerosols with the aerodyne aerosol mass spectrometer, Mass Spectrom. Rev., 26, 185–222, 2007.
Canagaratna, M. R., Jimenez, J. L., Kroll, J. H., Chen, Q., Kessler, S. H., Massoli, P., Hildebrandt Ruiz, L., Fortner, E., Williams, L. R., Wilson, K. R., Surratt, J. D., Donahue, N. M., Jayne, J. T., and Worsnop, D. R.: Elemental ratio measurements of organic compounds using aerosol mass spectrometry: characterization, improved calibration, and implications, Atmos. Chem. Phys., 15, 253–272, https://doi.org/10.5194/acp-15-253-2015, 2015.
Chen, Q., Farmer, D. K., Rizzo, L. V., Pauliquevis, T., Kuwata, M., Karl, T. G., Guenther, A., Allan, J. D., Coe, H., Andreae, M. O., Pöschl, U., Jimenez, J. L., Artaxo, P., and Martin, S. T.: Submicron particle mass concentrations and sources in the Amazonian wet season (AMAZE-08), Atmos. Chem. Phys., 15, 3687–3701, https://doi.org/10.5194/acp-15-3687-2015, 2015.
Chhabra, P. S., Flagan, R. C., and Seinfeld, J. H.: Elemental analysis of chamber organic aerosol using an aerodyne high-resolution aerosol mass spectrometer, Atmos. Chem. Phys., 10, 4111–4131, https://doi.org/10.5194/acp-10-4111-2010, 2010.
Crosier, J., Allan, J. D., Coe, H., Bower, K. N., Formenti, P., and Williams, P. I.: Chemical composition of summertime aerosol in the Po Valley (Italy), northern Adriatic and Black Sea, Q. J. Roy. Meteor. Soc., 133, 61–75, https://doi.org/10.1002/qj.88, 2007.
Cubison, M. J., Ortega, A. M., Hayes, P. L., Farmer, D. K., Day, D., Lechner, M. J., Brune, W. H., Apel, E., Diskin, G. S., Fisher, J. A., Fuelberg, H. E., Hecobian, A., Knapp, D. J., Mikoviny, T., Riemer, D., Sachse, G. W., Sessions, W., Weber, R. J., Weinheimer, A. J., Wisthaler, A., and Jimenez, J. L.: Effects of aging on organic aerosol from open biomass burning smoke in aircraft and laboratory studies, Atmos. Chem. Phys., 11, 12049–12064, https://doi.org/10.5194/acp-11-12049-2011, 2011.
Decarlo, P. F., Kimmel, J. R., Trimborn, A., Northway, M. J., Jayne, J. T., Aiken, A. C., Gonin, M., Fuhrer, K., Horvath, T., and Docherty, K. S.: Field-deployable, high-resolution, time-of-flight aerosol mass spectrometer, Anal. Chem., 78, 8281–8289, 2006.
Docherty, K. S., Stone, E. A., Ulbrich, I. M., DeCarlo, P. F., Snyder, D. C., Schauer, J. J., Peltier, R. E., Weber, R. J., Murphy, S. M., Seinfeld, J. H., Grover, B. D., Eatough, D. J., and Jimenez, J. L.: Apportionment of primary and secondary organic aerosols in southern california during the 2005 study of organic aerosols in Riverside (SOAR-1), Environ. Sci. Technol., 42, 7655–7662, https://doi.org/10.1021/es8008166, 2008.
Drewnick, F., Diesch, J.-M., Faber, P., and Borrmann, S.: Aerosol mass spectrometry: particle–vaporizer interactions and their consequences for the measurements, Atmos. Meas. Tech., 8, 3811–3830, https://doi.org/10.5194/amt-8-3811-2015, 2015.
Dzepina, K., Arey, J., Marr, L. C., Worsnop, D. R., Salcedo, D., Zhang, Q., Onasch, T. B., Molina, L. T., Molina, M. J., and Jimenez, J. L.: Detection of particle-phase polycyclic aromatic hydrocarbons in Mexico City using an aerosol mass spectrometer, Int. J. Mass Spectrom., 263, 152–170, https://doi.org/10.1016/j.ijms.2007.01.010, 2007.
Elser, M., Huang, R.-J., Wolf, R., Slowik, J. G., Wang, Q., Canonaco, F., Li, G., Bozzetti, C., Daellenbach, K. R., Huang, Y., Zhang, R., Li, Z., Cao, J., Baltensperger, U., El-Haddad, I., and Prévôt, A. S. H.: New insights into PM2.5 chemical composition and sources in two major cities in China during extreme haze events using aerosol mass spectrometry, Atmos. Chem. Phys., 16, 3207–3225, https://doi.org/10.5194/acp-16-3207-2016, 2016.
Farmer, D. K., Matsunaga, A., Docherty, K. S., Surratt, J. D., Seinfeld, J. H., Ziemann, P. J., and Jimenez, J. L.: Response of an aerosol mass spectrometer to organonitrates and organosulfates and implications for atmospheric chemistry, P. Natl. Acad. Sci. USA, 107, 6670–6675, https://doi.org/10.1073/pnas.0912340107, 2010.
Fröhlich, R., Cubison, M. J., Slowik, J. G., Bukowiecki, N., Prévôt, A. S. H., Baltensperger, U., Schneider, J., Kimmel, J. R., Gonin, M., Rohner, U., Worsnop, D. R., and Jayne, J. T.: The ToF-ACSM: a portable aerosol chemical speciation monitor with TOFMS detection, Atmos. Meas. Tech., 6, 3225–3241, https://doi.org/10.5194/amt-6-3225-2013, 2013.
Fry, J. L., Kiendler-Scharr, A., Rollins, A. W., Wooldridge, P. J., Brown, S. S., Fuchs, H., Dubé, W., Mensah, A., dal Maso, M., Tillmann, R., Dorn, H.-P., Brauers, T., and Cohen, R. C.: Organic nitrate and secondary organic aerosol yield from NO3 oxidation of β-pinene evaluated using a gas-phase kinetics/aerosol partitioning model, Atmos. Chem. Phys., 9, 1431–1449, https://doi.org/10.5194/acp-9-1431-2009, 2009.
Ge, X. L., Zhang, Q., Sun, Y. L., Ruehl, C. R., and Setyan, A.: Effect of aqueous-phase processing on aerosol chemistry and size distributions in Fresno, California, during wintertime, Environ. Chem., 9, 221–235, https://doi.org/10.1071/en11168, 2012.
He, L.-Y., Lin, Y., Huang, X.-F., Guo, S., Xue, L., Su, Q., Hu, M., Luan, S.-J., and Zhang, Y.-H.: Characterization of high-resolution aerosol mass spectra of primary organic aerosol emissions from Chinese cooking and biomass burning, Atmos. Chem. Phys., 10, 11535–11543, https://doi.org/10.5194/acp-10-11535-2010, 2010.
Hu, W. W., Campuzano-Jost, P., Palm, B. B., Day, D. A., Ortega, A. M., Hayes, P. L., Krechmer, J. E., Chen, Q., Kuwata, M., Liu, Y. J., de Sá, S. S., McKinney, K., Martin, S. T., Hu, M., Budisulistiorini, S. H., Riva, M., Surratt, J. D., St. Clair, J. M., Isaacman-Van Wertz, G., Yee, L. D., Goldstein, A. H., Carbone, S., Brito, J., Artaxo, P., de Gouw, J. A., Koss, A., Wisthaler, A., Mikoviny, T., Karl, T., Kaser, L., Jud, W., Hansel, A., Docherty, K. S., Alexander, M. L., Robinson, N. H., Coe, H., Allan, J. D., Canagaratna, M. R., Paulot, F., and Jimenez, J. L.: Characterization of a real-time tracer for isoprene epoxydiols-derived secondary organic aerosol (IEPOX-SOA) from aerosol mass spectrometer measurements, Atmos. Chem. Phys., 15, 11807–11833, https://doi.org/10.5194/acp-15-11807-2015, 2015.
Hu, W. W., Hu, M., Hu, W., Jimenez, J. L., Yuan, B., Chen, W. T., Wang, M., Wu, Y. S., Chen, C., Wang, Z. B., Peng, J. F., Zeng, L. M., and Shao, M.: Chemical composition, sources, and aging process of submicron aerosols in Beijing: Contrast between summer and winter, J. Geophys. Res.-Atmos., 121, 1955–1977, https://doi.org/10.1002/2015jd024020, 2016.
Hu, W. W., Campuzano-Jost, P., Day, D. A., Croteau, P., Canagaratna, M. R., Jayne, J. T., Worsnop, D. R., and Jimenez, J. L.: Evaluation of the new capture vapourizer for aerosol mass spectrometers (AMS) through laboratory studies of inorganic species, Atmos. Meas. Tech., 10, 2897–2921, https://doi.org/10.5194/amt-10-2897-2017, 2017a.
Hu, W. W., Campuzano-Jost, P., Day, D. A., Croteau, P., Canagaratna, M. R., Jayne, J. T., Worsnop, D. R., and Jimenez, J. L.: Evaluation of the new capture vaporizer for aerosol mass spectrometers (AMS) through field studies of inorganic species, Aerosol Sci. Technol., 51, 735–754, https://doi.org/10.1080/02786826.2017.1296104, 2017b.
Hu, W. W., Day, D. A., Campuzano-Jost, P., Nault, B. A., Park, T., Lee, T., Croteau, P., Canagaratna, M. R., Jayne, J. T., Worsnop, D. R., and Jimenez, J. L.: Evaluation of the new capture vaporizer for aerosol mass spectrometers: Characterization of organic aerosol mass spectra, Aerosol Sci. Technol., 52, 725–739, https://doi.org/10.1080/02786826.2018.1454584, 2018a.
Hu, W. W., Day, D. A., Campuzano-Jost, P., Nault, B. A., Park, T., Lee, T., Croteau, P. L., Canagaratna, M. R., Jayne, J. T., Worsnop, D. R., and Jimenez, J. L.: Evaluation of the new capture vaporizer for aerosol mass spectrometers (AMS): Elemental composition and source apportionment of organic aerosols (OA), ACS Earth and Space Chemistry, 2, 410–421, https://doi.org/10.1021/acsearthspacechem.8b00002, 2018b.
Huang, G. C., Liu, Y., Shao, M., Li, Y., Chen, Q., Zheng, Y., Wu, Z. J., Liu, Y. C., Wu, Y. S., Hu, M., Li, X., Lu, S. H., Wang, C. J., Liu, J. Y., Zheng, M., and Zhu, T.: Potentially important contribution of gas-phase oxidation of naphthalene and methylnaphthalene to secondary organic aerosol during haze events in Beijing, Environ. Sci. Technol., 53, 1235–1244, https://doi.org/10.1021/acs.est.8b04523, 2019.
Huang, X.-F., He, L.-Y., Hu, M., Canagaratna, M. R., Kroll, J. H., Ng, N. L., Zhang, Y.-H., Lin, Y., Xue, L., Sun, T.-L., Liu, X.-G., Shao, M., Jayne, J. T., and Worsnop, D. R.: Characterization of submicron aerosols at a rural site in Pearl River Delta of China using an Aerodyne High-Resolution Aerosol Mass Spectrometer, Atmos. Chem. Phys., 11, 1865–1877, https://doi.org/10.5194/acp-11-1865-2011, 2011.
Jimenez, J. L., Jayne, J. T., Shi, Q., Kolb, C. E., Worsnop, D. R., Yourshaw, I., Seinfeld, J. H., Flagan, R. C., Zhang, X., and Smith, K. A.: Ambient aerosol sampling using the Aerodyne aerosol mass spectrometer, J. Geophys. Res., 108, 447–457, 2003.
Jimenez, J. L., Canagaratna, M. R., Donahue, N. M., Prevot, A. S. H., Zhang, Q., Kroll, J. H., DeCarlo, P. F., Allan, J. D., Coe, H., Ng, N. L., Aiken, A. C., Docherty, K. S., Ulbrich, I. M., Grieshop, A. P., Robinson, A. L., Duplissy, J., Smith, J. D., Wilson, K. R., Lanz, V. A., Hueglin, C., Sun, Y. L., Tian, J., Laaksonen, A., Raatikainen, T., Rautiainen, J., Vaattovaara, P., Ehn, M., Kulmala, M., Tomlinson, J. M., Collins, D. R., Cubison, M. J., Dunlea, E. J., Huffman, J. A., Onasch, T. B., Alfarra, M. R., Williams, P. I., Bower, K., Kondo, Y., Schneider, J., Drewnick, F., Borrmann, S., Weimer, S., Demerjian, K., Salcedo, D., Cottrell, L., Griffin, R., Takami, A., Miyoshi, T., Hatakeyama, S., Shimono, A., Sun, J. Y., Zhang, Y. M., Dzepina, K., Kimmel, J. R., Sueper, D., Jayne, J. T., Herndon, S. C., Trimborn, A. M., Williams, L. R., Wood, E. C., Middlebrook, A. M., Kolb, C. E., Baltensperger, U., and Worsnop, D. R.: Evolution of organic aerosols in the atmosphere, Science, 326, 1525–1529, https://doi.org/10.1126/science.1180353, 2009.
Kroll, J. H., Smith, J. D., Che, D. L., Kessler, S. H., Worsnop, D. R., and Wilson, K. R.: Measurement of fragmentation and functionalization pathways in the heterogeneous oxidation of oxidized organic aerosol, Phys. Chem. Chem. Phys., 11, 8005–8014, https://doi.org/10.1039/b905289e, 2009.
Kroll, J. H., Donahue, N. M., Jimenez, J. L., Kessler, S. H., Canagaratna, M. R., Wilson, K. R., Altieri, K. E., Mazzoleni, L. R., Wozniak, A. S., Bluhm, H., Mysak, E. R., Smith, J. D., Kolb, C. E., and Worsnop, D. R.: Carbon oxidation state as a metric for describing the chemistry of atmospheric organic aerosol, Nat. Chem., 3, 133–139, https://doi.org/10.1038/nchem.948, 2011.
Lambe, A., Massoli, P., Zhang, X., Canagaratna, M., Nowak, J., Daube, C., Yan, C., Nie, W., Onasch, T., Jayne, J., Kolb, C., Davidovits, P., Worsnop, D., and Brune, W.: Controlled nitric oxide production via O(1D) + N2O reactions for use in oxidation flow reactor studies, Atmos. Meas. Tech., 10, 2283–2298, https://doi.org/10.5194/amt-10-2283-2017, 2017.
Lanz, V. A., Alfarra, M. R., Baltensperger, U., Buchmann, B., Hueglin, C., and Prévôt, A. S. H.: Source apportionment of submicron organic aerosols at an urban site by factor analytical modelling of aerosol mass spectra, Atmos. Chem. Phys., 7, 1503–1522, https://doi.org/10.5194/acp-7-1503-2007, 2007.
Li, L. J., Qi, L., and Cocker, D. R.: Contribution of methyl group to secondary organic aerosol formation from aromatic hydrocarbon photooxidation, Atmos. Environ., 151, 133–139, https://doi.org/10.1016/j.atmosenv.2016.11.064, 2017.
Lin, C. S., Ceburnis, D., Hellebust, S., Buckley, P., Wenger, J., Canonaco, F., Prevot, A. S. H., Huang, R. J., O'Dowd, C., and Ovadnevaite, J.: Characterization of primary organic aerosol from domestic wood, peat, and coal burning in Ireland, Environ. Sci. Technol., 51, 10624–10632, https://doi.org/10.1021/acs.est.7b01926, 2017.
Liu, P. S. K., Deng, R., Smith, K. A., Williams, L. R., Jayne, J. T., Canagaratna, M. R., Moore, K., Onasch, T. B., Worsnop, D. R., and Deshler, T.: Transmission efficiency of an aerodynamic focusing lens system: Comparison of model calculations and laboratory measurements for the Aerodyne aerosol mass spectrometer, Aerosol Sci. Technol., 41, 721–733, https://doi.org/10.1080/02786820701422278, 2007.
Matthew, B. M., Middlebrook, A. M., and Onasch, T. B.: Collection efficiencies in an Aerodyne aerosol mass spectrometer as a function of particle phase for laboratory generated aerosols, Aerosol Sci. Technol., 42, 884–898, https://doi.org/10.1080/02786820802356797, 2008.
Middlebrook, A. M., Bahreini, R., Jimenez, J. L., and Canagaratna, M. R.: Evaluation of composition-dependent collection efficiencies for the Aerodyne aerosol mass spectrometer using field data, Aerosol Sci. Technol., 46, 258–271, 2012.
Mohr, C., Huffman, J. A., Cubison, M. J., Aiken, A. C., Docherty, K. S., Kimmel, J. R., Ulbrich, I. M., Hannigan, M., and Jimenez, J. L.: Characterization of primary organic aerosol emissions from meat cooking, trash burning, and motor vehicles with high-resolution aerosol mass spectrometry and comparison with ambient and chamber observations, Environ. Sci. Technol., 43, 2443–2449, https://doi.org/10.1021/es8011518, 2009.
Ng, N. L., Herndon, S. C., Trimborn, A., Canagaratna, M. R., Croteau, P., Onasch, T. B., Sueper, D., Worsnop, D. R., and Jayne, J. T.: An aerosol chemical speciation monitor (ACSM) for routine monitoring of the composition and mass concentrations of ambient aerosol, Aerosol Sci. Technol., 45, 780–794, 2011.
Orsavova, J., Misurcova, L., Ambrozova, J., Vicha, R., and Mlcek, J.: Fatty acids composition of vegetable oils and its contribution to dietary energy intake and dependence of cardiovascular mortality on dietary intake of fatty acids, Int. J. Mol. Sci., 16, 12871–12890, https://doi.org/10.3390/ijms160612871, 2015.
Paatero, P. and Tapper, U.: Positive matrix factorization – a nonnegative factor model with optimal utilization of error-estimates of data values, Environmetrics, 5, 111–126, https://doi.org/10.1002/env.3170050203, 1994.
Phillips, D. H.: Polycyclic aromatic hydrocarbons in the diet, Mutat. Res. Genet. Tox. En., 443, 139–147, https://doi.org/10.1016/s1383-5742(99)00016-2, 1999.
Reyes-Villegas, E., Bannan, T., Le Breton, M., Mehra, A., Priestley, M., Percival, C., Coe, H., and Allan, J. D.: Online chemical characterization of food-cooking organic aerosols: implications for source apportionment, Environ. Sci. Technol., 52, 5308–5318, https://doi.org/10.1021/acs.est.7b06278, 2018.
Robinson, N. H., Hamilton, J. F., Allan, J. D., Langford, B., Oram, D. E., Chen, Q., Docherty, K., Farmer, D. K., Jimenez, J. L., Ward, M. W., Hewitt, C. N., Barley, M. H., Jenkin, M. E., Rickard, A. R., Martin, S. T., McFiggans, G., and Coe, H.: Evidence for a significant proportion of Secondary Organic Aerosol from isoprene above a maritime tropical forest, Atmos. Chem. Phys., 11, 1039–1050, https://doi.org/10.5194/acp-11-1039-2011, 2011.
Schneider, J., Weimer, S., Drewnick, F., Borrmann, S., Helas, G., Gwaze, P., Schmid, O., Andreae, M. O., and Kirchner, U.: Mass spectrometric analysis and aerodynamic properties of various types of combustion-related aerosol particles, Int. J. Mass Spectrom., 258, 37–49, https://doi.org/10.1016/j.ijms.2006.07.008, 2006.
Schneider, J., Freutel, F., Zorn, S. R., Chen, Q., Farmer, D. K., Jimenez, J. L., Martin, S. T., Artaxo, P., Wiedensohler, A., and Borrmann, S.: Mass-spectrometric identification of primary biological particle markers and application to pristine submicron aerosol measurements in Amazonia, Atmos. Chem. Phys., 11, 11415–11429, https://doi.org/10.5194/acp-11-11415-2011, 2011.
Sun, Y. L., Zhang, Q., Schwab, J. J., Demerjian, K. L., Chen, W.-N., Bae, M.-S., Hung, H.-M., Hogrefe, O., Frank, B., Rattigan, O. V., and Lin, Y.-C.: Characterization of the sources and processes of organic and inorganic aerosols in New York city with a high-resolution time-of-flight aerosol mass apectrometer, Atmos. Chem. Phys., 11, 1581–1602, https://doi.org/10.5194/acp-11-1581-2011, 2011.
Sun, Y. L., Wang, Z. F., Fu, P. Q., Yang, T., Jiang, Q., Dong, H. B., Li, J., and Jia, J. J.: Aerosol composition, sources and processes during wintertime in Beijing, China, Atmos. Chem. Phys., 13, 4577–4592, https://doi.org/10.5194/acp-13-4577-2013, 2013.
Sun, Y. L., Jiang, Q., Wang, Z. F., Fu, P. Q., Li, J., Yang, T., and Yin, Y.: Investigation of the sources and evolution processes of severe haze pollution in Beijing in January 2013, J. Geophys. Res.-Atmos., 119, 4380–4398, https://doi.org/10.1002/2014jd021641, 2014.
Sun, Y. L., Du, W., Fu, P., Wang, Q., Li, J., Ge, X., Zhang, Q., Zhu, C., Ren, L., Xu, W., Zhao, J., Han, T., Worsnop, D. R., and Wang, Z.: Primary and secondary aerosols in Beijing in winter: sources, variations and processes, Atmos. Chem. Phys., 16, 8309–8329, https://doi.org/10.5194/acp-16-8309-2016, 2016.
Tian, J., Chow, J. C., Cao, J. J., Han, Y., Ni, H. Y., Chen, L. W. A., Wang, X. L., Huang, R. J., Moosmuller, H., and Watson, J. G.: A biomass combustion chamber: design, evaluation, and a case study of wheat straw combustion emission tests, Aerosol Air Qual. Res., 15, 2104–2114, https://doi.org/10.4209/aaqr.2015.03.0167, 2015.
Tian, J., Ni, H. Y., Han, Y. M., Shen, Z. X., Wang, Q. Y., Long, X., Zhang, Y., and Cao, J. J.: Primary PM2.5 and trace gas emissions from residential coal combustion: assessing semi-coke briquette for emission reduction in the Beijing-Tianjin-Hebei region, China, Atmos. Environ., 191, 378–386, https://doi.org/10.1016/j.atmosenv.2018.07.031, 2018.
Ulbrich, I. M., Canagaratna, M. R., Zhang, Q., Worsnop, D. R., and Jimenez, J. L.: Interpretation of organic components from Positive Matrix Factorization of aerosol mass spectrometric data, Atmos. Chem. Phys., 9, 2891–2918, https://doi.org/10.5194/acp-9-2891-2009, 2009.
Weimer, S., Alfarra, M. R., Schreiber, D., Mohr, M., Prevot, A. S. H., and Baltensperger, U.: Organic aerosol mass spectral signatures from wood-burning emissions: influence of burning conditions and wood type, J. Geophys. Res.-Atmos., 113, D10304, https://doi.org/10.1029/2007jd009309, 2008.
Xu, W., Croteau, P., Williams, L., Canagaratna, M., Onasch, T., Cross, E., Zhang, X., Robinson, W., Worsnop, D., and Jayne, J.: Laboratory characterization of an aerosol chemical speciation monitor with PM2.5 measurement capability, Aerosol Sci. Technol., 51, 69–83, https://doi.org/10.1080/02786826.2016.1241859, 2017.
Xu, W., Lambe, A., Silva, P., Hu, W. W., Onasch, T., Williams, L., Croteau, P., Zhang, X., Renbaum-Wolff, L., Fortner, E., Jimenez, J. L., Jayne, J., Worsnop, D., and Canagaratna, M.: Laboratory evaluation of species-dependent relative ionization efficiencies in the Aerodyne Aerosol Mass Spectrometer, Aerosol Sci. Technol., 52, 626–641, https://doi.org/10.1080/02786826.2018.1439570, 2018.
Zhang, Q., Alfarra, M. R., Worsnop, D. R., Allan, J. D., Coe, H., Canagaratna, M. R., and Jimenez, J. L.: Deconvolution and quantification of hydrocarbon-like and oxygenated organic aerosols based on aerosol mass spectrometry, Environ. Sci. Technol., 39, 4938–4952, 2005.
Zhang, Q., Jimenez, J. L., Canagaratna, M. R., Ulbrich, I. M., Ng, N. L., Worsnop, D. R., and Sun, Y.: Understanding atmospheric organic aerosols via factor analysis of aerosol mass spectrometry: a review, Anal. Bioanal. Chem., 401, 3045–3067, 2011.