the Creative Commons Attribution 4.0 License.
the Creative Commons Attribution 4.0 License.
 | 15 Jan 2021
On the calibration of FIGAERO-ToF-CIMS: importance and impact of calibrant delivery for the particle-phase calibration
Luis M. F. Barreira
Iida Pullinen
Angela Buchholz
John Jayne
Jordan E. Krechmer
Douglas R. Worsnop
Annele Virtanen
Siegfried Schobesberger
The Filter Inlet for Gases and AEROsols (FIGAERO) coupled with a time-of-flight chemical ionization mass spectrometer (ToF-CIMS) enables online measurements of both gas-phase and particle-phase chemical constituents of ambient aerosols. When properly calibrated, the incorporated particle filter collection and subsequent thermal desorption enable the direct measurement of volatility of said constituents. Previously published volatility calibration results however differ from each other significantly. In this study we investigate the reason for this discrepancy. We found a major source of error in the widely used syringe deposition calibration method that can lead to an overestimation of saturation vapour pressures by several orders of magnitude. We propose a new method for volatility calibration by using atomized calibration compounds that more accurately captures the evaporation of chemical constituents from ambient aerosol particles. For example, we found a difference of ∼ 15 ∘C in observed Tmax values between the atomizer method and syringe method using the lowest solution concentration (0.003 g L−1). This difference translates into a difference of up to 3 orders of magnitude in saturation concentration C∗ space. We justify our claim with evaporation modelling and direct scanning electron microscopy imaging, while also presenting possible error sources of the atomizer method. We finally present how typical calibration parameters derived with both methods impact the volatility basis set (VBS) derived from measurements of secondary organic aerosols (SOAs).
- Article
(4144 KB) - Full-text XML
-
Supplement
(508 KB) - BibTeX
- EndNote


Organic aerosol (OA) has received substantial attention during the past decades due to its large fraction of the total atmospheric aerosol mass around the globe (Hallquist et al., 2009; Jimenez et al., 2009). The tendency of the organic matter to stay in the particles or evaporate is dictated by the volatility of the OA constituents. This information is also critical for atmospheric models for accurate treatment of secondary organic aerosols (SOAs) in these models (Sporre et al., 2020). During the past years, several techniques have been developed to measure the physicochemical properties of the OA, including volatility. A major class of these techniques relies on heating the aerosol particles followed by compositional analysis of the evaporating molecules by mass spectrometers. Examples of these techniques are the volatility tandem differential mobility analyser (VTDMA; Hong et al., 2017), thermal-desorption chemical ionization mass spectrometer (TD-CIMS; Smith et al., 2004), the micro-orifice volatilization impactor coupled to a chemical ionization mass spectrometer (MOVI-CIMS; Yatavelli and Thornton, 2010) and the chemical analysis of aerosols online – proton-transfer-reaction mass spectrometer (CHARON – PTR-MS; Eichler et al., 2015). Another technique, which has gained popularity, is the Filter Inlet for Gases and AEROsols (FIGAERO) coupled with time-of-flight chemical ionization mass spectrometer (ToF-CIMS). Originally introduced by Lopez-Hilfiker et al. (2014), this technique has been employed in numerous field and laboratory studies (e.g. D'Ambro et al., 2017; Breton et al., 2018; Isaacman-Vanwertz et al., 2018; Riva et al., 2019; Mohr et al., 2019; Stolzenburg et al., 2018). The FIGAERO inlet enables semi-continuous gas-phase and particle-phase measurements of aerosol. The latter is done via filter collection followed by heating of the collected aerosol particles and simultaneous sampling of desorbing compounds, which can be identified and quantified by the ToF-CIMS. It also enables extraction of volatility information of the particle phase through the investigation of thermograms: the measured signal as a function of linearly ramped desorption temperature. In particular, the temperature of peak signal (Tmax) has turned out to be a useful measure (see Sect. 2.5 for details, Lopez-Hilfiker et al., 2014; Stark et al., 2017; Bannan et al., 2019; Joo et al., 2019; Nah et al., 2019; Ye et al., 2019; Wang et al., 2020). When accurately calibrated, these measured Tmax values can be directly related to saturation vapour pressure values (Psat) and used to estimate the volatility of the chemical constituents in the aerosol particles (Lopez-Hilfiker et al., 2014). However, only a considerably small number of studies have taken advantage of this possibility and have reported the calibration procedures used for quantifying the relationship between Tmax and Psat. Figure 1 reproduces the published calibration results known to us, for a direct comparison. It illustrates remarkable discrepancies between individual calibration results. One issue here is that Psat values used in the calibration fits, either literature-based or model-derived, vary significantly between studies (by up to 4 orders of magnitude for the same compound; see Table S1 in the Supplement). These discrepancies stem in part from notorious difficulties in measuring and estimating the saturation vapour pressure of low-volatility compounds. Bannan et al. (2019) proposed a solution to this problem by using series of polyethylene glycol (PEG) compounds, which showed good agreement of measured Psat values between different experimental methods (Krieger et al., 2018). Other issues may arise from differences in the exact calibration methods. All calibration lines shown in Fig. 1 have been produced by depositing known amounts of calibration compounds in solution on the FIGAERO filter using a micro syringe (later referred to as the syringe method). However, there is a remarkable wide variation in the level of detail at which published calibrations have been described; specifically, in terms of used solvent, solution concentrations and amount of material deposited onto the filter.
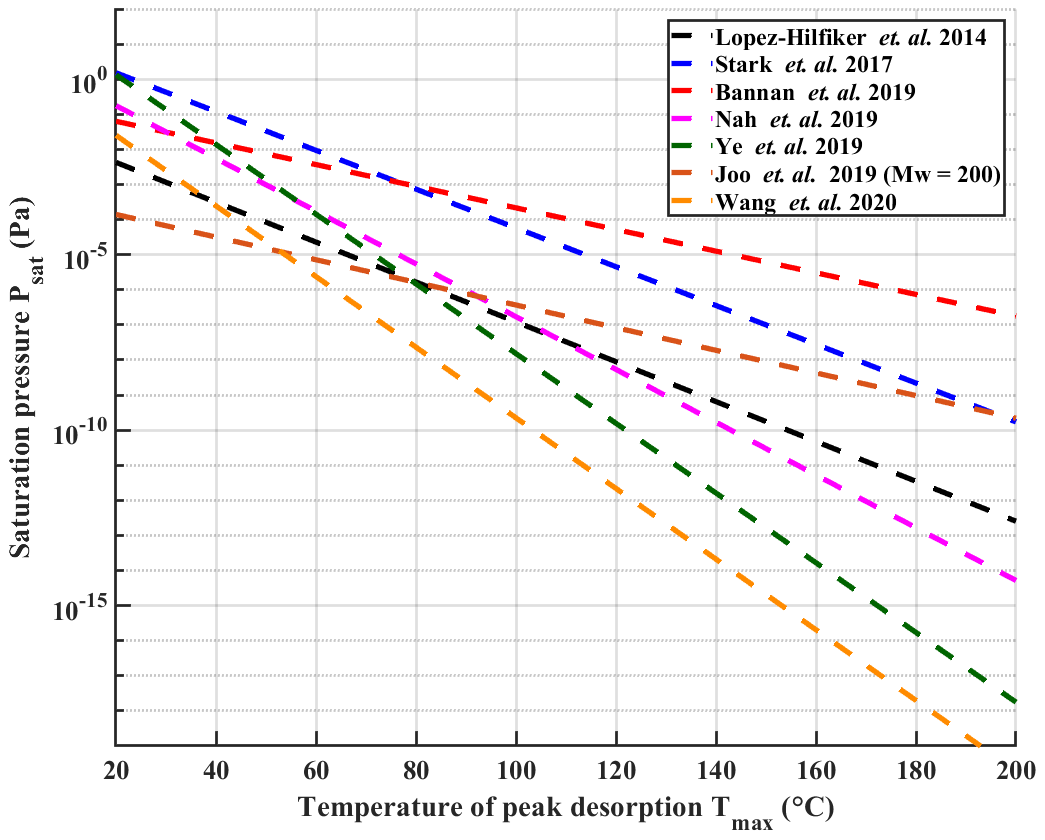
Figure 1Previously reported calibration measurements with temperature at peak desorption (Tmax) plotted against saturation pressure Psat. The Joo et al. (2019) line has been converted from saturation concentration values to saturation pressure assuming a molar mass of 200. All lines except Joo et al. (2019) are also refitted from literature data using the fitting routine described in Sect. 2.5. It is notable that in most cases the data points used for the fitting do not reach Tmax values higher than 120 ∘C, which is likely partially responsible for the large divergence of results when extrapolating to higher Tmax. Error bars of the fits are omitted for sake of clarity.
In this study we investigated the possible reasons for the large discrepancies between many reported calibration lines (Fig. 1). We repeated the calibration measurements described in Bannan et al. (2019) with PEG (4–8) compounds and a set of carboxylic acids, and we probed the effect of different solution concentrations on the calibration results. As the FIGAERO inlet itself is initially designed to study aerosol particles, we further conducted calibration experiments via atomizing the calibration compounds (later referred to as the atomizer method) and found remarkable differences compared to the experiments performed via micro syringe depositions. Furthermore, as several studies performed with FIGAERO-ToF-CIMS also use the syringe method to calibrate for the sensitivity of the instrument (Liu et al., 2016; Breton et al., 2019), we also compared the two previously mentioned methods in terms of sensitivity calibrations. We furthermore investigated potential impacts of different heating ramp rates and aerosol particle sizes to results using the atomizer method. In light of our results, with further support from evaporation modelling and direct scanning electron microscopic (SEM) measurements, we propose that the atomizer method should from now on be used for calibrating the FIGAERO-ToF-CIMS volatility range.
2.1 FIGAERO-ToF-CIMS
The operation of the FIGAERO inlet is thoroughly explained in previous publications, with the original inlet design described in Lopez-Hilfiker et al. (2014) and a commercialized design by Aerodyne Research, Inc. described in Bannan et al. (2019). In short, the FIGAERO inlet enables measurements for both particle-phase and gas-phase constituents using two separate pin holes leading into the mass spectrometer. While the gas phase is sampled through one pin hole, the other is kept closed and aerosol particles are simultaneously sampled onto a PTFE filter (Zefluor, Pall Corp. 2 µm pore size). After sufficient particle mass has been collected onto the filter, the filter is moved in front of the second pin hole and the gas-phase pin hole is blocked. Chemical constituents are then evaporated from the filter into the mass analyser by a nitrogen flow that is gradually heated, ramping at a constant rate from room temperature to 200 ∘C, as measured just above the filter. The rate of the heating ramp is adjustable, and for this study, we used heating rates of 11.4 and 6.3 K min−1 corresponding to ramping times of 15 and 30 min. In this study we used the commercial version produced by Aerodyne Research Inc. for the solution concentration and heating ramp rate experiments and a custom design with small deviations from the commercial version (different nitrogen flow heating system and smaller distance between the two pinholes) for the sensitivity and particle size experiments.
The ToF-CIMS (Tofwerk AG, Aerodyne Research, Inc.) was operated with an iodide-ionization scheme (Iyer et al., 2017; Lee et al., 2014) and at a mass resolution of 4000–5000. Iodide ions were generated by passing an ultrapure nitrogen flow of 1 slpm over a permeation tube containing methyl iodide (CH3I) and through a commercial Po-210 source (model P-2021, NRD Static Control LLC) into the ion molecule reaction (IMR) chamber of the instrument. The IMR chamber was operated at a pressure of 100 mbar which was actively controlled.
2.2 Sample preparation
In this study, polyethylene glycols (PEG, Polypure AS) and carboxylic acids were used as standards to test the effect of solution concentration on the results. Acetonitrile (ACN, Fisher Scientific 99.8 % purity) was chosen as a solvent for stock solutions since it does not react with any of the compounds used in the study, whereas for example methanol, the most commonly used solvent, was found to polymerize PEGs into higher-order polymers. The used PEG standards were PEG-4, PEG-5, PEG-6, PEG-7 and PEG-8. The used organic acids were pimelic acid (Sigma Aldrich, 98 % purity), azelaic acid (Sigma Aldrich, 98 % purity), sebacic acid (Sigma Aldrich, 99 % purity), palmitic acid (Sigma Aldrich, 99 % purity), oleic acid (Sigma Aldrich, 99 % purity) and stearic acid (Sigma Aldrich, 95 % purity). Both stock standard solutions of individual components and mixtures of studied analytes were prepared and tested.
2.3 Syringe deposition method
In the syringe deposition method, a known amount of the prepared standard solutions was deposited onto the FIGAERO filter via a microlitre syringe (10 µL, Hamilton Co.). To access the filter, the filter holder tray was pushed out from the body of the inlet until the filter was exposed. The amount of deposited calibration standards was calculated from the solution concentration and volume of deposited solution. After deposition, the solvent is assumed to quickly evaporate from the filter, leaving behind the less volatile calibrant analyte. An illustration of the method is shown in Fig. S1a in the Supplement). Solution concentrations for the syringe deposition method were 0.1, 0.01 and 0.003 g L−1 for the PEGs and 0.5, 0.1 and 0.01 g L−1 for the acids. The deposited volume of standard solution was 1 µL, which provided a sufficient calibrant mass on the filter to ensure a clear signal. The mass deposited varied between 9 and 500 ng, depending on the used concentration. For sensitivity calibrations, PEG-7 standard solutions (0.01 g L−1) were used. The deposited volume was 1–5 µL, which corresponded to a deposited mass of 10–50 ng.
2.4 Atomization method
In the atomization method, PEG standards were prepared in an initial concentration of ∼ 0.5 g L−1 each in a mixture in acetonitrile (see Sect. 2.2). For delivering the calibrants to the filter, the solution was then atomized with a commercial atomizer (TSI Aerosol generator model 3076). Atomized particles were passed through a dilution volume and were continuously monitored with a scanning mobility particle sizer (SMPS, TSI model 3082 platform coupled with a TSI model 3775 condensation particle counter, CPC). The dilution volume ensured that all solvent had completely evaporated from the particles before size measurement–classification and filter collection. We studied both polydisperse (mode diameter ∼ 60 nm) and monodisperse aerosol particles. Monodisperse particles were size selected from the polydisperse aerosol population with a differential mobility analyser (DMA). Schematics of the respective calibrant delivery setups are shown in Fig. S1b and c.
Before the actual filter collection, the particles were passed through the aerosol collection port of the FIGAERO inlet to maintain constant flow conditions in the setup while the collecting filter was in the desorption position and flushed with room air temperature nitrogen. When the particle concentration had stabilized, the filter was moved into the aerosol flow and the collection started. The amount of collected material was calculated based on particle size (determined by SMPS, assuming that all particles were spherical), CPC particle counts, collection time and flow rate through the filter.
As the solvent used in the atomization method actively flushed the walls of the atomizer, dissolving any dissolvable material from the walls to the solution, it was essential to thoroughly clean the atomizer before measurements. The atomizer was also periodically used with pure solvent and the output was monitored with SMPS to ensure that all measured particles consisted purely of calibration compounds.
During the atomization progress, the initial solution concentration slowly increases as part of the solvent evaporates inside the atomizer. However, this change of concentration only impacts the size distribution of the formed aerosol particles, which was continuously monitored. In the atomizer method measurements, collected mass loading on the filter ranged from 100 to 200 ng. Typical collection times ranged from 10 s (polydisperse sample) to a few minutes (monodisperse sample). For sensitivity calibrations performed with PEG-7, 100 nm particles with a similar mass loading range were used with an initial atomizer solution concentration of 0.5 g L−1. The measurement setup is shown in Fig. S1c.
2.5 Data analysis, Tmax determination and calibration line fitting
All ToF-CIMS data were pre-processed with Tofware (version 2.5.11 including FIGAERO plugin, Aerodyne Research, Inc.) running in the WaveMetrics Igor 7 programming environment and further postprocessed with custom MATLAB scripts (The MathWorks, Inc.).

Figure 2(a) Example for acquiring Tmax values from thermograms with fitted asymmetric lognormal function. (b) Fitting a line to the natural logarithm of literature-based saturation vapour pressures (Psat, in units of pascals) as a function of corresponding FIGAERO-derived Tmax values, while taking the uncertainties into account. With Psat, uncertainties are taken from the literature, and with Tmax the uncertainties are defined as the SD of three measurements. Fitting parameters of the line fit were and .
For obtaining Tmax values from the thermograms, the data was first smoothed by fitting an asymmetrical lognormal function across the peak of each thermogram. The assigned Tmax values corresponded to the maxima of these functions (Fig. 2a).
Obtained Tmax values were fitted against a natural logarithm of Psat literature values, which leads to a near-linear relationship:
where a and b are fitted parameters. Saturation vapour pressure values for any measured compound (Psat,meas) can then be estimated by
where is the measured Tmax of the compound. In the field of organic aerosol studies, it is customary to express volatility in terms of saturation concentration (C∗). Estimated saturation vapour pressures can be converted to saturation concentration following the ideal gas law:
where Mw is the molar mass of the compound (in units of grammes per mole) determined with the CIMS, R is the universal gas constant (8.314 ) and T is the temperature for which the original Psat,lit values were determined (in units of kelvin; typically, as in our case, for 298 K).
As both Psat,lit and can have significant uncertainties, an appropriate fitting method should be chosen that accounts for errors in both variables, and appropriate fitting uncertainties should be shown with the fitting results. In this study, we used the bivariate least-squares method (York et al., 2004) in Fig. 2b, which was implemented in MATLAB as shown in Pitkänen et al. (2016). When uncertainties were not available, as was the case with lines in Figs. 1 and S2 in the Supplement, the Deming regression was used. In these cases, fitting uncertainties are not shown for sake of clarity. For a thorough discussion of linear fitting methods while taking into account measurement uncertainties in both variables, see Mikkonen et al. (2019).
2.6 Evaporation model description
In this study, we also compare experimental results with the simulation results of a model that was designed to interpret FIGAERO-ToF-CIMS observations. The model is described in detail in Schobesberger et al. (2018). It simulates the molecule-wise evaporation of aerosol particles from the FIGAERO filter in a clean nitrogen flow, using a modified form of the Hertz–Knudsen equation. Accordingly, peak-shaped thermograms arise from the linearly ramped sample heating due to the fast increase in Psat (and C∗) with temperature (Clausius–Clapeyron relation). The model demonstrated how Tmax depends near linearly on log(Psat) as the enthalpy of vaporization generally increases with decreasing Psat, in agreement with observations (see Fig. 1). The model also allows for including interactions between desorbed vapours and instrument surfaces, which can lead to an increase in Tmax, as well as non-ideal heating, which broadens simulated thermograms and adds tailing, hence potentially better reproducing observed thermogram shapes.
2.7 Scanning electron microscope pictures
To gain information about the difference between atomizer collection and syringe deposition, we took scanning electron microscope (SEM) pictures of the FIGAERO filters with PEG deposited onto the filter with either method. The employed instrument consisted of a Sigma HD variable pressure field emission gun – SEM (VP FEG-SEM, Carl Zeiss NTS, Cambridge, UK) with a variable pressure secondary electron (VPSE) detector using an acceleration voltage of 15 kV. The pictures were taken in a 20 Pa nitrogen atmosphere. As SEM pictures are taken in very low pressures, we deposited only PEG-8 to the filter as it had the lowest vapour pressure of the used PEGs and was thus least likely to evaporate in the vacuum during the imaging.
For preparing the FIGAERO filters for the SEM when using the syringe method, we attached the filters to a horizontal sample holder using double sided carbon tape and deposited the volume in the middle of the filter in the same fashion as in the normal syringe method measurement, before moving the holder into the SEM vacuum chamber. For investigating deposition using the atomizer method, we collected 300 nm monodisperse particles into the filter for 20 min after which the filter was attached to an identical sample holder and moved into the SEM within 15 min after the collection.
3.1 Solution concentration effect
We examined a range of solution concentrations for the syringe deposition method, with both PEGs and carboxylic acids. PEGs were measured as individual solutions and as a mixture. Carboxylic acids were measured as a mixture. With PEGs, we did not observe a significant difference in Tmax values between mixture and individual solutions. Figure 3 shows a shift of measured Tmax to higher temperatures with increasing solution concentration, both for PEG compounds (Fig. 3a) and for carboxylic acids (Fig. 3b). The shown Tmax values are averages of three repetitions. Exact Tmax values with SDs are shown in Tables S2 and S3 in the Supplement. Psat values of carboxylic acids are shown in Table S1. Figure 3a also includes reported Tmax values from Bannan et al. (2019) as a reference, as they used PEG compounds with solution concentrations of ∼ 2 g L−1. Both panels also show the Tmax values we measured with the atomizer method, which yield the lowest Tmax values with both sets of compounds. For comparison, the used starting concentration of atomizer solution was 0.5 g L−1 per compound, which gradually increased as the solvent evaporated from the solution. This led to polydisperse log-normal aerosol population with a mode diameter of 50 nm. From this ∼ 200 ng of aerosol mass was sampled into the FIGAERO filter before desorption.
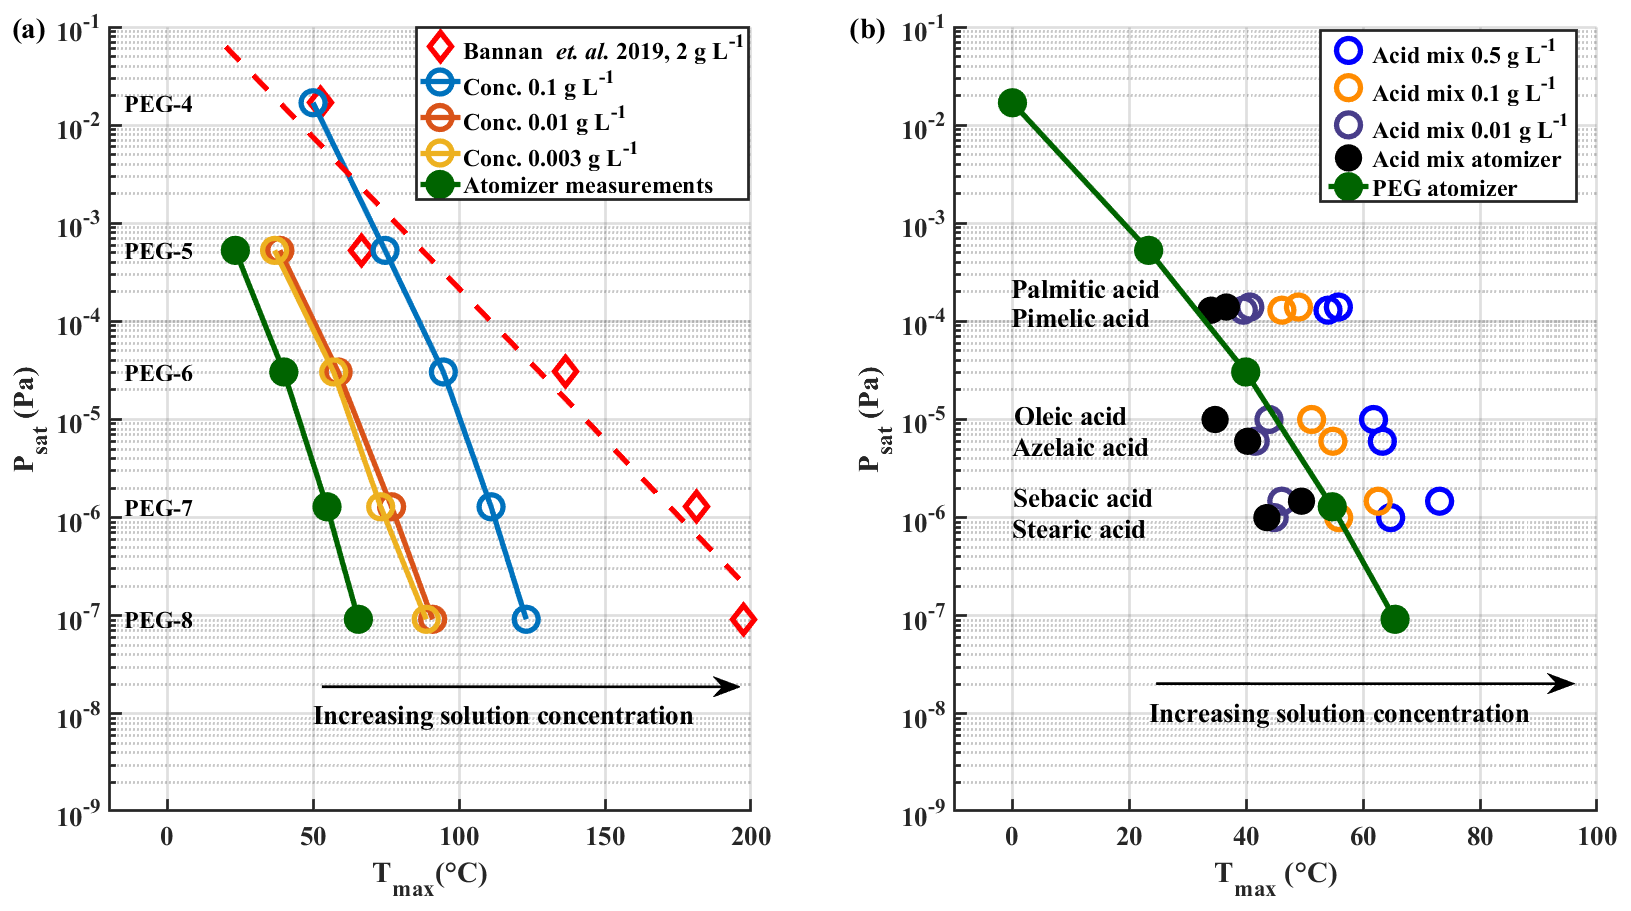
Figure 3Solution concentration effect. Literature-based saturation vapour pressure Psat values are plotted vs. measured Tmax for (a) PEG compounds and (b) carboxylic acids with a logarithmic y axis. Black arrows in both panels indicate the direction of shift in Tmax values as the solution concentration increases. PEG atomizer results are also included in panel (b) for reference.
The results shown in Fig. 3 clearly show a dependence of measured Tmax value on solution concentration deposited by syringe, with higher concentrations leading to higher Tmax, whereas the lowest Tmax values are measured when using the atomizer. Even though Tmax values from the lowest solution concentration of 0.003 g L−1 in PEG measurements approach the atomizer results, there is still a difference of ∼ 15 ∘C between the results. This difference would manifest in 1–2 orders of magnitude in difference in estimated saturation pressure. Note that PEG-4 was not visible in the mass spectrometer data for the atomizer and the lowest solution concentration measurements. We suspect that its evaporation from the filter and from the particles is so rapid in these cases that it has already evaporated before the start of the measurements, or, in other words, that its hypothetical Tmax lies below or too close to room temperature. This is in line with the relatively high vapour pressure of PEG-4. Its log 10(C∗) value of 3.12 groups it into the class of intermediate volatile organic compounds (IVOCs), as described by Donahue et al. (2012), which have been shown to readily evaporate from particles (Li et al., 2019; Yli-Juuti et al., 2017).
In Fig. S2 we show again previously reported calibration lines shown in Fig. 1, now updated with calibration lines acquired in this study with both the atomizer (solid green line) and the syringe method (conc. 0.1 g L−1, solid blue line). The area between the two solid lines encompasses almost all other reported calibration lines. It should be noted that even though the calibration lines extend all the way to 200 ∘C, Tmax values used for the fitting are below 120 ∘C in almost all the studies.
We were able to reproduce our measured Tmax values within 10 ∘C using the evaporation model to simulate the evaporation of mixed PEG 4–8 particles (for simplicity assuming equal mole fractions for all PEG). For PEG-5 and PEG-6, Fig. 4 shows excellent agreement between measured and modelled Tmax values for the atomizer method (within a couple of degrees Celsius), deteriorating to a difference of about 10 ∘C for PEG-8. This broad agreement here is remarkable in so far as in this case the model was run with no vapour–surface interactions, i.e. no tuning in regards to resulting Tmax, which are therefore a direct result of the input values for C∗ and ΔH. With increasing initial size of the modelled evaporating particle, the modelled Tmax shifts to higher values, due to the decreasing surface-to-volume ratio. By simply adjusting that size (Dp) to 1.3 and 11 µm diameter particles, respectively, the model indeed reproduced the Tmax values obtained with the syringe method for 0.01 and 0.1 g L−1 remarkably well.
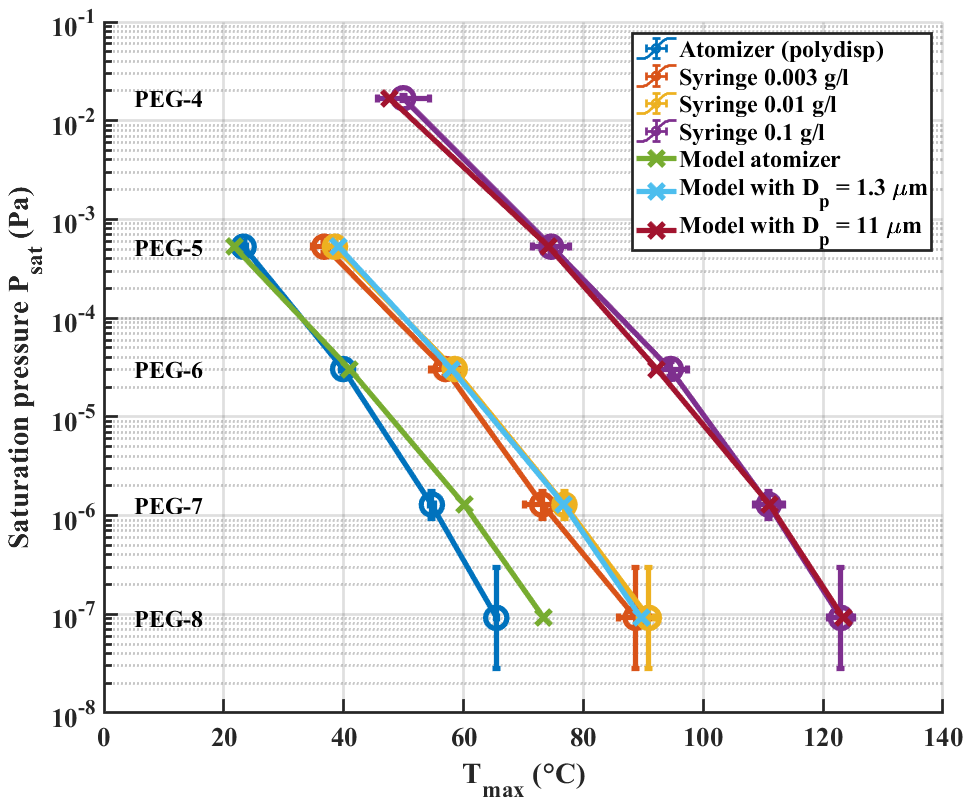
Figure 4Comparison of the solution concentration effect on PEG results with model results. Error bars in Tmax values are SDs of three repetitions.
3.2 Scanning electron microscope pictures
Figure 5c shows magnification of the filter shown in Fig. 5a. Figure 5d shows a magnification of the filter at the edge of the “PEG-8 ring” shown in Fig. 5b, showing how the PEG forms a layer on top and possibly also inside the filter. We emphasize that as SEM cannot distinguish deposited material situated inside the filter, the shown images should be considered qualitative evidence.
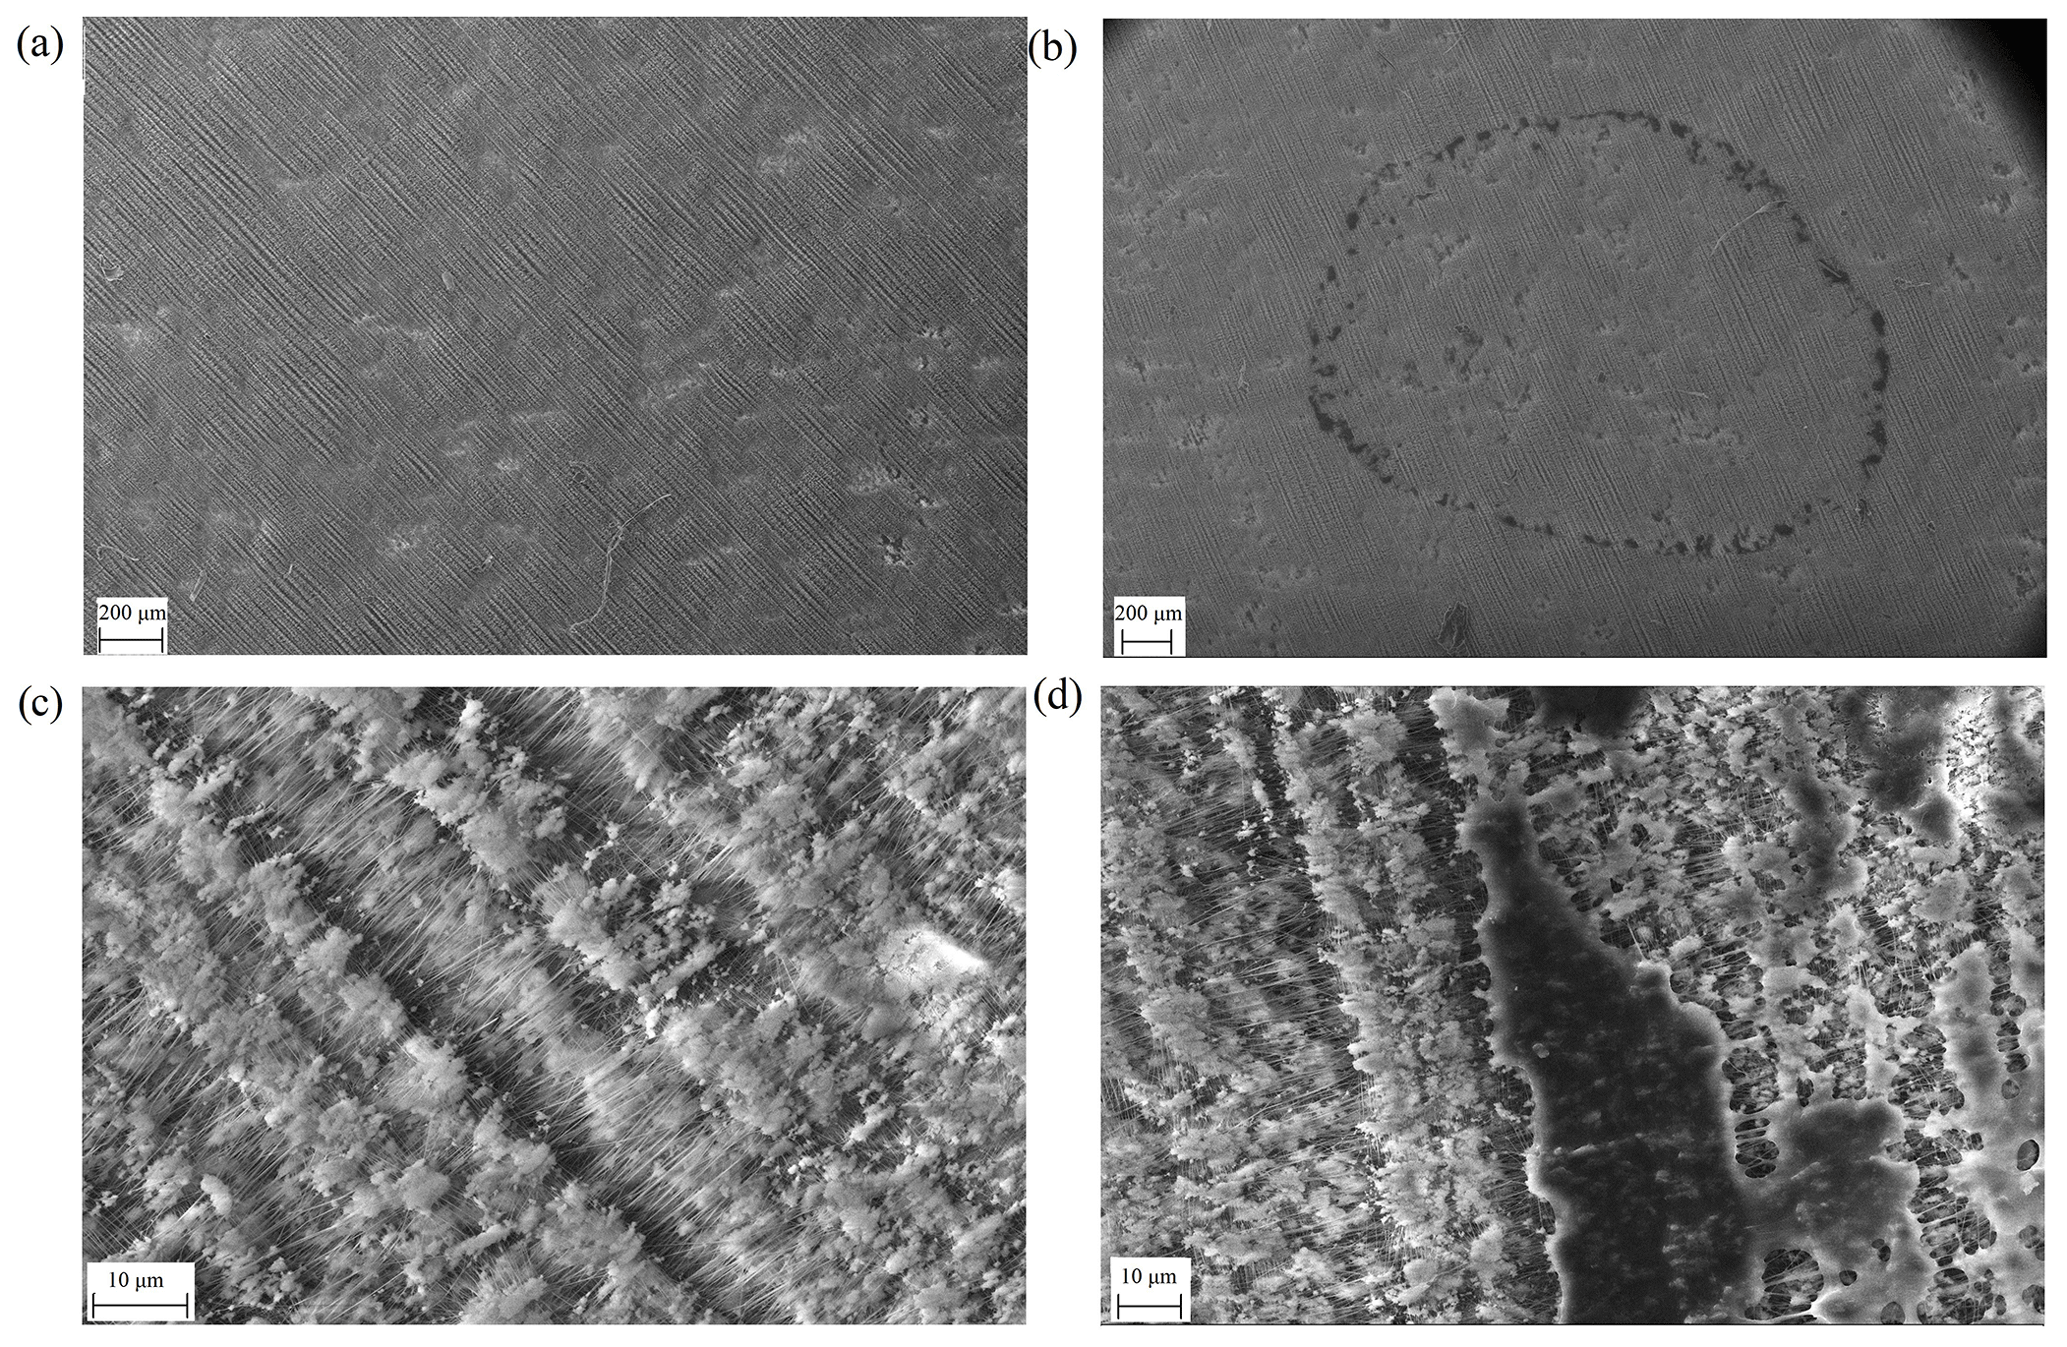
Figure 5SEM pictures. (a) A total of 10 µL of pure ACN deposited on the filter. (b) A total of 3 µL of PEG-8 with a concentration of 0.01 g L−1 (30 ng) in ACN deposited on the filter. (c) Magnification shows magnification (a) and panel (d) shows magnification of the PEG-8 residue.
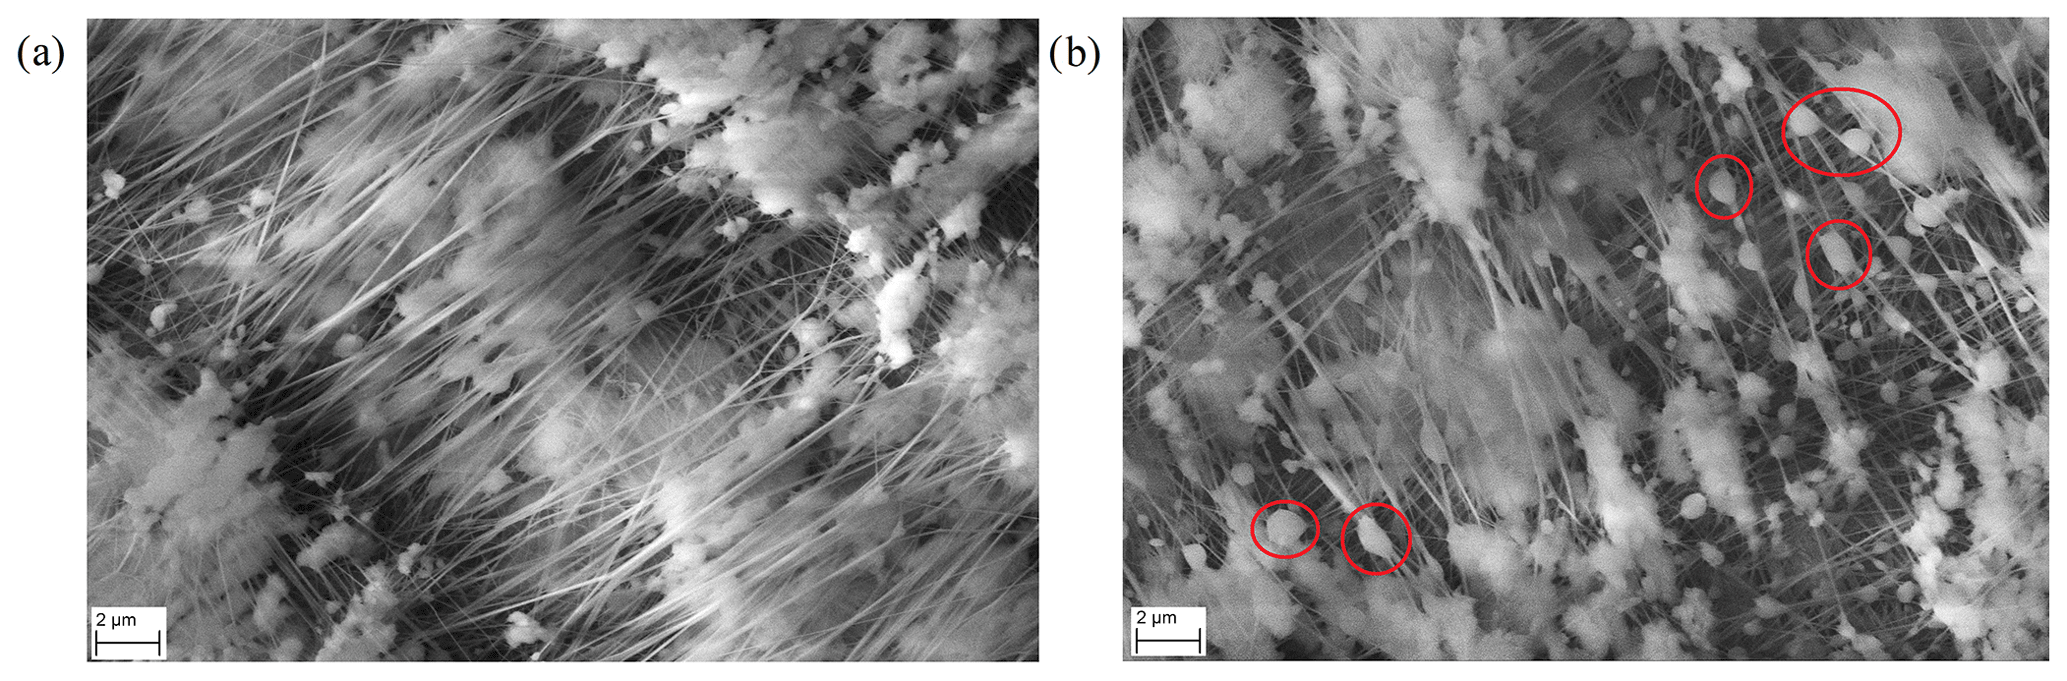
Figure 6SEM pictures. (a) Magnification of a clean FIGAERO filter with no collected particles. (b) A magnification of a FIGAERO filter with collected 300 nm sized PEG-8 particles. Red circles in panel (b) emphasize selected spots where liquid PEG-8 particles are deposited.
Figure 6 shows magnified SEM pictures of a FIGAERO filter (note different scale compared to Fig. 5). Figure 6a shows a clean FIGAERO filter without collected particles, and Fig. 6b shows a filter with collected 300 nm particles.
Even though qualitative at nature, Figs. 5 and 6 clearly demonstrate how differently the calibration material deposits onto the FIGAERO filter, depending on which method is used. We hypothesize that a vast difference in the surface-to-volume ratio of the deposited material, as implied by the SEM pictures, is particularly crucial in explaining the differing Tmax results. We expect the molecular desorption rate of the deposit in clean nitrogen to be proportional to its total exposed surface area (Hertz–Knudsen equation; Cappa et al., 2007; Schobesberger et al., 2018). The deposit's total volume, however, is proportional to the deposited amount, i.e. broadly the same in these experiments irrespective of deposition method. Indeed, it was by building on these assumptions that the evaporation model succeeded in reproducing the observations in Fig. 4. With the much smaller surface area of the syringe-deposited material, it requires more time to evaporate all the PEG-8 than from the equivalent amount of deposited aerosol particles. This time delay directly translates to a shift to higher observed Tmax values. The desorption model mimics this change in surface-to-volume ratio by increasing the initial size of the modelled evaporating particle to 1.3 and 11 µm. But note that there are no individual spherical particles of that size on the filter.
3.3 Particle size and heating ramp rate effect in atomizer method
As Tmax values have been reported to vary in aerosol measurements (Huang et al., 2018; Schobesberger et al., 2018), we investigated how different particle sizes and FIGAERO heating ramp rates influence the measured Tmax values with the atomizer method.
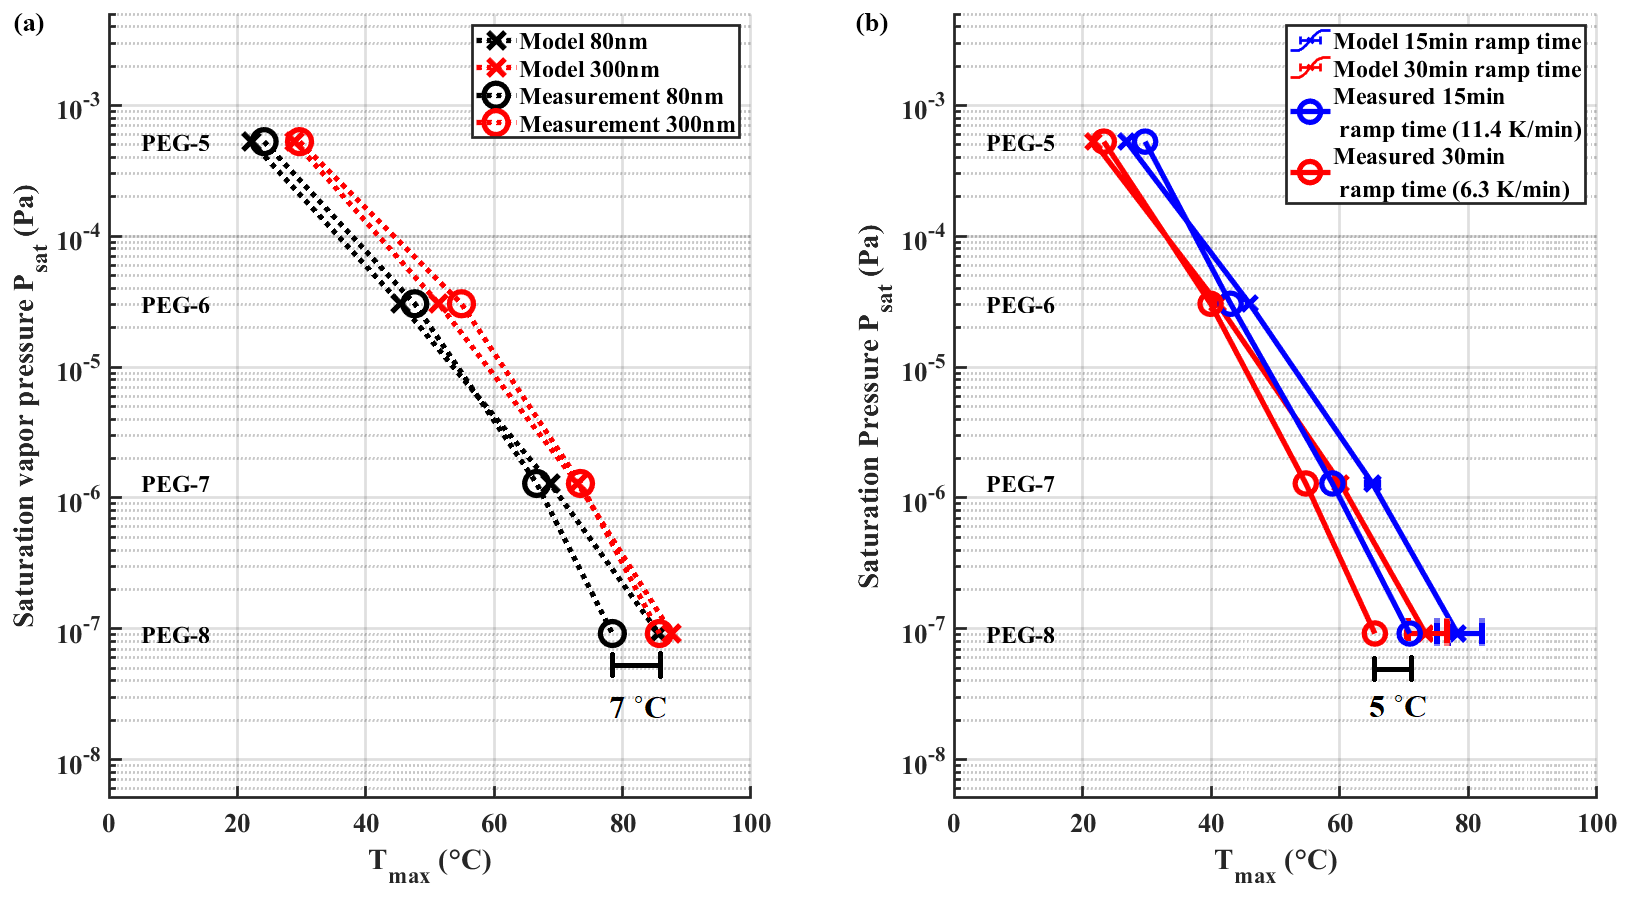
Figure 7(a) Tmax values measured for 80 and 300 nm particles with ramp time of 15 min. The difference in Tmax between the two particle sizes is ∼ 7 ∘C. Panel (b) shows measured Tmax values of 15 and 30 min ramping times using polydisperse aerosol particles. The difference between the two heating rates is ∼ 5 ∘C. Error bars are omitted from the measured values in the figure for sake of clarity. In panel (b) whiskers show the range of model results when using uncertainties of evaporation enthalpy shown in Krieger et al. (2018). The SDs for all measured points in (a) are between 0.2–0.5 ∘C. In panel (b) the SDs for measured points are between 0.2–1.3 ∘C.
We performed measurements with PEG mixture aerosol particles with monodisperse mobility sizes of 80 and 300 nm and mass loadings in between 150–170 ng, while using a ramping time of 15 min (Fig. 7a). Note that Tmax results differ from results shown in Sect. 3.1 due to the different FIGAERO inlet used here. Monodisperse particles showed a consistent difference in measured Tmax of ∼ 7 ∘C between 80 and 300 nm particles for all PEGs, which translates to a difference of roughly half an order of magnitude when used to calibrate the C∗ space. Our evaporation model confirms this difference for all PEGs except PEG-8. The difference between different particle sizes can be explained with different surface-to-volume ratios as was discussed in the previous section.
We observed a difference of 3–5 ∘C in measured Tmax values between heating ramp times of 15 min (11.4 K min−1) and 30 min (6.25 K min−1) (Fig. 7b). The evaporation model yields the same difference between the two heating times, even though actual Tmax values are slightly overestimated. The difference in observed Tmax values between different ramping rates is expected. With a slower linear ramping rate, for example, more time will have passed at any momentary desorption temperature, allowing a larger fraction of molecules to have already evaporated. Consequently, the supply of molecules will become exhausted at a lower desorption temperature, which causes the peak that defines Tmax.
An additional aspect that has been reported to shift Tmax values is the amount of collected aerosol mass on the PTFE filter (Huang et al., 2018), becoming important when collected particulate mass is around several micrograms. We tested the mass loading effect by collecting different amounts of atomized PEGs up to 200 ng of mass and found no clear difference between measured Tmax values (data not shown). However, as collected aerosol mass on the FIGAERO filter can easily reach microgram amounts, especially when sampling in highly polluted environments and as we did not rigorously test how Tmax values behave above 200 ng, we suggest that this effect is investigated further in future publications.
3.4 Sensitivity calibration comparison
The syringe deposition method has often been used to calibrate the sensitivity of the FIGAERO particle-phase measurements, i.e. to correlate the number of measured ions to the collected material on the filter (Lopez-Hilfiker et al., 2014; Liu et al., 2016). These measurements are typically done in a similar way as described in Sect. 2.2 but varying the amount of deposited calibrant by varying the amount of deposited solution. The signal of the calibration compound is then integrated over the full heating period and contrasted against the deposited mass after which a linear fit yields the instrument's sensitivity.
In Fig. 8 we compare the sensitivity calibration for PEG-7, done with the syringe deposition method (blue), to equivalent measurements, done with atomized monodisperse particles instead (green). The results of the two methods are in excellent agreement, which also confirms the feasibility of the atomizer method in sensitivity calibrations. However, when using the atomizer method in sensitivity calibrations, additional precautions should be taken to ensure that all assumptions made in the mass loading calculations are valid. For example, possible particle agglomeration must be considered when atomizing high particle number concentrations, in particular when using compounds that form solid particles at room temperature and at RH prior to FIGAERO sampling, such as ammonium sulfate or citric acid. As agglomerated solid particles are generally not spherical, as is often assumed for mass loading calculations, calculated particle mass loading on the filter can be overestimated. We therefore recommend using the syringe deposition method for sensitivity calibrations, also because the amount of required instrumentation and associated errors are much smaller.
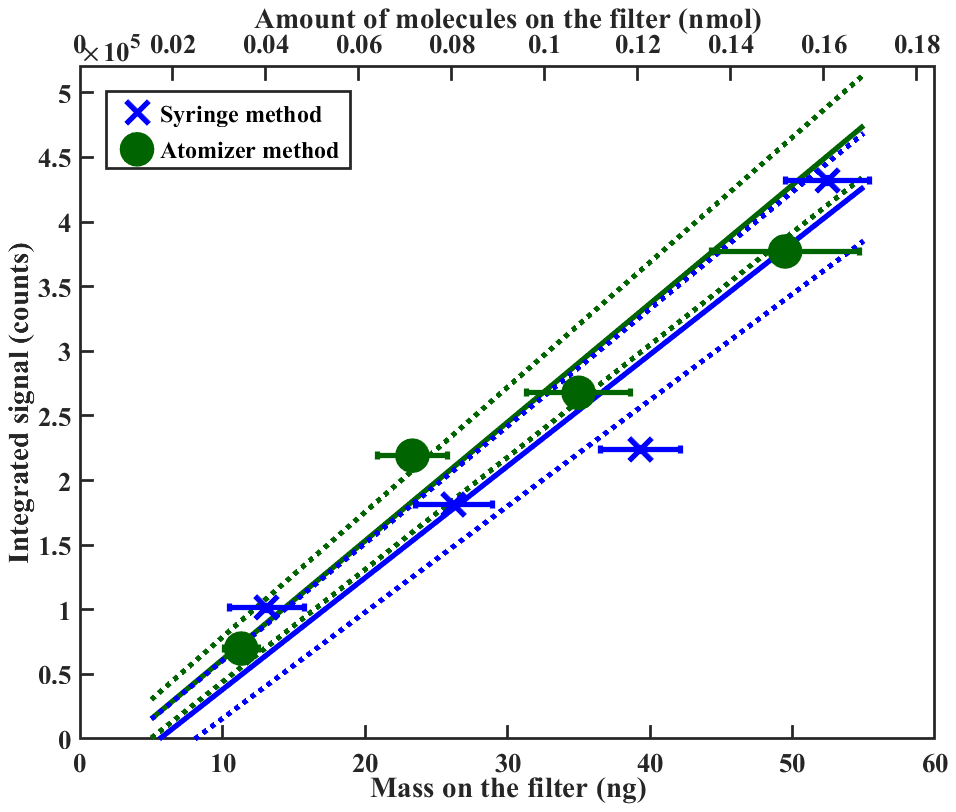
Figure 8Sensitivity comparison between different calibration methods using PEG-7. The bottom x axis shows the deposited mass on the filter; the top x axis shows the same amount in nanomoles. Note that y axis error bars are too small to be seen in the figure. Further explanation of the error analysis is shown in the Supplement.
3.5 Psat of higher-order PEGs
As Tmax values of the used PEGs only reach up to ∼ 80 ∘C, but Tmax values of ambient aerosols are reported as high as 160 ∘C (Huang et al., 2019), it would be beneficial to extend the calibration range to higher Tmax values for more accurate calibrations. PEGs are commercially available in polymer lengths of more than 30 chains, but unfortunately available saturation pressure data only extend up to PEG-8 (Krieger et al., 2018). However, as PEGs are straight-chain polymers, it could be assumed that log(Psat) of higher-order PEGs increase in a linear fashion, which is also suggested in Krieger et al., 2018. We include results of Tmax measurements using higher-order PEGs (up to PEG-16) and two tentative analysis approaches via estimating the Psat value of those compounds in Sect. S4 in the Supplement.
3.6 Impact of using different calibration methods
Figure 9a and b show volatility basis set (VBS) distributions constructed from FIGAERO desorption measurements of SOA formed from photo-oxidation of α-pinene in a flow tube experiment. A more detailed description of the SOA production is shown in Ylisirniö et al. (2020). We used Tmax to Psat calibration coefficients acquired either via the atomizer method or via the syringe method, in the latter case with a solution concentration of 0.01 g L−1 standard solution depositions. Note that the calibrations shown in this paper used faster heating ramp rates than what was used in the SOA measurements, introducing an overall small systematic error (< 1 order of magnitude in C∗space) towards higher saturation concentrations. However, the presented differences are unaffected. The used calibration curves are shown in Fig. 9c. Figure 9d reproduces the calibration lines of Fig. 9c, but in terms of C∗ for a compound with molar mass of 200 g mol−1.
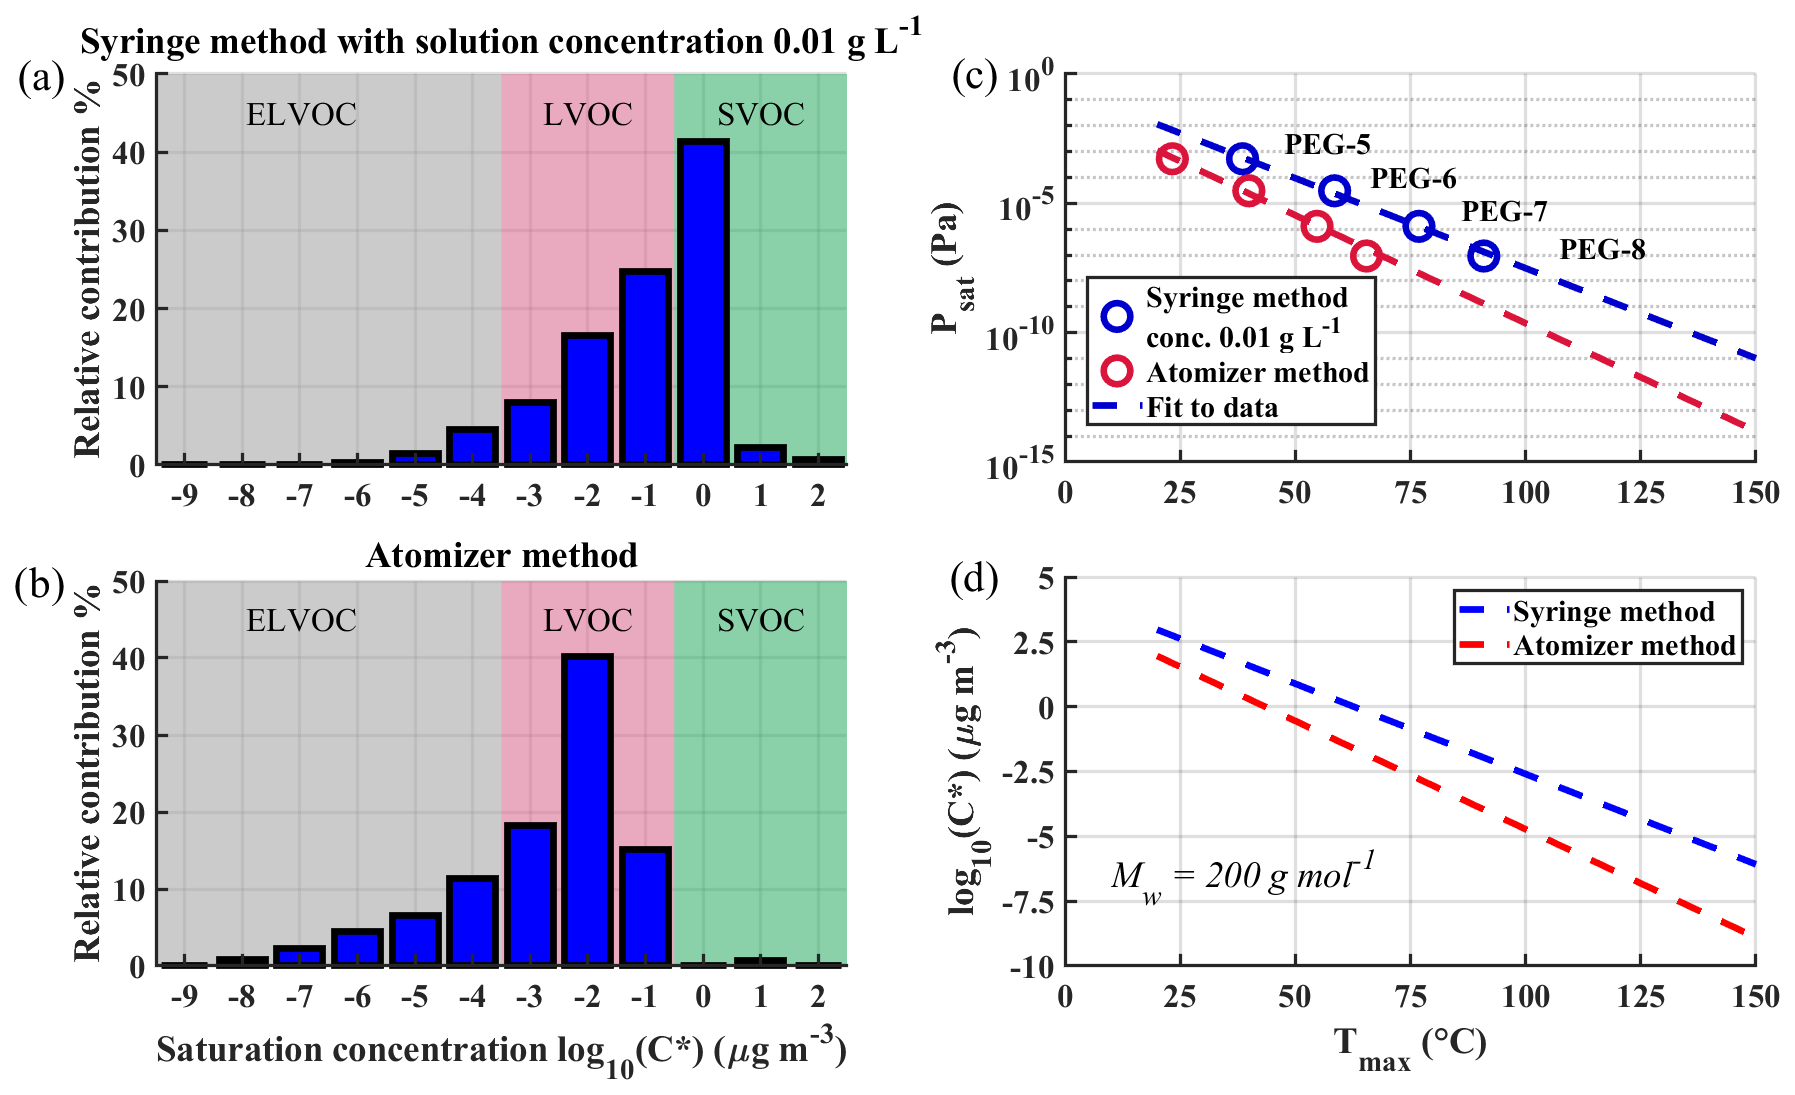
Figure 9Comparison of volatility basis sets (VBS) derived for the same SOA but using different calibration methods. Panel (a) shows VBS determined with the deposition method, and panel (b) shows VBS determined with the atomizer method using the same dataset. The used calibration lines are shown in panel (c). Panel (d) shows how different calibration lines would impact the log 10(C∗) value of a compound with Mw of 200 g mol−1 with different Tmax values.
Results clearly demonstrate the effect of using the syringe deposition method vs. the atomization method. When using the calibration coefficients from the atomizer method, there is a shift towards lower volatilities: the amount of low-volatility organic compounds (LVOCs) and extremely low-volatility organic compounds (ELVOCs) is increased, while semi-volatile organic compounds (SVOCs) mostly disappear. The magnitude of this shift is presented more directly, albeit approximately, in Fig. 9d. The difference in C∗ between the two calibration methods is ∼ 1 order of magnitude at 50 ∘C, increasing to ∼ 2.5 orders of magnitude at 100 ∘C.
The difference is strong enough to have the potential to change the aerosol growth dynamics in global climate models employing VBS distributions and could thus impact the estimation of cloud condensation nuclei (CCN) numbers which in turn leads to an underestimation of the reflected solar radiation from clouds (Sporre et al., 2020).
In this study we introduced an improved method for FIGAERO-CIMS volatility calibration from peak thermogram value Tmax to saturation pressure Psat, by atomizing the used calibration compounds, and we compared the results to the thus far more often used syringe deposition method. With the syringe deposition method, we found a clear effect of solution concentration on measured Tmax values (e.g. Fig. 3). This effect can lead to severe overestimation of saturation vapour pressure values when derived from measured Tmax. For investigating those differences in calibration results, we also employed evaporation modelling and took direct scanning electron microscope pictures of calibration compounds deposited onto the FIGAERO filter. Both the modelling and SEM images show that the structure and the volume of the deposited unit controls the evaporation. Syringe-deposited calibration compounds form patches of material when the solvent evaporates, whereas collected aerosol particles stay as separate particles on the filter. The atomized particles have much higher surface-to-volume ratio compared to the syringe-deposited patches and so a similar total amount of deposit will evaporate more quickly from the filter. As the FIGAERO inlet is designed to measure ambient aerosol particles, it stands to reason that using the atomizer method will yield more appropriate calibration results than the syringe deposition method.
To explore possible uncertainties in the atomizer method due to sensitivities to experimental settings, we also investigated the effect of particle size and heating ramp rate to the measured Tmax values. We found overall differences of ∼ 7 K between 80 and 300 nm PEG particles and of ∼ 3 K between 15 and 30 min ramp rates. These differences translate to a change of roughly half an order of magnitude in saturation concentration (C∗) space. As the used particle size has a moderate impact on the measured Tmax values, it is advisable to use polydisperse aerosol for calibration with particle size distributions close to the actual aerosol size distribution that is being measured.
We also tested how the atomizer method performs against the syringe deposition method in sensitivity calibrations using PEG-7 as the calibrant compound. The two methods produced practically identical sensitivity calibration curves when using liquid aerosol particles. However, possible measurement errors and infrastructure requirements for the atomizer method may make the syringe deposition method more feasible for sensitivity calibrations.
We finally compared how the use of calibration curves from the two methods impacts the VBS distribution derived from SOA formed from photo-oxidation of α-pinene. We found that using calibration parameters from the atomizer method shifted the VBS distribution ∼ 1–3 orders of magnitude compared to the VBS distribution derived with the syringe deposition method, especially increasing the amount of LVOC and ELVOC compounds. This shift is strong enough to affect our understanding and modelling results of SOA formation and dynamics and ultimately how these processes are treated in global climate models, potentially affecting calculated CCN values.
An essential aspect of calibrating the Tmax–Psat relationship for FIGAERO is the use of reference Psat values for the calibration compounds. As we pointed out in the introduction, the Psat values found in the literature for typical organic compounds have high variations depending on the literature source (see Table S1). Therefore we strongly recommend that FIGAERO-CIMS Tmax to Psat calibrations should be performed using atomized PEGs, with literature Psat values currently being reported in Krieger et al. (2018). We note that these Psat values have not been verified by other studies and are subject to corrections, but we want to point out that harmonizing further FIGAERO calibrations by using PEGs would make future FIGAERO measurements more comparable to each other. For example, volatility datasets derived from FIGAERO measurements using an atomized PEG-based calibration could be corrected with minimum effort if more accurate Psat values for PEG became available, or if the available set of Psat values were extended to higher-order PEGs.
The data shown in the paper are available upon request from the corresponding author.
The supplement related to this article is available online at: https://doi.org/10.5194/amt-14-355-2021-supplement.
AY and SS led the paper writing. AY, LMFB and IP carried out the measurement experiments. AY, LMFB, IP, AB, AV and SS participated in the experiment planning. JJ, JEK and DRW provided the measurement instrument and participated in paper editing. All co-authors also participated in the interpretation of the measurement results and paper editing.
Jordan Krechmer, John Jayne and Douglas Worsnop work for Aerodyne Research, Inc., which commercialized the FIGAERO inlet.
We thank Jari Leskinen from the SIB Labs facilities for assistance in SEM imaging.
This research has been supported by the Academy of Finland, Luonnontieteiden ja Tekniikan Tutkimuksen Toimikunta (grant nos. 272041, 310682 and 299544) and the University of Eastern Finland Doctoral Program in Environmental Physics, Health and Biology.
This paper was edited by Bin Yuan and reviewed by Thomas Mentel and two anonymous referees.
Bannan, T. J., Le Breton, M., Priestley, M., Worrall, S. D., Bacak, A., Marsden, N. A., Mehra, A., Hammes, J., Hallquist, M., Alfarra, M. R., Krieger, U. K., Reid, J. P., Jayne, J., Robinson, W., McFiggans, G., Coe, H., Percival, C. J., and Topping, D.: A method for extracting calibrated volatility information from the FIGAERO-HR-ToF-CIMS and its experimental application, Atmos. Meas. Tech., 12, 1429–1439, https://doi.org/10.5194/amt-12-1429-2019, 2019.
Cappa, C. D., Lovejoy, E. R., and Ravishankara, A. R.: Determination of evaporation rates and vapor pressures of very low volatility compounds: A study of the C4–C10 and C12 dicarboxylic acids, J. Phys. Chem. A, 111, 3099–3109, https://doi.org/10.1021/jp068686q, 2007.
D'Ambro, E. L., Lee, B. H., Liu, J., Shilling, J. E., Gaston, C. J., Lopez-Hilfiker, F. D., Schobesberger, S., Zaveri, R. A., Mohr, C., Lutz, A., Zhang, Z., Gold, A., Surratt, J. D., Rivera-Rios, J. C., Keutsch, F. N., and Thornton, J. A.: Molecular composition and volatility of isoprene photochemical oxidation secondary organic aerosol under low- and high-NOx conditions, Atmos. Chem. Phys., 17, 159–174, https://doi.org/10.5194/acp-17-159-2017, 2017.
Donahue, N. M., Kroll, J. H., Pandis, S. N., and Robinson, A. L.: A two-dimensional volatility basis set – Part 2: Diagnostics of organic-aerosol evolution, Atmos. Chem. Phys., 12, 615–634, https://doi.org/10.5194/acp-12-615-2012, 2012.
Eichler, P., Müller, M., D'Anna, B., and Wisthaler, A.: A novel inlet system for online chemical analysis of semi-volatile submicron particulate matter, Atmos. Meas. Tech., 8, 1353–1360, https://doi.org/10.5194/amt-8-1353-2015, 2015.
Hallquist, M., Wenger, J. C., Baltensperger, U., Rudich, Y., Simpson, D., Claeys, M., Dommen, J., Donahue, N. M., George, C., Goldstein, A. H., Hamilton, J. F., Herrmann, H., Hoffmann, T., Iinuma, Y., Jang, M., Jenkin, M. E., Jimenez, J. L., Kiendler-Scharr, A., Maenhaut, W., McFiggans, G., Mentel, Th. F., Monod, A., Prévôt, A. S. H., Seinfeld, J. H., Surratt, J. D., Szmigielski, R., and Wildt, J.: The formation, properties and impact of secondary organic aerosol: current and emerging issues, Atmos. Chem. Phys., 9, 5155–5236, https://doi.org/10.5194/acp-9-5155-2009, 2009.
Hong, J., Äijälä, M., Häme, S. A. K., Hao, L., Duplissy, J., Heikkinen, L. M., Nie, W., Mikkilä, J., Kulmala, M., Prisle, N. L., Virtanen, A., Ehn, M., Paasonen, P., Worsnop, D. R., Riipinen, I., Petäjä, T., and Kerminen, V.-M.: Estimates of the organic aerosol volatility in a boreal forest using two independent methods, Atmos. Chem. Phys., 17, 4387–4399, https://doi.org/10.5194/acp-17-4387-2017, 2017.
Huang, W., Saathoff, H., Pajunoja, A., Shen, X., Naumann, K.-H., Wagner, R., Virtanen, A., Leisner, T., and Mohr, C.: α-Pinene secondary organic aerosol at low temperature: chemical composition and implications for particle viscosity, Atmos. Chem. Phys., 18, 2883–2898, https://doi.org/10.5194/acp-18-2883-2018, 2018.
Huang, W., Saathoff, H., Shen, X., Ramisetty, R., Leisner, T., and Mohr, C.: Seasonal characteristics of organic aerosol chemical composition and volatility in Stuttgart, Germany, Atmos. Chem. Phys., 19, 11687–11700, https://doi.org/10.5194/acp-19-11687-2019, 2019.
Isaacman-Vanwertz, G., Massoli, P., O'Brien, R., Lim, C., Franklin, J. P., Moss, J. A., Hunter, J. F., Nowak, J. B., Canagaratna, M. R., Misztal, P. K., Arata, C., Roscioli, J. R., Herndon, S. T., Onasch, T. B., Lambe, A. T., Jayne, J. T., Su, L., Knopf, D. A., Goldstein, A. H., Worsnop, D. R., and Kroll, J. H.: Chemical evolution of atmospheric organic carbon over multiple generations of oxidation, Nat. Chem., 10, 462–468, https://doi.org/10.1038/s41557-018-0002-2, 2018.
Iyer, S., He, X., Hyttinen, N., Kurtén, T., and Rissanen, M. P.: Computational and Experimental Investigation of the Detection of HO2 Radical and the Products of Its Reaction with Cyclohexene Ozonolysis Derived RO2 Radicals by an Iodide-Based Chemical Ionization Mass Spectrometer, J. Phys. Chem. A, 121, 6778–6789, https://doi.org/10.1021/acs.jpca.7b01588, 2017.
Jimenez, J. L., Canagaratna, M. R., Donahue, N. M., Prevot, A. S. H., Zhang, Q., Kroll, J. H., DeCarlo, P. F., Allan, J. D., Coe, H., Ng, N. L., Aiken, A. C., Docherty, K. S., Ulbrich, I. M., Grieshop, A. P., Robinson, A. L., Duplissy, J., Smith, J. D., Wilson, K. R., Lanz, V. A., Hueglin, C., Sun, Y. L., Tian, J., Laaksonen, A., Raatikainen, T., Rautiainen, J., Vaattovaara, P., Ehn, M., Kulmala, M., Tomlinson, J. M., Collins, D. R., Cubison, M. J., Dunlea, E. J., Huffman, J. A., Onasch, T. B., Alfarra, M. R., Williams, P. I., Bower, K., Kondo, Y., Schneider, J., Drewnick, F., Borrmann, S., Weimer, S., Demerjian, K., Salcedo, D., Cottrell, L., Griffin, R., Takami, A., Miyoshi, T., Hatakeyama, S., Shimono, A., Sun, J. Y., Zhang, Y. M., Dzepina, K., Kimmel, J. R., Sueper, D., Jayne, J. T., Herndon, S. C., Trimborn, A. M., Williams, L. R., Wood, E. C., Middlebrook, A. M., Kolb, C. E., Baltensperger, U., and Worsnop, D. R.: Evolution of organic aerosols in the atmosphere, Science, 326, 1525–1529, https://doi.org/10.1126/science.1180353, 2009.
Joo, T., Rivera-Rios, J. C., Takeuchi, M., Alvarado, M. J., and Ng, N. L.: Secondary Organic Aerosol Formation from Reaction of 3-Methylfuran with Nitrate Radicals, ACS Earth Sp. Chem., 3, 922–934, https://doi.org/10.1021/acsearthspacechem.9b00068, 2019.
Krieger, U. K., Siegrist, F., Marcolli, C., Emanuelsson, E. U., Gøbel, F. M., Bilde, M., Marsh, A., Reid, J. P., Huisman, A. J., Riipinen, I., Hyttinen, N., Myllys, N., Kurtén, T., Bannan, T., Percival, C. J., and Topping, D.: A reference data set for validating vapor pressure measurement techniques: homologous series of polyethylene glycols, Atmos. Meas. Tech., 11, 49–63, https://doi.org/10.5194/amt-11-49-2018, 2018.
Le Breton, M., Wang, Y., Hallquist, Å. M., Pathak, R. K., Zheng, J., Yang, Y., Shang, D., Glasius, M., Bannan, T. J., Liu, Q., Chan, C. K., Percival, C. J., Zhu, W., Lou, S., Topping, D., Wang, Y., Yu, J., Lu, K., Guo, S., Hu, M., and Hallquist, M.: Online gas- and particle-phase measurements of organosulfates, organosulfonates and nitrooxy organosulfates in Beijing utilizing a FIGAERO ToF-CIMS, Atmos. Chem. Phys., 18, 10355–10371, https://doi.org/10.5194/acp-18-10355-2018, 2018.
Le Breton, M., Psichoudaki, M., Hallquist, M., Watne, K., Lutz, A., and Hallquist, M.: Application of a FIGAERO ToF CIMS for on-line characterization of real-world fresh and aged particle emissions from buses, Aerosol Sci. Tech., 53, 244–259, https://doi.org/10.1080/02786826.2019.1566592, 2019.
Lee, B. H., Lopez-Hilfiker, F. D., Mohr, C., Kurtén, T., Worsnop, D. R., and Thornton, J. A.: An iodide-adduct high-resolution time-of-flight chemical-ionization mass spectrometer: Application to atmospheric inorganic and organic compounds, Environ. Sci. Technol., 48, 6309–6317, https://doi.org/10.1021/es500362a, 2014.
Li, Z., Tikkanen, O. P., Buchholz, A., Hao, L., Kari, E., Yli-Juuti, T., and Virtanen, A.: Effect of Decreased Temperature on the Evaporation of α-Pinene Secondary Organic Aerosol Particles, ACS Earth Sp. Chem., 3, 2775–2785, https://doi.org/10.1021/acsearthspacechem.9b00240, 2019.
Liu, J., D'Ambro, E. L., Lee, B. H., Lopez-Hilfiker, F. D., Zaveri, R. A., Rivera-Rios, J. C., Keutsch, F. N., Iyer, S., Kurten, T., Zhang, Z., Gold, A., Surratt, J. D., Shilling, J. E., and Thornton, J. A.: Efficient Isoprene Secondary Organic Aerosol Formation from a Non-IEPOX Pathway, Environ. Sci. Technol., 50, 9872–9880, https://doi.org/10.1021/acs.est.6b01872, 2016.
Lopez-Hilfiker, F. D., Mohr, C., Ehn, M., Rubach, F., Kleist, E., Wildt, J., Mentel, Th. F., Lutz, A., Hallquist, M., Worsnop, D., and Thornton, J. A.: A novel method for online analysis of gas and particle composition: description and evaluation of a Filter Inlet for Gases and AEROsols (FIGAERO), Atmos. Meas. Tech., 7, 983–1001, https://doi.org/10.5194/amt-7-983-2014, 2014.
Mikkonen, S., Pitkänen, M. R. A., Nieminen, T., Lipponen, A., Isokääntä, S., Arola, A., and Lehtinen, K. E. J.: Technical note: Effects of uncertainties and number of data points on line fitting – a case study on new particle formation, Atmos. Chem. Phys., 19, 12531–12543, https://doi.org/10.5194/acp-19-12531-2019, 2019.
Mohr, C., Thornton, J. A., Heitto, A., Lopez-Hilfiker, F. D., Lutz, A., Riipinen, I., Hong, J., Donahue, N. M., Hallquist, M., Petäjä, T., Kulmala, M., and Yli-Juuti, T.: Molecular identification of organic vapors driving atmospheric nanoparticle growth, Nat. Commun., 10, 1–7, https://doi.org/10.1038/s41467-019-12473-2, 2019.
Nah, T., Xu, L., Osborne-Benthaus, K. A., White, S. M., France, S., and Ng, N. L.: Mixing order of sulfate aerosols and isoprene epoxydiols affects secondary organic aerosol formation in chamber experiments, Atmos. Environ., 217, https://doi.org/10.1016/j.atmosenv.2019.116953, 2019.
Pitkänen, M. R. A., Mikkonen, S., Lehtinen, K. E. J., Lipponen, A., and Arola, A.: Artificial bias typically neglected in comparisons of uncertain atmospheric data, Geophys. Res. Lett., 43, 10003–10011, https://doi.org/10.1002/2016GL070852, 2016.
Riva, M., Heikkinen, L., Bell, D. M., Peräkylä, O., Zha, Q., Schallhart, S., Rissanen, M. P., Imre, D., Petäjä, T., Thornton, J. A., Zelenyuk, A., and Ehn, M.: Chemical transformations in monoterpene-derived organic aerosol enhanced by inorganic composition, npj Clim. Atmos. Sci., 2, 1–9, https://doi.org/10.1038/s41612-018-0058-0, 2019.
Schobesberger, S., D'Ambro, E. L., Lopez-Hilfiker, F. D., Mohr, C., and Thornton, J. A.: A model framework to retrieve thermodynamic and kinetic properties of organic aerosol from composition-resolved thermal desorption measurements, Atmos. Chem. Phys., 18, 14757–14785, https://doi.org/10.5194/acp-18-14757-2018, 2018.
Smith, J. N., Moore, K. F., McMurry, P. H., and Eisele, F. L.: Atmospheric Measurements of Sub-20 nm Diameter Particle Chemical Composition by Thermal Desorption Chemical Ionization Mass Spectrometry, Aerosol Sci. Tech., 38, 100–110, https://doi.org/10.1080/02786820490249036, 2004.
Sporre, M. K., Blichner, S. M., Schrödner, R., Karset, I. H. H., Berntsen, T. K., van Noije, T., Bergman, T., O'Donnell, D., and Makkonen, R.: Large difference in aerosol radiative effects from BVOC-SOA treatment in three Earth system models, Atmos. Chem. Phys., 20, 8953–8973, https://doi.org/10.5194/acp-20-8953-2020, 2020.
Stark, H., Yatavelli, R. L. N., Thompson, S. L., Kang, H., Krechmer, J. E., Kimmel, J. R., Palm, B. B., Hu, W., Hayes, P. L., Day, D. A., Campuzano-Jost, P., Canagaratna, M. R., Jayne, J. T., Worsnop, D. R., and Jimenez, J. L.: Impact of Thermal Decomposition on Thermal Desorption Instruments: Advantage of Thermogram Analysis for Quantifying Volatility Distributions of Organic Species, Environ. Sci. Technol., 51, 8491–8500, https://doi.org/10.1021/acs.est.7b00160, 2017.
Stolzenburg, D., Fischer, L., Vogel, A. L., Heinritzi, M., Schervish, M., Simon, M., Wagner, A. C., Dada, L., Ahonen, L. R., Amorim, A., Baccarini, A., Bauer, P. S., Baumgartner, B., Bergen, A., Bianchi, F., Breitenlechner, M., Brilke, S., Mazon, S. B., Chen, D., Dias, A., Draper, D. C., Duplissy, J., Haddad, I. El, Finkenzeller, H., Frege, C., Fuchs, C., Garmash, O., Gordon, H., He, X., Helm, J., Hofbauer, V., Hoyle, C. R., Kim, C., Kirkby, J., Kontkanen, J., Kürten, A., Lampilahti, J., Lawler, M., Lehtipalo, K., Leiminger, M., Mai, H., Mathot, S., Mentler, B., Molteni, U., Nie, W., Nieminen, T., Nowak, J. B., Ojdanic, A., Onnela, A., Passananti, M., Petäjä, T., Quéléver, L. L. J., Rissanen, M. P., Sarnela, N., Schallhart, S., Tauber, C., Tomé, A., Wagner, R., Wang, M., Weitz, L., Wimmer, D., Xiao, M., Yan, C., Ye, P., Zha, Q., Baltensperger, U., Curtius, J., Dommen, J., Flagan, R. C., Kulmala, M., Smith, J. N., Worsnop, D. R., Hansel, A., Donahue, N. M., and Winkler, P. M.: Rapid growth of organic aerosol nanoparticles over a wide tropospheric temperature range, P. Natl. Acad. Sci. USA, 115, 9122–9127, https://doi.org/10.1073/pnas.1807604115, 2018.
Wang, M., Chen, D., Xiao, M., Ye, Q., Stolzenburg, D., Hofbauer, V., Ye, P., Vogel, A. L., Mauldin, R. L., Amorim, A., Baccarini, A., Baumgartner, B., Brilke, S., Dada, L., Dias, A., Duplissy, J., Finkenzeller, H., Garmash, O., He, X. C., Hoyle, C. R., Kim, C., Kvashnin, A., Lehtipalo, K., Fischer, L., Molteni, U., Petäjä, T., Pospisilova, V., Quéléver, L. L. J., Rissanen, M., Simon, M., Tauber, C., Tomé, A., Wagner, A. C., Weitz, L., Volkamer, R., Winkler, P. M., Kirkby, J., Worsnop, D. R., Kulmala, M., Baltensperger, U., Dommen, J., El-Haddad, I., and Donahue, N. M.: Photo-oxidation of Aromatic Hydrocarbons Produces Low-Volatility Organic Compounds, Environ. Sci. Technol., 54, 7911–7921, https://doi.org/10.1021/acs.est.0c02100, 2020.
Yatavelli, R. L. N. and Thornton, J. A.: Particulate Organic Matter Detection Using a Micro-Orifice Volatilization Impactor Coupled to a Chemical Ionization Mass Spectrometer (MOVI-CIMS), Aerosol Sci. Tech., 44, 61–74, https://doi.org/10.1080/02786820903380233, 2010.
Ye, Q., Wang, M., Hofbauer, V., Stolzenburg, D., Chen, D., Schervish, M., Vogel, A., Mauldin, R. L., Baalbaki, R., Brilke, S., Dada, L., Dias, A., Duplissy, J., El Haddad, I., Finkenzeller, H., Fischer, L., He, X., Kim, C., Kürten, A., Lamkaddam, H., Lee, C. P., Lehtipalo, K., Leiminger, M., Manninen, H. E., Marten, R., Mentler, B., Partoll, E., Petäjä, T., Rissanen, M., Schobesberger, S., Schuchmann, S., Simon, M., Tham, Y. J., Vazquez-Pufleau, M., Wagner, A. C., Wang, Y., Wu, Y., Xiao, M., Baltensperger, U., Curtius, J., Flagan, R., Kirkby, J., Kulmala, M., Volkamer, R., Winkler, P. M., Worsnop, D., and Donahue, N. M.: Molecular Composition and Volatility of Nucleated Particles from α-Pinene Oxidation between −50 ∘C and +25 ∘C, Environ. Sci. Technol., 53, 12357–12365, https://doi.org/10.1021/acs.est.9b03265, 2019.
Yli-Juuti, T., Pajunoja, A., Tikkanen, O. P., Buchholz, A., Faiola, C., Väisänen, O., Hao, L., Kari, E., Peräkylä, O., Garmash, O., Shiraiwa, M., Ehn, M., Lehtinen, K., and Virtanen, A.: Factors controlling the evaporation of secondary organic aerosol from α-pinene ozonolysis, Geophys. Res. Lett., 44, 2562–2570, https://doi.org/10.1002/2016GL072364, 2017.
Ylisirniö, A., Buchholz, A., Mohr, C., Li, Z., Barreira, L., Lambe, A., Faiola, C., Kari, E., Yli-Juuti, T., Nizkorodov, S. A., Worsnop, D. R., Virtanen, A., and Schobesberger, S.: Composition and volatility of secondary organic aerosol (SOA) formed from oxidation of real tree emissions compared to simplified volatile organic compound (VOC) systems , Atmos. Chem. Phys., 20, 5629–5644, https://doi.org/10.5194/acp-20-5629-2020, 2020.
York, D., Evensen, N. M., Martínez, M. L., and De Basabe Delgado, J.: Unified equations for the slope, intercept, and standard errors of the best straight line, Am. J. Phys., 72, 367–375, https://doi.org/10.1119/1.1632486, 2004.