the Creative Commons Attribution 4.0 License.
the Creative Commons Attribution 4.0 License.
 | 08 Dec 2021
Assessment of real-time bioaerosol particle counters using reference chamber experiments
Gian Lieberherr
Kevin Auderset
Bertrand Calpini
Bernard Clot
Benoît Crouzy
Martin Gysel-Beer
Thomas Konzelmann
José Manzano
Andrea Mihajlovic
Alireza Moallemi
David O'Connor
Branko Sikoparija
Eric Sauvageat
Fiona Tummon
Konstantina Vasilatou
This study presents the first reference calibrations of three commercially available bioaerosol detectors. The Droplet Measurement Technologies WIBS-NEO (new version of the wideband integrated bioaerosol spectrometer), Plair Rapid-E, and Swisens Poleno were compared with a primary standard for particle number concentrations at the Federal Institute for Metrology (METAS). Polystyrene (PSL) spheres were used to assess absolute particle counts for diameters from 0.5 to 10 µm. For the three devices, counting efficiency was found to be strongly dependent on particle size. The results confirm the expected detection range for which the instruments were designed. While the WIBS-NEO achieves its highest efficiency with smaller particles, e.g. 90 % for 0.9 µm diameter, the Plair Rapid-E performs best for larger particles, with an efficiency of 58 % for particles with a diameter of 10 µm. The Swisens Poleno is also designed for larger particles but operates well from 2 µm. However, the exact counting efficiency of the Poleno could not be evaluated as the cut-off diameter range of the integrated concentrator unit was not completely covered. In further experiments, three different types of fluorescent particles were tested to investigate the fluorescent detection capabilities of the Plair Rapid-E and the Swisens Poleno. Both instruments showed good agreement with the reference data. While the challenge to produce known concentrations of larger particles above 10 µm or even fresh pollen particles remains, the approach presented in this paper provides a potential standardised validation method that can be used to assess counting efficiency and fluorescence measurements of automatic bioaerosol monitoring devices.
- Article
(2074 KB) - Full-text XML
- BibTeX
- EndNote


Routine pollen monitoring is carried out across the world, particularly in developed countries, where the prevalence of allergies is highest (Wüthrich et al., 1995; Ring et al., 2001; D'Amato et al., 2007; Buters et al., 2018). At present, monitoring networks rely nearly exclusively on manual instruments developed in the 1950s (Hirst, 1952). These samplers continuously collect airborne particles on a rotating drum, which is removed from the instrument on a regular schedule, usually once per week. Thereafter the tape is disassembled from the drum and pollen manually identified and counted using optical microscopy (Galán et al., 2014). The time-consuming nature and professional expertise required for this method restrict both the possible number of stations across a network and the time resolution of data provided to end users (usually daily averages).
Several automatic bioaerosol monitors have come to market over the past few years, allowing real-time or near-real-time observations at high temporal resolution (for a recent overview see Huffman et al., 2019). These include the Droplet Measurement Technologies WIBS (wideband integrated bioaerosol sensor), which is a three-channel spectrometer (Foot et al., 2008; Perring et al., 2015a; Könemann et al., 2019) that has been widely used for a range of research purposes. Initial studies focused on just the differentiation between fluorescent and non-fluorescent particles (Gabey et al., 2010), while more recently a typing scheme has been applied to provide information about aerosol fluorescent properties which are linked to different particle types, including bacteria, fungal spores, and pollen (Perring et al., 2015a; Hernandez et al., 2016; Savage et al., 2017; Ruske et al., 2018). Results, however, varied between different instrument versions, and no classification between different pollen taxa is currently possible. Two more recently developed instruments also based on airflow cytometry, the Plair Rapid-E (Kiselev et al., 2013; Crouzy et al., 2016; Šauliene et al., 2019) and Swisens Poleno (Sauvageat et al., 2020), have shown the potential to classify pollen taxa. This is an essential requirement for pollen monitoring since allergy sufferers, one of the main end user groups of the information these networks provide, are sensitive to specific pollen taxa above particular concentration thresholds (Jaeger, 2006).
As interest grows in using automatic instruments to provide real-time information about airborne pollen concentrations, it is vital that standard calibration methods are developed that can be applied across monitoring networks. Such techniques do not currently exist for automatic pollen monitoring, in part because of the novelty of real-time instruments and also because no method currently exists to aerosolise a known quantity of a particular pollen taxon. This in turn is a result of the fact that pollen particles are considerably larger than the aerosols that are typically monitored in air quality networks and because they are very fragile, being easily broken up into smaller pieces using traditional aerosolising methods (Löndahl, 2014). Since the above-mentioned monitoring devices rely on light-induced fluorescence to identify single particles, a validation of the fluorescence response to a known excitation wavelength is also a crucial step in instrument validation.
In this study we present results from the first reference calibrations of three real-time bioaerosol monitors, the Droplet Measurement Technologies WIBS-NEO (new version of the wideband integrated bioaerosol spectrometer), Plair Rapid-E, and Swisens Poleno, using primary standards. The measurements were carried out from 8–11 April 2019 at the Federal Institute for Metrology (METAS). Section 2 outlines the experimental set-up and instruments used. Section 3 presents the results and a discussion of the performance of each instrument in terms of absolute number counts, counting efficiency, uncertainty and stability, particle size detection, and the fluorescence measurements. The conclusions are provided in Sect. 4.
2.1 Primary standard for particle number concentration at METAS
The primary standard for particle number concentration at METAS is a large-scale facility designed for calibration of optical and aerodynamic particle size spectrometers (OPSSs and APSSs, respectively). The design has been described in detail elsewhere (Horender et al., 2019), and only the main aspects are briefly presented here (Fig. 1). The experimental set-up consists of three distinct sections: the aerosol generation system, a turbulent-flow tube (aerosol homogeniser), and a reference optical particle counter (Horender et al., 2019). Polystyrene (PSL) spheres in the size range 100 nm–10 µm are aerosolised using methods based on wet or dry dispersion with commercial and custom-made generators. It is known that PSL suspensions contain additives, such as surfactants to prevent particles from agglomerating. Upon aerosolisation, these additives give rise to so-called residue particles, which can create unwanted peaks in the particle distribution. In such cases, the PSL particles are selected according to size using a differential mobility analyser (DMA; TSI Inc., USA) or an aerodynamic aerosol classifier (AAC; Cambustion Ltd., UK) to filter out unwanted residue particles.
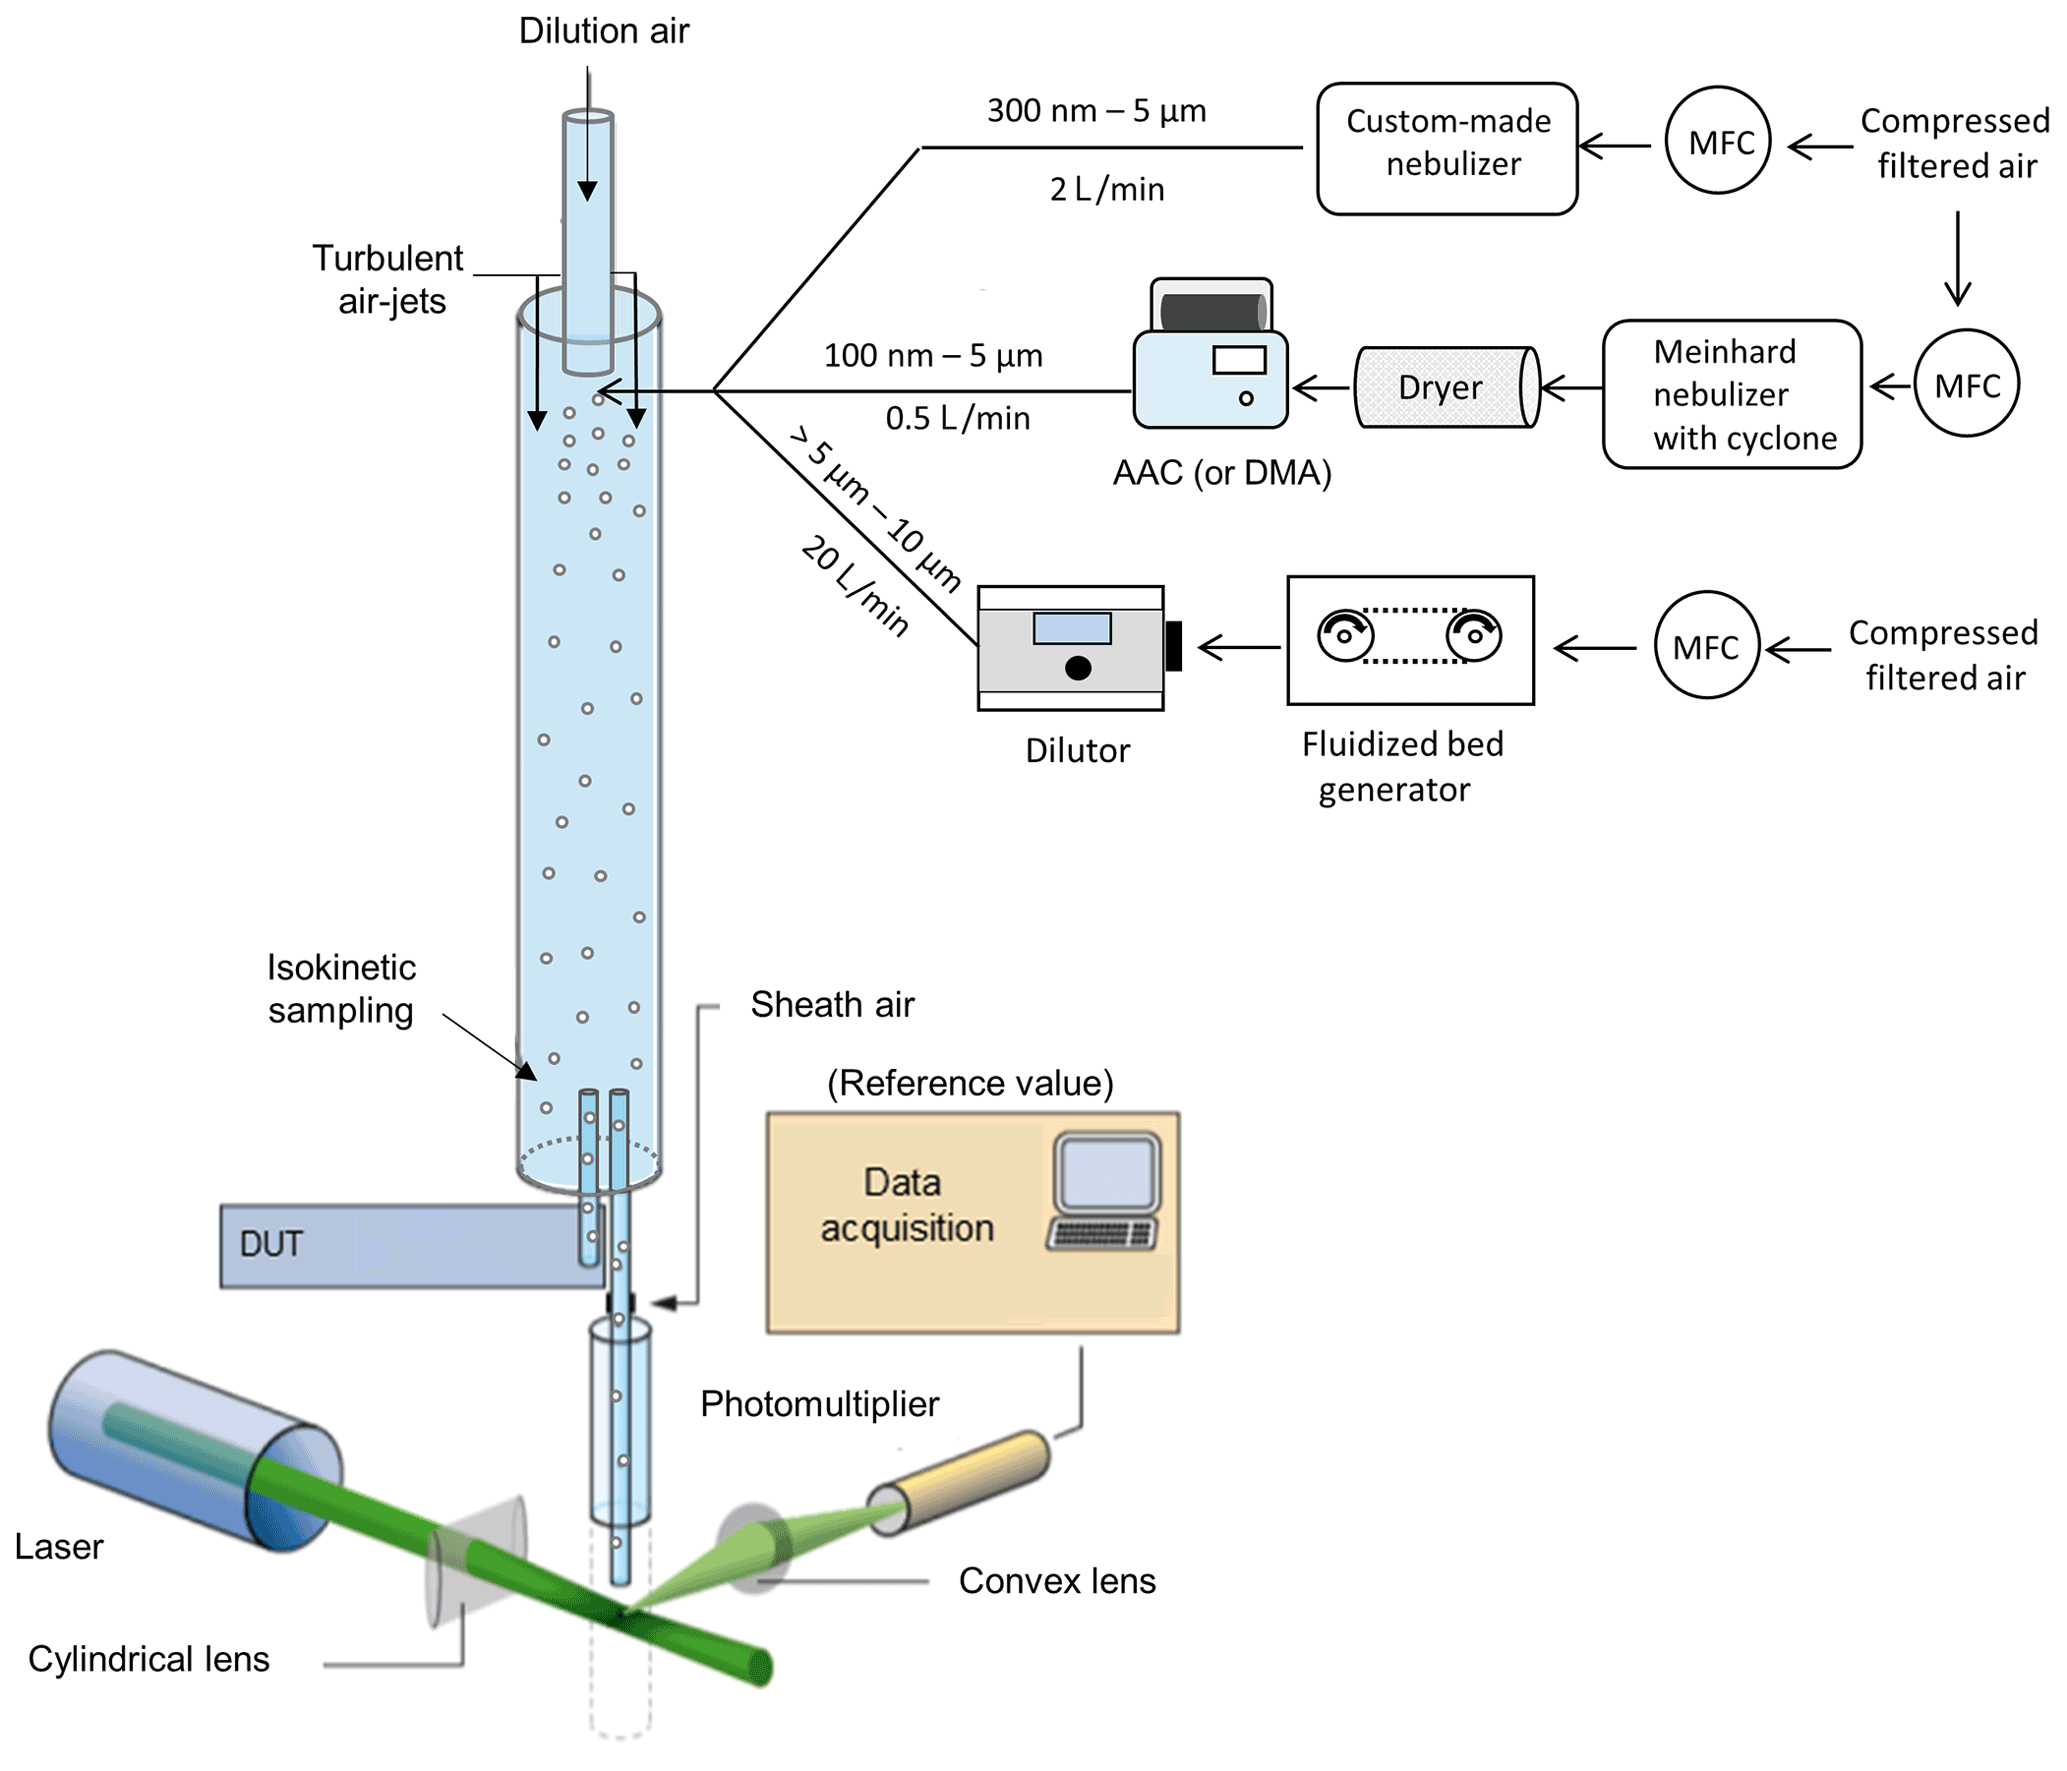
Figure 1Schematic illustration (simplified) of the primary standard at METAS. MFC, DMA, and AAC stand for mass flow controller, differential mobility analyser, and aerodynamic aerosol classifier, respectively. For a more detailed description of the experimental set-up and the isokinetic sampling probes, readers are referred to Horender et al. (2019) and Vasilatou et al. (2021).
The aerosol homogeniser is a 4 m long custom-made stainless-steel tube with an inner diameter of 16.4 cm, placed vertically to prevent deposition losses of large particles. Dry filtered air enters the homogeniser from the top (at a fixed flow rate of 120 L/min) and sweeps the PSL particles down the tube. The particles are subsequently mixed by three turbulent air jets. The air jet injection tubes are placed symmetrically around the homogeniser tube pointing downwards at an angle of 60∘. The flow profile has been characterised using laser Doppler velocimetry (LDV) and was found to be turbulent (plug flow, with negligible effect of the laminar sub-layer). The sampling zone is located 3.0 m downstream of the aerosol injection position and accommodates two isokinetic sample probes, one for the device under test and one for the reference optical particle counter. The aerosol homogeneity at the different sampling ports has been determined experimentally to be within 1.1 % in number concentration (95 % confidence level) (Horender et al., 2019).
The reference detection system consists of a custom-made optical particle counter placed at the outlet of the aerosol homogeniser (Horender et al., 2019). Connection tubes are kept as straight as possible to avoid impaction losses of large particles. The sampled aerosol enters the detection chamber through a nozzle with an orifice of 0.2 mm in diameter and is surrounded by a sheath airflow which prevents the particle beam from diverging. The sampling flow is measured with a traceably calibrated mass flow controller and is kept fixed at 60 mL/min, i.e. at a much lower flow rate than that of the bioaerosol monitors tested. This ensures that coincidence losses, occurring when two or more particles cross the laser beam simultaneously, remain negligible. The laser beam is generated by a continuous-wave laser (Verdi V-5, Coherent, USA) at a wavelength of 532 nm and is focused at the point of intersection with the aerosol stream using a cylindrical lens. Particles crossing the laser light sheet scatter light, which is then detected by a photomultiplier tube placed at 90∘ to the laser beam.
Typical particle number concentrations obtained with this set-up range from 0.5 cm−3 to several hundred particles per cubic centimetre depending on the PSL particle size (Horender et al., 2019). To achieve lower concentrations, a dilution unit can be placed upstream of the device under test (DUT). For example, to test the Swisens Poleno device at lower concentrations (see Sect. 3.1), the PSL number concentration in the aerosol homogeniser was set to about 1 cm−3; the reference particle counter measured the undiluted aerosol at 1 cm−3 to ensure enough particles were counted for statistical analysis, while the Poleno device, which has a much higher sampling flow rate, sampled the diluted aerosol flow. Note that for the calculation of the reference concentration, Cref, the aerosol flow sampled by the reference optical particle counter (OPC) is always converted to volumetric flow at ambient temperature and pressure (23±2 ∘C and 960±10 hPa).
2.2 Droplet Measurement Technologies WIBS-NEO
The WIBS-NEO (new version of the wideband integrated bioaerosol spectrometer) is developed and manufactured by Droplet Measurement Technologies (DMT, Colorado, USA). The device has a sheath flow rate of 2.1 L/min (compared with 2.4 L/min for its predecessor), of which it samples 0.3 L/min and was designed to identify particles in the size range from 0.5–30 µm in diameter. The WIBS-NEO uses two xenon lamps at 280 and 370 nm to excite fluorescence and two channels to detect the corresponding signals (310–400 and 420–650 nm). Furthermore, a 635 nm continuous laser is used for particle counting and sizing. If particle concentration, as detected by the sizing laser, is too high, the dead time of the xenon lamps can introduce a duty cycle substantially below 100 % in the fluorescence measurement. Few studies exist using the WIBS-NEO given its novelty (Hughes et al., 2020), although Forde et al. (2019) recently compared it with the performance of its predecessor, the WIBS-4, with which considerably more studies have been carried out (O'Connor et al., 2014; Perring et al., 2015b; Calvo et al., 2018). The WIBS-NEO employed in our study underwent a service at the manufacturer in early 2017.
2.3 Plair Rapid-E
The Rapid-E is developed and manufactured by Plair SA (Geneva, Switzerland). The Rapid-E device samples 2.8 L/min of air and uses a 400 nm laser to acquire a scattered light signal at 24 angles ranging from 45–135∘. Each particle then interacts twice with a single pulse of a 337 nm laser and the resultant fluorescence is recorded in 32 spectral channels, each at a resolution of 14.51 nm per pixel within a spectral range of 350–800 nm and with eight sequential acquisitions with a retention of 500 ns. This rapid acquisition allows an estimation of the fluorescence lifetime in four spectral bands (350–400, 420–460, 511–572, 672–800 nm) and with a temporal resolution of 2 ns (Kiselev et al., 2013; Crouzy et al., 2016; Šauliene et al., 2019; Chappuis et al., 2019). For this experiment, the Rapid-E was operated in a mode for particles between 0.5 and 100 µm in diameter. In case of excessive noise on the detector, the thresholds are automatically adapted by the instrument, leading to a decreased sensitivity to small particles. Besides its research use, the Rapid-E has been employed operationally for airborne pollen monitoring as part of the RealForAll project (Tešendić et al., 2020). The Rapid-E employed in our study underwent a service in 2018.
2.3.1 Rapid-E particle size determination and spectrum correction
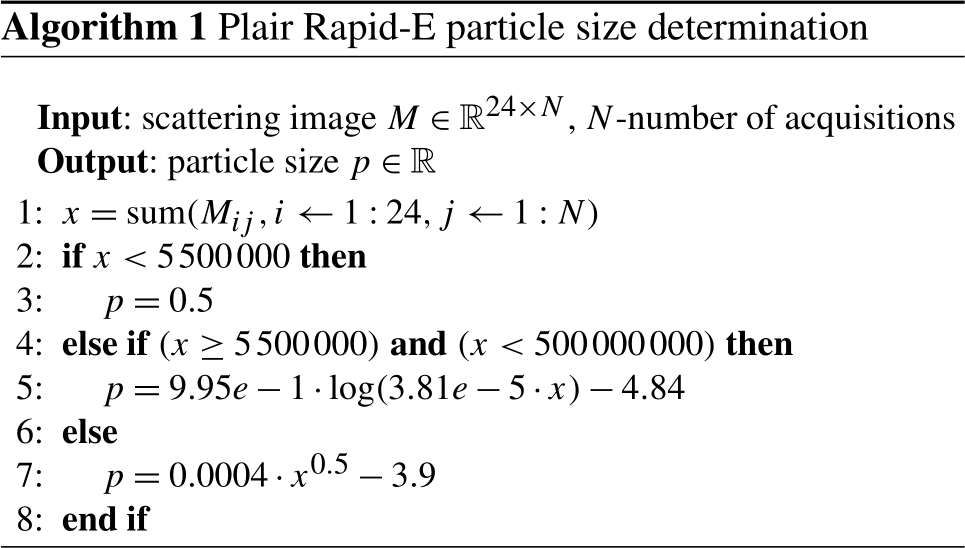
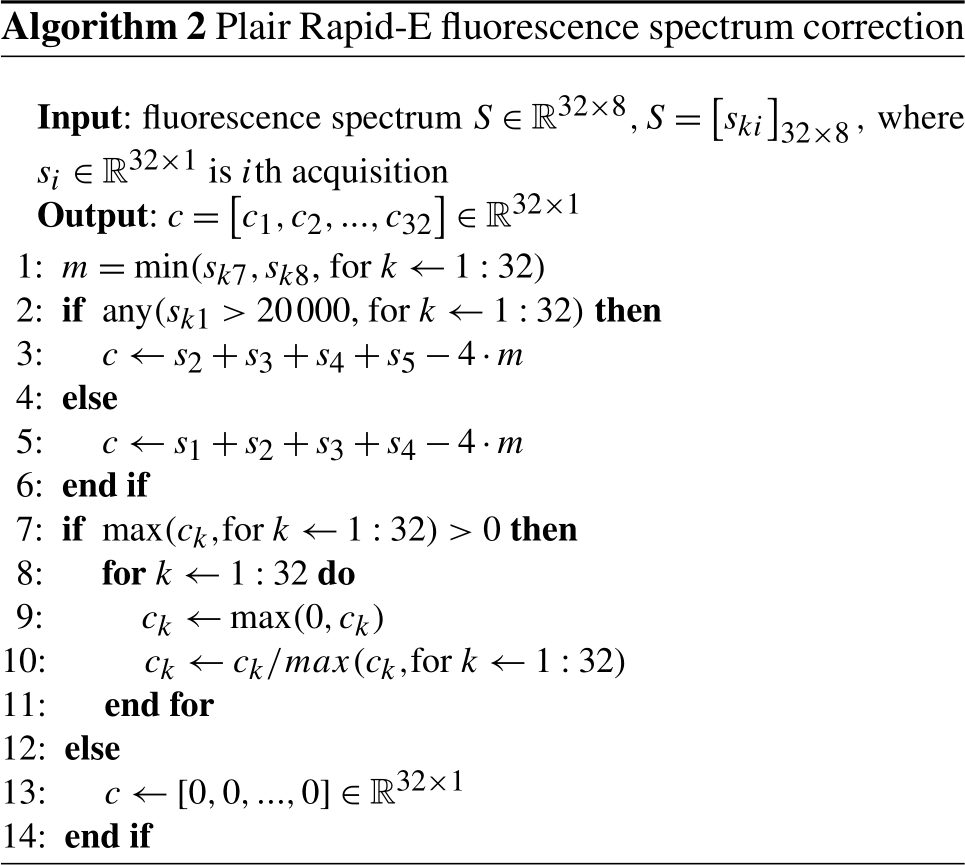
Particle optical diameter was calculated from the intensity of the scattering signal following the relationship provided by the manufacturer and described by Algorithm 1 in Appendix A. Essentially, the optical diameter is assumed to be proportional to the overall intensity of scattering signal by summing the detection over all angles for each particle measured. The fluorescence spectrum from each particle was corrected before the analysis following the manufacturers guidelines using Algorithm 2 in Appendix A.
2.4 Swisens Poleno
The Poleno is developed and manufactured by Swisens AG (Lucerne, Switzerland). The Poleno device makes use of two digital holography cameras to reconstruct an in-focus image of each particle. Thereafter, an LED is employed to excite fluorescence at 280 and at 365 nm, after which the resultant fluorescence is recorded in five channels (335–380, 415–455, 465–500, 540–580, and 660–690 nm). A pump ensures airflows through the instrument at a rate of 40 L/min, while a virtual impactor unit (consisting of multiple virtual impactors in series) serves to concentrate particles with diameter larger than 5 µm (Sauvageat et al., 2020). According to the manufacturer the maximum enhancement factor of the virtual impactor unit is expected to be 1000 (Swisens, personal communication, May 2021). This improves counting statistics for large particles which are found at low number concentrations (typically < 5 cm−3) in ambient air. At the same time, the virtual impactor filters out small particles (<1 µm), thus reducing the risk of coincidence losses. The quality of the images allows a first-level visual verification of particle classification, for example, between pollen and non-pollen, or even in certain cases the identification of easily distinguishable pollen taxa. The Poleno has to date been used only for research purposes, with up to eight different pollen taxa being identified (Sauvageat et al., 2020), although it is currently being implemented across the Swiss operational pollen monitoring network. The Poleno employed in the present study was used as received from the factory.
2.4.1 Poleno particle size determination
The manufacturer does not provide a standardised method to determine particle size. We applied two methods to determine particle diameter. The first method is based on the two holographic images taken of each particle. The average area of the particle is calculated from the two images by counting all pixels that make up the particle. Then, assuming that the particles are spherical, the diameter is computed and converted from pixels to micrometres using the resolution of the holographic images (0.6 µm/pixel). This method is applicable only for particles with diameter of 10 µm and larger; smaller particles cannot be measured with this method because of limitations in the reconstruction software used at the time. For small particles, a second method, using the forward-scattering signal from the trigger laser, is applied. This is done in three steps: the part of the raw signal up to a value of 800 is kept, and then a high-pass filter is applied to remove the base of the signal. A cut-off at a value of 7880 is used, which is roughly equivalent to the median of the first part of the signal for 1 µm particles. Thereafter, the integral of the remaining signal is computed, and the equation d=aIb using the median of the scattered light integral (I) for each particle diameter (d) is fitted, where , and b=0.61 (with a and b having been determined empirically from the presented data).
2.5 Experimental set-up
Eight different types of PSL particles were used to test a range of sizes and fluorescence. Non-fluorescent particles from 0.5 to 10 µm were tested as well as red, blue, and plum purple fluorescent particles (see Table 1 for further details). The fluorescent particles were chosen to correspond to the detection wavelengths of each of the systems tested. PSL particles with diameters up to 2 µm were generated by nebulising suspensions, while larger particles (i.e. 5 and 10 µm) were generated from dry powder using a fluidised bed generator (3400A, TSI Inc., USA). Although necessary for a comprehensive calibration of bioaersol monitors, no standardised method currently exists to produce accurate concentrations of PSL particles of diameter > 10 µm.
Table 1PSL sphere types and nominal diameters, dnom, used in this study.
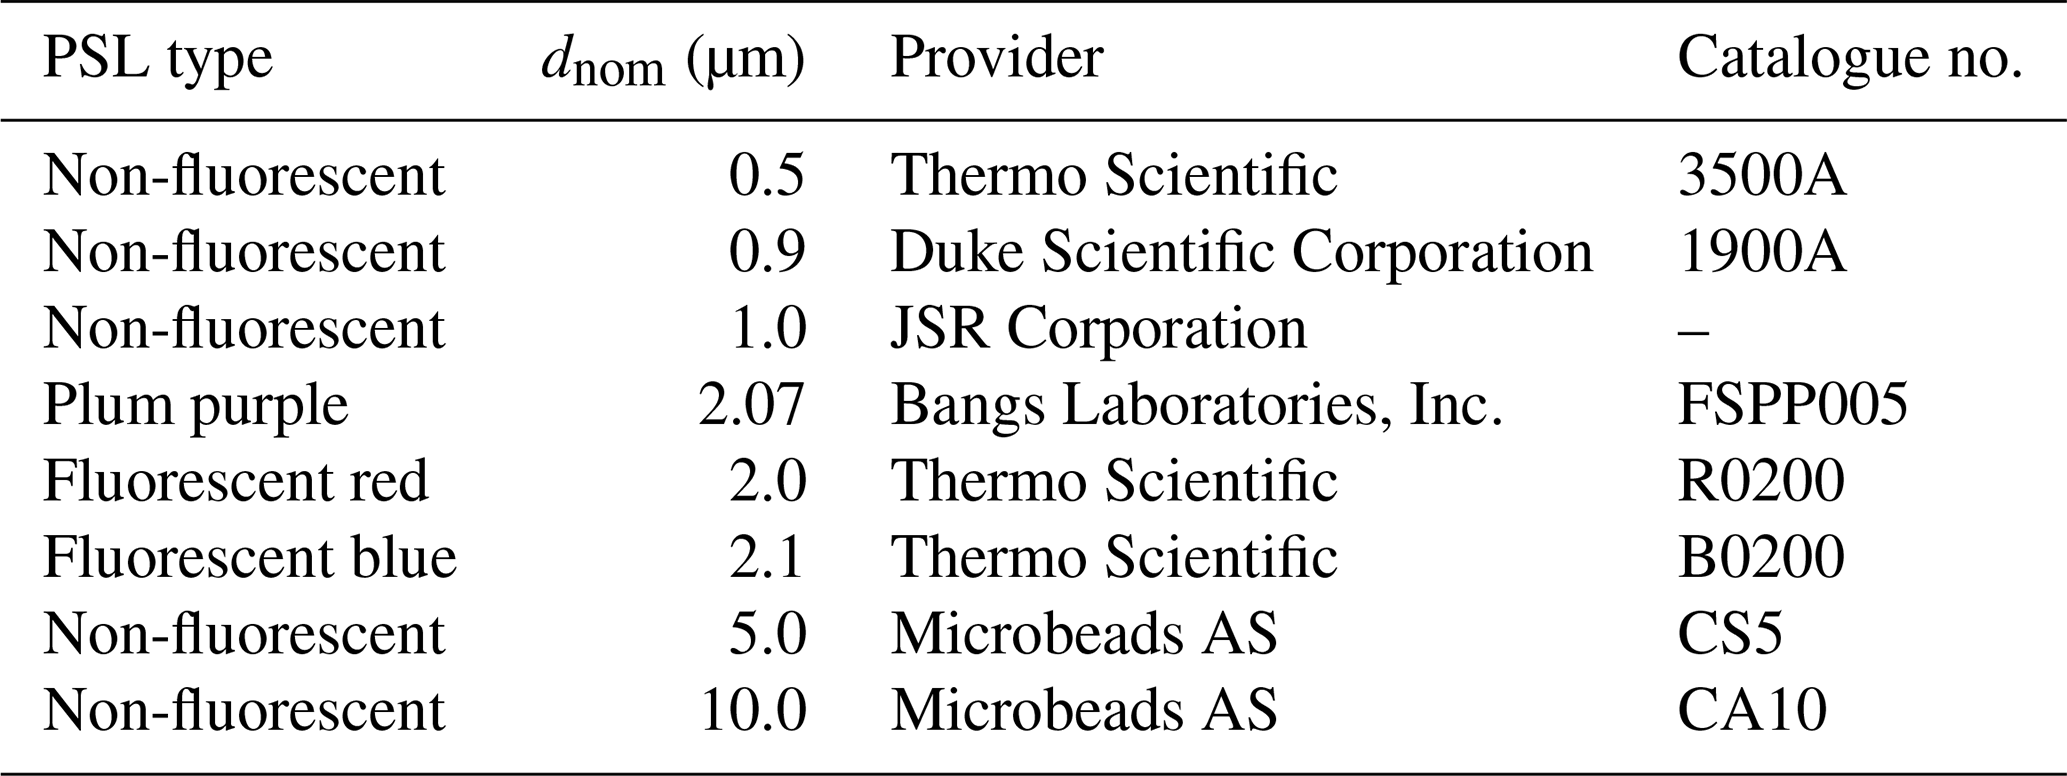
According to the PSL manufacturers, the refractive index of the non-fluorescent and the red and blue fluorescent particles was 1.59 (589 nm, 25 ∘C). No information was available regarding the refractive index of the plum purple PSL particles.
The number concentration measurements were carried out for each PSL by connecting the DUTs to the sampling outlet of the primary standard described in Sect. 2.1. The nominal particle concentration was set to 0.5–2 cm−3 with the DUTs sampling the airflow at the same time as the reference OPC. Once the reference concentration was stabilised, one measurement sequence was carried out for each particle size. Each sequence lasted 20 min, yielding around twenty 1 min concentration values per measurement sequence. Averages for both the reference and DUT were computed from the 1 min resolution time series. The OPC yielded the reference particle number concentration, Cref, with relative expanded uncertainties of 6 %–7 % (coverage factor k=2, 95 % confidence level). For the measurements with the Rapid-E and WIBS-NEO no dilution of the test PSL aerosol was required. However, for the Poleno, which uses a virtual impactor designed to concentrate particles larger than approximately 5 µm, the device has an upper concentration threshold of about 300 000 m−3 (0.3 cm−3), requiring the use of a dilution system. The commercial dilution unit HDS 561 (Topas GmbH, Germany), which can produce high dilution rates and is suitable for particle counters with high-volume flow, was placed upstream of the Poleno when sampling the 10 µm PSL particles.
3.1 Particle number concentration
3.1.1 Counting efficiency
The counting efficiency, EDUT, is calculated as , with , where Ci,DUT and Ci,ref are the number concentrations measured by the DUT and the reference optical particle counter, respectively, and N being the total number of measurements (typically 25). Because of the higher flow rates and therefore higher particle counts registered by the DUT compared to the reference counter, the statistical uncertainties in CDUT are expected to be small (<10 %). It must be noted, however, that bioaerosol monitors can also suffer from large systematic errors, for instance, due to uncertainties in the aerosol flow rate, coincidence losses, impaction losses in the sampling system, misalignment of the laser beam, and size-dependent particle losses in the concentrator. These systematic errors are in practice much larger than the statistical uncertainty in CDUT or the uncertainty in Cref (6 %–7 %).
Table 2Average particle concentrations measured by the three devices tested (CDUT), the reference optical particle counter (Cref), and counting efficiency of the devices tested (EDUT). U denotes the expanded uncertainty (95 % confidence level) of the counting efficiency.
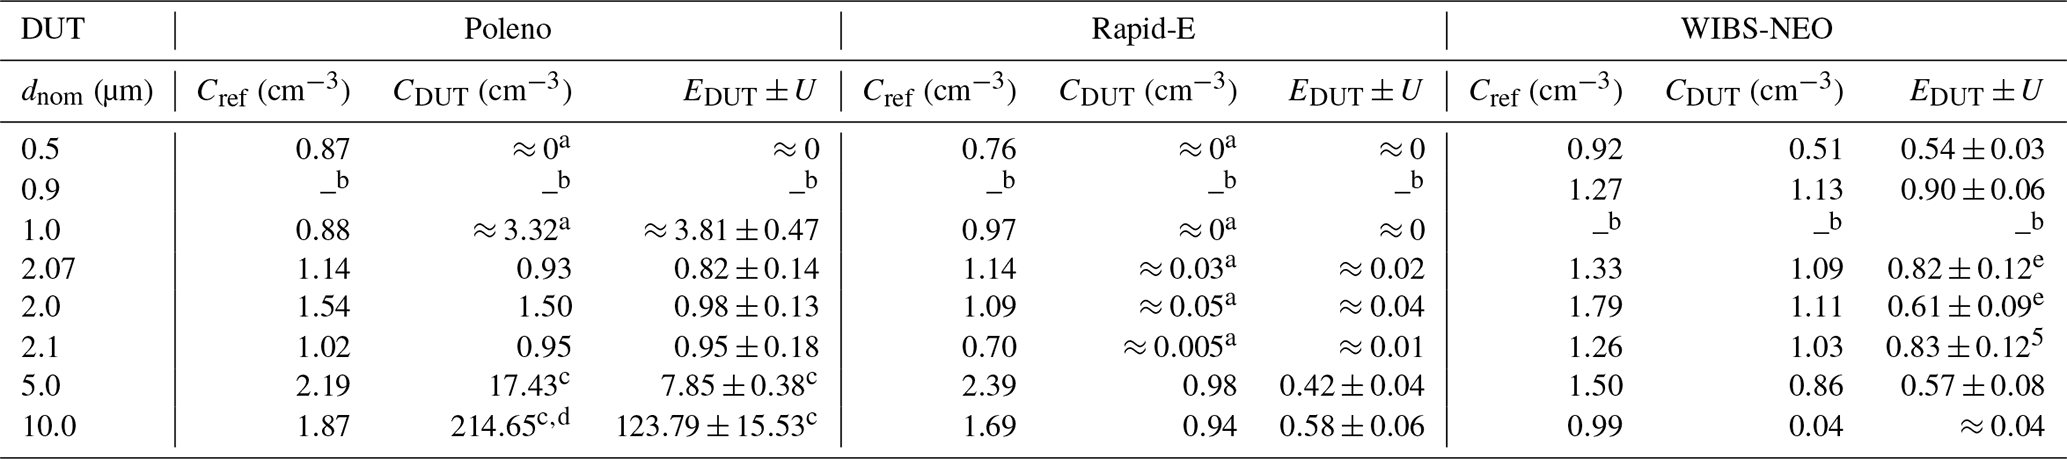
a The particle size is below or at the detection limit of the instrument. b The measurement sequence was defective or not performed. c Particle concentrator enhances the concentration of particles larger than 5 µm. Thus counting efficiency values larger than 1 is possible. The enhancement factor is particle-size-dependent and has a theoretical maximum of 1000. d Measurements were performed using a dilutor with a dilution factor of 55:1 (see Sect. 2.5 for further details.) e The suspensions of the fluorescent PSL particles contained a considerable number of additives, giving rise to a large peak of residue particles, which slightly overlapped with the peak of the PSL particles. It is also possible that the PSL particles have a thin organic coating due to the additives. In that case, the PSL diameter after nebulisation of the PSL suspension will be slightly larger than the geometric diameter reported by the manufacturers. The measurement uncertainties have been increased to account for a possible bias in the determination of the counting efficiency.
For small particles, the counting efficiency of the WIBS-NEO increases with particle diameter from 54 % for 0.5 µm to a maximum of 90 % for particles with 0.9 µm diameter (Table 2). This is in line with the results of Healy et al. (2012), who found counting efficiencies of 50 % and 100 % for particles 489 and 690 nm in diameter, respectively. Beyond the peak at 0.9 µm, the counting efficiency tends to drop with increasing particle diameters (61 %–83 % at 2 µm and 57 % for 5 µm particles; Table 2). The WIBS-NEO appears to reach an upper detection limit for particles larger than 10 µm, detecting just 4 % of the particles with a diameter of 10 µm compared to the reference counter. This observed drop in the detection rate for bigger particles is somewhat surprising since the WIBS-NEO is expected to be able to detect particles up to 30 µm. Although the exact reasons for this behaviour are unclear, it cannot be ruled out that the specific WIBS-NEO used in our study required a technical service by the manufacturer.
The Rapid-E shows a maximum counting efficiency of 58 % for the 10 µm PSL, while at 5 µm diameter 42 % of the particles are detected. The lower detection limit was found to be around 2 µm, where only 1 % to 4 % of the particles are detected. At 1 µm diameter, almost no PSLs are detected by the Rapid-E (Table 2).
The Poleno does not detect particles with 0.5 µm diameter and appears to have its lower detection limit at approximately 1 µm, where the counting efficiency is 3.81 (Table 2). This increased counting efficiency is potentially because the trigger laser was set too sensitively, resulting in noise being counted as particles during the 1 µm measurement sequence. At 2 µm the Poleno performs well, with a counting efficiency ranging from 82 %–98 %. However an effect of the concentrator on the measurements for particles at 2 µm diameter cannot be ruled out. Note that the counting efficiency of the Poleno strongly depends on the performance of the virtual impactor, also at small particle sizes. Small shifts in the cut-off curve of the impactor can have a large effect on the counting efficiency, for example, at 2 µm. For larger particles, the concentration measured by the Poleno is strongly enhanced due to the concentrator unit. It is expected that the plateau values of the concentrator's enrichment curve are quite robust and could be used to correct concentration values with reasonably small uncertainty. However, the plateau efficiency could not be determined with the tested PSL diameters. For particles with 5 µm diameter a concentration factor of 7.85 and for the particles with 10 µm diameter a factor of 123.79 was observed, which is still far below the theoretical maximal enhancement factor of 1000. This indicates that both tested diameters (5 and 10 µm) are on the lower end of the cut-off curve (Fig. 2b). It is therefore not recommended to use the values in Table 2 to correct the concentration of the Poleno measurements within this size range.
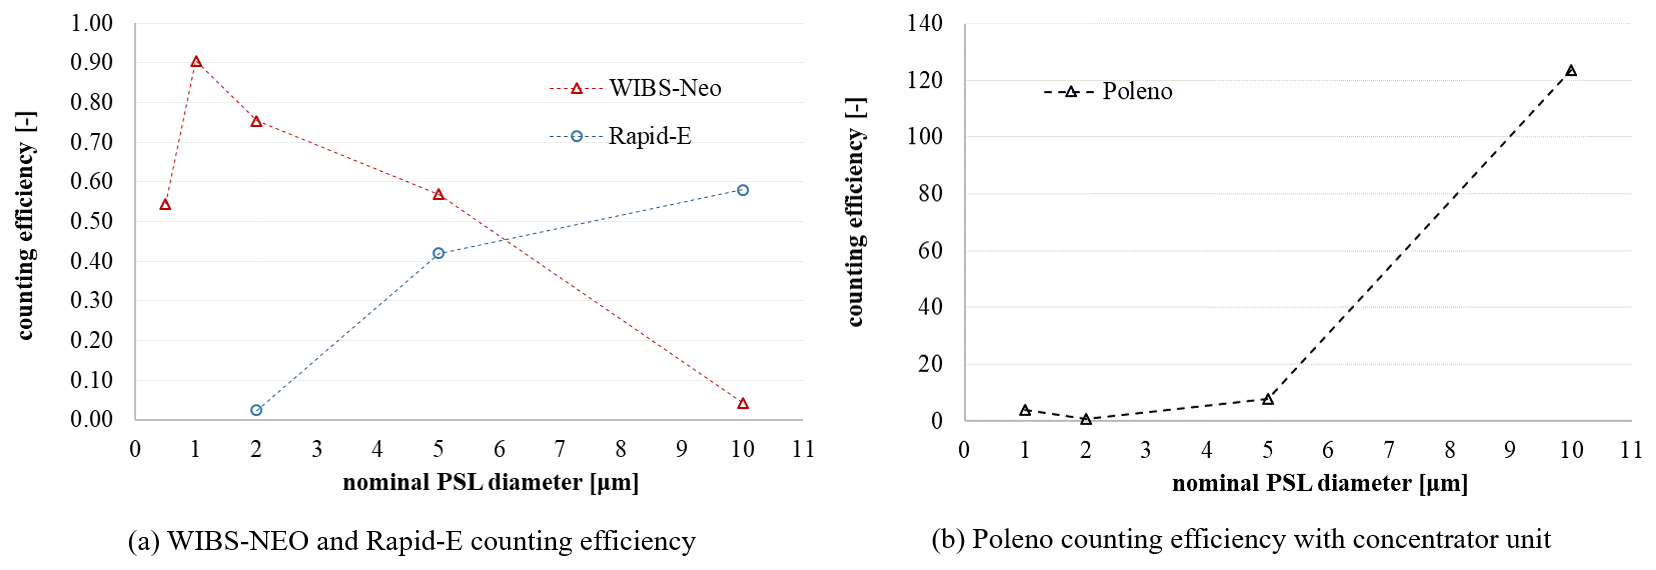
Figure 2Counting efficiency for the three devices at different particle sizes. The value at 2 µm diameter is the mean value of the three measurement sequences at 2.0, 2.07, and 2.1 µm (i.e. red, plum purple, and blue, respectively).
3.1.2 Uncertainty and stability
A counting efficiency that is too low or high does not mean that a particular device is unable to provide valuable measurements in practice. If the counting efficiency is well known and stable, a scaling curve over the relevant size range can be determined for each instrument. To evaluate whether measurements are indeed scalable, we compute the root mean square error deviation (RMSD) between the scaled reference and DUT counts. The RMSD is a combination of the uncertainties from the reference and DUT measurements as well as from other potential uncertainties related to the experimental set-up. Since we cannot precisely assign the error to each of the potential sources we assume that the DUT is the only source of error, and thus we can interpret the RMSD as an upper bound of the error for each instrument. The lower the RMSD the better the measurements are suited for scaling without significantly increasing the uncertainty. The RMSDs for the different measurement sequences with all particle diameters are given in Table 3.
Table 3Root mean square deviation (RMSD) between the scaled DUT and the scaled reference concentration measurements. Both time series where scaled by dividing with their own average before computing the RMSD.

a The particle size is below or at the detection limit of the instrument. b Measurements were performed using a dilutor with a dilution factor of 55:1 (see Sect. 2.5 for further details.).
Out of the three devices tested, the WIBS-NEO is the only one able to perform robust measurements for particles with diameters from 0.5 to 2 µm (RMSD between 10 % and 14 %). For particles with larger diameters, the RMSD increases to 25 % for the 5 and 10 µm PSL (Fig. 3). The Rapid-E shows an RMSD of 25 %–29 % for particles with diameters between 2 and 10 µm. For the 1 µm particles the RMSD of 89 % indicates that the measurements are noisy and thus below the detection limit of the device. The Poleno shows relatively high RMSD values of 30 %–39 % for the 2 µm particles but a lower RMSD of 12 % for the 5 µm particles. At 10 µm, the RMSD is slightly higher, at 20 %.
Note that all values are based on relatively small statistical samples (≤30 measurement points). It also has to be mentioned that the scaling factor can be very sensitive to particle size. In such a case, the capability of determining the particle size becomes an important uncertainty factor when scaling the concentrations.
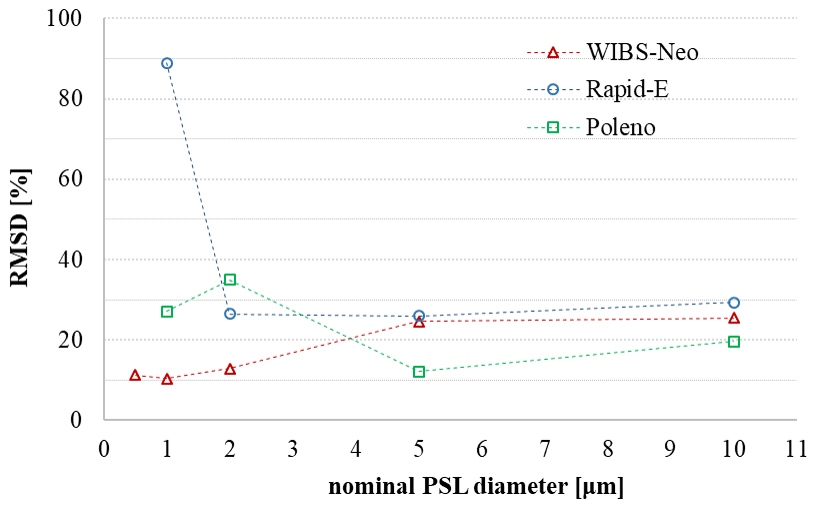
Figure 3Root mean square deviation between normalised DUT and reference measurements. The value for 2 µm is the mean value of the three measurement sequences with similar diameter (2.07, 2, and 2.1 µm).
3.2 Particle size determination
Each of the devices tested produces a scattering signal which can be used to estimate the particle size. While the devices are not specifically designed to do so, the measurements provide an indication of how accurate the optical detection of particles is. If the size distribution, measured for a specific PSL size, shows a well-defined peak this gives an indication that the DUT is able to detect particles of that size accurately.
3.2.1 Droplet Measurement Technologies WIBS-NEO
The WIBS-NEO has well-distinguished peaks at 0.9, 1, 5, and 10 µm (Fig. 4b and d) and thus appears to provide precise sizing for each particle within this size range. Deviations in (geometric) mean optical diameter measured for a certain PSL sample from nominal geometric diameter are small and within uncertainty in optical sizing methods. The measurement at 0.5 µm shown in Fig. 4a may be truncated at the small size end due to the lower size detection limit of the WIBS (see also counting efficiency results in Sect. 3.1.1). Interestingly, the different types of PSL particles tested appear to impact the measurements to a certain extent. In particular, for the 2 µm particles, the red PSLs show a peak at 3.3 µm, while the plum purple and blue PSL peaks are closer to the actual particle optical diameters of 2.3 and 2.2 µm, respectively (Fig. 4c). The variation in measured (geometric) mean diameters for the three different PSL samples with nominal geometric diameters between 2.0 and 2.1 µm is considerably greater than the expected optical sizing precision. In particular the red PSLs appear at around 1.6 times the nominal size. This suggests a larger scattering cross-section of the red PSLs compared to the blue and plume purple PSLs at the wavelength of the sizing laser (635 nm).

Figure 4Size distribution estimated by the WIBS-NEO for different PSL particles with diameters ranging from 0.5–10 µm.
3.2.2 Plair Rapid-E
The Rapid-E was unable to detect 1 µm particles and does not show a distinct peak for any of the 2 µm PSLs either. For these particles the size distribution curve shows no clean peak (Fig. 5a), indicating that the detection limit is likely above 2 µm for this device. The peak for the 5 µm particles is well defined and therefore indicates that the Rapid-E is able to accurately detect particles in this size. For the size distribution of the 10 µm diameter particles, a first narrow peak just below 5 µm and a second broader peak at 10 µm with a large tail towards smaller diameters can be observed in Fig. 5b. The large tail towards lower sizes could be an indication of a misalignment of the laser. The discontinuity of the size distributions at 5 µm in Fig. 5b is a direct consequence of using an intensity-to-particle relationship with a discontinuous first derivative (Fig. 7, Algorithm 1 in Appendix A). This suggests potential for improving the sizing method for particles with diameters smaller than 10 µm, but this was not within the scope of this study.
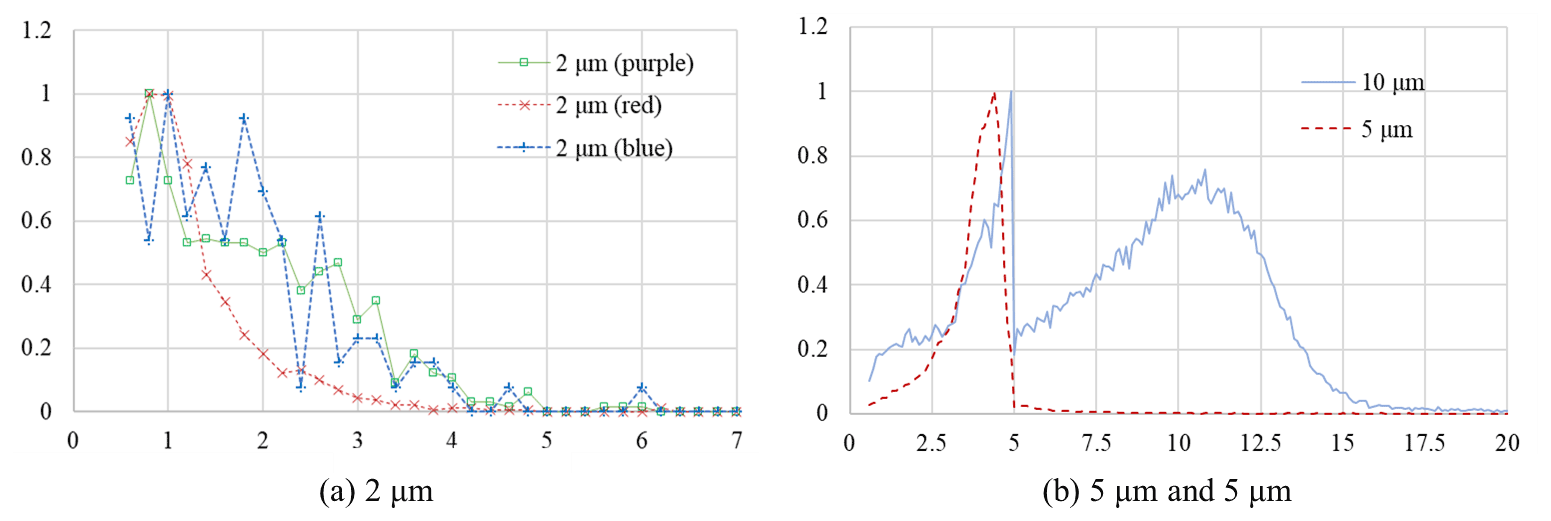
Figure 5Size distribution estimated by the Plair Rapid-E for different PSL particles with diameters ranging from 2–10 µm.
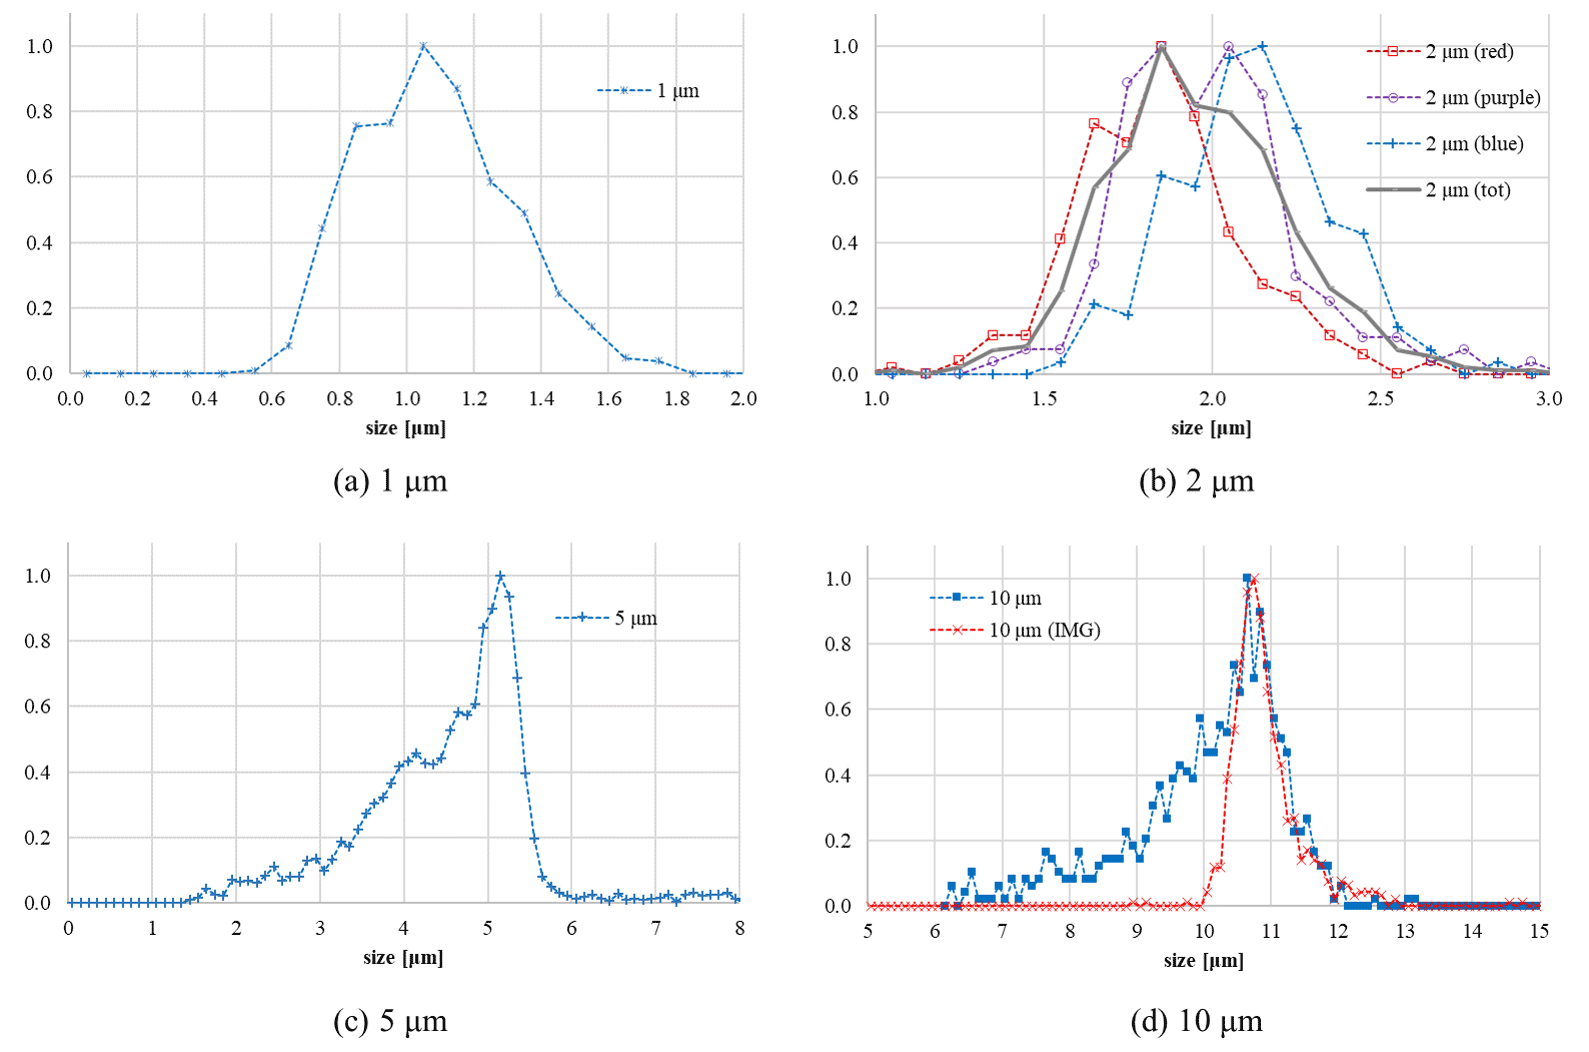
Figure 6Size distribution estimated by the Swisens Poleno for different PSL particles with diameters ranging from 1–10 µm. The estimates were computed based on the trigger laser signal, except for the “10 µm (IMG)” curve in (d), where the image-based method was used.
3.2.3 Swisens Poleno
The Swisens Poleno is unable to detect 0.5 µm diameter particles. For the 1 µm diameter PSL particles, the size distribution shows a well-defined peak at 1.05 µm (Fig. 6a), indicating that the device is able to distinguish particles in this size range well. At 2 µm diameter (Fig. 6b), the size distributions show well-defined peaks for the red, plum-purple, and blue particles, with slight differences in positioning around 2 µm. The 5 µm size distributions show a well-defined peak, although the size is slightly overestimated (Fig. 6c). The 10 µm particle size distribution also shows a well-defined peak, but again the size is overestimated at about 10.7 µm. The shoulder of the 5 and 10 µm size distributions at smaller particle sizes may indicate the need to realign the laser and particle beams and/or the detection optics. When comparing the two methods of particle size estimation used for the Poleno device (see Sect. 2.4.1), the method based on the holographic images results in a very clean and sharp peak compared to the trigger signal method (Fig. 6d). This suggests that the image-based method should be used for the Poleno device for large particles.
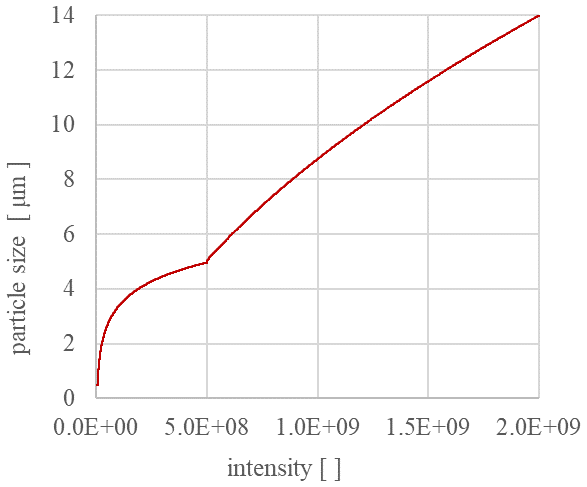
Figure 7The relationship between light-scattering intensity and particle size for the Plair Rapid-E as recommended by the manufacturer. Note that two different equations are used to calculate size for particles smaller and larger than 5 µm in diameter, respectively.
3.3 Fluorescence measurements
The fluorescent response after excitation at different wavelengths is evaluated on the DUT's using three different PSL particles (blue, plum purple, and red) with 2 µm diameter. These measurements were then compared to reference data from the Max Planck Institute for Chemistry (Könemann et al., 2018). The intensity values obtained from the devices tested were scaled to the reference curve with high spectral resolution. The peaks due to first- and second-order elastic scattering were removed from the reference data as well as from each device tested (e.g. for excitation at λ=365 nm, the peaks at λ=365 nm and at 2λ=730 nm were removed).
Since the WIBS-NEO only detects signals in two channels (310–400 and 420–650 nm) a maximum of two data points per excitation wavelength are obtained. One of these points is used to scale to the reference values, so only one value remains to evaluate the signal. No meaningful analysis is thus possible, and no further assessment was performed for this device for fluorescence.
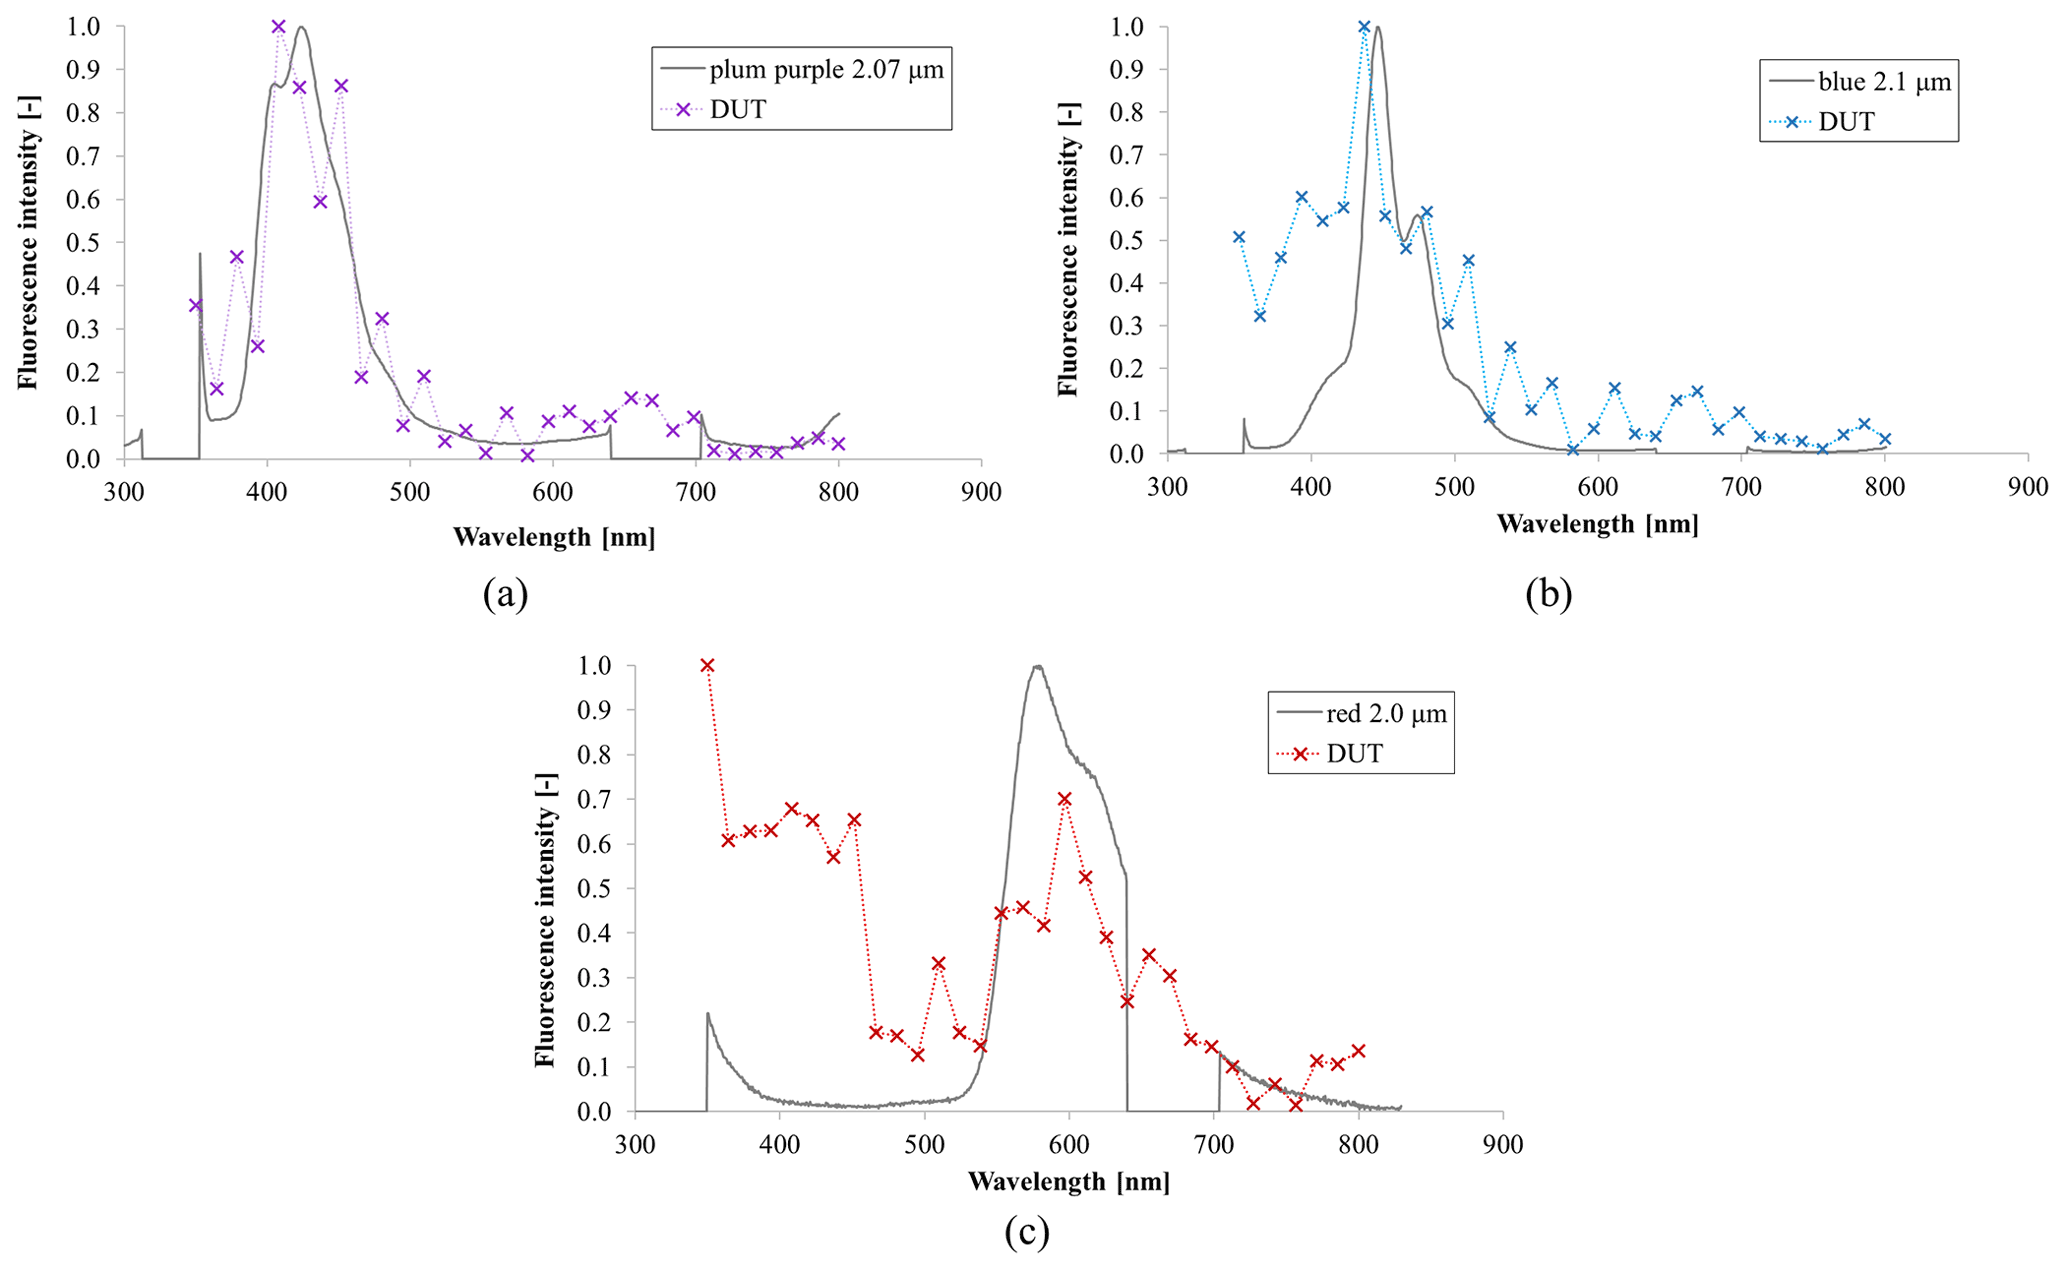
Figure 8Comparison of the Rapid-E fluorescence measurements (DUT) with the reference measurements from Könemann et al. (2019) for (a) plum purple PSL particles with expected peak at 422 nm, (b) blue PSL particles with expected peak at 447 nm, and (c) red PSL particles with expected peak at 582 nm. All measurements are scaled to a maximum value of 1.
3.3.1 Plair Rapid-E
The Rapid-E's fluorescence spectra correspond relatively well with those from the reference data (Fig. 8). For the plum purple PSL particles (λ=425 nm) both the reference and Rapid-E exhibit a broad peak in the range λ=400–450 nm, with the Rapid-E slightly shifted towards longer wavelengths. For the blue PSL particles (λ=447 nm) the opposite is true, with the Rapid-E signal slightly shifted towards shorter wavelengths and with a significant tail in this direction. The red PSL particles (λ=579 nm) show a less defined peak in the expected range (around 580 nm), but there is a strong signal from 400–450 nm, where no peak is seen in the reference data.
Table 4Number and percentage of particles with “almost correct” fluorescence peak position measured by the Rapid-E. Two cases are distinguished: ±10 and ±20 nm deviation from the reference peak wavelength.
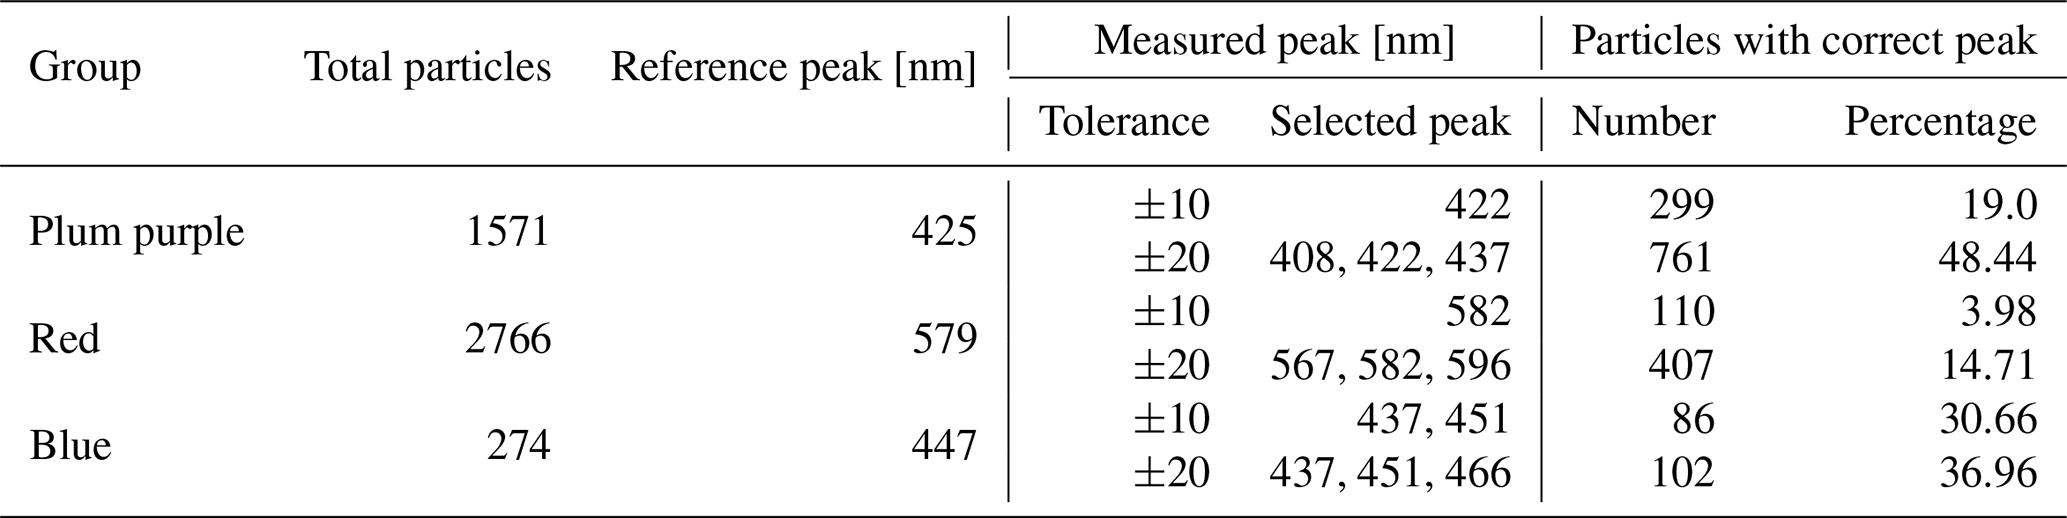
Table 4 shows the percentage of particles measured by the Rapid-E with peak fluorescence emission at the correct wavelength. Despite the spectra not showing peaks at the expected wavelengths, a notable number of measured particles show maximum fluorescence at these wavelengths.
3.3.2 Swisens Poleno
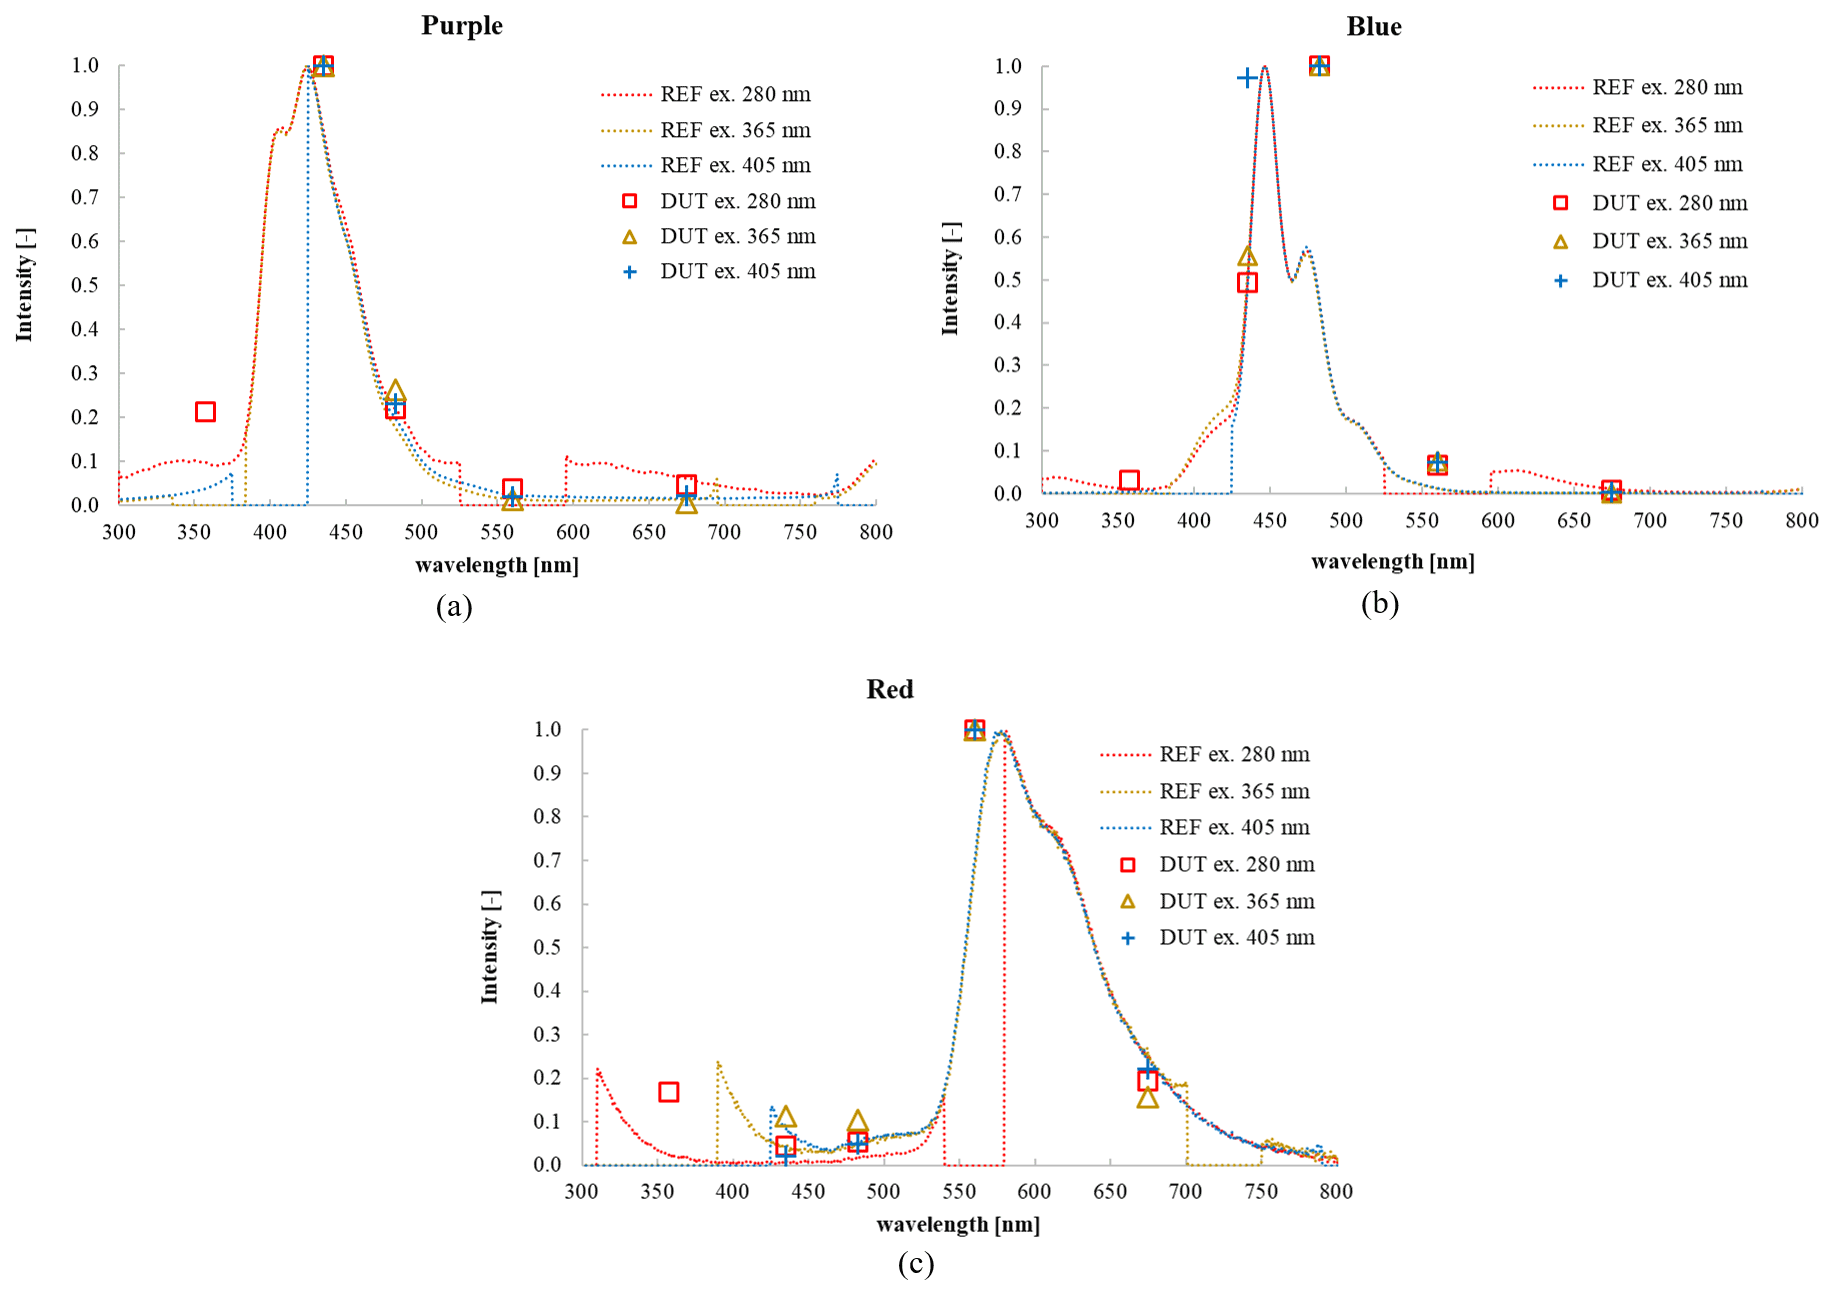
Figure 9Comparison of the reference (REF) fluorescence measurements from Könemann et al. (2019) to the measurements with the Poleno instrument (DUT). All measurements are scaled to a maximum value of 1.
The reference data, when averaged for the different Poleno windows, are very similar for all excitation wavelengths once the first- and second-order elastic scattering peaks have been removed (Fig. 9). Overall, the Poleno compares well with the reference data for the three different PSLs tested. The limited spectral resolution of the device does not allow the same level of comparison as the Rapid-E; however, the available measurement points are all close to the reference data. Note that the values for the 335–380 nm detection window are discarded as a result of the first-order elastic scattering, so no points are shown for this wavelength range.
Three commercially available bioaerosol monitors were tested for their ability to detect and count particles at different sizes and for the accuracy of their fluorescence measurements. A range of different polystyrene (PSL) particles were tested in a state-of-the-art calibration facility at the Federal Institute for Metrology (METAS).
The DMT WIBS-NEO showed very good counting efficiency for particles with diameters of 1 µm; however, as particle size increases its detection performance was shown to drop considerably. This result was somewhat unexpected, and this issue remains to be investigated in more depth. The Plair Rapid-E was shown to be better suited for detecting larger particles, with detection performance increasing with particle size. The counting efficiency of the Poleno detection system could not be accurately estimated since the integrated virtual impactor unit was found to work at the lower end of the cut-off curve for the tested particle sizes. In order to determine the plateau efficiency of the virtual impactor unit, further measurements with larger particle sizes are necessary.
The RMSD analysis of the different measurement sequences confirms that the WIBS-NEO performs best for smaller particles ( µm). Only the measurement sequence from the Poleno at 5 µm and possibly at 10 µm showed similarly low RMSD values (10 %–20 %). The particle size determination of the WIBS-NEO agreed with the reference, with well-shaped particle size distribution curves for all tested particles. However, for the fluorescent 2 µm particles, the red particles were estimated to be considerably larger than the blue and plum purple particles. Whether this is an effect of a stronger scattering response due to the particle colour or an effect of the particle being coated in additives and becoming physically bigger is speculative at this point and should be investigated further. For the Rapid-E device, the algorithm for determining particle size delivered by the manufacturer led to some artefacts in the size distribution curve. This method could be improved to obtain more robust results since the measurements are likely to be sufficient to do so. Finally, two methods of size determination were tested for the Poleno device. It was shown that the image-based approach works better than the scattering signal one; however, it can only be applied to larger particles.
Results show that the detection limit of the WIBS-NEO is below 0.5 µm diameter, the smallest particle size tested here. In contrast, the minimum detection limits for the other two instruments appear to be between 0.5 and 1 µm in diameter for the Poleno and between 2 and 5 µm diameter for the Rapid-E. More studies are needed to investigate the unit-to-unit variability in the Poleno, Rapid-E, and WIBS-NEO bioaerosol monitors. It is known that inadequate maintenance can affect both the sizing accuracy and the counting efficiency of light-scattering instruments (Vasilatou et al., 2021).
The Rapid-E fluorescence measurements compare well with the reference data, even tough the signal-to-noise ratio seems to be elevated for the red PSL particles. The Poleno device aligns well with the reference data and shows a very good correlation. Nevertheless, the coarse spectral resolution of the Poleno does not allow as precise a comparison as for the Rapid-E. A validation of the WIBS-NEO fluorescence observations was not possible because of the very low spectral resolution of the device. In future the stability of the fluorescence measurements in time and amongst different devices of the same type should be tested.
Our results show that the three devices tested all have different strengths and weaknesses which need to be taken into account when considering an instrument for a specific application. In terms of pollen monitoring, it would be relevant to test even larger particles (e.g. 20 µm), particularly since the Rapid-E and Poleno were developed to detect airborne pollen, which typically has diameters ranging from 10–100 µm in size. At present, no methods exist to produce accurate concentrations of PSL particles of this size nor, of even greater interest, of fresh pollen particles. These challenges remain to be resolved to allow standardised calibration of bioaerosol monitors for their target particle size and thus to more fully understand what is present under real atmospheric conditions.
Data and algorithms presented in this paper are experimental and subject to further development. They are available for research purposes on request to the authors of the paper.
KA, BenC, FT, and KV designed and carried out the experiments. KA, KV, JM, DO, BS, AM, GL, BerC, and FT contributed to the data analysis. All authors contributed to the interpretation of the results and to writing this paper.
The contact author has declared that neither they nor their co-authors have any competing interests.
Publisher's note: Copernicus Publications remains neutral with regard to jurisdictional claims in published maps and institutional affiliations.
This work is a contribution to the EUMETNET AutoPollen Programme. Part of this work was carried out within the Aeromet 2 project, which has received funding from the EMPIR programme. The EMPIR programme is co-financed by the participating states and from the European Union's Horizon 2020 research and innovation programme. Branko Sikoparija acknowledges financial support from the Ministry of Education, Science and Technological Development of the Republic of Serbia and the BREATHE project funded by the Science Fund of the Republic of Serbia.
This research has been supported by the European Metrology Programme for Innovation and Research through the grant agreement 19ENV08 AEROMET II; the Ministarstvo Prosvete, Nauke i Tehnološkog Razvoja (grant no. 451-03-9/2021-14/200358); and the Science Fund of the Republic of Serbia (grant no. 6039613).
This paper was edited by Zamin A. Kanji and reviewed by Ghislain Motos and one anonymous referee.
Buters, J., Antunes, C., Galveias, A., Bergmann, K., Thibaudon, M., Galán, C., Galán, C., Schmidt Weber, C., and Oteros, J.: Pollen and spore monitoring in the world, Clin. Transl. Allergy, 8, https://doi.org/10.1186/s13601-018-0197-8, 2018. a
Calvo, A., Baumgardner, D., Castro, A., Fernández-González, D., Vega-Maray, A., Valencia-Barrera, R., Oduber, F., Blanco-Alegre, C., and Fraile, R.: Daily behavior of urban Fluorescing Aerosol Particles in northwest Spain, Atmos. Environ., 184, 262–277, https://doi.org/10.1016/j.atmosenv.2018.04.027, 2018. a
Chappuis, C., Tummon, F., Clot, B., Konzelmann, T., Calpini, B., and Crouzy, B.: Automatic pollen monitoring: first insights from hourly data, Aerobiologia, 36, 159–170, 2019. a
Crouzy, B., M., S., Konzelmann, T., Calpini, B., and Clot, B.: All-optical automatic pollen indentification: Towards an operational system, Atmos. Environ., 140, 202–212, 2016. a, b
D'Amato, G., Cecchi, L., Bonini, S., Nunes, C., Annesi-Maesano, I., Behrendt, H., Liccardi, G., Popov, T., and Van Cauwenberge, P.: Allergenic pollen and pollen allergy in Europe, Allergy, 62, 976–990, https://doi.org/10.1111/j.1398-9995.2007.01393.x, 2007. a
Foot, V. E., Kaye, P. H., Stanley, W. R., Barrington, S. J., Gallagher, M., and Gabey, A.: Low-cost real-time multiparameter bio-aerosol sensors, in: Optically Based Biological and Chemical Detection for Defence IV,International Society for Optics and Photonics, vol. 7116, p. 71160I, 2008. a
Forde, E., Gallagher, M., Walker, M., Foot, V., Attwood, A., Granger, G., Sarda-Estève, R., Stanley, W., Kaye, P., and Topping, D.: Intercomparison of Multiple UV-LIF Spectrometers Using the Aerosol Challenge Simulator, Atmosphere, 10, 797, https://doi.org/10.3390/atmos10120797, 2019. a
Gabey, A. M., Gallagher, M. W., Whitehead, J., Dorsey, J. R., Kaye, P. H., and Stanley, W. R.: Measurements and comparison of primary biological aerosol above and below a tropical forest canopy using a dual channel fluorescence spectrometer, Atmos. Chem. Phys., 10, 4453–4466, https://doi.org/10.5194/acp-10-4453-2010, 2010. a
Galán, C., Smith, M., Thibaudon, M., Frenguelli, G., Oteros, J., Gehrig, R., Berger, U., Clot, B., and Brandao, R.: Pollen monitoring: minimum requirements and reproducibility of analysis, Aerobiologia, 30, 385–395, https://doi.org/10.1007/s10453-014-9335-5, 2014. a
Healy, D. A., O’Connor, D. J., and Sodeau, J. R.: Measurement of the particle counting efficiency of the “Waveband Integrated Bioaerosol Sensor” model number 4 (WIBS-4), J. Aerosol Scie., 47, 94–99, 2012. a
Hernandez, M., Perring, A. E., McCabe, K., Kok, G., Granger, G., and Baumgardner, D.: Chamber catalogues of optical and fluorescent signatures distinguish bioaerosol classes, Atmos. Meas. Tech., 9, 3283–3292, https://doi.org/10.5194/amt-9-3283-2016, 2016. a
Hirst, J. M.: An automatic volumetric spore trap, Ann. Appl. Biol., 39, 257–265, https://doi.org/10.1111/j.1744-7348.1952.tb00904.x, 1952. a
Horender, S., Auderset, K., and Vasilatou, K.: Facility for calibration of optical and condensation particle counters based on a turbulent aerosol mixing tube and a reference optical particle counter, Rev. Sci. Instrum., 90, 075111, https://doi.org/10.1063/1.5095853, 2019. a, b, c, d, e, f
Huffman, J. A., Perring, A. E., Savage, N. J., Clot, B., Crouzy, B., Tummon, F., Shoshanim, O., Damit, B., Schneider, J., Sivaprakasam, V., Zawadowicz, M. A., Crawford, I., Gallagher, M., Topping, D., Doughty, D. C., Hill, S. C., and Pan, Y.: Real-time sensing of bioaerosols: Review and current perspectives, Aerosol Sci. Tech., 54, 465–495, https://doi.org/10.1080/02786826.2019.1664724, 2019. a
Hughes, D. D., Mampage, C. B. A., Jones, L. M., Liu, Z., and Stone, E. A.: Characterization of Atmospheric Pollen Fragments during Springtime Thunderstorms, Environ. Sci. Tech. Let., 7, 409–414, https://doi.org/10.1021/acs.estlett.0c00213, 2020. a
Jaeger, S.: The trouble with threshold values for allergy forecasts, Aerobiological Monographs, Towards a comprehensive vision, edited by: Clot, B., Comtois, P., and Escamilla-Garcia, B., MeteoSwiss (CH) and University of Montreal (CA), 233–245, ISBN: 978-2-8399-0466-7, 2006. a
Kiselev, D., Bonacina, L., and Wolf, J.-P.: A flash-lamp based device for fluorescence detection and identification of individual pollen grains, Rev. Sci. Instrum., 84, 033302, https://doi.org/10.1063/1.4793792, 2013. a, b
Könemann, T., Savage, N. J., Huffman, J. A., and Pöhlker, C.: Characterization of steady-state fluorescence properties of polystyrene latex spheres using off- and online spectroscopic methods, Atmos. Meas. Tech., 11, 3987–4003, https://doi.org/10.5194/amt-11-3987-2018, 2018. a
Könemann, T., Savage, N., Klimach, T., Walter, D., Fröhlich-Nowoisky, J., Su, H., Pöschl, U., Huffman, J. A., and Pöhlker, C.: Spectral Intensity Bioaerosol Sensor (SIBS): an instrument for spectrally resolved fluorescence detection of single particles in real time, Atmos. Meas. Tech., 12, 1337–1363, https://doi.org/10.5194/amt-12-1337-2019, 2019. a, b, c
Löndahl, J.: Physical and Biological Properties of Bioaerosols, Springer New York, New York, NY, 33–48, https://doi.org/10.1007/978-1-4419-5582-1_3, 2014. a
O'Connor, D. J., Healy, D. A., Hellebust, S., Buters, J. T. M., and Sodeau, J. R.: Using the WIBS-4 (Waveband Integrated Bioaerosol Sensor) Technique for the On-Line Detection of Pollen Grains, Aerosol Sci. Tech., 48, 341–349, https://doi.org/10.1080/02786826.2013.872768, 2014. a
Perring, A. E., Schwarz, J. P., Baumgardner, D., Hernandez, M. T., Spracklen, D. V., Heald, C. L., Gao, R. S., Kok, G., McMeeking, G. R., McQuaid, J. B., and Fahey, D. W.: Airborne observations of regional variation in fluorescent aerosol across the United States, J. Geophys. Res.-Atmos., 120, 1153–1170, https://doi.org/10.1002/2014JD022495, 2015a. a, b
Perring, A. E., Schwarz, J. P., Baumgardner, D., Hernandez, M. T., Spracklen, D. V., Heald, C. L., Gao, R. S., Kok, G., McMeeking, G. R., McQuaid, J. B., and Fahey, D. W.: Airborne observations of regional variation in fluorescent aerosol across the United States, J. Geophys. Res.-Atmos., 120, 1153–1170, https://doi.org/10.1002/2014JD022495, 2015b. a
Ring, J., Krämer, U., Schäfer, T., and Behrent, H.: Why are allergies increasing?, Curr. Opin. Immunol., 13, 701–708, https://doi.org/10.1016/S0952-7915(01)00282-5, 2001. a
Ruske, S., Topping, D. O., Foot, V. E., Morse, A. P., and Gallagher, M. W.: Machine learning for improved data analysis of biological aerosol using the WIBS, Atmos. Meas. Tech., 11, 6203–6230, https://doi.org/10.5194/amt-11-6203-2018, 2018. a
Šaulienė, I., Šukienė, L., Daunys, G., Valiulis, G., Vaitkevičius, L., Matavulj, P., Brdar, S., Panic, M., Sikoparija, B., Clot, B., Crouzy, B., and Sofiev, M.: Automatic pollen recognition with the Rapid-E particle counter: the first-level procedure, experience and next steps, Atmos. Meas. Tech., 12, 3435–3452, https://doi.org/10.5194/amt-12-3435-2019, 2019. a, b
Sauvageat, E., Zeder, Y., Auderset, K., Calpini, B., Clot, B., Crouzy, B., Konzelmann, T., Lieberherr, G., Tummon, F., and Vasilatou, K.: Real-time pollen monitoring using digital holography, Atmos. Meas. Tech., 13, 1539–1550, https://doi.org/10.5194/amt-13-1539-2020, 2020. a, b, c
Savage, N. J., Krentz, C. E., Könemann, T., Han, T. T., Mainelis, G., Pöhlker, C., and Huffman, J. A.: Systematic characterization and fluorescence threshold strategies for the wideband integrated bioaerosol sensor (WIBS) using size-resolved biological and interfering particles, Atmos. Meas. Tech., 10, 4279–4302, https://doi.org/10.5194/amt-10-4279-2017, 2017. a
Tešendić, D., Boberić Krstićev, D., Matavulj, P., Brdar, S., Panić, M., Minić, V., and Šikoparija, B.: RealForAll: real-time system for automatic detection of airborne pollen, Enterprise Information Systems, Taylor & Francis, 1–17, https://doi.org/10.1080/17517575.2020.1793391, 2020. a
Vasilatou, K., Wälchli, C., Koust, S., Horender, S., Iida, K., Sakurai, H., Schneider, F., Spielvogel, J., Wu, T. Y., and Auderset, K.: Calibration of optical particle size spectrometers against a primary standard: Counting efficiency profile of the TSI Model 3330 OPS and Grimm 11-D monitor in the particle size range from 300 nm to 10 µm, J. Aerosol Sci., 157, 105818, https://doi.org/10.1016/j.jaerosci.2021.105818, 2021. a, b
Wüthrich, B., Schindler, C., Leuenberger, P., and Ackermann-Liebrich, U.: Prevalence of atopy and pollinosis in the adult population of Switzerland (SAPALDIA study), Int. Arch. Allergy Imm., 106, 149–156, 1995. a