the Creative Commons Attribution 4.0 License.
the Creative Commons Attribution 4.0 License.
 | 07 Mar 2023
Influence of ozone and humidity on PTR-MS and GC-MS VOC measurements with and without a Na2S2O3 ozone scrubber
Lisa Ernle
Monika Akima Ringsdorf
Jonathan Williams
The measurement of volatile organic compounds (VOCs) can be influenced by ozone (O3), resulting in sampling artefacts that corrupt the data obtained. Published literature reports both positive (false enhancements of signal) and negative (loss of signal) interference in VOC data due to ozonolysis occurring in the sample gas. To assure good data quality it is essential to be aware of such interfering processes, to characterize them and to try to minimize the impact with a suitable sampling setup. Here we present results from experiments with a sodium thiosulfate ozone scrubber (Na2S2O3), which is a cost-effective and easily applied option for O3 scavenging during gas-phase sampling. Simultaneous measurement of selected organic trace gases using gas chromatography–mass spectrometry and proton transfer reaction–mass spectrometry was performed at different ozone levels (0–1 ppm) and different relative humidities (0 %–80 %). In this way both tropospheric and stratospheric conditions were examined. The measured data show that several carbonyl compounds including acetaldehyde, acetone and propanal show artificial signal enhancement when ozone is present at higher concentrations (> 150 ppb) in dry air, while analytes with double bonds like isoprene (measured with GC-MS) and terpenes show lower signals due to reaction with ozone. Both effects can be eliminated or in the case of sesquiterpenes substantially reduced by using Na2S2O3 impregnated quartz filters in the inlet line. With the chosen scrubbing material, relative humidity (RH) substantially improves the scrubbing efficiency. Under surface conditions between 50 %–80 % RH, the filter allows for accurate measurement of all species examined.
- Article
(3847 KB) - Full-text XML
- BibTeX
- EndNote


Volatile organic compounds (VOCs) are trace atmospheric constituents usually present at mixing ratios of parts per billion (ppb) or lower in the earth's atmosphere. Nevertheless, they can have a considerable impact on the global air chemistry and climate and can influence the health of living organisms on the earth's surface (Crutzen and Lelieveld, 2001; Williams, 2004). Organic trace gases can act as greenhouse gases, contribute to particle formation and take part in photochemical oxidation processes that influence ozone. Additionally many VOCs are also considered to be contaminants of the indoor environment where human exposure to such chemicals can be high (Weschler and Carslaw, 2018). VOC sources can be of natural (plants, phytoplankton, volcanoes, etc.) or anthropogenic origin (e.g. fossil fuel combustion, agriculture, industry) (Koppmann, 2008; McDonald et al., 2018; Weschler and Shields, 1997). To understand the chemical reactions and processes in outdoor, as well as indoor environments, it is essential to accurately quantify the VOCs in the air.
Common analytical techniques for sampling organic trace gases are proton transfer reaction–mass spectrometry (PTR-MS) and gas chromatography–mass spectrometry (GC-MS). With these measurement techniques a wide range of volatile organic compounds can be measured including aliphatic and aromatic hydrocarbons and oxygenated and halogen-containing species (Koppmann, 2008; Warneck and Williams, 2012). However, research has shown that due to the reactivity of some analytes to ozone, measurements can be rendered inaccurate, as already reported by Helmig (1997) more than 20 years ago.
Ozone can influence VOC measurements either due to reaction with the target analytes during sampling, which particularly affects techniques with pre-concentration steps prior to analysis (Helmig, 1997; Koppmann et al., 1995; Pollmann et al., 2005), or by generating sampling artefacts in the inlet of an online instrument. Northway et al. (2004) and Apel et al. (2003) reported for example increased mixing ratios for acetaldehyde in their systems for measurements in the lower stratosphere where ozone levels are high and humidity is low. Ozone and water are omnipresent in the troposphere with mixing ratios between 10 and 200 ppb (ozone) and humidities (10 %–100 %). Stratospheric O3 is essential for life on planet Earth, as it absorbs high-energy solar UV radiation. It is formed in the stratosphere through the photolysis of oxygen, which generates mixing ratios between 1–10 ppm. While such processes generate the protective ozone layer in the stratosphere, at ground level this oxidative gas is considered to be a pollutant, as it is detrimental to the human respiratory tract and damages plants (Pandis and Seinfeld, 2006). Being present in both the troposphere and stratosphere, albeit at different concentrations, ozone can potentially affect VOC measurements made at the ground and from high-flying aircraft. The two instruments examined in this study are regularly installed on an aircraft capable of reaching ca. 15 km which at mid-latitudes gives access to the lower stratosphere. Also in indoor environments where ozone is typically 3–5 times less than outside ambient levels, it may affect the measurement fidelity.
Sodium thiosulfate (Na2S2O3) has been reported to have a good ozone scrubbing efficiency for VOC measurements (Lehmpuhl and Birks, 1996; Pollmann et al., 2005) and was therefore chosen as the best test material for O3 removal in the experiments described here. Like ozone, humidity varies strongly between the dry stratosphere and much more humid conditions of the earth's surface. Humidity is considered an important variable here, as it can strongly influence chemistry occurring at surfaces. Measurement conditions that reflect the conditions likely to be met in these two environments were therefore examined. The aim of this study was to investigate the influence of different ozone levels and different relative humidity (RH) on two specific VOC measurement instruments, namely the fast GC-MS SOFIA described by Bourtsoukidis et al. (2017) and a PTR-ToF-MS described in Wang et al. (2022). We report on the effect of using the sodium thiosulfate impregnated quartz filters for multiple VOC species including carbonyls, alcohols and non-methane hydrocarbons. Additionally, the lifetime of the scrubber with respect to ozone exposure was determined under tropospheric and stratospheric conditions. This is essential to assure that the scrubber is working correctly when applied in the field, to determine optimum exchange times, and to avoid unnecessary exchange and waste. These results will define operational expectations of using a Na2S2O3 filter in field conditions to improve organic trace gas measurement techniques, assure good data quality for smaller VOCs and therefore improve the data comparability between different studies.
The influence of ozone on measurements from an online VOC instrument (PTR-ToF-MS 8000, IONICON Analytik, Austria) and a custom-built quasi-online fast gas chromatograph–mass spectrometer (GC-MS) (Bourtsoukidis et al., 2017), which collects, concentrates and measures within 3 min, was investigated. Additionally, the effect of an implemented sodium thiosulfate ozone scrubber on those systems, as well as the scrubber lifetime, was examined at different relative humidity. A list with the measured species is shown in Table 2. It includes saturated and unsaturated halocarbons, non-methane hydrocarbons (NMHCs), small oxygenated VOCs (OVOCs), siloxanes, and some nitrogen- and sulfur-containing molecules. Some species could be detected with both instruments simultaneously, while other species could only be measured by one. The majority of the tubing used in this study was fluorinated ethylene propylene (FEP) Teflon which was found by Deming et al. (2019) to perform well in a comparison of inlet materials (including polyetheretherketone (PEEK) and stainless steel), as adsorption on FEP was found to be independent of humidity, concentration and functionality. The tubing was not new but was used previously for airborne measurements aboard a research aircraft. It was flushed with synthetic air for at least 1 h prior to when the experiments were performed. When considering the ozone in the instrument inlet, one could consider passivating the inlet surfaces prior to measurement by the introduction of high (500 ppb) ozone mixing ratios. Northway et al. (2004) tested this possibility and noted a passivation that disappeared during further field measurements. As this will in effect generate a shifting background to the subsequent measurements, and as 6 h flushing is impractical prior to flight measurements, we chose not to follow this procedure.
2.1 Experimental setup
The experimental setup includes both PTR-ToF-MS and fast GC-MS as shown in Fig. 1. Synthetic air from a gas cylinder (synthetic air, hydrocarbon free, T50, Westfalen, Germany) was connected to the ozone generator which was set to generate O3 at levels between 25 and 1000 ppb. This corresponds to tropospheric and lower stratospheric levels, similar to those encountered by the HALO aircraft on which the instruments are certified to fly. Thereafter, the air stream was led through ultra-pure water for humidification. Ozone as a non-polar molecule has a very low solubility in water and will therefore not be lost during the humidification process. Two different calibration gas cylinders (40 L, Apel Riemer, USA) were connected through a junction (T-piece) to the sampling line. These cylinders contained a gravimetrically prepared mixture of VOCs at known mixing ratios, which could be added to the system air. The VOC-enriched synthetic air could then be directed through the ozone scrubber or directly to the two mass spectrometers, which both drew ca. 200 sccm air from the sampling line. At the end of the Teflon tubing inlet line the ozone monitor was connected to measure the O3 concentration after the scrubber. Several exhaust lines and pressure gauges were installed in the setup to ensure a system pressure close to ambient pressure (ca. 1000 hPa). This is required for the operation of the ozone instruments. To make sure that the monitor was always operated within the required flow range, a dilution flow could be added shortly before the instrument. Gas flows were checked regularly with a flow metre (DryCal, MesaLabs, USA) after the ozone generator and monitor. All the lines were made of FEP and heated to approximately 45 ∘C to avoid condensation in the tubing. This simulates conditions on the research aircraft aboard which the measurement devices have been installed. The total tubing length between the ozone generator and scrubber was approximately 2 m; the outer diameter was in. (0.635 cm), again equivalent to the aircraft setup.
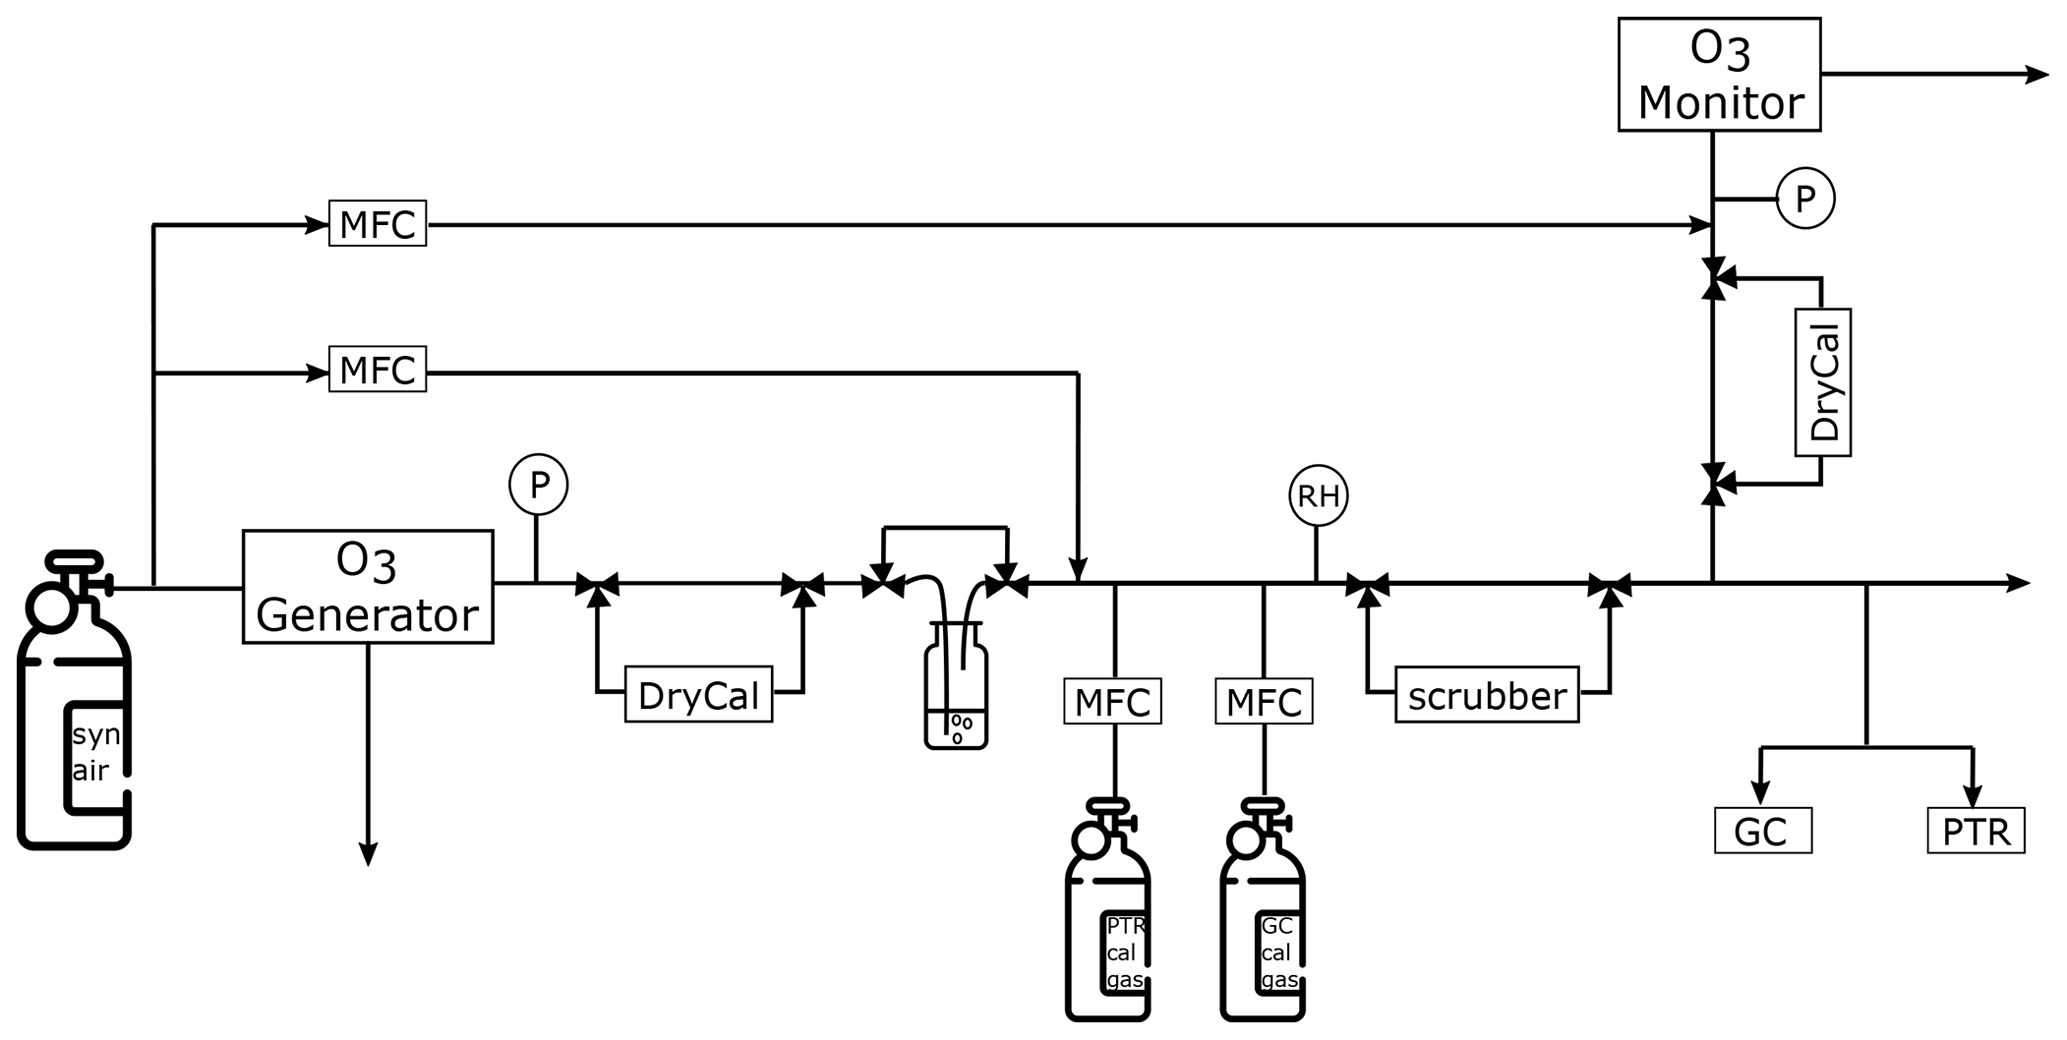
Figure 1Experimental setup. MFC – mass flow controller, RH – relative humidity sensor, P – pressure gauge and DryCal – flow metre.
Table 1Conditions of the different experiments performed in this study.
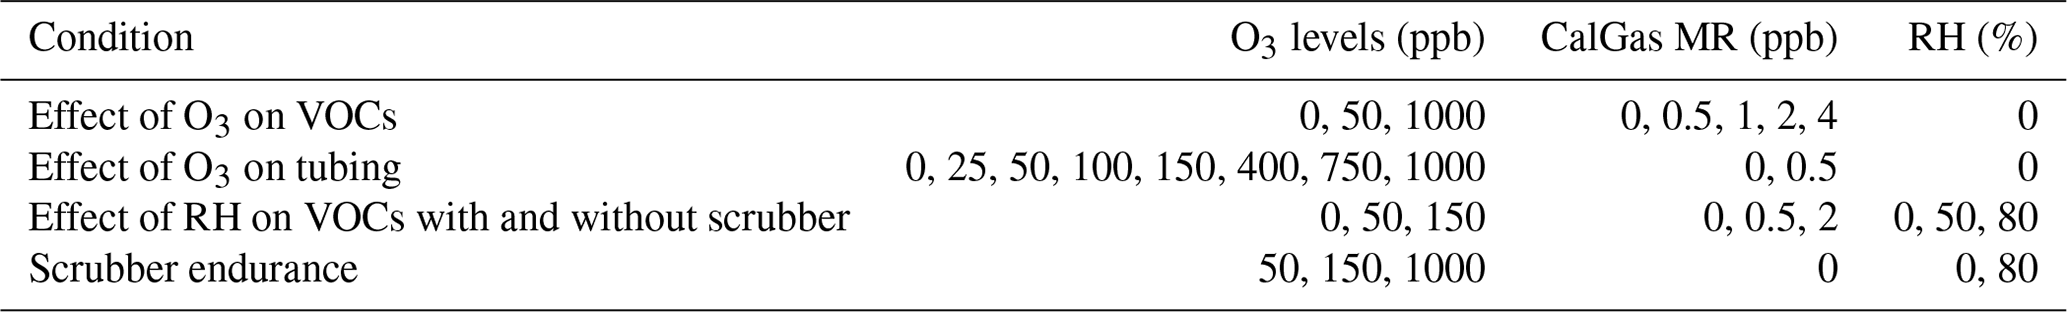
During the ozone experiment series various tests were performed (see Table 1): VOC mixtures were measured at several levels, adding 0, 50 and 1000 ppb ozone to investigate the measurement performance at ambient background ozone levels on the ground and in the lower stratosphere. Additionally, one VOC level was measured at seven different ozone levels up to 1000 ppb (0, 25, 50, 150, 400, 750, 1000 ppb). The tests also included experiments without added VOCs to see if any of the analytes are produced in the pre-used inlet line. Note that during the very first experiment performed, flows were measured every time the VOC level was adjusted. It turned out that some compounds were emitted from the flow metre, resulting in elevated terpene masses. When switching to a new calibration gas level, as well as in the first hour of the experiment, there were spikes in the VOC signal. These were judged to be mechanical flow-related anomalies and therefore removed to assure better visibility of the mixing ratio in the plots. To investigate the influence of sodium thiosulfate impregnated quartz filters as an ozone scrubber, VOC levels at 0.5 and 2 ppb were measured at different ozone levels (0, 50 and 150 ppb) and different relative humidities (0 %, 50 % and 80 % RH) with and without scrubber in the flow path. For scrubber endurance tests, another exhaust line was installed after the ozone generator to reduce the flow through the sodium thiosulfate impregnated quartz filter in order to simulate field conditions. The flow through the filter was set to 200–600 sccm to replicate either typical field measurement conditions or the experiments focusing on the influence on the VOC measurements. For those experiments the flow through the scrubber was higher to provide enough air for both of the instruments. Before each single longevity experiment the Na2S2O3 impregnated filter was exchanged and left in the flow path until an abrupt increase in ozone concentration was detected with the O3 monitor. This rise marks the end of the scrubber lifetime. Further details on the preparation of the filter scrubber can be found in Sect. 2.3. Scrubber performance was tested under three different ozone concentrations: 50, 150 and 1000 ppb at 0 % RH. These are the same ozone levels used for the experiment focused on the effect of O3 on the VOC measurements, which correspond to ambient ground and lower stratospheric ozone levels. Additionally, the influence of 80 % relative humidity on the scrubber lifetime was tested. This RH level was chosen as an extreme to see whether or not it changes the scrubber performance. Relative humidity was measured with a humidity sensor that includes a temperature sensor (MSR145, MSR, Switzerland; indicated with RH in Fig. 1).
2.2 Instrumentation
2.2.1 Ozone instruments
An ozone generator, as well as an ozone monitor (49iQPS and 49iQ, both Thermo Fisher Scientific, USA), were installed in the experimental setup. Each instrument's supply air stream is divided into a reference and a sample gas channel. In the generator the sample gas flows through an ozonator, while the reference gas of the monitor flows through a scrubber to eliminate existing ambient ozone. Both instruments use a spectroscopic approach to determine the mixing ratio: as the O3 molecule absorbs UV light of 254 nm the difference of light intensity of this wavelength in both channels is used to calculate the ozone concentration in the sample stream based on Beer's law (ThermoFisherScientific, 2020a, b).
2.2.2 PTR-MS
An IONICON PTR-ToF-MS with a drift tube pressure of 2.2 hPa, drift temperature of 60 ∘C and E/N 137 Td was operated with H3O+ as primary ions. It is a soft ionization technique and therefore causes little fragmentation of the analytes during the detection process. This is the case for most analytes in this study. However, some species (e.g. terpenes, siloxanes) do fragment during ionization (Pagonis et al., 2019). Fragments can impact the measurement of target species such as isoprene if they have exactly the same mass. Identification of the analytes was performed using the exact mass of the most abundant fragment, usually the protonated molecular mass, which does not exclude simultaneous measurement of isomeric compounds. The mass range of the system was 0–500 amu and the mass resolution approximately 3500. The PTR used a FEP inlet tubing (o.d. in. (0.635 cm), inner diameter (i.d.) in. (0.3175 cm)) with an inlet flow of 200 sccm. The distance between the ozone scrubber and PTR was 1.85 m, resulting in an inlet residence time tres of ca. 4 s. In order to regulate the pressure in the drift tube during flight measurements, the sample air passes an adjustable O-ring (fluorinated propylene monomer (FPM) or nitrile butadiene rubber (NBR), tres ≤ 30 ms). The influence of the O-ring on VOC measurements was found to be zero without O3 present but has not been tested separately under ozone exposure. Inside the instrument, a 1 m line (i.d. 0.1 cm) made of polyetheretherketone (PEEK) is used (ca. 70 sccm, tres ≤ 1 s, depending on the flow rate). Limits of detection (LODs) were < 0.05 ppb, with a total uncertainty of 15 %–20 %. Measured species included alkenes, siloxanes and OVOCs. For measurements at RH > 0 a humid calibration was applied: the calibration was performed at the same relative humidity as the corresponding experiment.
2.2.3 GC-MS
The fast GC-MS system has been described in detail by Bourtsoukidis et al. (2017). In this study it was used to measure halocarbons, small NMHCs and OVOCS, as well as some sulfur-containing compounds and small organic nitrates. Due to its chromatographic column it is capable of separating isomeric compounds prior to detection (e.g. acetone and propanal). The custom-built instrument uses a cryogenic three-step pre-concentration to collect air samples, followed by gas chromatographic separation in a custom-built oven and detection with a quadrupole mass spectrometer which was operated in selected ion monitoring mode (SIM). With a time resolution of 3 min it is currently not possible to measure high molecular mass compounds (e.g. sesquiterpenes), as those would need more time to elute from the GC column. Bromoform is the largest analyte detected with the currently applied method. The system's inlet flow was 200 sccm, and the tubing length between the GC inlet and the ozone scrubber was 2 m (o.d. in. (0.635 cm), i.d. in. (0.3175 cm)), which results in an inlet residence time of ca. 5 s. Inside the system, the sample air is exposed to silicosteel tubing (o.d. in. (0.1588 cm), i.d. 0.02 in. (0.0508 cm), 40 sccm, tres < 1 s) and stainless steel surfaces in the traps (tres 1.5 min). LODs were typically < 0.03 ppb (acetaldehyde, acetone and acrolein < 0.2 ppb), and the total measurement uncertainty was approximately 10 %.
2.3 Ozone scrubbing
Various materials have been tested to eliminate interferences from ozone on VOC measurements. Helmig (1997) compiled an overview of widely used O3 scrubbing techniques for the sampling of atmospheric organic compounds. Several groups have reported satisfactory results of sodium thiosulfate as an ozone scavenger for VOC analysis (Helmig, 1997; Lehmpuhl and Birks, 1996; Pollmann et al., 2005; Strömvall and Petersson, 1992). In this study the scrubbers were prepared by soaking quartz fibre filters (37 mm, GE HealthCare Life Sciences, USA) in a 10 % () aqueous solution for 1 h followed by drying under a nitrogen flow of approximately 100 sccm at room temperature. This quartz filter was placed under a 47 mm PTFE filter (Sartorius, Germany) in a Teflon filter holder. The smaller quartz filter was selected to avoid leaks at the filter holder (i.d. 47 mm, Reichelt Chemietechnik, Germany) previously caused due to the thickness of the quartz filter. The volume of the filter housing is ca. 55 mL, resulting in a residence time of ca. 6 s with a flow rate of ∼ 600 sccm.
2.4 Scrubber lifetime calculation
The time that the scrubber remains effective at removing ozone, here termed the scrubber lifetime, is important information for field measurement practitioners. In order to improve data quality and to keep cost and workload low, the ozone scrubbers need to be exchanged before their efficiency is compromised, while still using them as long as possible. Assuming that the scrubber lifetime is a function of ozone mixing ratio and flow, the data from the scrubber lifetime experiment were plotted and fitted with a power function. Additionally the influence of relative humidity on the scrubber lifetime was tested.
2.5 Potential effects causing interference
VOC measurements performed by the PTR-ToF-MS and the fast GC-MS may in the presence of ozone suffer interference through various effects. Surface reactions on the inner walls of the tubing can lead to ozonolysis of compounds previously absorbed on the FEP inlet tubing. The ozonolysis of alkenes, which are either present on the tubing surface or in the gas phase (sample air), can lead to production of carbonyl compounds which cause positive artefacts on the carbonyl masses. Another potential source of interference is fragmentation during the ionization process in the PTR-MS. Several groups reported for example fragments on PTR 69.07 from C5–C10 aldehydes (Buhr et al., 2002; Ruzsanyi et al., 2013; Wang et al., 2022). The instrument-internal fragmentation process itself is independent of ozone, but the presence of the aldehyde species in the sample air is likely to be caused by the release of those species from the sample line surface due to ozonolysis reaction. Not only the PTR but also the GC-MS can suffer interference caused by ozone inside the instrument. It has been reported previously that O3-induced emission from rotor material of multiposition valves can lead to positive artefacts when measuring C2–C4 aldehydes (Apel et al., 2003).
3.1 Influence of ozone on VOC measurements
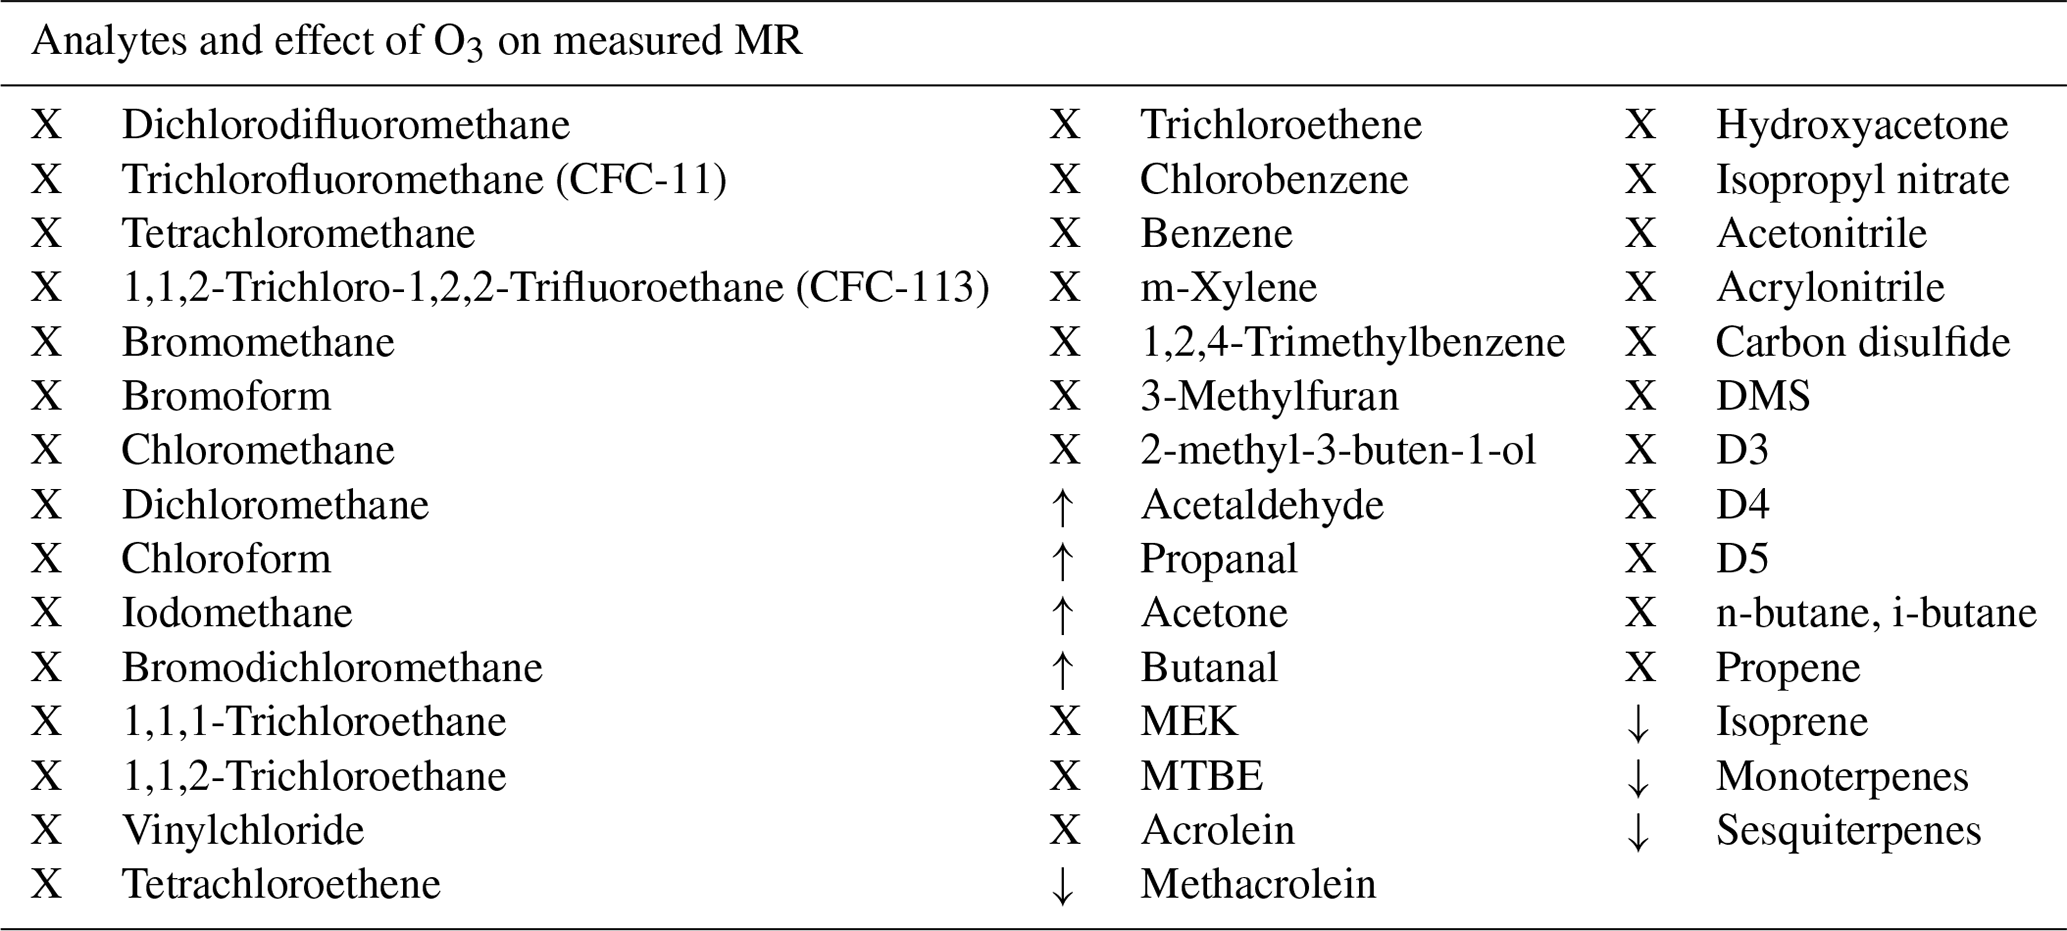
For most of the analytes, mainly saturated NMHCs and halocarbons, no ozone interference of the measurement through reactive loss due to ozone was expected. This is because such species do not contain a double bond with which ozone can react, nor do they contain oxygen atoms, so they are unlikely to be produced by surface oxidation processes. However, due to the different molecular structures and physical properties of some analytes, it was potentially possible to obtain negative interference for some unsaturated species like isoprene and terpenes, as well as artificial signal enhancement on the aldehyde masses. Table 2 shows whether ozone had an effect on the measured mixing ratio of the VOCs.
Table 2Measured species and effect of ozone. X: no effect, ↓: negative interference and ↑: positive interference.
3.1.1 No effect on VOC measurements
In accordance with the expectations no interference from reactions with ozone were observed for most of the measured species, namely saturated and unsaturated halocarbons, alkanes, aromatics, nitriles, methyl tert butyl ether (MTBE), ethanol, hydroxyacetone, methyl ethyl ketone (MEK), isopropyl nitrate, and the two sulfur-containing species carbon disulfide and dimethyl sulfide (DMS), as well as siloxanes. As an example of the VOCs where ozone did not influence the measurements Fig. 2 shows the mixing ratios of chlorobenzene applied and measured by GC- and PTR-MS, as well as the ozone mixing ratio. In this experiment no ozone scrubber was applied. While the instruments observe slightly different mixing ratios owing to differences in sensitivity, the relative change in chlorobenzene mixing ratios remain unchanged when ozone is present.
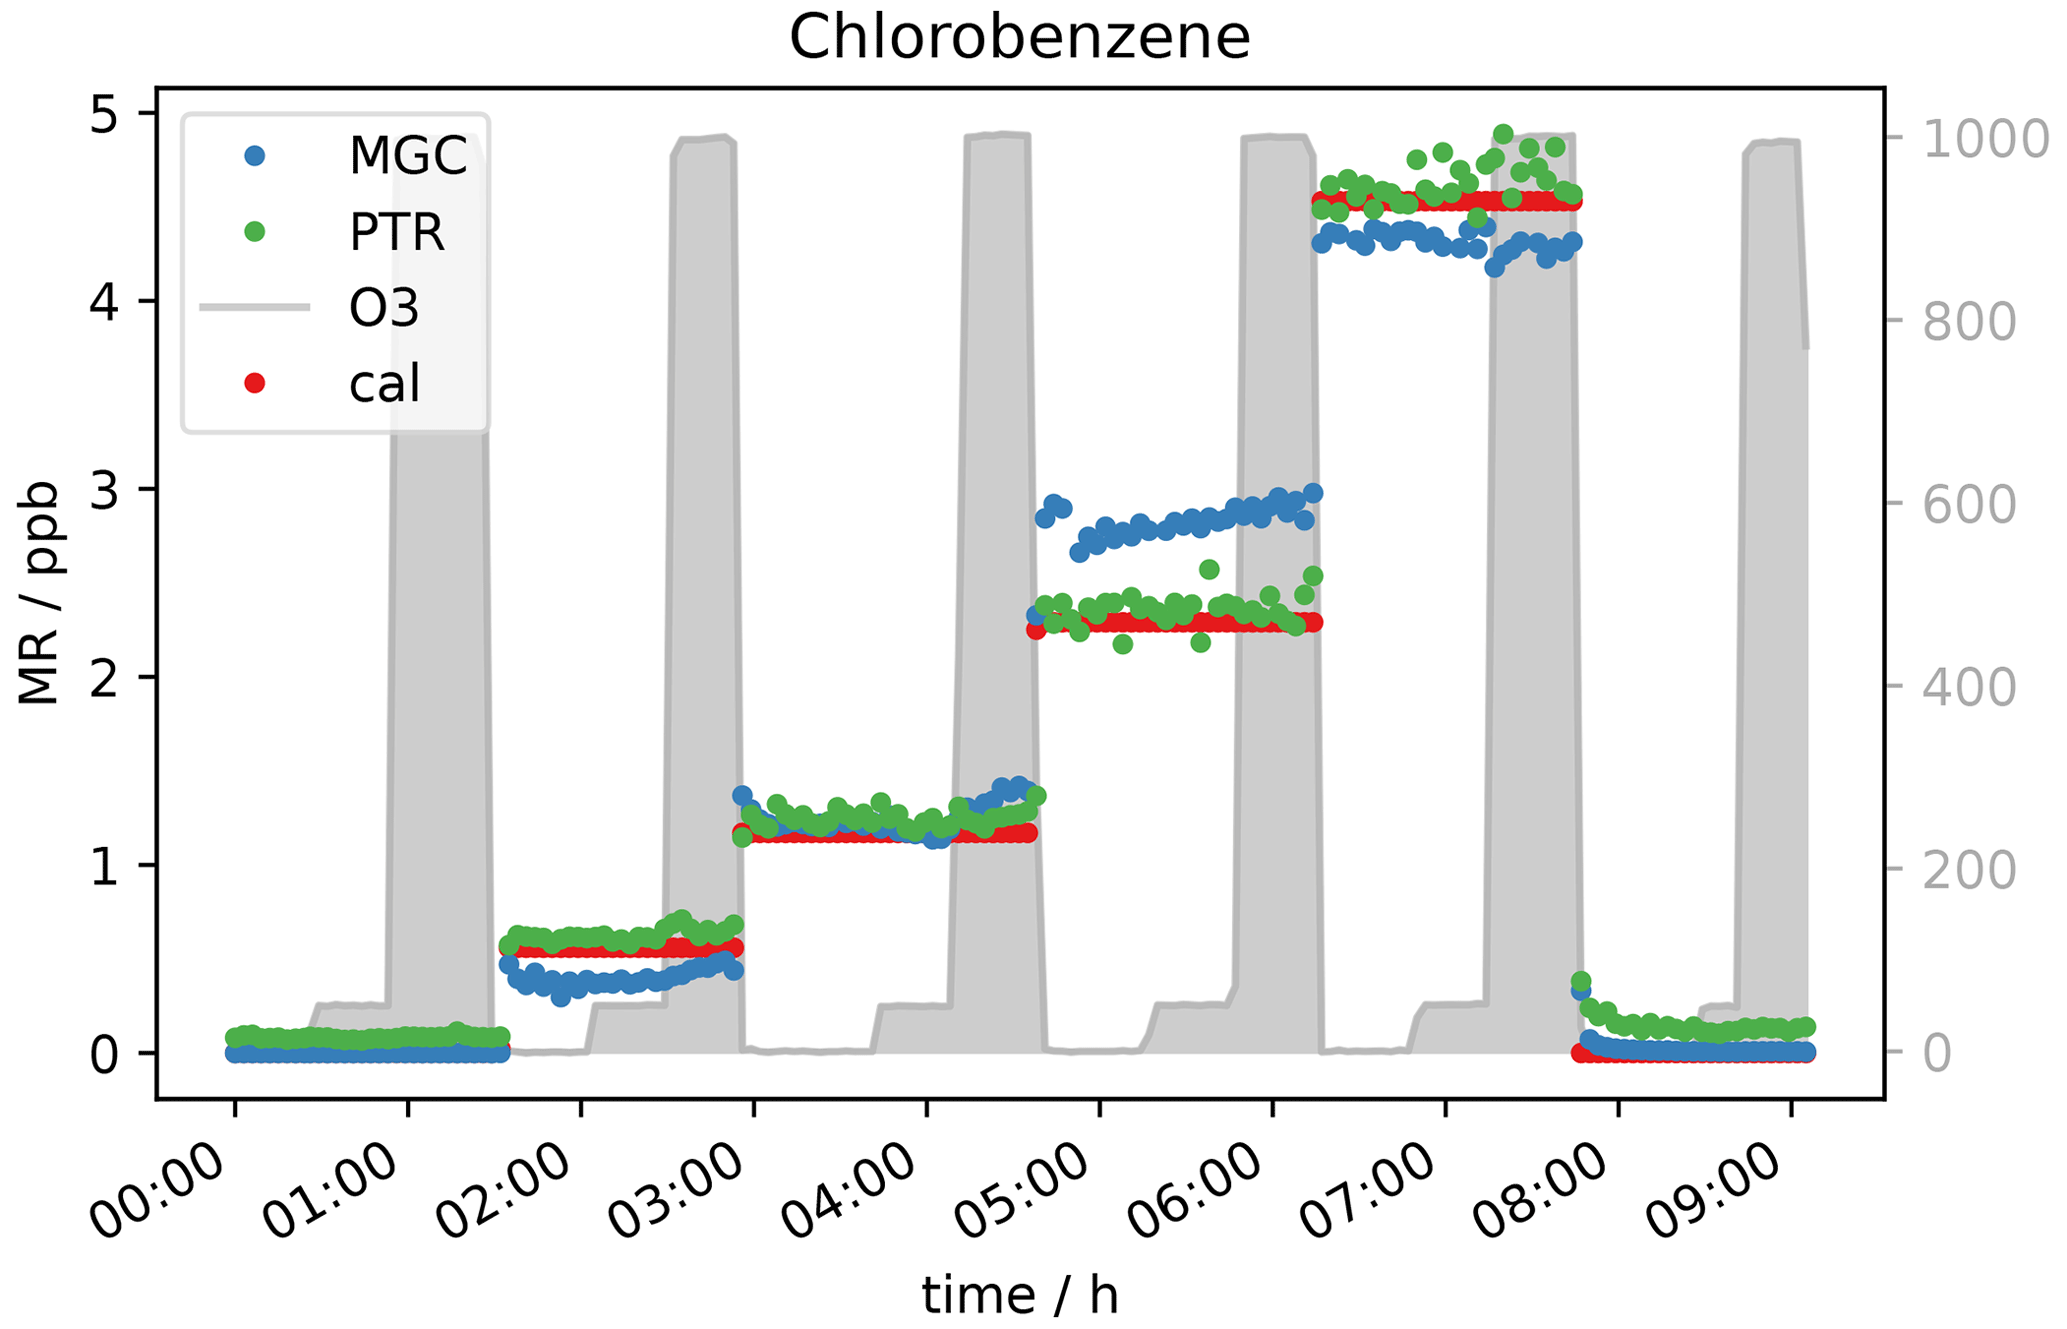
Figure 2Effect of ozone (0, 50, 1000 ppb) on GC- and PTR-MS measurements of chlorobenzene under different standard gas levels (0–4 ppb).
3.1.2 Ozone causing positive interference
Based on current literature, some carbonyl compounds such as aldehydes and ketones do have the potential to show higher mixing ratios when ozone is present. Northway et al. (2004) and Apel et al. (2003) observed positive artefacts under ozone presence for acetaldehyde. Additionally, Apel et al. (2003) observed artefact formation for propanal, acetone and butanal in their fast GC-MS system, which were emitted by parts of their system when ozone was present. Lehmpuhl and Birks (1996) found positive interference also for larger carbonyl compounds. Acetaldehyde measurements in this study under dry conditions agree with the results reported by Northway et al. (2004), Apel et al. (2003) and others. The VOC signal increases with ozone concentration. Both the PTR- and GC-MS measured higher acetaldehyde mixing ratios when O3 was above 150 ppb (see Fig. 3). This indicates that the interference is not instrument-specific but more likely a function of the common inlet tubing exposure to ozone. Note that the inlet lengths to GC and PTR were roughly the same. The higher enhancement of the GC acetaldehyde could be due to emission of oxidation products from the material of multiposition valves as described by Apel et al. (2003). In contrast to the PTR data, the ozone-induced enhancement of the GC signal increases with acetaldehyde concentration. This effect can be due to the different materials used for the tubing inside the instruments: Deming et al. (2019) showed that in glass and metal tubing competitive adsorption occurs, which depends on humidity and concentration and functionality of the analyte, while polymer tubing shows independent absorption. Our fast GC instrument is equipped with heated silicosteel tubing, which allows for competitive adsorption, while the PTR is equipped with perfluoroalkoxy alkane (PFA) tubing. Additionally, with increasing O3 mixing ratios ozonolysis reactions during trapping are gaining importance. It seems that the interferences on the VOC measurements caused by high ozone exposure are an effect of both the inlet line and the instrument’s surfaces. The higher GC signals at 2 ppb calibration gas are again assigned to the difference in sensitivity (due to filament degradation) already mentioned in the previous section. In Figs. 3 and 4a, the acetaldehyde signals rise significantly when 1000 ppb ozone was present. For the zero air sample (Fig. 4b) the signal rose after increasing ozone from 150 ppb where the effect was negligible to 400 ppb. The acetaldehyde signal increased further between 400 and 1000 ppb O3 to about 0.4 ppb (GC) to 0.5 ppb (PTR). Interestingly, the GC signal in Fig. 4b did not drop when the standard gas level dropped to 0 ppb. This is an interesting observation that we currently cannot explain. No abnormal behaviour in the GC-MS could be ascertained at this time, including retention time shifts, tuning anomalies or changes in RH. We conclude that most likely it was an unlogged flow-switching issue. Nevertheless, it does not interfere with our general observation that the acetaldehyde signal is suffering positive interference under high ozone exposure, most likely due to ozonolysis reactions at the tubing surface.
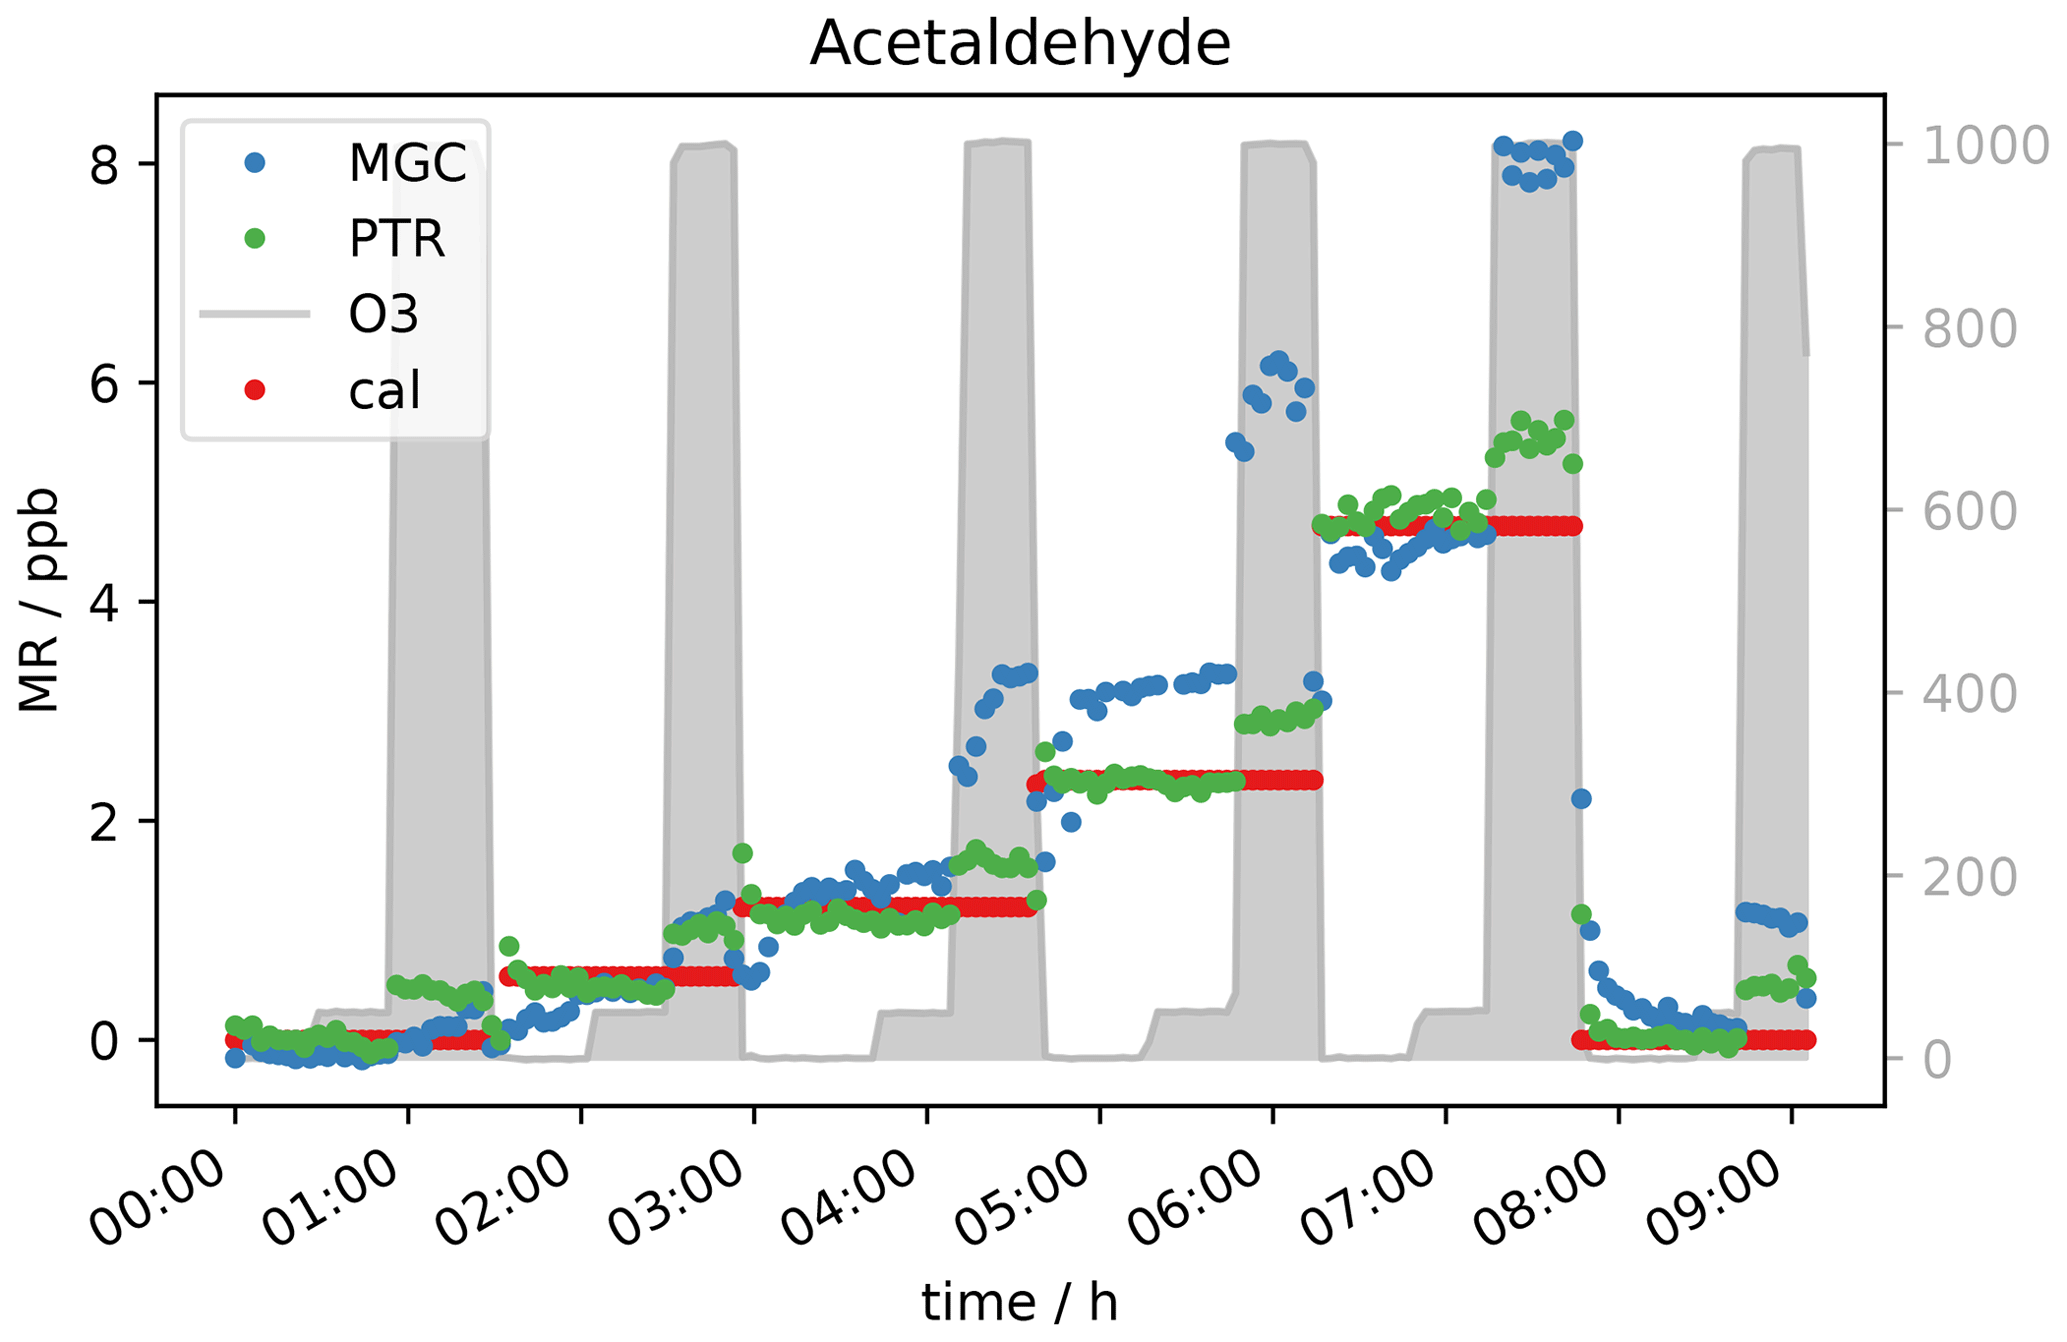
Figure 3Five different standard gas levels between 0 and approx. 4 ppb at ozone mixing ratios of 0, 50 and 1000 ppb.
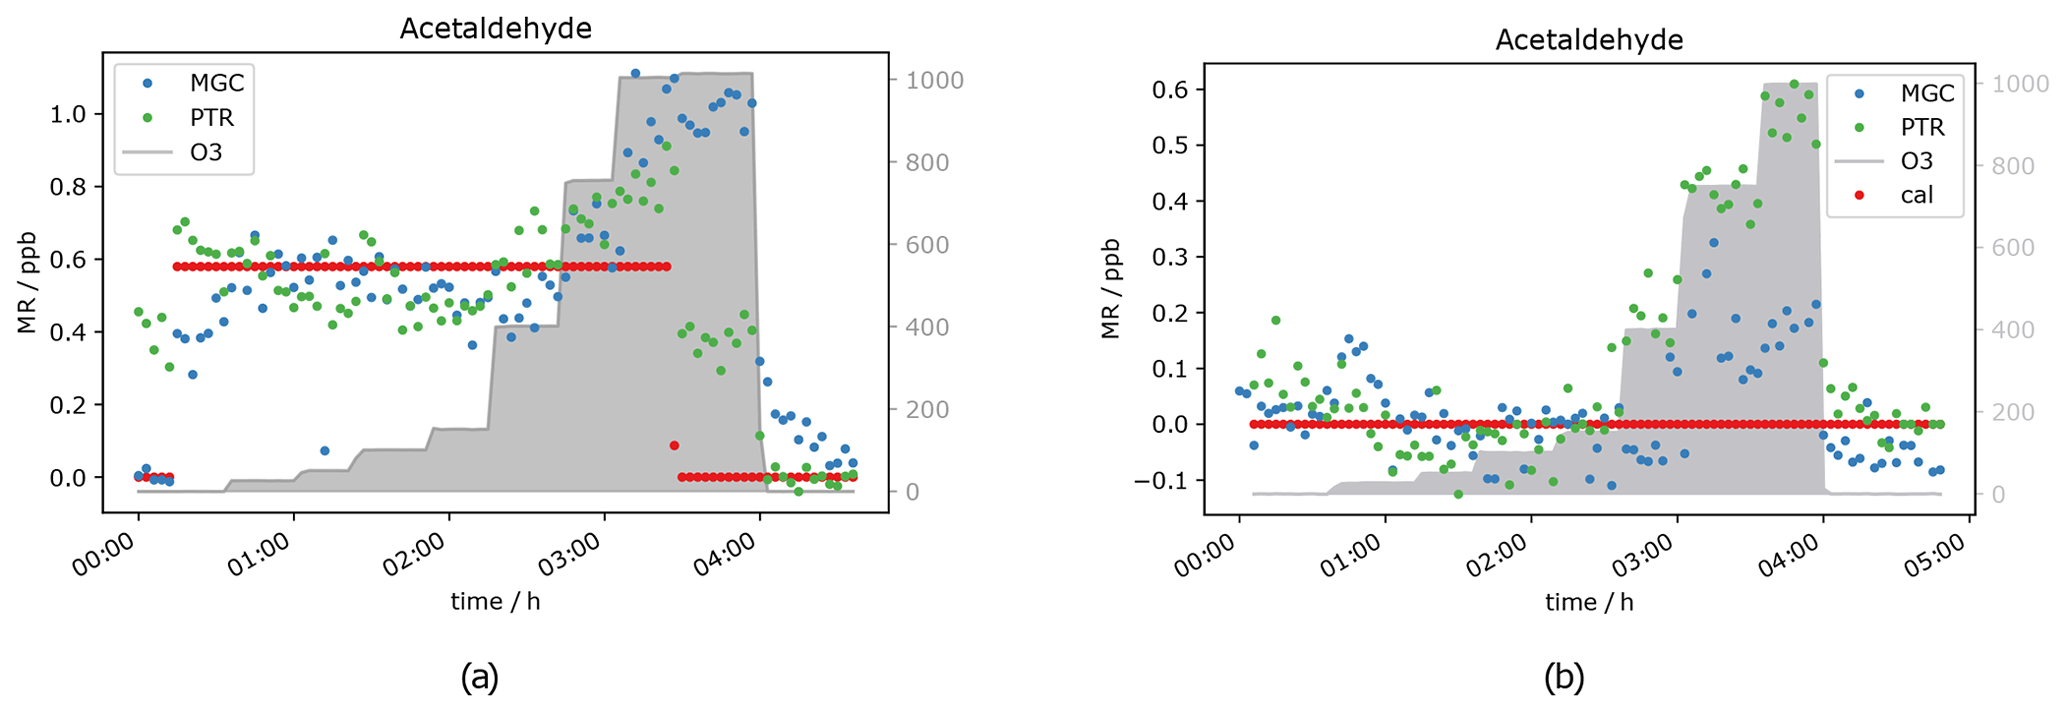
Figure 4Acetaldehyde mixing ratios at seven different ozone levels between 0 and 1000 ppb and one standard gas level. VOC levels are 0 ppb (a) and 0.5 ppb (b).
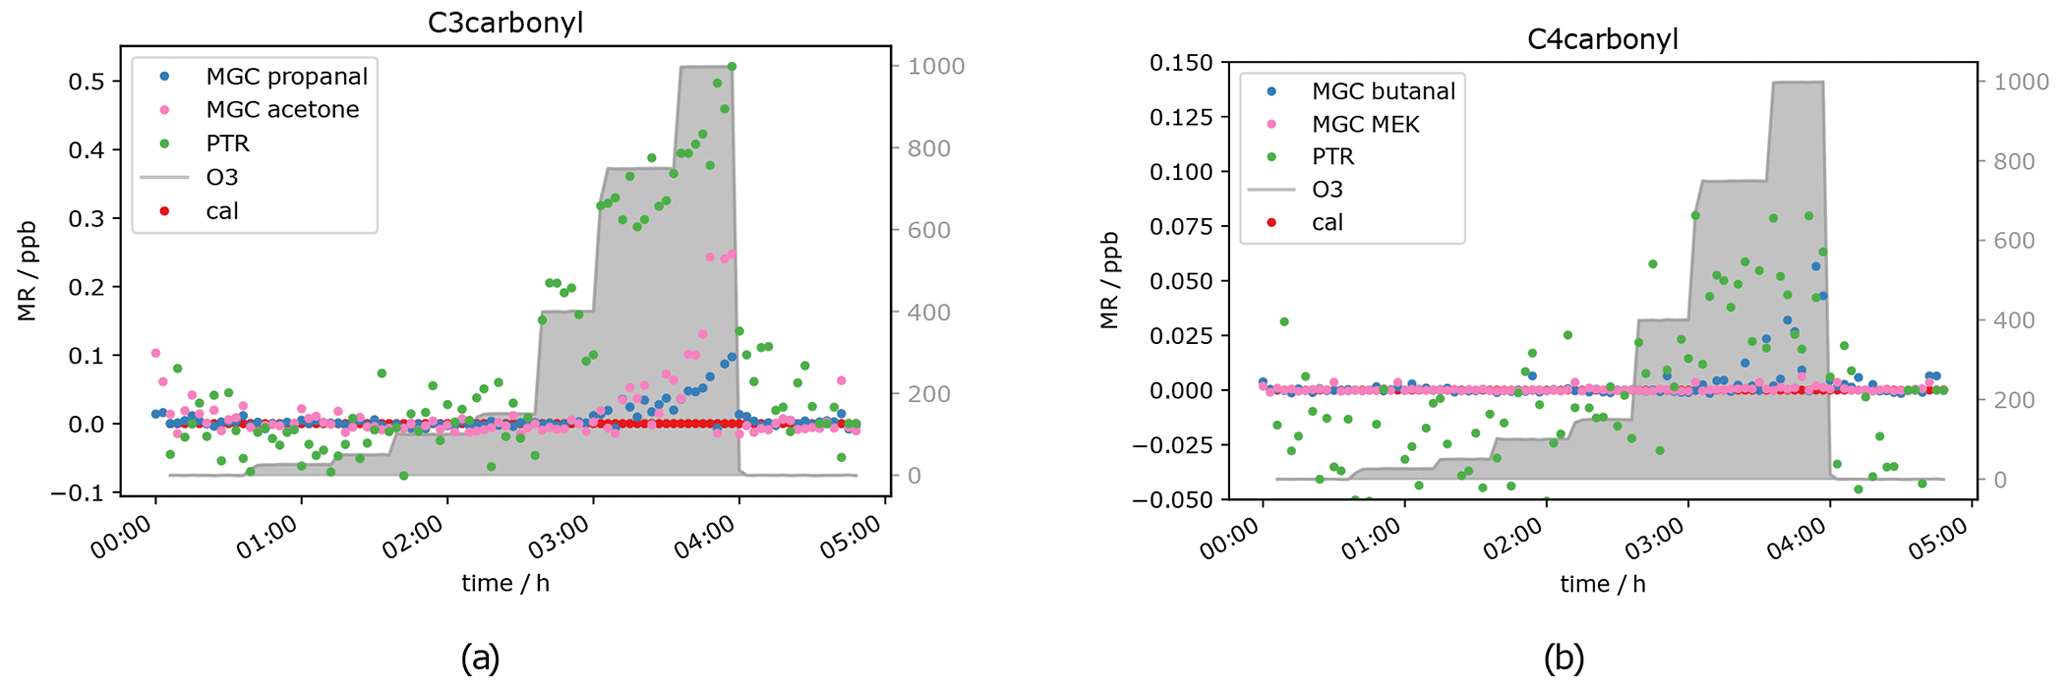
Besides acetaldehyde, C3 and C4 aldehydes and ketones have also been measured, namely propanal, acetone, butanal and MEK. Unfortunately, for those compounds the results were not as clear as for the C2 carbonyl described above. The PTR-ToF-MS in H3O+ mode cannot separate the aldehyde from the ketone, as they have exactly the same mass, i.e. the PTR-ToF data presented here always show the sum of propanal and acetone (C3) and butanal and MEK (C4) respectively and should therefore be double the GC signals for the separated species. When measuring zero air, ozone increases the signal of the C3 and C4 carbonyls (see Fig. 5), starting at O3 mixing ratios of 400 ppb, similar to acetaldehyde. This is most likely due to the reaction of ozone with species attached/adsorbed at the walls of the instrument sampling systems or to unmeasured ozone reactive species in the zero air. While butanal (measured by GC-MS) shows a strong increase, MEK does not show a significant increase in the GC data.
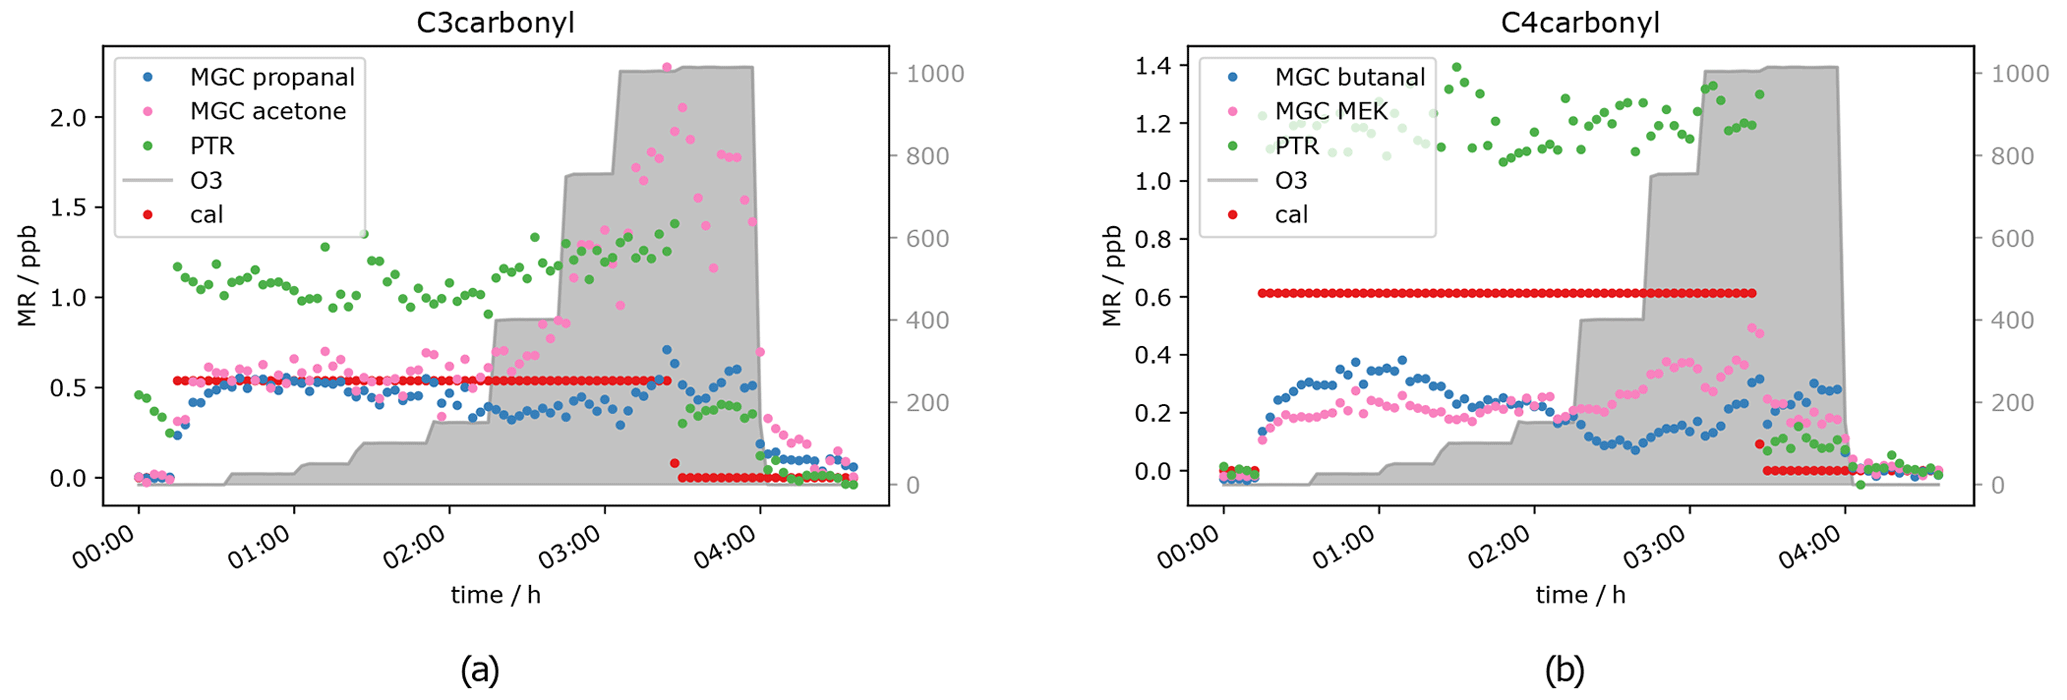
Figure 6C3 and C4 carbonyl mixing ratios at approximately 0.5 ppb per VOC at different ozone levels.
Interestingly, the aldehyde mixing ratios are relatively stable with a tendency to decrease with ozone when the standard gas was added. Figure 6 shows this phenomenon. Propanal and butanal mixing ratios do not show a substantial increase under the same O3 conditions where they increase in the zero air measurement, while the sum of C3 carbonyls (PTR signal) and GC acetone again increase (as in the zero air measurement). As propanal slightly decreases and acetone strongly increases with ozone, the PTR measurements show a positive net ozone effect for the C3 carbonyls. For C4 carbonyls, the GC quantification during this experiment was compromised (too low mixing ratio) for unknown reasons. However, the qualitative results match the rest of our observations: butanal decreases slightly, while MEK increases slightly, leading to a stable signal for the sum of butanal and MEK, which is shown by the PTR data presented in Fig. 6b. Additionally, the qualitative results of butanal and MEK are in line with the qualitative results of C2–C3 carbonyls: the signals for the ketones (acetone (C3), MEK (C4)) increase with O3 mixing ratios ≥ 400 ppb, and the signals for the aldehydes (acetaldehyde (C2), propanal (C3) and butanal (C4)) are relatively stable with a tendency to decrease between 200 and 400 ppb O3 and increase as well with O3 mixing ratios ≥ 400 ppb. Between 3.5 and 4 h after the start of the experiment (see Fig. 6), not all signals dropped to background levels. They finally drop once ozone was switched off. This is consistent with the results from the zero air measurement (Fig. 5) and the acetaldehyde data (Fig. 4b). It shows that exposure of the inlet tubing to high ozone does not rapidly clean the lines of the interfering compounds. Apel et al. reported carbonyl generation in the presence of ozone from the rotor material of VICI valves and a KNF Teflon pump included in their system (Apel et al., 2003). Positive artefacts were reported for acetaldehyde, propanal, acetone and butanal; they did not find any interference for MEK. This matches our results. We assume that C2–C4 carbonyl compounds are generated inside the setup inlet tubing and were measured by the GC, as otherwise the signal would have dropped when measuring zero air with 1000 ppb O3. However, at 0.5 ppb calibration gas we observed a C3 and C4 aldehyde loss under high ozone exposure in the GC measurements. A possible explanation for this is the effect is due to OH radicals produced via Criegee intermediates from the ozonolysis reaction of alkenes present in the standard gas. OH radicals react preferentially with aldehydes rather than ketones. Apparently, these reactions are faster than the C3 and C4 aldehyde generation within the sampling setup. All the experiments show the same trend: under dry conditions, at tropospheric ozone levels (≤ 150 ppb O3), no interference from the oxidant can be observed, while under stratospheric conditions (> 400 ppb O3) there is a strong interference. This leads to the conclusion that both instruments can measure C2 to C4 carbonyls in the troposphere without being restricted by the amount of ozone present. No reliable results can be achieved when ozone is above 150 ppb under dry conditions. Hence, the current setup is not suitable for stratospheric measurements of these oxygenated species.
3.1.3 Ozone causing negative interference
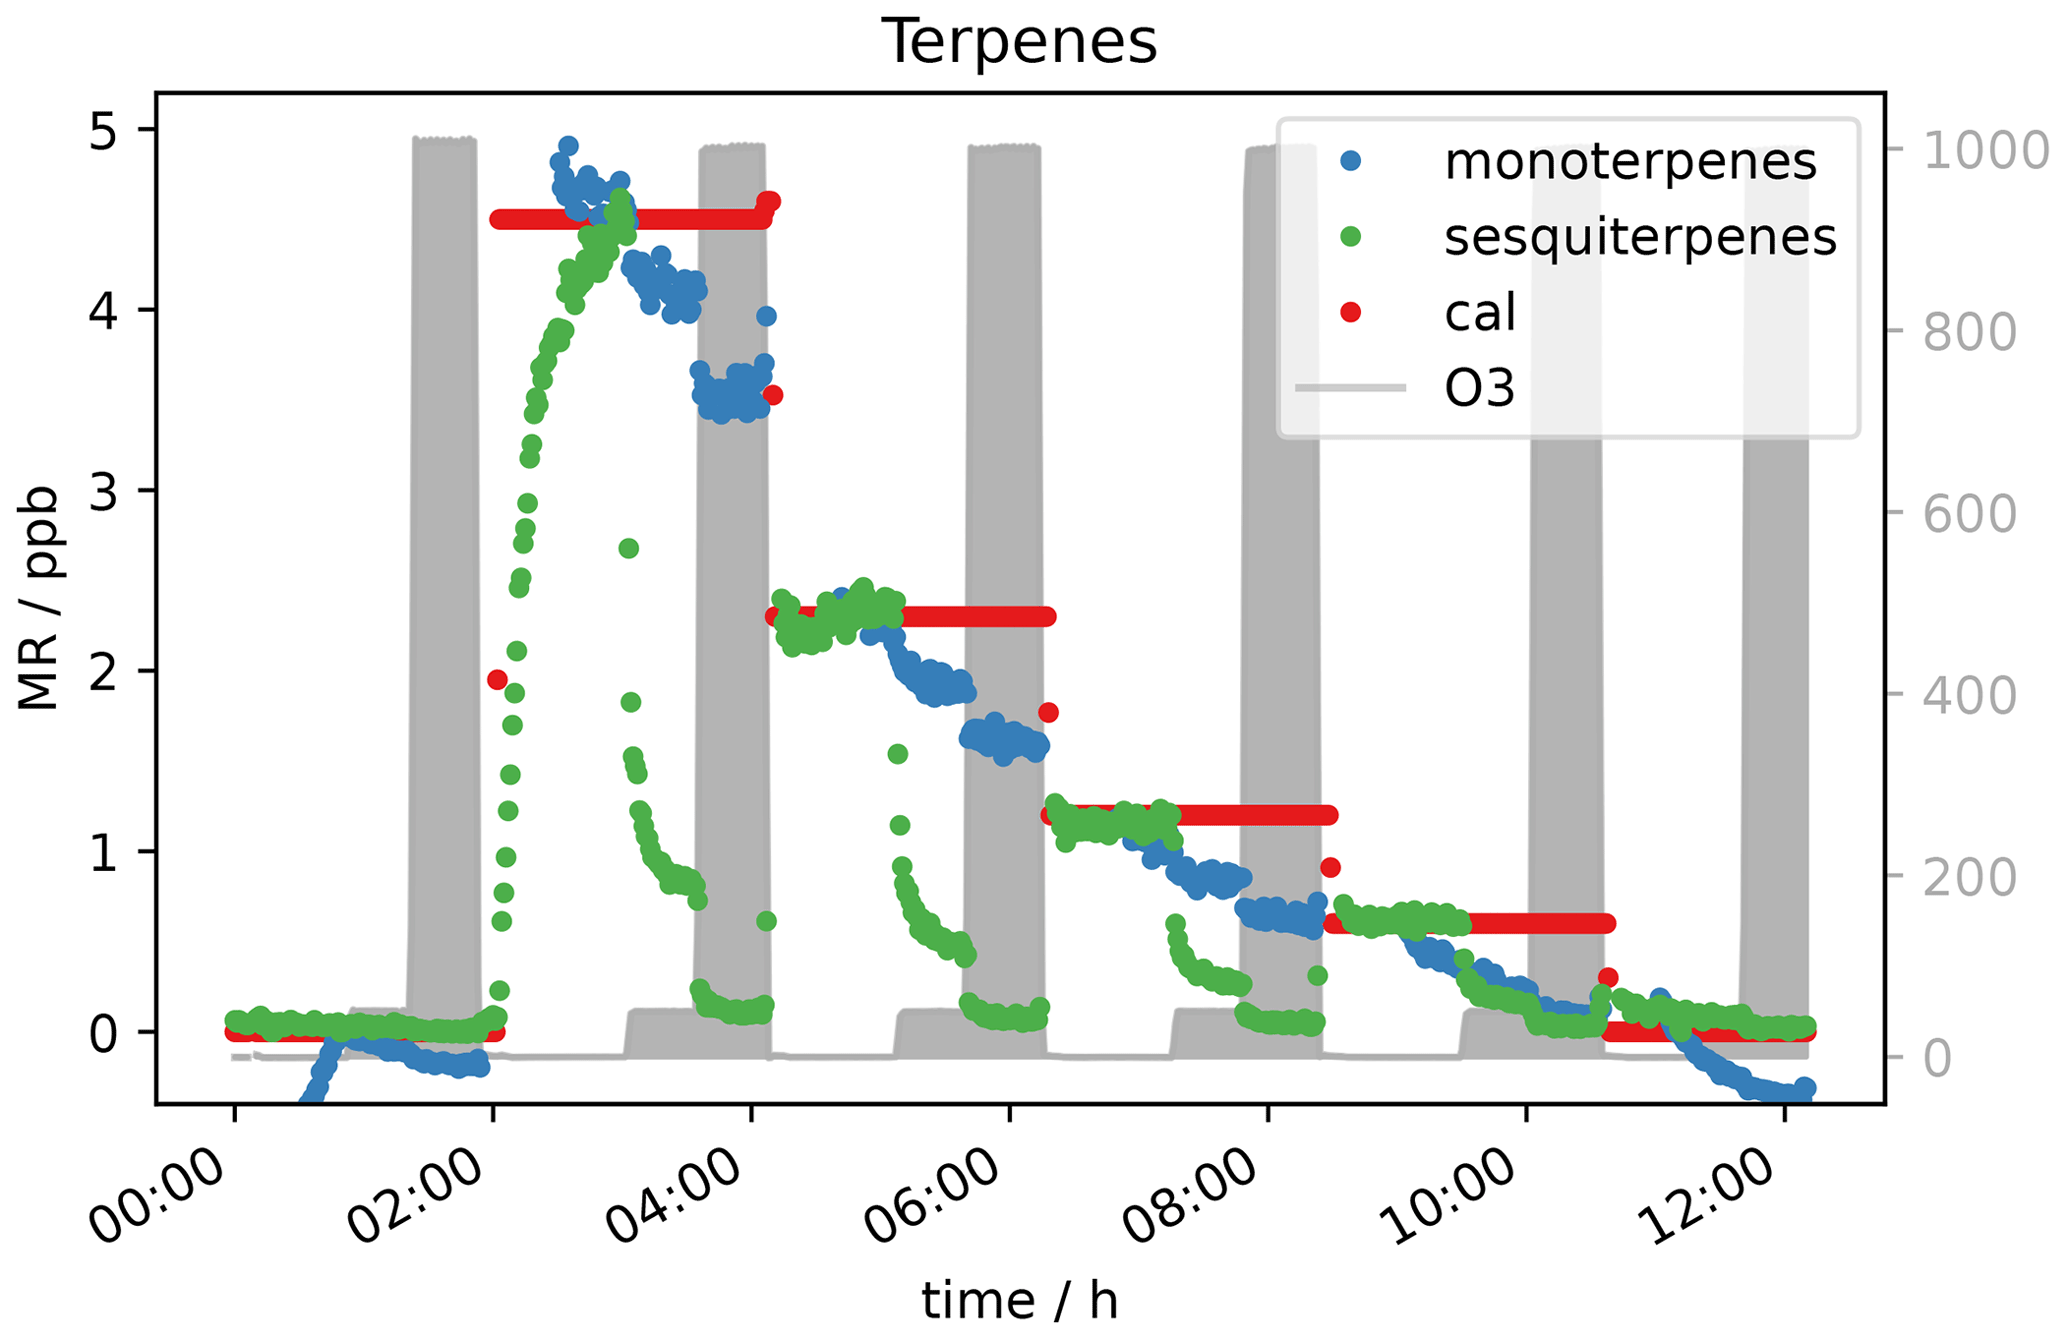
Due to the presence of reactive double bonds, terpenes (isoprene, alpha-pinene and beta-caryophyllene) were expected to show a decrease in mixing ratio with increasing ozone concentration. This was indeed observed. In Fig. 7 it can be seen that the monoterpene signal at 50 ppb O3 is 10 %–20 % lower for each VOC level compared to the signal without ozone present. The signal drops by almost the same percentage when O3 is increased to 1000 ppb. For sesquiterpenes the effect is even stronger. With 50 ppb O3, the signal drops by roughly 80 %, while the signal is close to or below detection limit at an ozone level of 1000 ppb depending on the terpene mixing ratio applied. This behaviour can be explained with reference to the different reaction rate constants k of the mono- and sesquiterpenes in the calibration gas with ozone. α-pinene, which is the monoterpene included in the standard gas mixture, has a reaction rate constant with ozone of 9.6 × 10⁻¹⁷ cm3 molecules−1 s−1, while k for β-caryophyllene is 1.2 × 10⁻¹⁴ cm3 molecules−1 s−1 (IUPAC, 2021). With a reaction rate more than 3 orders of magnitude larger, the reaction is fast enough to remove 1 ppb β-caryophyllene within the short time the sample air needs to travel through the inlet line (< 10 s). Furthermore, it can be seen that the sesquiterpene needs considerable time (more than an hour) to reach a steady-state level in the beginning of the experiment (∼ 3 h in Fig. 7), even with lines heated to 45 ∘C. This could be due to independent absorption of the FEP tubing of these less volatile species (Deming et al., 2019).
Another compound which was expected to show a decreasing mixing ratio with increasing ozone concentration due to its double bonds was isoprene. It was measured simultaneously with PTR- and GC-MS. As can be seen in Fig. 8, the signal is not measurably affected by adding 50 ppb O3. At an ozone level of 1000 ppb, the GC detects roughly 50 % less isoprene. This fits with expectations, as isoprene ozonolysis is rather slow, the reaction rate coefficient being close to the one for α-pinene (1.3 × 10⁻¹⁷ cm3 molecules−1 s−1), which results in only partial depletion of the isoprene present. Interestingly the PTR-ToF shows slightly higher mixing ratios of the isoprene mass ( 69) when ozone is present. The elevated signal on this mass can be caused by carbonyl compounds present in the sample air or in the inlet line. Literature reports the same exact mass commonly used for isoprene detection in PTR systems to be a fragment of certain aldehydes (Buhr et al., 2002; Ruzsanyi et al., 2013). Most likely the PTR 69 signal in the present study is elevated, because under the experimental conditions the positive offset from the carbonyl compounds is higher than the isoprene depletion. For the GC-MS, aldehydes do not interfere, as the analytes are separated in the chromatographic system prior to detection. The assumption is supported by the measurement of a zero air sample (no standard gas added into the system) at different ozone levels (see Fig. 9a). The GC does not detect any isoprene in the zero air sample regardless of the ozone concentration, while the PTR-MS shows an increasing 69 signal at O3 levels between 150 and 1000 ppb. Apparently the PTR-ToF-MS signal correlates with the oxidant's concentration. At 150 ppb O3 the PTR-MS detects approximately 100 ppt signal at the isoprene mass; at 400 ppb ozone PTR measurements show around 150 ppt and with the highest tested O3 concentration (1000 ppb) roughly 350 ppt.

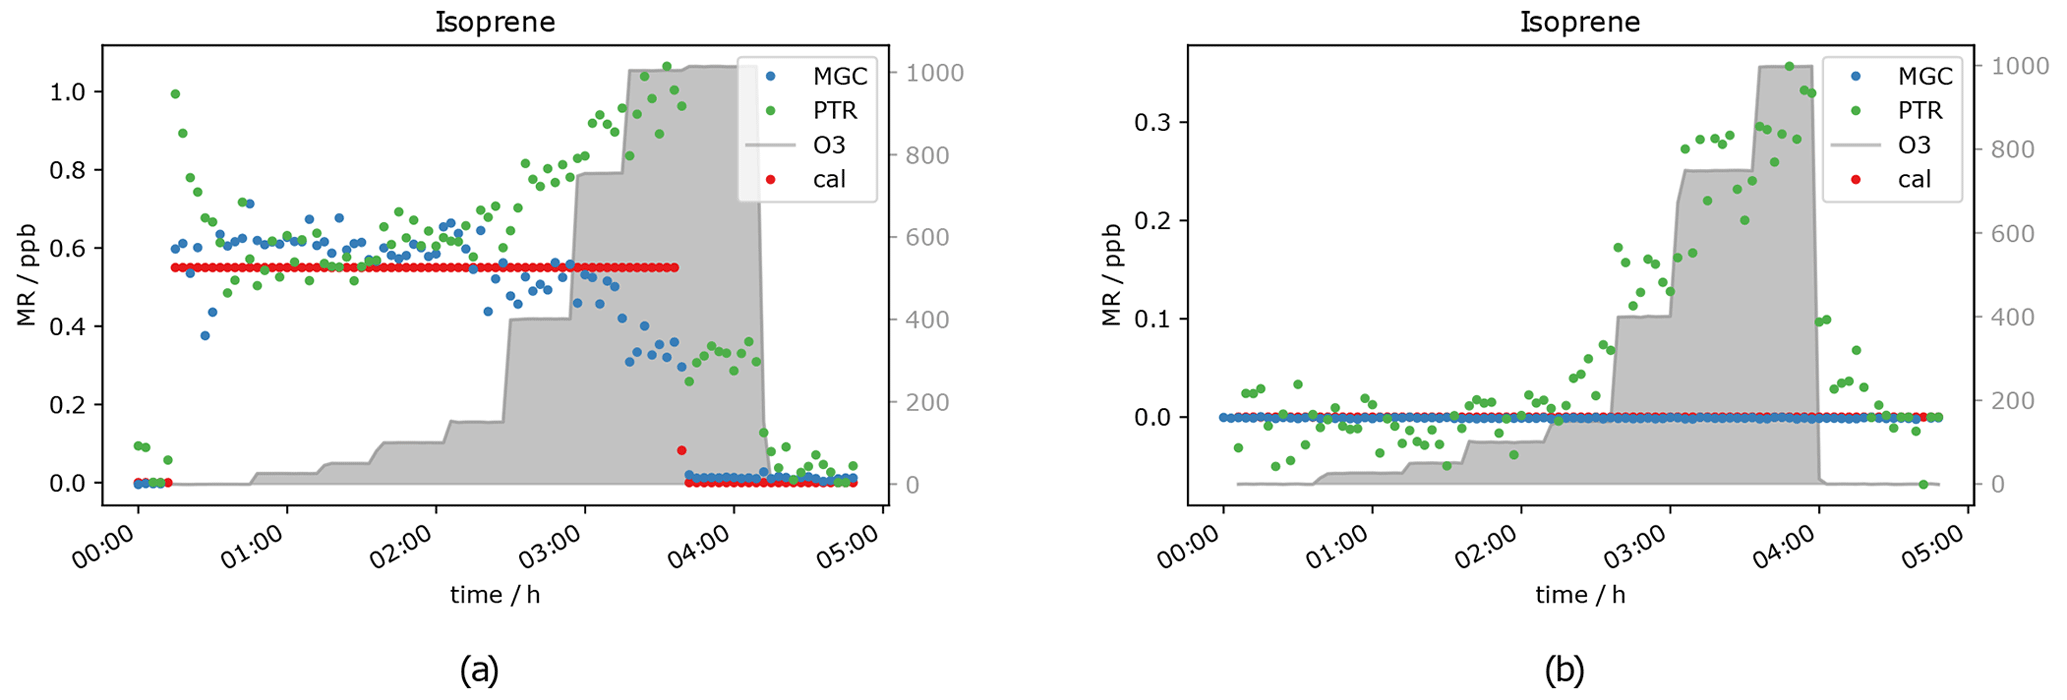
Figure 9b shows data obtained from the measurement of one isoprene level (∼ 0.6 ppb) at seven different ozone mixing ratios and without ozone. GC-isoprene is stable until 100 ppb O3. Somewhere between 150 and 400 ppb the isoprene signal starts to decrease until it reaches approximately two-thirds of the real value at 1000 ppb O3. The two analytical instruments show reverse effects of ozone being present: the PTR-isoprene mass signal is increasing over the same range as the GC signal decreases. This is in line with the measurement of the zero air. The PTR-signal increase is probably due to fragments of other compounds on the same exact mass. In literature, increased PTR 69 signals have been reported in high-ozone environments in indoor and outdoor air studies which could not be attributed to isoprene (Colomb et al., 2006; Wang et al., 2022). Those studies might have been influenced by the same interference we observed.
3.1.4 Effect of a sodium thiosulfate scrubber on VOC measurements
Generally, when the sodium thiosulfate impregnated quartz filters were added to the sampling system (see Fig. 1), no influence on the VOC measurements was seen for the selected VOCs. The literature also reports that this scrubbing material is suitable for measurement of many VOCs without causing interferences (Helmig, 1997; Pollmann et al., 2005). In Fig. 10 the measured terpene mixing ratios 0 and 2 ppb VOC with and without scrubber are shown. It can be seen that the scrubber performed as expected and removed the ozone effectively. α-pinene levels reach the same concentration with the scrubber as before ozone was applied. The measurement of this compound is not affected by the sodium thiosulfate filters, and if the scrubber is applied, there is no interference on the measurement with up to 170 ppb ozone. As mentioned before β-caryophyllene again needed a long time to reach steady state when 2 ppb VOC was applied to the system (inlet line temperature 45 ∘C; see Sect. 2.1). Steady state is reached after almost 2 h when the scrubber was introduced (∼ 4 h 30 min). For the 30–40 min when the thiosulfate filters were introduced (∼ 4 h 50 min–5 h 30 min) steady state is not even reached. Sesquiterpene adsorption by the tubing material would again explain this effect. The scrubber was connected using Teflon tubing and a filter holder of the same material. The first time when the terpene-rich air was directed through the scrubber (50 ppb O3, 5 h after the start of the experiment, ∼ 4 h 50 min–5 h 30 min) the sesquiterpene mixing ratio increased within half an hour, while later (170 ppb O3, ∼ 6 h–7 h 30 min) this was not the case. In other words, in the first half hour the sesquiterpenes appeared to be absorbed by the tubing (∼ 4 h 50 min–5 h 30 min), while afterwards the material was conditioned, and the concentration could reach steady state (∼ 6 h–7 h 30 min). Steady-state mixing ratios decrease with increasing O3 mixing ratio, as the scrubber was installed roughly halfway between the junction where the standard gas was connected and the analytical instruments. On their way to the scrubber, the sesquiterpenes are depleted by ozonolysis. Furthermore, at the applied flow rate of approximately 650 sccm, there is already about 10 ppb ozone passing the scrubber (see Sect. 3.2), which allows the oxidant to further react with β-caryophyllene on the way between the scrubber and the detector. An improved filter assembly or several scrubbing filters as suggested by Pollmann et al. (2005) could improve the sesquiterpene sampling. For all other compounds including isoprene no interference from the scrubber itself could be observed. Furthermore, interferences from ozone on the measurements of analytes like isoprene or acetaldehyde could be eliminated with the filter scrubber in line. The effect on sesquiterpenes could probably also be eliminated if the scrubber was placed at the inlet's front end and the flow through the scrubber was lower. However, it cannot be excluded that the sesquiterpene signal is affected by the scrubber material. Therefore, a longer time span with the scrubber in the sampling line would be required for the signal to reach steady state, and the instrument would be unresponsive to rapid changes.
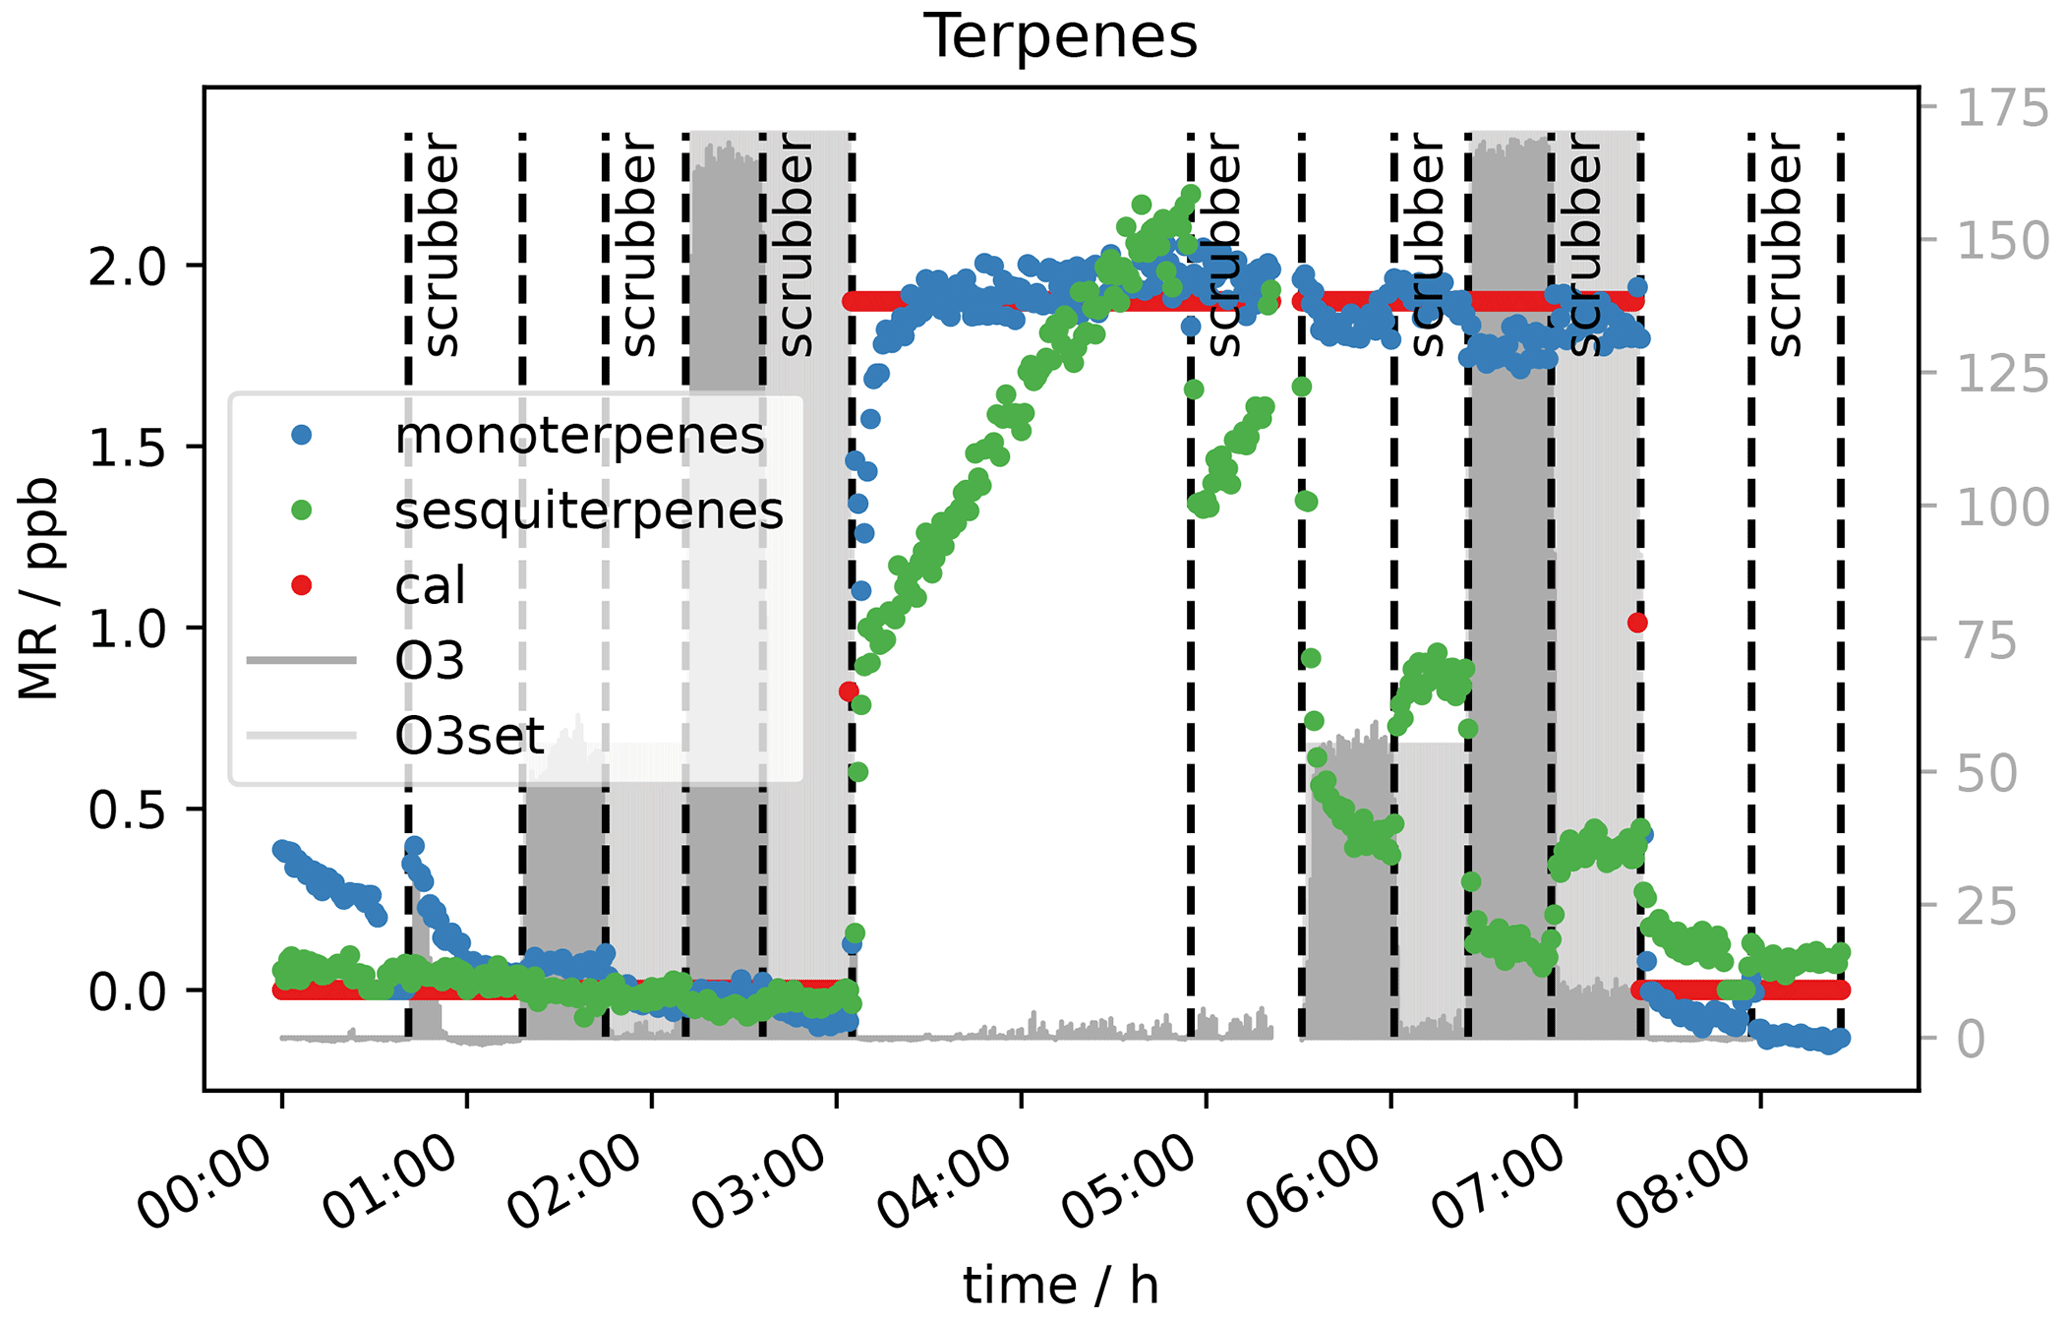
Figure 10Terpene mixing ratios measured by PTR-MS with and without scrubber at 50 and 170 ppb O3.
3.2 Scrubber endurance
Figure 11 shows the O3 mixing ratio measured with the ozone monitor behind the sodium thiosulfate scrubber under the dry condition at approximately 200 sccm. Results from the experiment at 1000 ppb O3 can be seen in Fig. 11a. The ozone concentration behind the filter never reached 0 ppb, already at the beginning 100 ppb oxidant could pass the scrubber. That means 1000 ppb ozone results in an overload of the scrubber capacity, and it was not suitable to remove the oxidant completely from the dry sample air – not even for short time periods. The concentration increases slightly in the beginning, while after 15 h a sudden signal rise can be observed where the mixing ratio increases from roughly 200 to 500 ppb. After 55 h no ozone was scavenged anymore; the concentration before the scrubber is the same as after. Despite inefficient scrubbing under these conditions, the scrubber lifetime would be 15 h, as after this time period a strong increase in the signal of the ozone monitor can be observed. In total it can be concluded that the sodium thiosulfate impregnated quartz filters made in the way described in the method section are not suitable for measurements at these flow rates and such high ozone levels as encountered in the lower stratosphere due to insufficient O3 removal and relatively fast depletion of the scrubbing material. However, at lower flow rates it might be more efficient and effective.
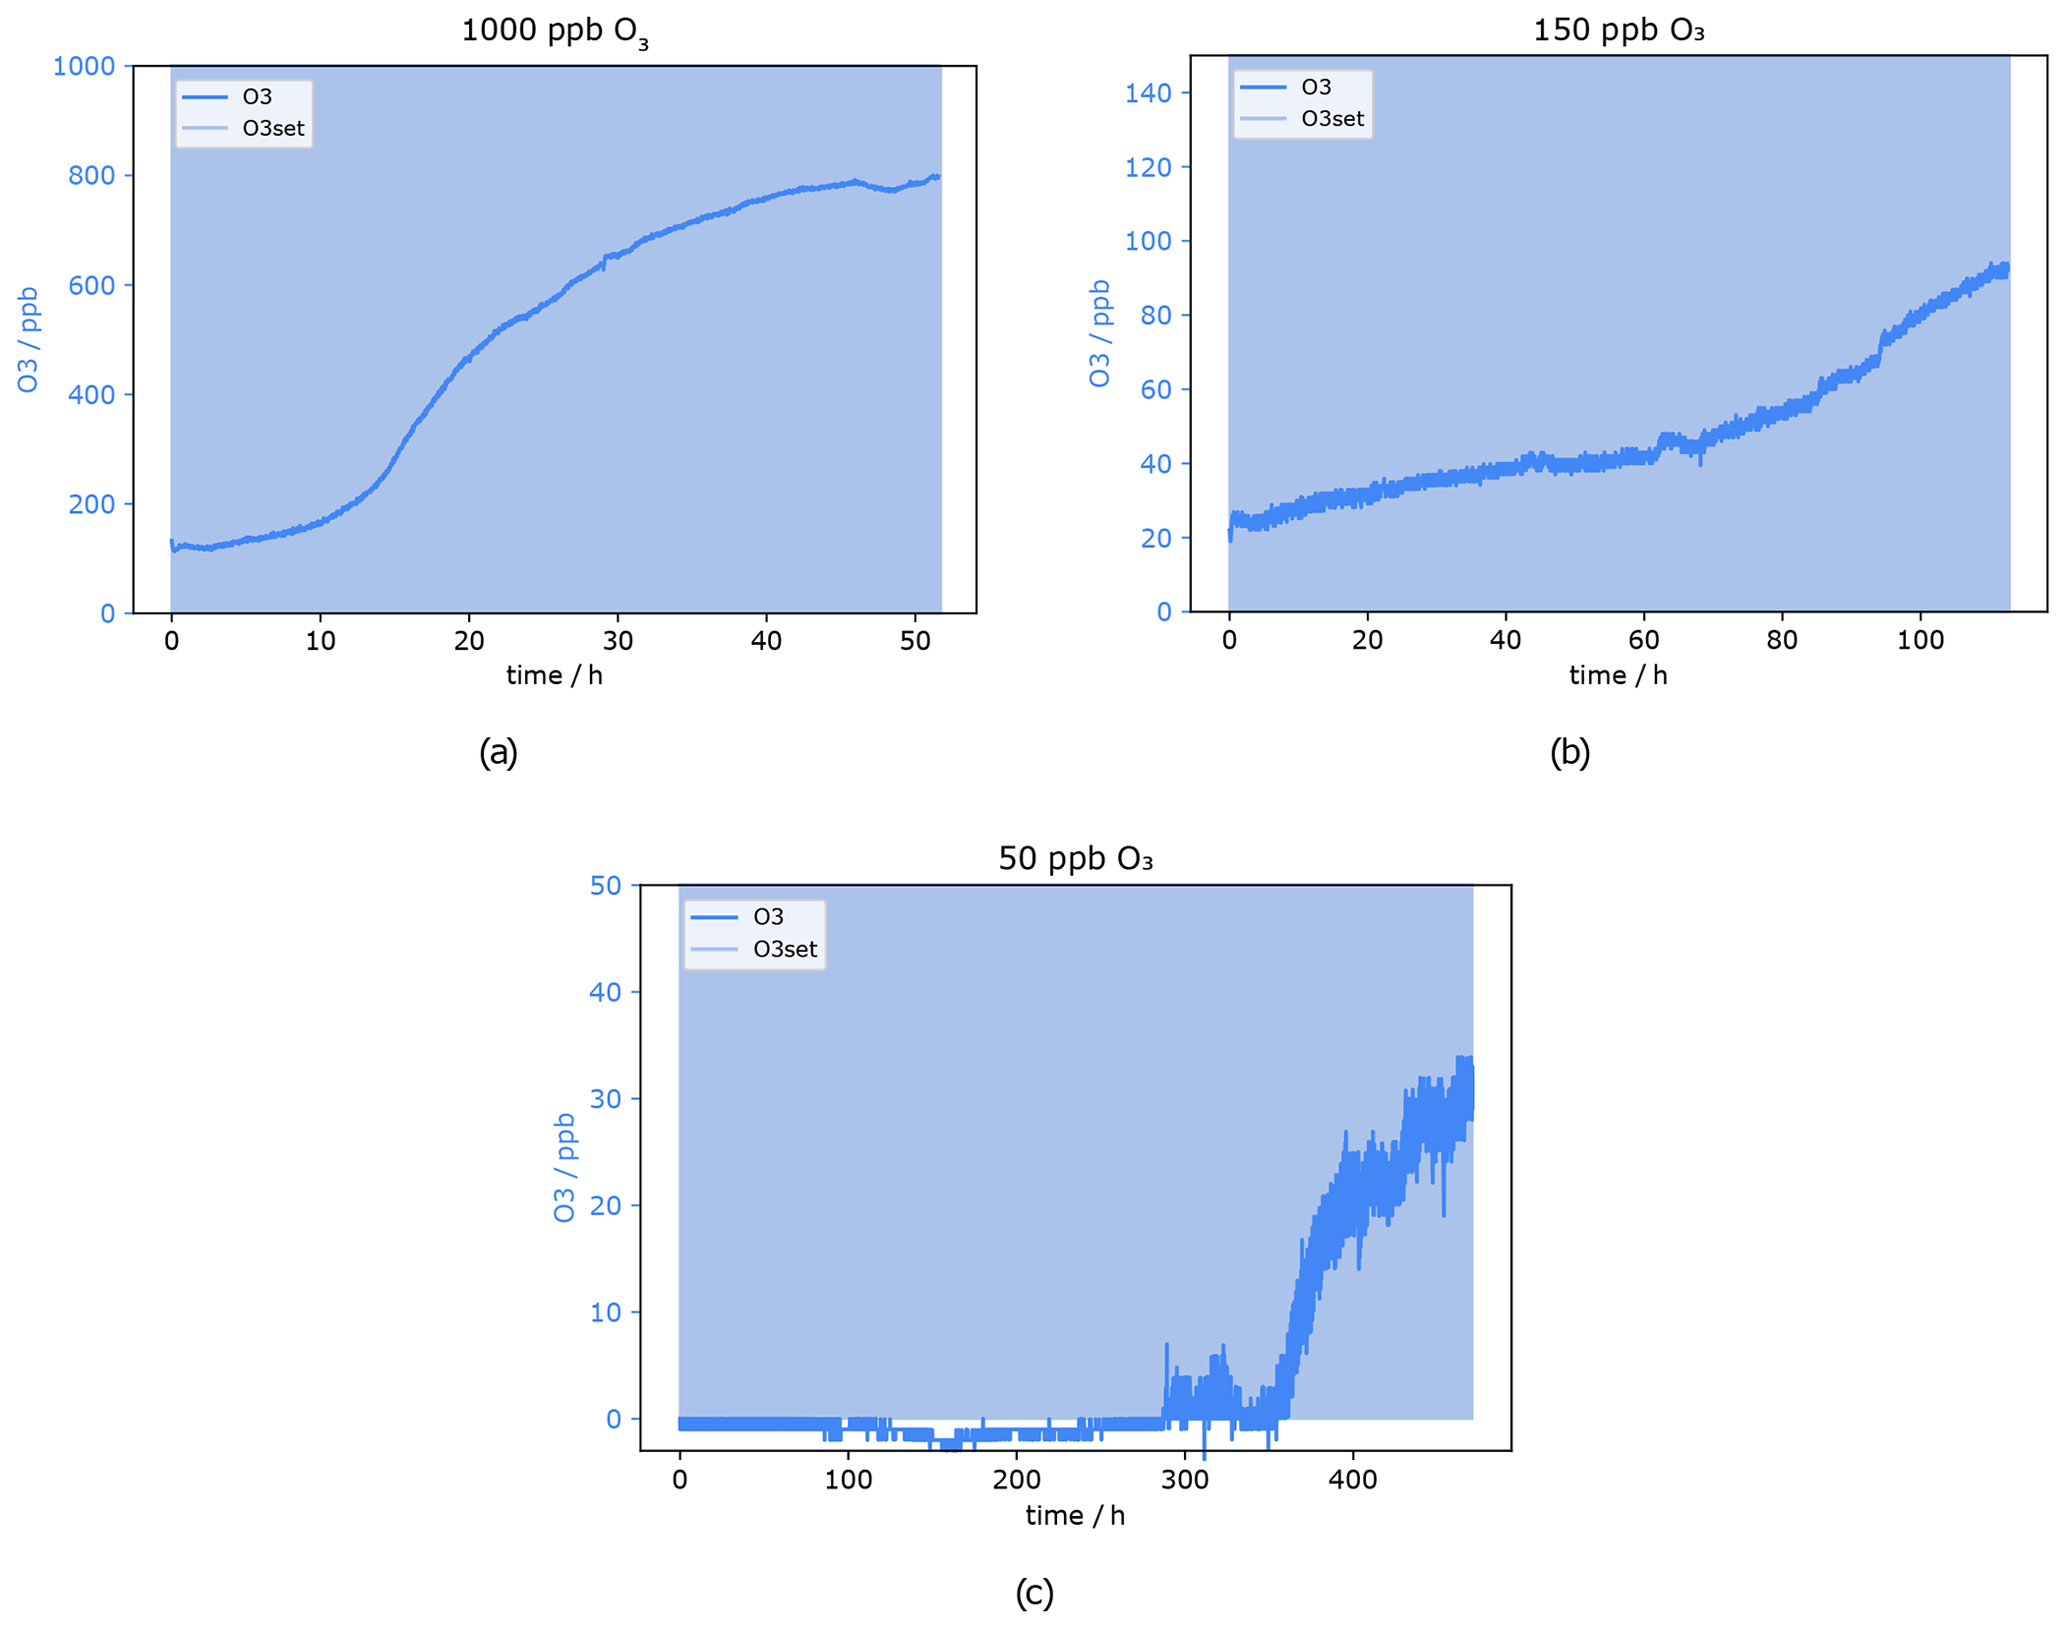
Figure 11O3 mixing ratio after Na2S2O3 scrubber at 0 % RH. Flows and O3 levels before scrubber: (a) 220 sccm, 1000 ppb; (b) 255 sccm, 150 ppb; and (c) 230 sccm, 50 ppb.
Figure 11b presents the result from a similar experiment but with 150 ppb ozone applied, which corresponds to high ozone levels at ground level and is typical for the upper troposphere. In the very beginning, the O3 concentration was already 20 ppb. It can be excluded that the filter is not able to remove the O3 completely, as the experiment was started twice under these conditions. The first time the ozone mixing ratio was zero at the beginning, but unfortunately the experiment had to be stopped after 50 h. There was no sudden signal increase visible within that time. This 20 ppb offset during the second experiment might be caused by the filter not being perfectly centred in the filter holder. It is possible that a tiny stream of air bypassed the filter inside the filter holder, as the 37 mm quartz filter was placed under a 47 mm Teflon filter as described in Sect. 2.3. With 150 ppb ozone applied, the measured mixing ratio increased by 20 ppb within 40 h and up to 50 ppb within 80 h. As previously shown even isoprene was not affected by 50 ppb ozone. The only compounds affected by such low O3 levels were mono- and sesquiterpenes. Therefore, it is concluded that the ozone scrubber can be used for up to 80 h (3.3 d) at a flow of 255 sccm. The scrubber lifetime test for the lowest ozone concentration used here (50 ppb) took in total more than 20 d. During the first 300 h (12.5 d) the signal did not change and was below or close to the limit of detection of 0.5 ppb. Around 300 h the measured mixing ratio started to be above detection limit but still below 5 ppb O3. A sudden increase occurred after approximately 350 h (14.5 d), where the mixing ratio climbed up to 20 ppb within 1.5 d. After the total time of 477 h (almost 20 d) the experiment was stopped; the mixing ratio after the scrubber reached more than 30 ppb. The breakthrough point of the Na2S2O3 impregnated filter after 350 h was determined as the end of the scrubber lifetime i.e. at background O3 mixing ratios of 50 ppb the scrubber lasts more than 14 d.
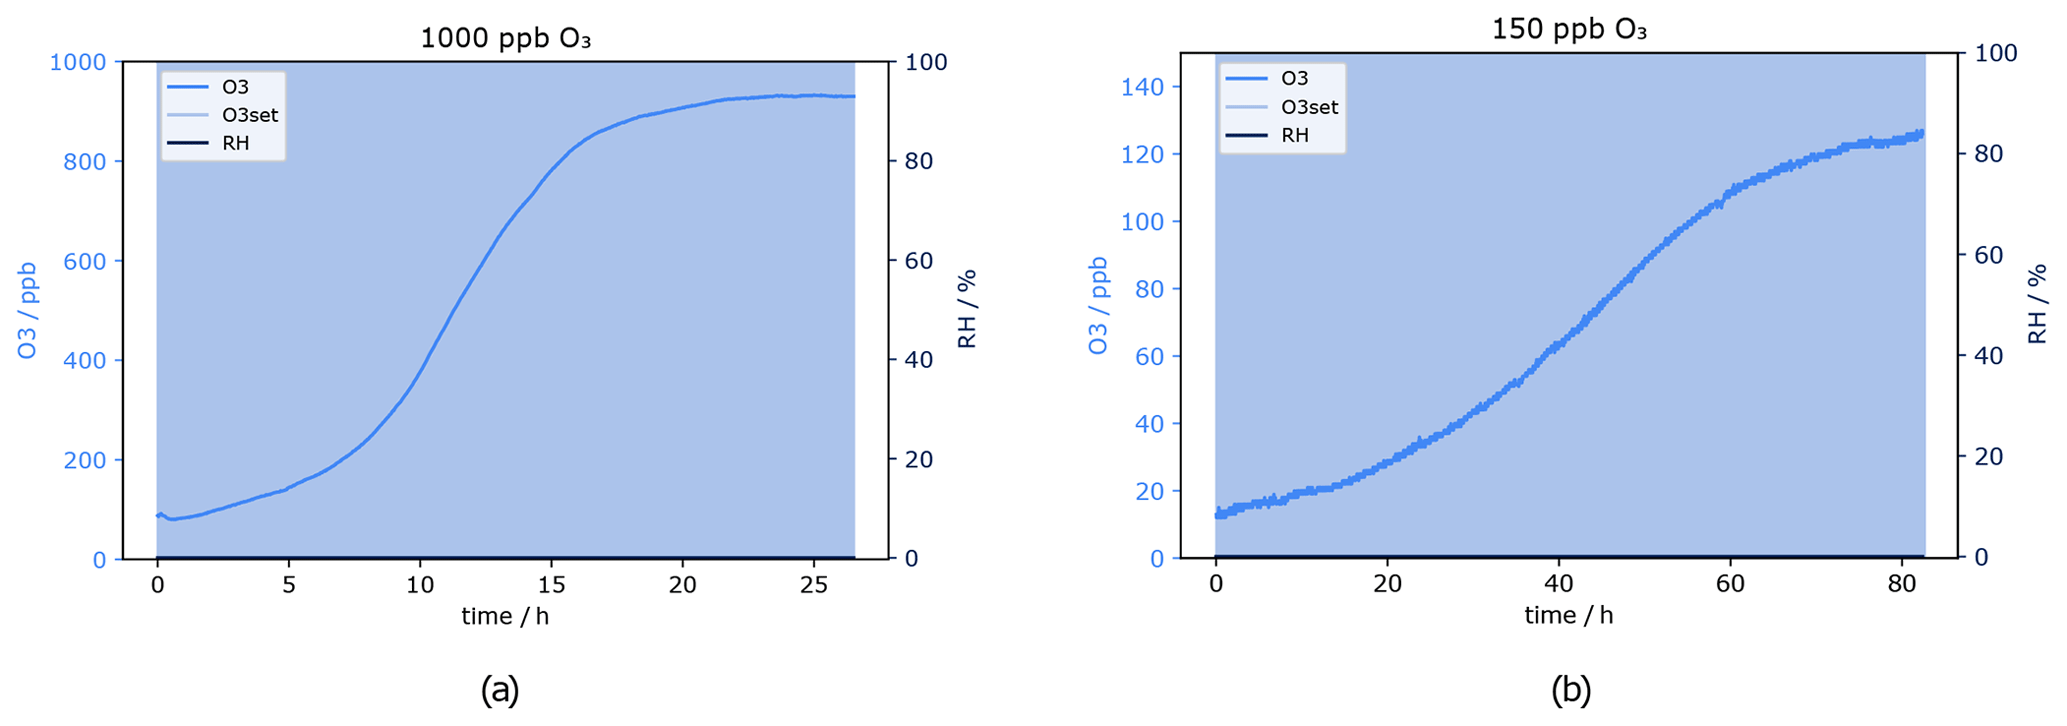
Figure 12O3 mixing ratio after Na2S2O3 scrubber at 0 % RH. Flows and O3 levels before scrubber: (a) 550 sccm, 1000 ppb and (b) 620 sccm, 150 ppb.
Results of the test at a flow of 550 sccm, which corresponds approximately to the flow used for the experiments to investigate the effect of ozone on the VOC measurements (Sect. 3.1), are presented in Fig. 12. Please note that for the average and minimum scrubber lifetimes only measurements at O3 levels 150 and 1000 ppb have been included, as for 50 ppb there was no measurement at approximately 550 sccm. For quality assurance it is considered important to have a real measurement which can be compared with the calculated results.
The scrubber lifetime is 8 h at 550 sccm and 1000 ppb O3 according to Fig. 12a. At the lower ozone level (150 ppb), the actual flow was 620 sccm. From the plot a lifetime of 30 h has been determined.
Scrubber lifetime τ highly depends on ozone concentration and flow rate. In Table 3 measured flows and lifetimes can be found. The data were fitted with a power function (y=axb; see Fig. 13) being the best fit with R2 close to 1. Additionally, the lifetimes for exactly 200 and 550 sccm were calculated with Eq. (1) and can be found in Table 4. The factors a and b obtained from the fit were rounded to 3 500 000 and −1 respectively, as small changes are attributed to measurement uncertainties.
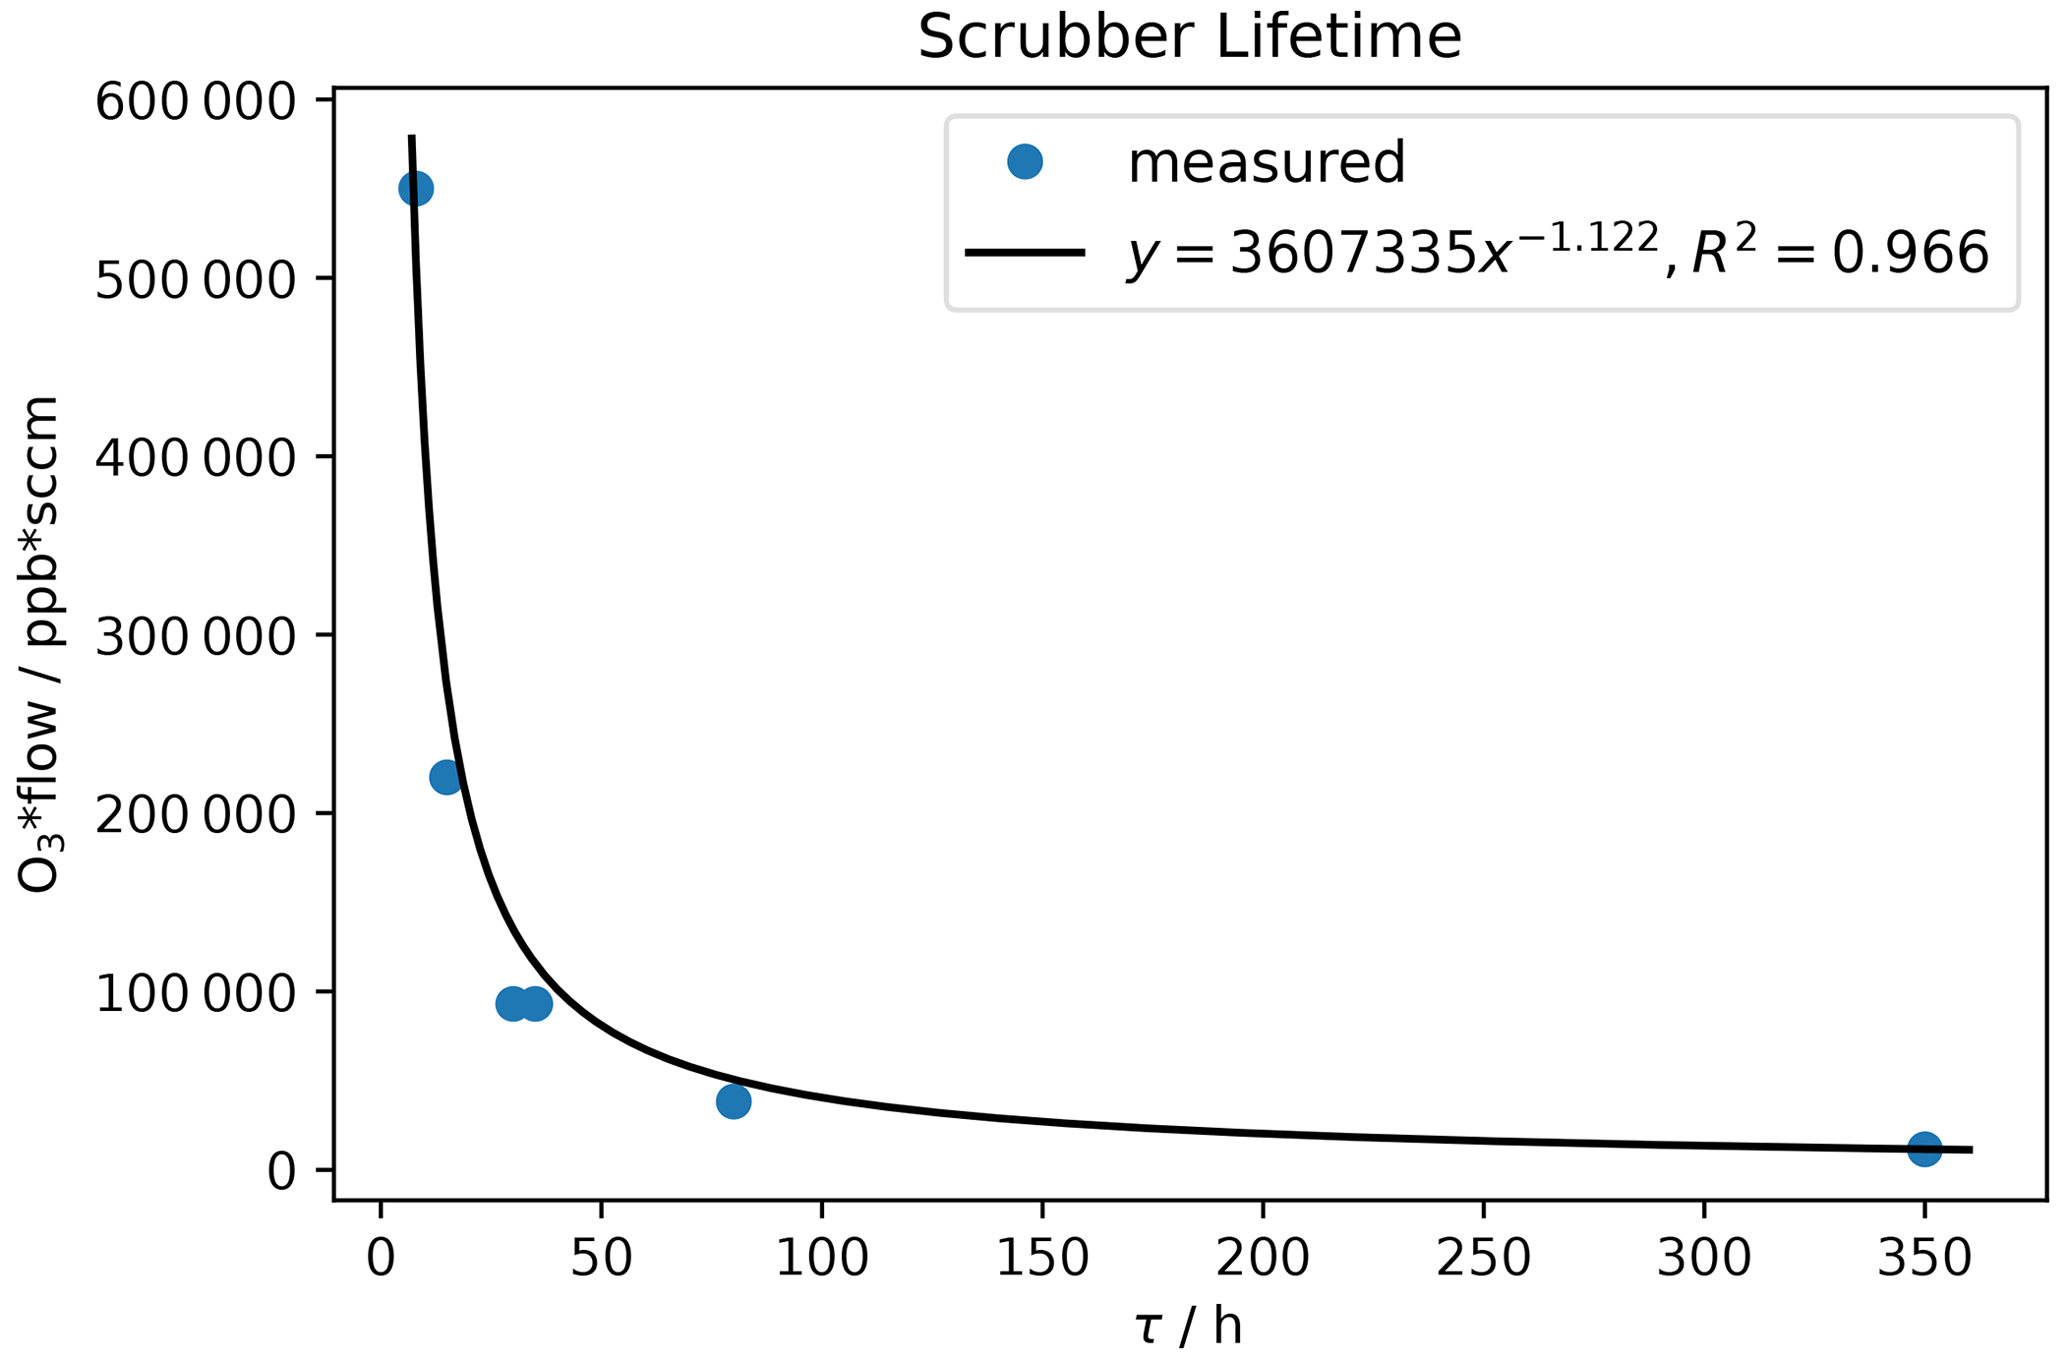
Table 3Ozone mixing ratio and corresponding flows through the scrubber during scrubber endurance tests, as well as resulting lifetimes τ.
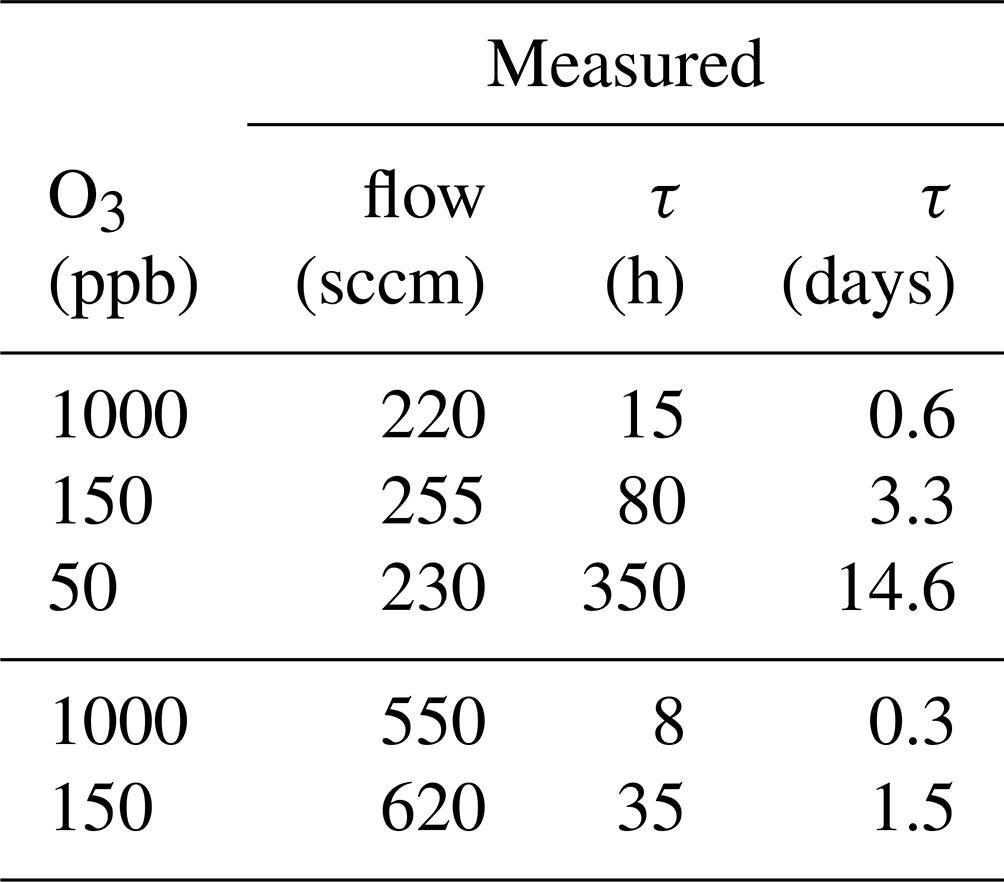
Table 4Calculated scrubber lifetimes τ at exactly 200 and 550 sccm.

The ozone levels were chosen to correspond to those experienced in the troposphere (50 and 150 ppb O3) and stratosphere (1000 ppb O3) so that replacement times of the scrubber under field conditions could be determined. Flows correspond to the inlet flows of the mass spectrometers (200 sccm) and to the flow used for the experiments described in Sect. 3.1.
The calculated lifetime at 200 sccm and 1000 ppb ozone is 18 h. Hence, this is the time after which the filter should be exchanged under these conditions if reducing ozone to 100–200 ppb is enough for the compounds of interest. If the background ozone mixing ratio does not exceed 150 ppb and the flow is the same as used for the here applied mass spectrometers (200 sccm), the scrubber needs to be replaced after 117 h to avoid interference from ozone for analysis of most VOCs except terpenes. However, on many ground-based measurement sites in the troposphere the ozone mixing ratio rarely exceeds 50 ppb, which would result in a scrubber exchange every 14 d to assure efficient ozone removal. The lifetime calculation at 550 sccm and stratospheric ozone concentration results in a scrubber lifetime of 6 d and is slightly lower than the measured lifetime (8 d; see Fig. 12a). With 150 ppb O3 and the same flow τ would be 42 h and filter replacement would be due in less than 2 d. The determination of the lifetime is approximate, as we use the time at which a sudden increase in ozone concentration after the scrubber was observed. Exchanging the filter earlier does not affect the data quality and is therefore recommended. The filter assembly could be improved by using a filter housing which fits perfectly to the filter diameter in order to avoid any small air stream bypassing the filter. In this study, we did not examine the effect of several filters placed in series in the line, as it was done by Pollmann et al. (2005). They found that with additional filters the scrubbing efficiency and scrubber endurance could be improved, but we adopted single filters to test their efficacy and endurance while minimizing potential uptake losses.
However, in Sect. 3.1 the presented experiments were all performed in less than 1 d, and the maximum ozone concentration (1000 ppb) was applied for only several hours. Thus, the ozone concentration was stable throughout each experiment.
3.3 Effect of humidity
Field measurements can take place in various locations and environmental conditions. Relative humidity may influence the analysis of water soluble compounds. However, the presence of water may also affect the behaviour of VOC molecules when interacting with surfaces. The scrubber material used here is inorganic and water soluble and has therefore been tested under dry and humid conditions. For the measurements performed within this study, humidity did not have any influence on the GC-MS and PTR-ToF-MS instrument measurement capability, as these dried the air before detection (GC-MS) or used humid calibrations (PTR-ToF-MS). Thus any effects observed can be ascribed to the inlet system. Interestingly, the scrubber lifetime increased dramatically at 80 % relative humidity. The test was done twice to double-check the results obtained. Figure 14 shows the ozone mixing ratio and relative humidity measured at 1000 ppb O3 and a flow of 230 sccm. RH was relatively stable throughout the whole experiment. As mentioned in Sect. 3.2, under similar dry conditions the sodium thiosulfate scrubber was able to remove only 90 % of the ozone, and filter performance dropped drastically after 15 h. In contrast, at 80 % RH the ozone could be removed completely from the sample air. The O3 mixing ratio did not change over 65 h of experiment; it was always below 10 ppb. After 65 h the experiment was stopped.
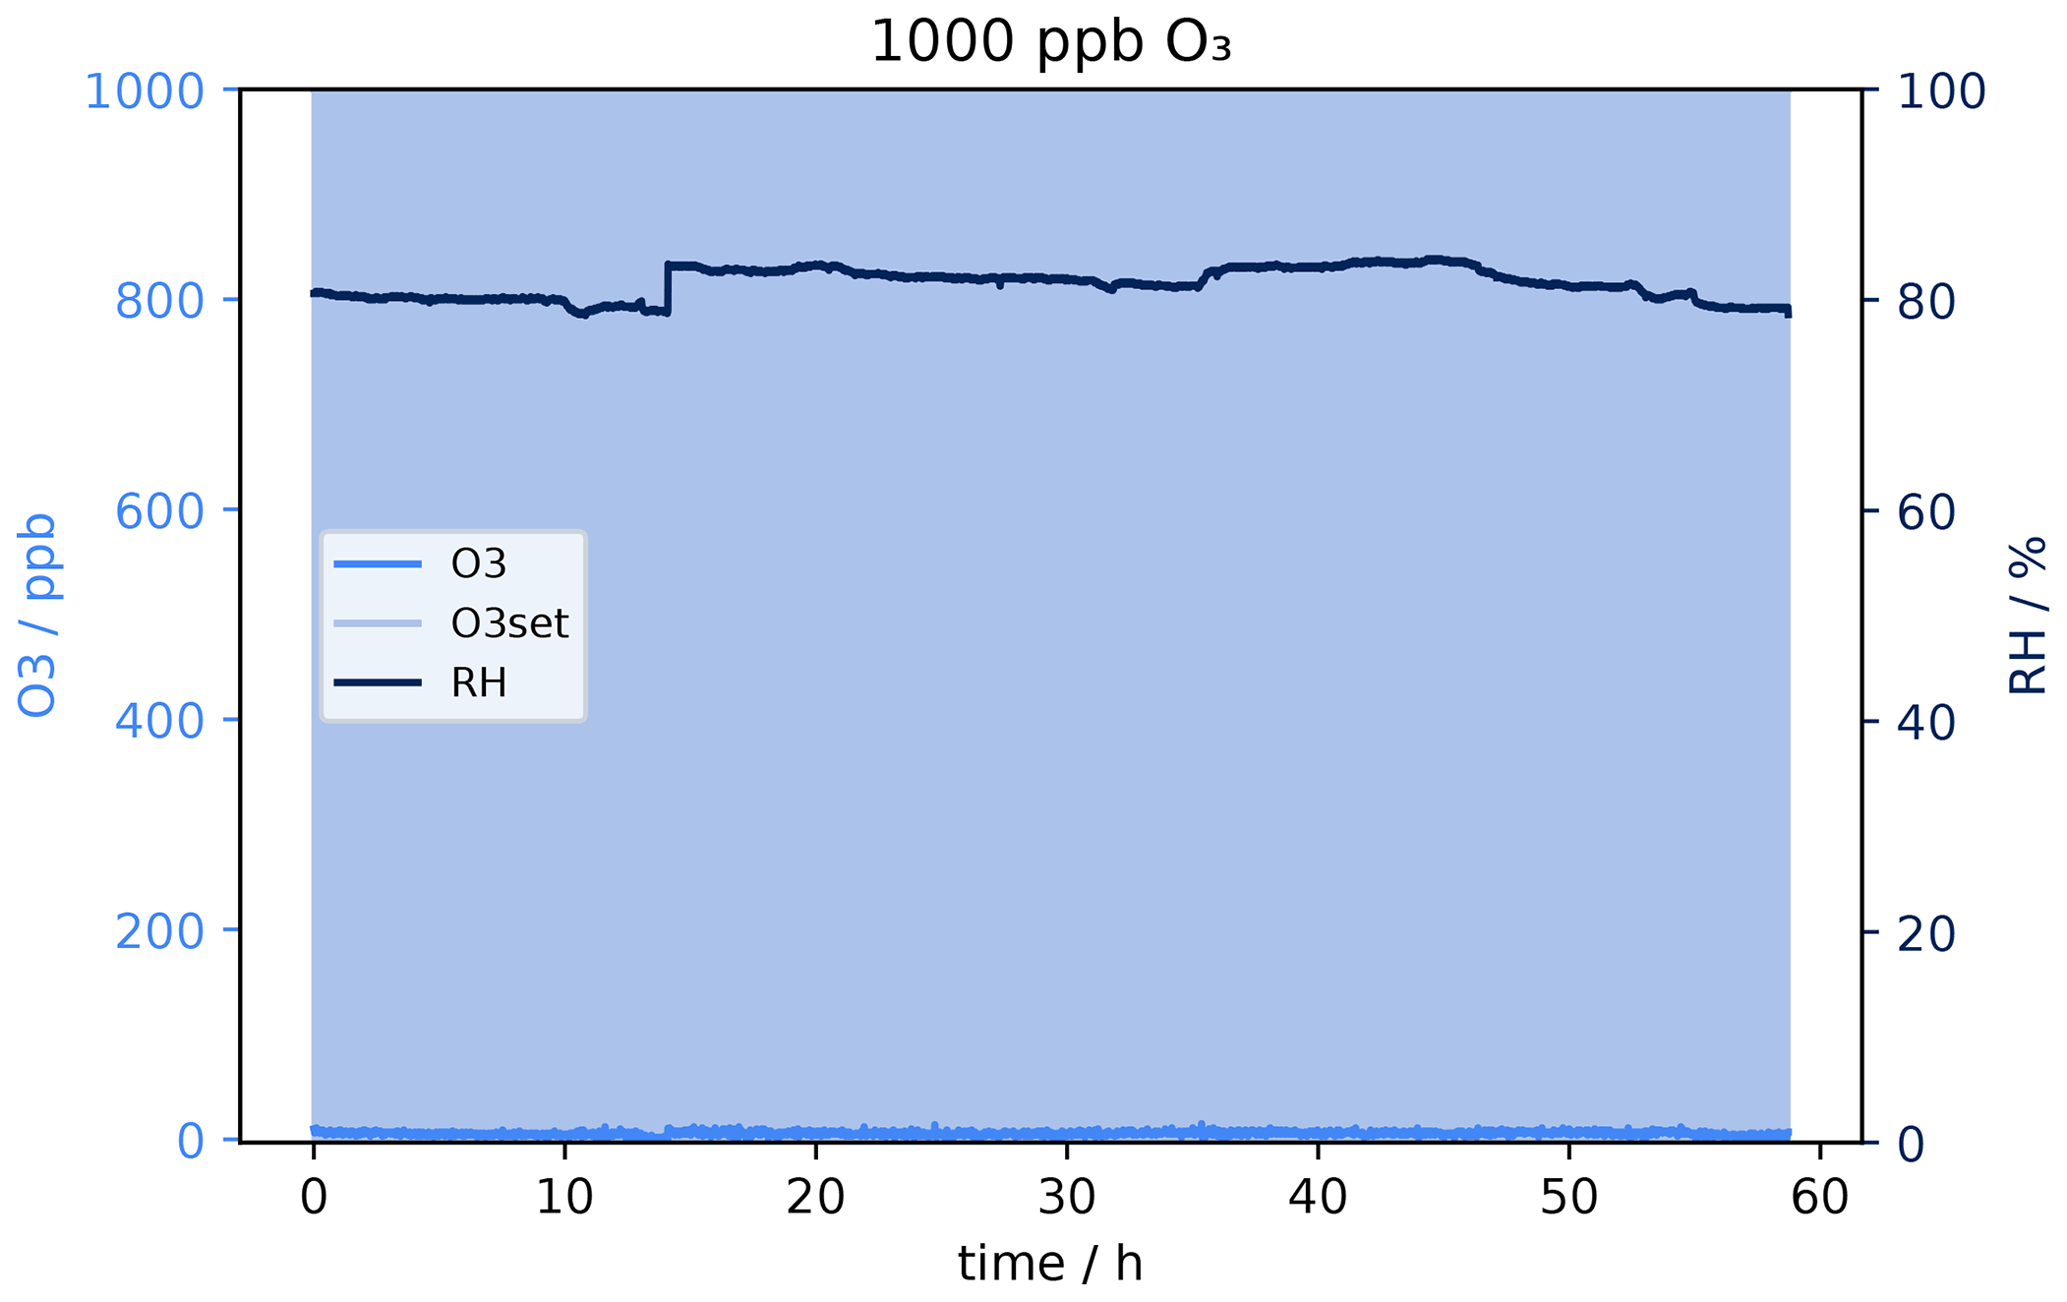

Figure 15Sesquiterpene mixing ratio with and without scrubber at different O3 mixing ratios when 2 ppb sesquiterpenes were introduced to the system: (a) 0 % RH and (b) 50 % RH.
The only signal that was still influenced by ozone when the filter scrubber was in the sample line was the sesquiterpene signal. Consequently the corresponding mixing ratio can be used to investigate whether or not relative humidity changes the results compared to the dry condition. Figure 15 shows the sesquiterpene mixing ratio under dry (Fig. 15a) and humid (Fig. 15b) conditions when ca. 2 ppb standard gas was introduced to the system. In the first plot the signal with scrubber at 50 ppb ozone (approx. 6 h–6 h 30 min) comes back to 50 % of the original signal, while in the second plot it comes back to approx. 80 % (approx. 8–9 h) of the original height. This is consistent with the results from the scrubber lifetime tests at 80 % RH and suggests that scrubber performance benefits from increased humidity.
Sodium thiosulfate reacts with ozone to tetrathionate, water and oxygen:
As it is an equilibrium reaction, the equilibrium will shift to the left if there is an excess of water, recovering the thiosulfate from the S4O produced. This could explain why the ozone level during the scrubber performance test at a relative humidity of 80 % was relatively stable throughout the whole measurement time, which was almost 3 d, and why all the oxidant can be scavenged at an O3 level of 1000 ppb.
Most species tested were not affected by ozone being present. Nevertheless, higher mixing ratios were observed for carbonyl compounds, indicating an ozone interference. Signals for acetaldehyde, propanal, acetone and butanal increased with ozone levels above 150 ppb in zero air measurements with GC, as well as PTR. Thus, it can be concluded that there are positive artefacts generated in the experimental setup, i.e. in the tubing, inside the ozone generator or within both of the mass spectrometers. As we observed the same during stratospheric measurements before, the ozone generator cannot be the only source. Apel et al. (2003) originally conducted ozone sensitivity tests on their airborne GC-MS system due to anomalous acetaldehyde observations in the stratosphere. Our experiments also show acetaldehyde to be the species most affected by ozone interference. When our PTR encountered a stratospheric intrusion in flight as on 2 June 2020 we found 0.88 ppb acetaldehyde (altitude 13 000 m, O3 465 ppb), extremely suspect for such a short-lived molecule under otherwise clean conditions. Unfortunately, the fast GC-MS did not measure acetaldehyde during this flight campaign. When 0.5 ppb VOC standard gas was measured, the signals for propanal and butanal decreased due to the reaction with the OH radical, generated from ozonolysis of terpenes. For MEK no ozone interference could be observed. Decreasing signals were found for monoterpenes (α-pinene), sesquiterpenes (β-caryophyllene) and GC-isoprene as expected due to the direct reaction with ozone. The PTR-ToF-MS measured increasing “isoprene” mixing ratios on 69 with increasing ozone concentration due to aldehyde fragments on the same exact mass. Those fragments are most likely ozonolysis products from some adsorbed species inside the FEP tubing or the instrument itself from some former measurements. Therefore caution should be applied when interpreting the isoprene mixing ratios provided by PTR-ToF-MS in high-ozone environments. Generally the scrubber lifetime under tropospheric conditions (O3 mixing ratios between 50 and 150 ppb) and a flow of 200 sccm is between 5 and 14 d. The inlet flow of both instruments is the same (200 sccm); therefore the result can directly be used for ground-based field measurements with the here employed PTR-ToF-MS and fast GC-MS systems. Sodium thiosulfate impregnated quartz filters are a very convenient means of ozone scavenging, as the filters can be prepared in advance easily and at a low cost and can be stored in a dry, dark and clean place. The preparation, as well as the application, are simple, and the usage time for the filters is with several days long enough to allow measurement of complete diel cycles without stopping the measurements in between to open the inlet line for scrubber exchange. Nevertheless, the scrubbing technique as applied here is not suitable for sesquiterpene measurement. The observed loss of these analytes could be reduced with a Na2S2O3 scrubber in line, but it could not be eliminated completely. Similar results have been reported earlier. Pollmann et al. (2005) found ozone concentrations in the sampling air reduced to 0.4 % when using a thiosulfate scrubber at an ozone mixing ratio of 100 ppb and 255 sccm. Unfortunately they did not report how long these conditions were measured. Nevertheless, their finding is comparable to that reported here; at 150 ppb O3 and at the same flow the scrubber could reduce ozone to almost zero, while at 50 ppb the oxidant's mixing ratio was below the limit of detection for more than 14 d. The tests have shown that the scrubbing technique used in this study performs well for most ground-based operations of the VOC instruments, as inlet flows and ozone levels are usually low enough to stay within range of good performance of the sodium thiosulfate filter scrubber. Nonetheless, it is not possible to completely avoid sesquiterpene loss due to reaction with ozone during sampling. The current setup is not suitable for measuring highly ozone-reactive compounds such as sesquiterpenes or under high ozone conditions like in the lower stratosphere. Fortunately, since sesquiterpenes are emitted from the surface, they are extremely unlikely to be present in the stratosphere. In general it can be concluded that higher humidity has a positive influence on the VOC measurements performed here with a sodium thiosulfate filter scrubber, when ozone was present and no interference from the humidity on the gas analysis itself could be observed. Still, the O3 removal is not sufficient to measure sesquiterpenes when ozone is present, not even at a low mixing ratio such as 50 ppb. Implementing a stable humidification to the measurement system is non-trivial, and additional effects for other analytes could develop. It is important to continue the development and characterization of reliable techniques which are cheap and easy to implement for lab, as well as field, experiments.
In summary we can say that insertion of the ozone scrubber resulted in the removal of most of the interferences observed. This implies that most of the effects observed were initiated in the inlet, and any residual effects were produced within the instruments being therefore different and specific for each instrument. It is important to note that these improvements apply to the suite of gases tested here and presumably also to those with comparable vapour pressures and ozone reactivities. The filter system could be further improved with a low dead volume filter housing to avoid any tiny air streams bypassing the filter inside the assembly and by the installation of multiple scrubbing filters in series as was tested by Pollmann et al. (2005). However, it is important to consider that the introduction of a filter into the system can also induce some negative effects. For example, highly oxygenated low volatility species are likely to suffer losses on such a filter assembly. Such compounds may need entirely different approaches such as inlet-less collection onto adsorbent filled cartridges or ozone removal at the inlet entrance by the addition of nitric oxide (NO). Furthermore, the filter itself can introduce flow rate limits to the inlet due to its physical restriction of flow. Generally, for field studies, our current recommended strategy is to use a high-volume, constant temperature flow from the inlet tip to close to the instrument and then subsample that flow, through the ozone scrubber, into the instrument at a lower rate. The inlet material should be Teflon in agreement with the findings of Deming et al. (2019). VOC-emitting materials such as silicone should be avoided, and during high local pollution events (such as in an aircraft taxiing on the ground) inlets should be stoppered or back flushed to avoid strong contamination.
The data are published at https://doi.org/10.5281/zenodo.7576413 (Ernle and Ringsdorf, 2022).
LE and MAR designed the experiment, performed the measurements and analysed the data. LE wrote the manuscript draft and MAR and JW reviewed and edited the manuscript.
The contact author has declared that none of the authors has any competing interests.
Publisher’s note: Copernicus Publications remains neutral with regard to jurisdictional claims in published maps and institutional affiliations.
We would like to acknowledge our lab technicians Thomas Klüpfel and Rolf Hofmann for exchanging gas bottles during long experiments.
The article processing charges for this open-access publication were covered by the Max Planck Society.
This paper was edited by Daniela Famulari and reviewed by two anonymous referees.
Apel, E., Hills, A., Lueb, R., Zindel, S., Eisele, S., and Riemer, D.: A fast-GC/MS system to measure C2 to C4 carbonyls and methanol aboard aircraft, J. Geophys. Res.-Atmos., 108, 8794, https://doi.org/10.1029/2002JD003199, 2003. a, b, c, d, e, f, g, h
Bourtsoukidis, E., Helleis, F., Tomsche, L., Fischer, H., Hofmann, R., Lelieveld, J., and Williams, J.: An aircraft gas chromatograph–mass spectrometer System for Organic Fast Identification Analysis (SOFIA): design, performance and a case study of Asian monsoon pollution outflow, Atmos. Meas. Tech., 10, 5089–5105, https://doi.org/10.5194/amt-10-5089-2017, 2017. a, b, c
Buhr, K., van Ruth, S., and Delahunty, C.: Analysis of volatile flavour compounds by Proton Transfer Reaction-Mass Spectrometry: fragmentation patterns and discrimination between isobaric and isomeric compounds, Int. J. Mass Spectrom., 221, 1–7, 2002. a, b
Colomb, A., Williams, J., Crowley, J., Gros, V., Hofmann, R., Salisbury, G., Klüpfel, T., Kormann, R., Stickler, A., Forster, C., and Lelieveld, J.: Airborne measurements of trace organic species in the upper troposphere over Europe: the impact of deep convection, Environ. Chem., 3, 244–259, 2006. a
Crutzen, P. J. and Lelieveld, J.: Human impacts on atmospheric chemistry, Annu. Rev. Earth Pl. Sc., 29, 17–45, 2001. a
Deming, B. L., Pagonis, D., Liu, X., Day, D. A., Talukdar, R., Krechmer, J. E., de Gouw, J. A., Jimenez, J. L., and Ziemann, P. J.: Measurements of delays of gas-phase compounds in a wide variety of tubing materials due to gas–wall interactions, Atmos. Meas. Tech., 12, 3453–3461, https://doi.org/10.5194/amt-12-3453-2019, 2019. a, b, c, d
Ernle, L. and Ringsdorf, M. A.: VOCdata_O3_Na2S2O3scrubber (1.1), Zenodo [data set], https://doi.org/10.5281/zenodo.7576413, 2022. a
Helmig, D.: Ozone removal techniques in the sampling of atmospheric volatile organic trace gases, Atmos. Environ., 31, 3635–3651, 1997. a, b, c, d, e
IUPAC: Atmospheric Chemical Kinetic Data Evaluation, https://iupac-aeris.ipsl.fr/, last access: 2 October 2021. a
Koppmann, R.: Volatile organic compounds in the atmosphere, John Wiley & Sons, ISBN 978-1-405-13115-5, 2008. a, b
Koppmann, R., Johnen, F., Khedim, A., Rudolph, J., Wedel, A., and Wiards, B.: The influence of ozone on light nonmethane hydrocarbons during cryogenic preconcentration, J. Geophys. Res.-Atmos., 100, 11383–11391, 1995. a
Lehmpuhl, D. W. and Birks, J. W.: New gas chromatographic-electron-capture detection method for the determination of atmospheric aldehydes and ketones based on cartridge sampling and derivatization with 2, 4, 6-trichlorophenylhydrazine, J. Chromatogr. A, 740, 71–81, 1996. a, b, c
McDonald, B. C., De Gouw, J. A., Gilman, J. B., Jathar, S. H., Akherati, A., Cappa, C. D., Jimenez, J. L., Lee-Taylor, J., Hayes, P. L., McKeen, S. A., and Cui, Y. Y.: Volatile chemical products emerging as largest petrochemical source of urban organic emissions, Science, 359, 760–764, 2018. a
Northway, M., De Gouw, J., Fahey, D., Gao, R., Warneke, C., Roberts, J., and Flocke, F.: Evaluation of the role of heterogeneous oxidation of alkenes in the detection of atmospheric acetaldehyde, Atmos. Environ., 38, 6017–6028, 2004. a, b, c, d
Pagonis, D., Sekimoto, K., and de Gouw, J.: A library of proton-transfer reactions of H3O+ ions used for trace gas detection, J. Am. Soc. Mass Spectr., 30, 1330–1335, 2019. a
Pandis, S. N. and Seinfeld, J. H.: Atmospheric chemistry and physics: From air pollution to climate change, Wiley, ISBN 978-1-118-94740-1, 2006. a
Pollmann, J., Ortega, J., and Helmig, D.: Analysis of atmospheric sesquiterpenes: Sampling losses and mitigation of ozone interferences, Environ. Sci. Technol., 39, 9620–9629, 2005. a, b, c, d, e, f, g, h
Ruzsanyi, V., Fischer, L., Herbig, J., Ager, C., and Amann, A.: Multi-capillary-column proton-transfer-reaction time-of-flight mass spectrometry, J. Chromatogr. A, 1316, 112–118, 2013. a, b
Strömvall, A.-M. and Petersson, G.: Protection of terpenes against oxidative and acid decomposition on adsorbent cartridges, J. Chromatogr. A, 589, 385–389, 1992. a
ThermoFisherScientific: 49iQ Instruction Manual, Ozone Analyzer, 2020a. a
ThermoFisherScientific: 49iQPS Instruction Manual, Ozone Primary Standard, 2020b. a
Wang, N., Ernle, L., Bekö, G., Wargocki, P., and Williams, J.: Emission Rates of Volatile Organic Compounds from Humans, Environ. Sci. Technol., 56, 4838–4848, 2022. a, b, c
Warneck, P. and Williams, J.: The atmospheric Chemist’s companion: numerical data for use in the atmospheric sciences, Springer Science & Business Media, https://doi.org/10.1007/978-94-007-2275-0, 2012. a
Weschler, C. J. and Carslaw, N.: Indoor chemistry, Environ. Sci. Technol., 52, 2419–2428, 2018. a
Weschler, C. J. and Shields, H. C.: Potential reactions among indoor pollutants, Atmos. Environ., 31, 3487–3495, 1997. a
Williams, J.: Organic trace gases in the atmosphere: an overview, Environ. Chem., 1, 125–136, 2004. a