the Creative Commons Attribution 4.0 License.
the Creative Commons Attribution 4.0 License.
 | 08 May 2024
Report on Landsat 8 and Sentinel-2B observations of the Nord Stream 2 pipeline methane leak
Matthieu Dogniaux
Joannes D. Maasakkers
Daniel J. Varon
Ilse Aben
In late September 2022, explosions of the Nord Stream pipelines caused what could be the largest anthropogenic methane leak ever recorded. We report on Landsat 8 (L8) and Sentinel-2B (S-2B) observations of the sea-foam patch produced by the Nord Stream 2 (NS2) leak located close to Bornholm island, acquired on 29 and 30 September, respectively. Usually, reflected sunlight over sea is insufficient for these Earth imagers to observe any methane signal in nadir-viewing geometry. However, the NS2 foam patch observed here is bright enough to possibly allow the detection of methane above it. We apply the multi-band single-pass (MBSP) method to infer methane enhancement above the NS2 foam patch and then use the integrated mass enhancement (IME) method in a Monte Carlo ensemble approach to estimate methane leak rates and their uncertainties. This very specific NS2 observation case challenges some of MBSP and IME implicit assumptions and thus calls for customized calibrations: (1) for MBSP, we perform an empirical calibration of sea-foam albedo spectral dependence by using sea-foam observations in ship trails, and (2) for IME, we yield a tailored effective wind speed calibration that accounts for a partial plume observation, as methane enhancement may only be seen above the NS2 sea-foam patch. Our comprehensive uncertainty analysis yields large methane leak rate uncertainty ranges that include zero for single overpasses and, assuming they are independent, a best estimate of 502 ± 464 t h−1 for the combined averaged L8 and S-2B emission rate. Within all our Monte Carlo ensembles, positive methane leak rates have higher probabilities (80 %–88 %) than negative ones (12 %–20 %), thus indicating that L8 and S-2B likely captured a methane-related signal. Overall, we see our work both as a nuanced analysis of L8 and S-2B contributions to quantifying the NS2 leak emissions and as a methodological cautionary tale that builds insight into MBSP and IME sensitivities.
- Article
(2348 KB) - Full-text XML
-
Supplement
(5677 KB) - BibTeX
- EndNote


From 26 September to 2 October 2022, leaks occurred on the Nord Stream (NS) and Nord Stream 2 (NS2) pipelines in the Baltic Sea. They caused intensive bubbling and extensive foam patches at the sea surface, as well as methane emissions that could be one of the strongest methane leak events ever recorded (Sanderson, 2022). The southern NS2 sea-foam patch close to Bornholm island was observed on 29 and 30 September by Landsat 8 and Sentinel-2B (respectively), two Earth-imaging satellites that are sensitive to large methane point sources (Varon et al., 2021). We report on those two observations and exhibit the challenges they come with to evaluate the NS2 methane leak rate.
Anthropogenic methane emissions are the second largest contributor to human-induced climate change, and their drastic reduction is required to keep global warming below 1.5 or 2.0 °C (IPCC, 2021). In the past decade, developments in space-based methane observation have had a transformative impact on methane super-emitter detection and monitoring and can contribute to track progress towards the Paris Agreement goals (e.g. Nisbet et al., 2020). Among them, the TROPOspheric Monitoring Instrument (TROPOMI, Veefkind et al., 2012; Lorente et al., 2021) measures back-scattered sunlight in the short-wave infrared (SWIR) around 2.3 µm at 0.25 nm resolution, at a moderate 5.5 × 7 km2 spatial resolution at nadir and with daily global coverage. Global methane concentrations maps are drawn from these measurements using a full-physics approach which accounts for geophysical variables besides methane (e.g. albedo, water vapor, aerosol optical depth) that could interfere in the retrieval process (Lorente et al., 2021). Its observations have been successfully used to detect and estimate anthropogenic methane emissions arising from various point or localized sources (e.g. Pandey et al., 2019; Lauvaux et al., 2022; Schuit et al., 2023). SWIR satellite instruments with higher spatial resolution (few tens of meters) have proved complementary by enabling the identification of methane emission sources at facility scale. These notably include the methane-dedicated GHGSat constellation (Jervis et al., 2021) and Earth imagers such as Sentinel-2 or Landsat 8. Earth imagers are not spectrally resolved like TROPOMI and were not originally designed to measure greenhouse gases. However, under the right conditions (bright, quasi-homogeneous land surface), their methane-sensitive bands (∼ 100–200 nm in width) can be repurposed to retrieve large methane concentration enhancements and image point source emission plumes (e.g. Varon et al., 2021; Irakulis-Loitxate et al., 2022b). Like any other SWIR instrument, these Earth imagers do not typically offer coverage over water bodies, because the water albedo is too dark at nadir pointing. However, sun-glint observations over sea can allow methane plume detection with these satellites as well (Irakulis-Loitxate et al., 2022a).
When the NS and NS2 leaks occurred, and in the following week, TROPOMI was not able to acquire exploitable data over land in the Baltic Sea vicinity due to cloudiness. However, thanks to their finer spatial resolution, Landsat 8 (L8) and Sentinel-2B (S-2B) have been able to perform nadir-pointing observations showing the southern NS2 leak on 29 and 30 September, respectively. They did not benefit from sun glint, but the bright foam patch produced by the bubbling leak at the sea surface reflected enough sunlight to consider using the observations and assess whether a methane signal can be sensed. Besides L8 and S-2B, GHGSat could point their instruments towards the same NS2 leak on 30 September and observe a methane emission plume in glint geometry twice (GHGSat, 2022). After initial Twitter reports by the International Methane Emissions Observatory (IMEO, 2022), Jia et al. (2022) published results for the Sentinel-2B observation, acknowledging significant uncertainties in their methodology regarding the spectral reflectance of bubbles and the partial imaging of the methane plume.
This work first aims to show how Landsat 8 and Sentinel-2B observations of the Nord Stream 2 leak challenge implicit assumptions in methods usually applied for Earth-imager methane plume analysis and emission rate quantification. It then proposes to account for identified issues by using customized calibrations and to assess the possibility of using Landsat 8 and Sentinel-2B to sense and quantify methane emissions from the Nord Stream 2 leak.
This paper is structured as follows: Sect. 2 describes general aspects of the materials and methods used in this work as well as specific Nord Stream 2 calibrations. Section 3 presents the obtained methane leak rates. Finally, Sect. 4 highlights the conclusions of this work.
This section describes general aspects of the data and methods used here, as well as the custom calibrations that are necessary to adapt them to this singular Nord Stream 2 observation case.
2.1 Landsat 8 and Sentinel-2B satellite observations
2.1.1 General aspects
Landsat 8 (hereafter L8) is an Earth-imaging satellite with a swath of 185 km and a revisit time of 16 d. It measures reflected sunlight over 10 different spectral bands located in the visible, short-wave infrared (SWIR) and thermal infrared, with spatial resolutions ranging from 15 to 100 m (Roy et al., 2014).
The Copernicus Sentinel-2 mission comprises two Earth-imaging satellites (Sentinel-2A and Sentinel-2B, hereafter S-2B) with a swath of 290 km and revisit time of 10 d each and aims to monitor changes on our Earth's surface. They measure reflected sunlight over 12 different spectral bands located in the visible and SWIR, with spatial resolutions ranging from 10 to 60 m (Drusch et al., 2012).
Here, we use top-of-the-atmosphere (TOA) reflectance data observed by L8 and S-2B for two methane-sensitive SWIR spectral bands around 1.6 µm (bands 6 and 11 for L8 and S-2B, respectively) and 2.2 µm (bands 7 and 12 for L8 and S-2B, respectively). These L8 and S-2B SWIR observations have spatial resolutions of 30 and 20 m, respectively.
2.1.2 Nord Stream 2 leak observations
Figure 1 shows L8 and S-2B TOA reflectance observations of the NS2 methane leak (top panels) and exhibits, using simple empirically determined thresholds (see the Supplement), the different pixel types (dark still sea, NS2 leak, cloud) included in the images by comparing s1 and s2 TOA reflectance values (bottom panels). The L8 image acquired on 29 September 2022 is composed of the bubbling sea-foam patch at its center, surrounded by dark-still-sea and cloud pixels. The S-2B image acquired on 30 September 2022 is much cleaner and only includes the NS2 bubbling sea-foam patch at its center, surrounded by dark-still-sea pixels.
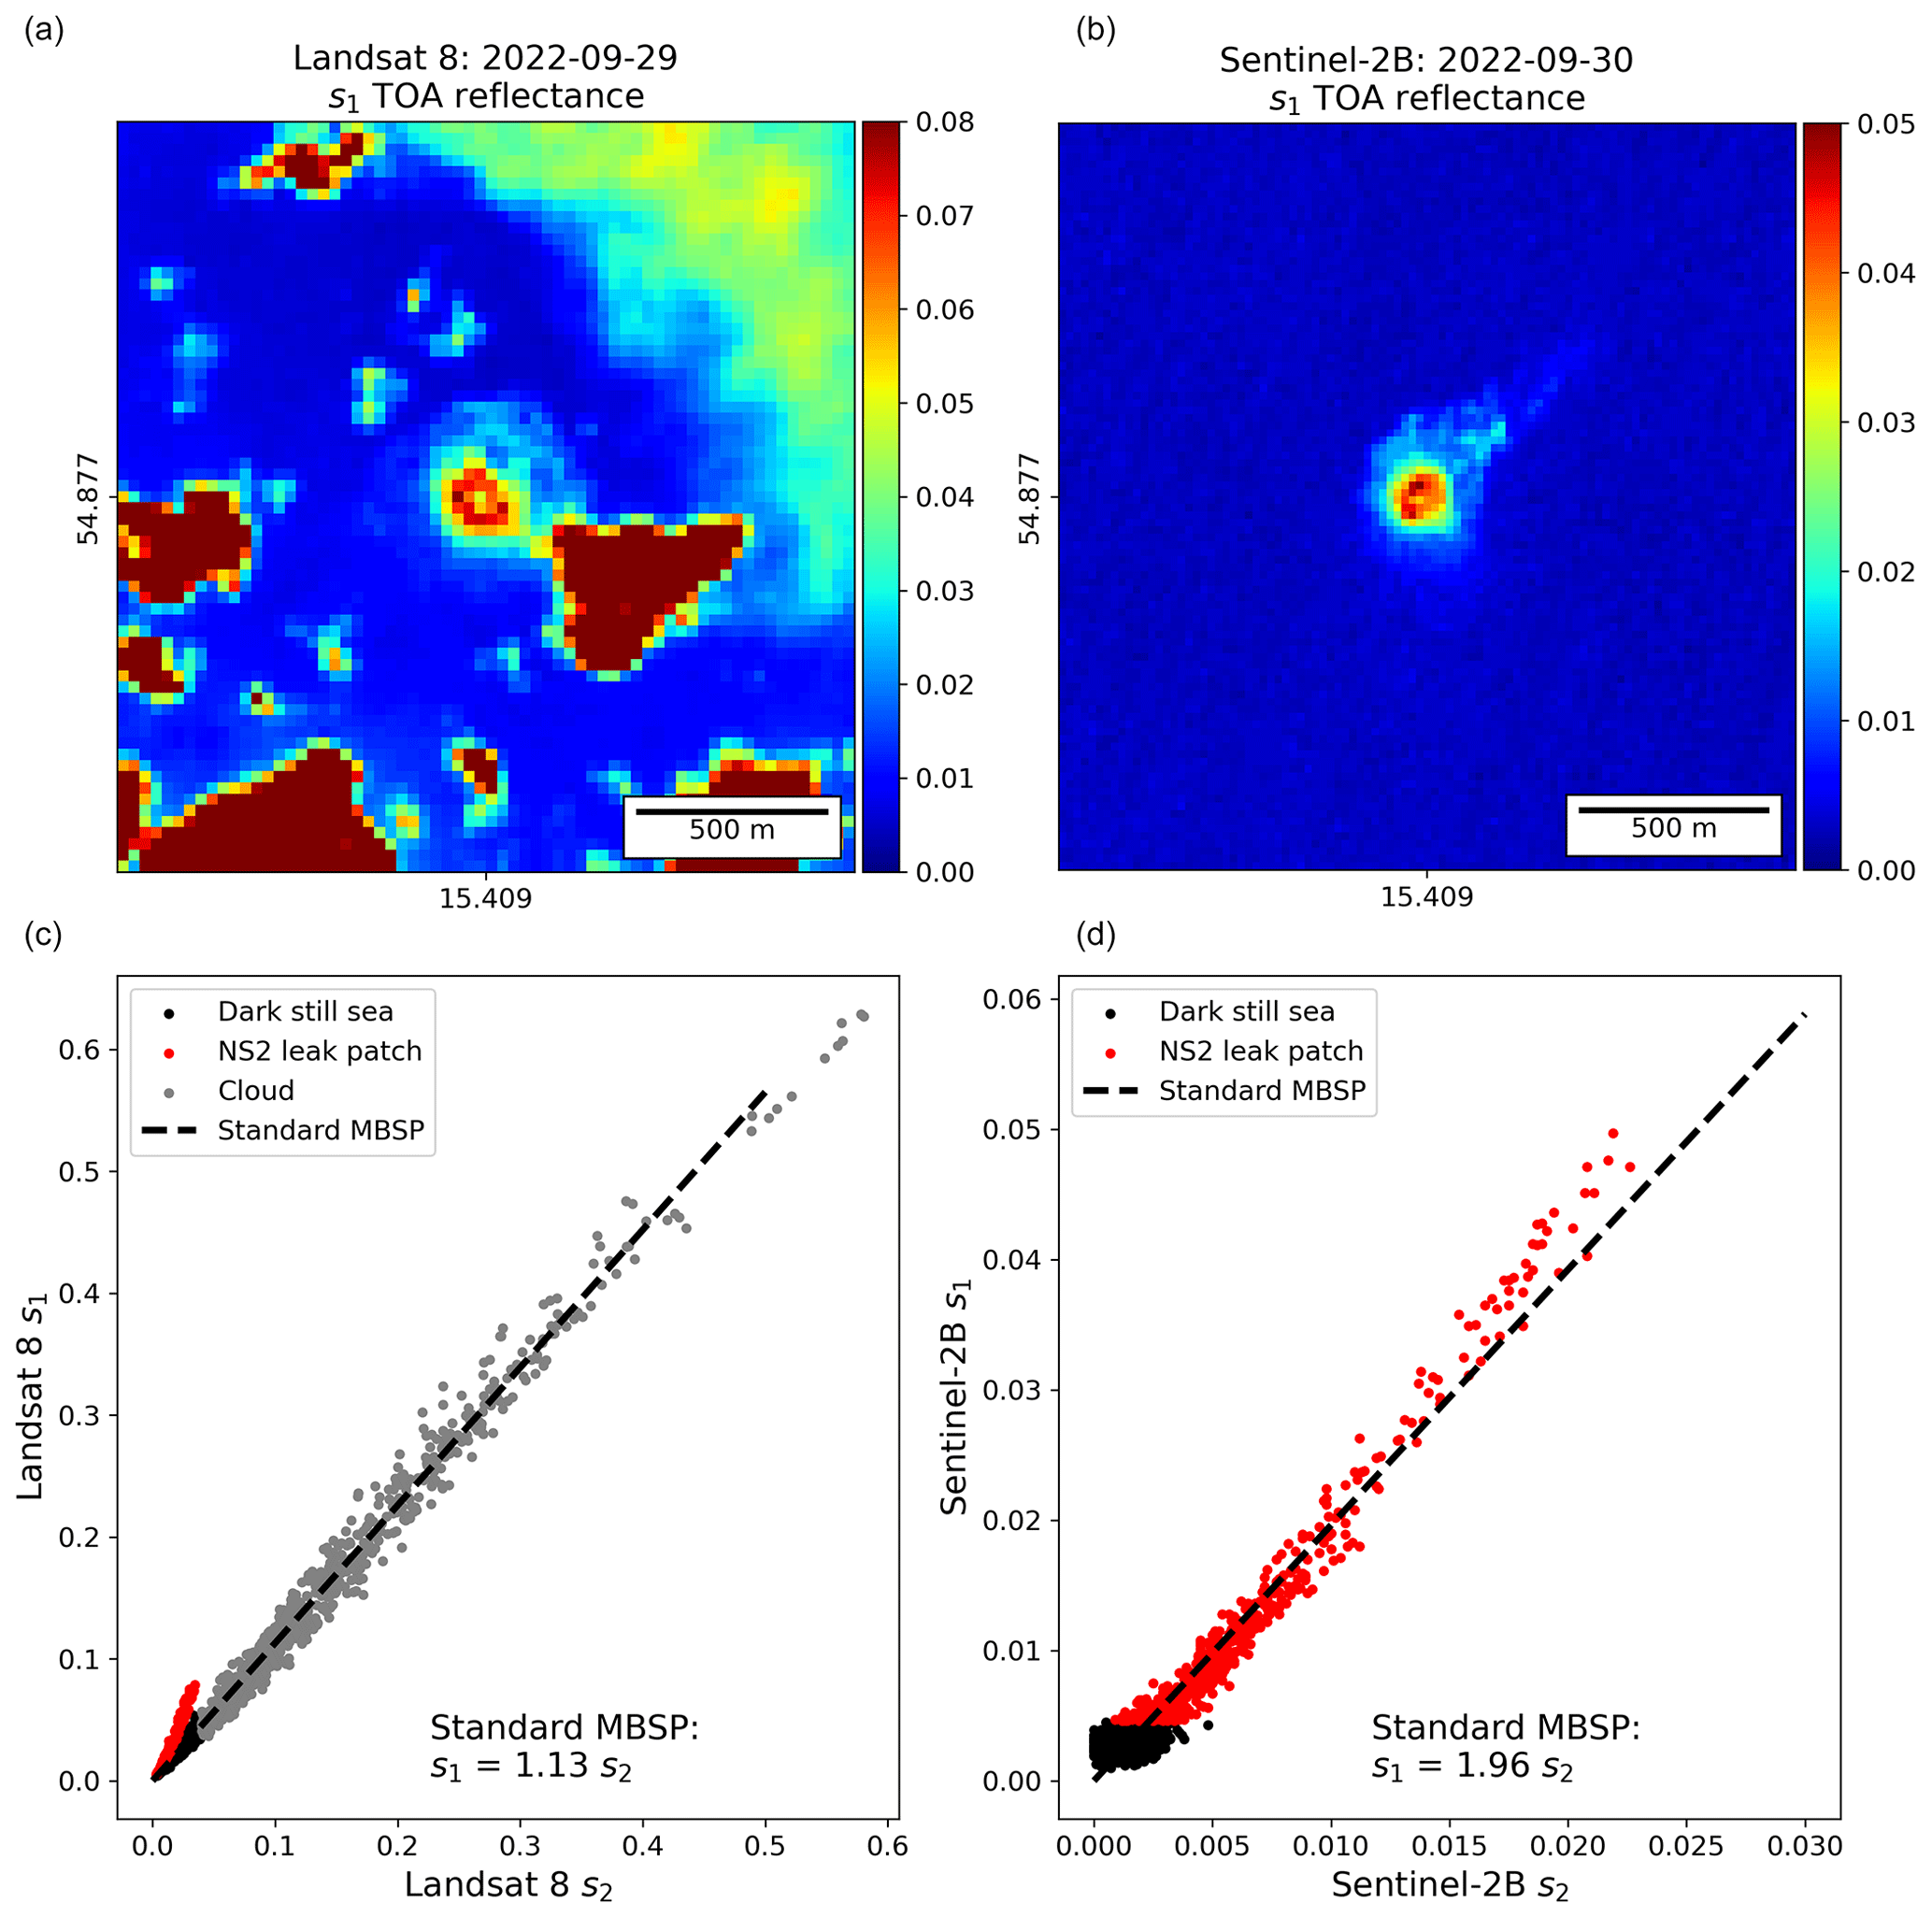
Figure 1Landsat 8 (a, c; 29 September 2022) and Sentinel-2B (b, d; 30 September 2022) images of the Nord Stream 2 leak for s1 (a, b), and s1 and s2 TOA reflectance comparisons depicting different pixel natures and showing the standard MBSP c calibration line (c, d). The pixel natures of dark still sea (black), clouds (gray), and NS foam patch (red; all influenced by the methane leak) are separated using empirically determined thresholds given in the Supplement. The standard MBSP calibration (dashed line) is provided here to illustrate why it proves to be unsuitable for this specific NS2 case, as detailed in Sect. 2.2.2.
2.2 Methane enhancement retrieval: the multi-band single-pass (MBSP) method
We use the multi-band single-pass (MBSP) method to retrieve local methane column enhancements from Earth-imager observations. We first describe MBSP and its standard calibration approach and then show how this specific NS2 case study calls for a custom calibration.
2.2.1 General description
The TOA reflectance data can be used to retrieve atmospheric methane concentration enhancements with the multi-band single-pass (MBSP) method, first proposed by Varon et al. (2021). It relies on the relative change in TOA reflectance ΔR between two spectral bands s1 (around 1.6 µm, low sensitivity to methane) and s2 (around 2.2 µm, strong sensitivity to methane) computed as
where c is a linear calibration coefficient fitted on all the pixels included in the target image to account for any non-methane-related spectral effects between bands s1 and s2, most importantly the spectral dependence of the albedo. This calibration strategy was proposed with the MBSP method by Varon et al. (2021) and implicitly assumes that image-wide pixels are representative of the surface characteristics expected below the (potential) methane plume. Hereafter, we will refer to this “naïve” calibration strategy as the “standard MBSP calibration”. The rationale of MBSP is that deviations in the methane-sensitive s2 band from the expected ratio (captured in the fitted c coefficient) are interpreted as methane enhancements. Pixels with ΔR<0 relate to higher-than-expected atmospheric absorption and yield positive methane enhancements. The translation of ΔR to methane enhancements is performed using pre-computed lookup tables, generated through radiative transfer simulations. Here, they are based on the 2020 version of the HITRAN spectroscopic database (Gordon et al., 2022), rely on a 21-layer atmospheric model representative of mid-latitudes, and include the impact of the solar zenith angle.
2.2.2 Empirical calibration of the spectral dependence of sea-foam reflectance in MBSP
Here, we seek to determine whether a methane enhancement signal can be retrieved from L8 and S-2B images of the NS2 sea-foam patch. No methane signal can be expected to be visible over the dark still sea or the clouds. Consequently, considering the general description of MBSP given in Sect. 2.2.1, properly constraining the spectral dependence of sea-foam albedo between s1 and s2 is critical to obtain non-biased methane enhancements through MBSP.
Whitlock et al. (1982) and Koepke (1984) show that we expect a reflectance ratio over sea foam of about 2 or slightly lower (graphical reading). However, the only pixels representative of sea foam that can be observed in L8 and S-2B images of the NS2 leak are the ones caused by the leak itself, above which we also expect a possible methane enhancement signal. Unlike a land image, it is thus not possible to assess whether the standard MBSP calibration can separate the spectral impact of methane from the spectral dependence of the albedo for this specific NS2 case. This is particularly noticeable in Fig. 1 for the S-2B image, where the standard MBSP calibration is driven by the NS2 sea-foam patch (c=1.96). This issue similarly applies to the L8 NS2 observation, which also features an additional complication: very bright clouds are present in the image, which in this case drive the standard MBSP calibration (c=1.13). Thus, the standard MBSP calibration lines included in Fig. 1 illustrate why the NS2 observation case, which relies on a small sea-foam patch, calls for an external calibration of the spectral dependence of sea-foam albedo.
We therefore empirically constrain the spectral dependence of sea-foam albedo by using sea-foam observations in ship trails unaffected by methane plumes. We treat each satellite separately in order to account for their different instrumental characteristics. By visual inspection of RGB Sentinel-2 and Landsat data on the EO Browser of Sentinel-Hub (2023), we gather 27 and 38 images of ship trails for L8 and S-2B, respectively, located in the North Sea and Baltic Sea from September and October 2022. For each of these images, we separate ship and sea-foam pixels from the dark-still-sea pixels by using an empirically determined threshold τ1, such that s1>τ1, and then we separate sea-foam from ship pixels by applying a second empirically determined threshold τ2, such that s2<τ2 (Tables S2 and S3 in the Supplement). Figure 2 shows an example of sea-foam pixels extracted from an S-2B ship trail image. For each image, using sea-foam pixels only, we perform a least-squares linear fit (with an intercept set to zero) of s1 as a function of s2 to determine ci, the coefficient describing the spectral dependence of sea-foam albedo for the ith image (see individual ci values and fits obtained for each ship trail observation in the Supplement). For L8 and S-2B separately, we then compute as the mean of the individual calibrations. Figure 3 presents the results of this satellite-specific empirical calibration of the spectral dependence of sea-foam albedo. We obtain and for L8 and S-2B, respectively. These top-of-the-atmosphere reflectance ratios are overall consistent with results presented by Whitlock et al. (1982) and Koepke (1984) that were measured on the ground. Comparing the S-2B result to the slightly higher standard MBSP calibration (c=1.96) also confirms the above-mentioned hypothesis that the standard calibration may have captured some methane signal. Indeed, for given fixed {s1,s2} values, a decrease in the spectral dependence calibration coefficient c (compared to the standard calibration) reduces , which translates to an increase in methane enhancement via the use of MBSP.
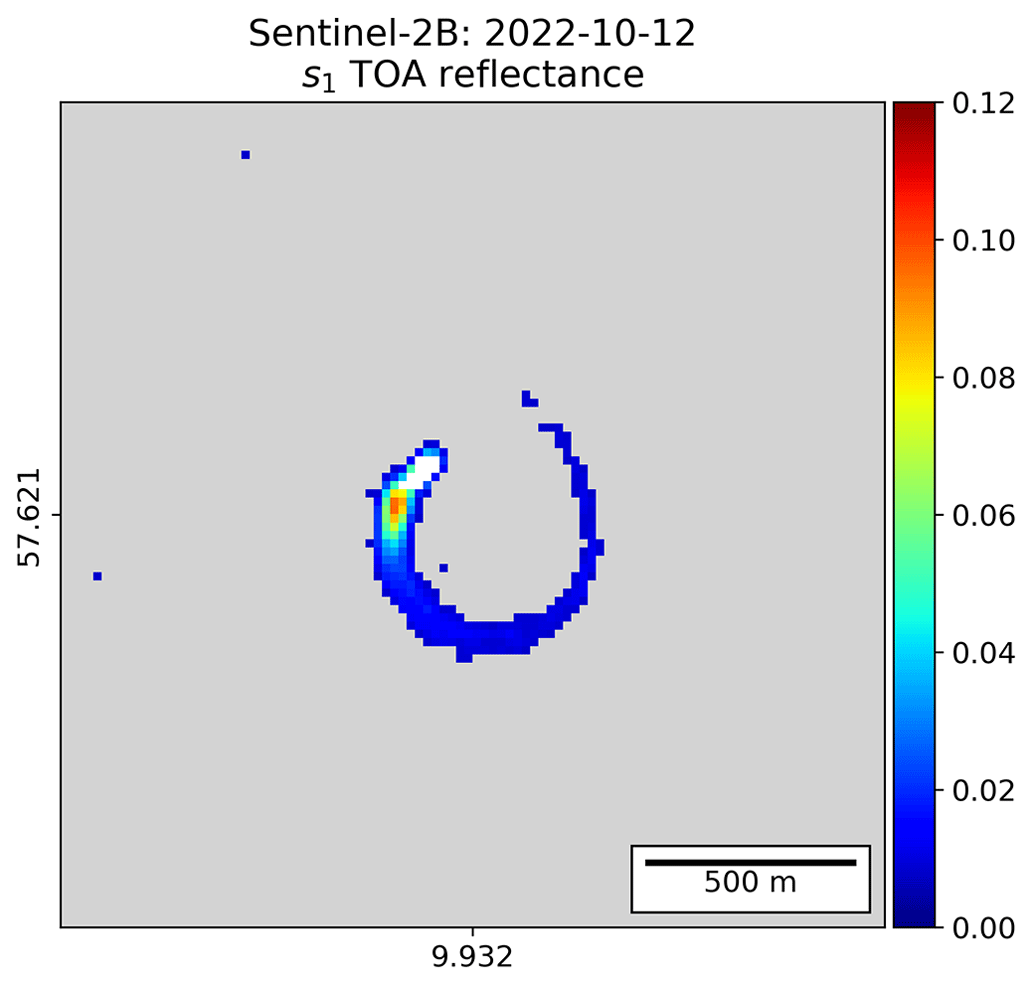
Figure 2Example of sea-foam observation in the Sentinel-2B image of a ship trail acquired on 12 October 2022. Dark-still-sea and ship pixels have been removed and are shown in gray and white, respectively. They are also excluded from the sea-foam albedo spectral dependence results presented later in Sect. 2.2.2 and in the Supplement.

Figure 3Empirically determined sea-foam albedo spectral dependence between s1 and s2 for Landsat 8 (a) and Sentinel-2B (b). Sea-foam pixels for all ship images are depicted (dots with different colors indicate different ships; the legend only includes elements for the first and last images) along with their respective calibration slopes (thin lines; each is detailed in the Supplement; the legend only includes elements for the first and last images). These enable the computation of the mean and 1σ standard deviation of the empirically determined sea-foam albedo spectral dependence (thick full and dashed blue lines). The standard MBSP calibration (thick dashed black line) is also shown.
MBSP can then be applied using these newly determined empirical calibrations (computing ΔR using ). Figure 4 shows the methane enhancements obtained with the satellite-specific calibration values and how s1 and s2 TOA reflectance values compare to them. For the L8 observation of the NS2 leak, the sea-foam patch pixels show an ratio of 2.09 (red line), which is slightly higher than the average empirical calibration of the L8 sea-foam albedo spectral dependence (), but comprised within its ±1σ uncertainty interval. This ship-based negative difference overall translates to positive methane enhancement through MBSP. On average, we obtain L8 methane enhancement values ranging from −2.5 to 15 mol m−2. Negative enhancements are associated with pixels falling to the right of the empirical calibration line (low TOA reflectance values, at the sea-foam patch edges), and positive enhancements are associated with pixels falling to the left of the empirical calibration line (high TOA reflectance values, at the sea-foam patch center). The S-2B observation is similar but exhibits more noise, overall showing enhancements from −2.5 mol m−2 on the sea-foam patch edges to about 8 mol m−2 at its brighter center.
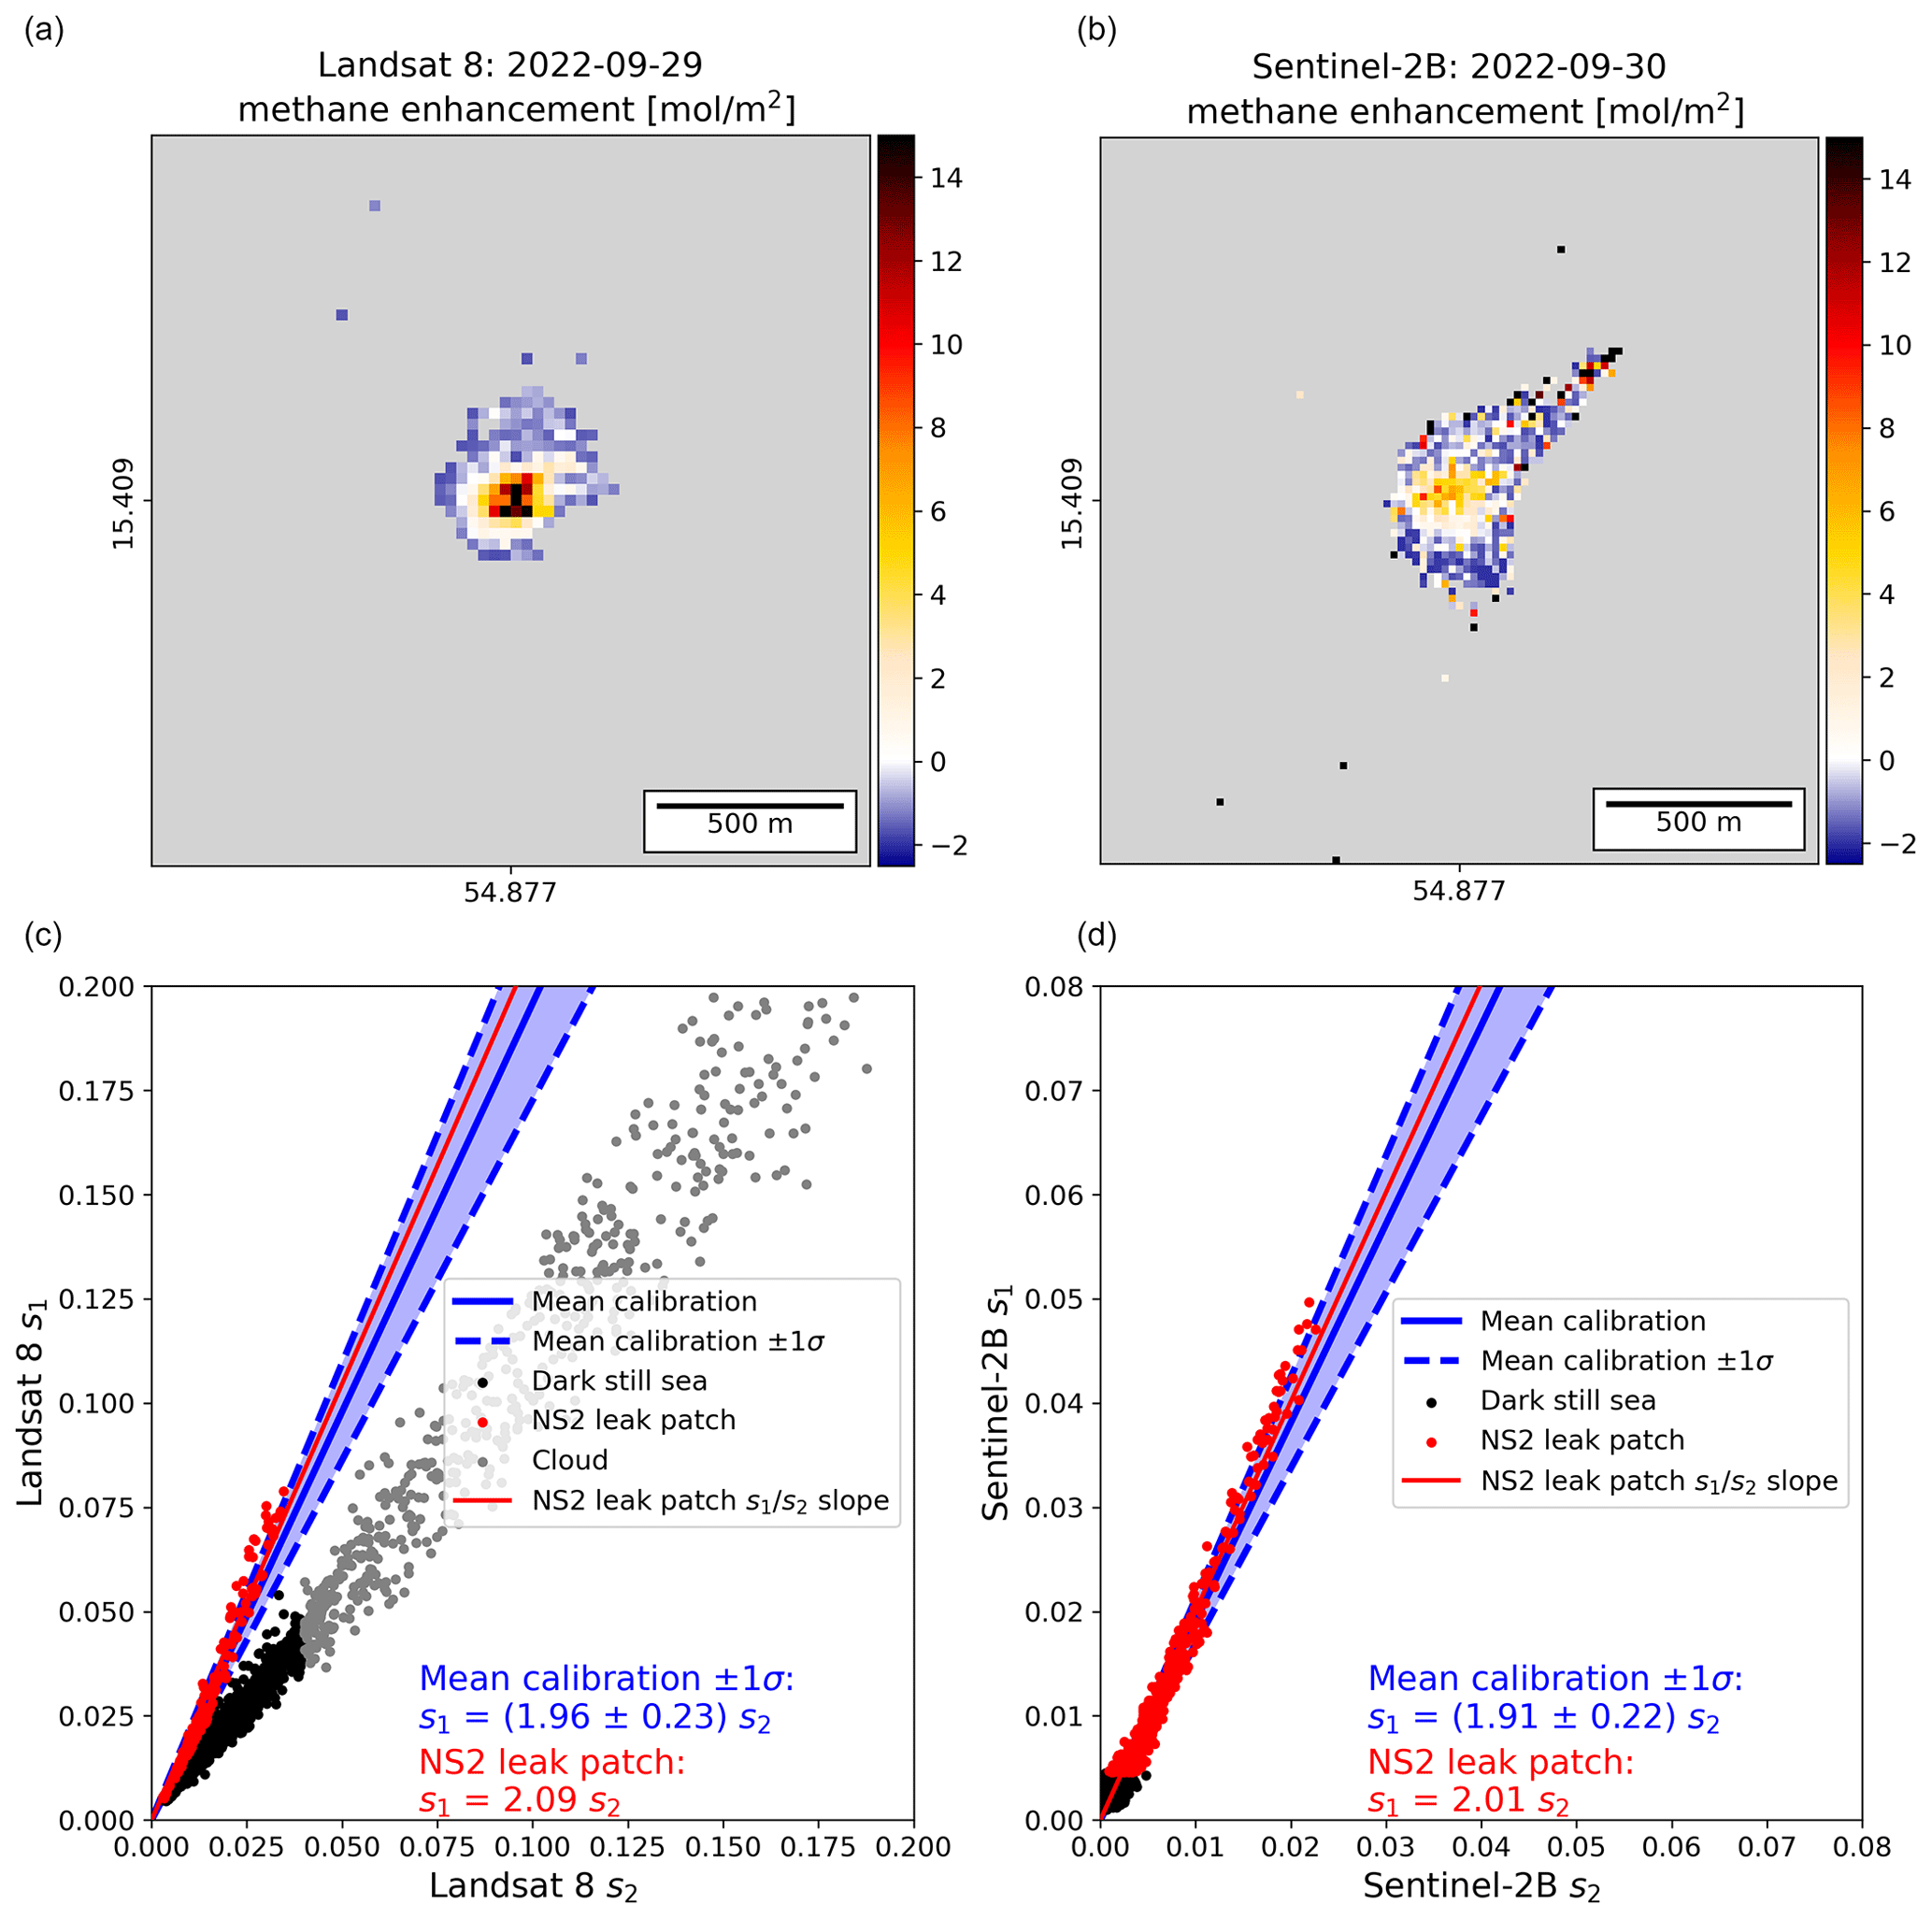
Figure 4Methane enhancement results obtained through MBSP for Landsat 8 (a; 29 September 2022) and Sentinel-2B (b; 30 September 2022); pixels not belonging to the foam patch have been filtered out and are shown in gray. Comparisons of s1 and s2 TOA reflectance (c, d) depicting different pixel types and showing the empirically determined spectral dependence of sea-foam albedo (thick blue line; the individual ship trail observations underlying this result are shown in Fig. 3 and in Tables S2 and S3 for L8 and S-2B, respectively) and the ratio observed over the NS2 sea-foam patch (red line). The higher slopes shown by the ratios (red) compared to the empirical calibrations (blue) are driven by the brightest pixels at the center of the sea-foam patch that offer a better signal-to-noise ratio to observe methane absorption than darker pixels.
2.3 Emission rate quantification: the integrated mass enhancement (IME) method
We use the integrated mass enhancement (IME) method to quantify the methane emission rate from local methane column enhancement retrievals that show an emission plume. Here, we first explain why we choose the IME method and how it works, and then we explain why this specific NS2 case study also calls for a custom calibration for the IME method.
2.3.1 General description
If a plume is observed in an image resulting from MBSP, the associated emission rate can be quantified using different approaches such as the Gaussian plume inversion (GP), source pixel (SP), cross-section flux (CSF), and integrated mass enhancement (IME) methods (Varon et al., 2018). Because GP and SP are not suited for the quantification of plumes detected using high-resolution satellite observations and the CSF relies on several transects drawn on an extended downwind plume, we use the IME method. This method was first proposed by Frankenberg et al. (2016), and its calibration and operational use were improved by Varon et al. (2018). Given a plume, the IME method relates the emission rate Q to the plume's total methane mass and its residence time in the atmosphere. We have
where Ueff is the effective wind speed transporting the plume, is the plume extent, is the total column methane enhancement of the ith plume pixel, and ai is the area of this pixel.
Plume transport includes complicated three-dimensional and turbulent effects that require computer-intensive simulations to be accounted for, if even possible given the randomness of turbulence. Through IME, the overall impacts of those effects are presumably captured into a single effective wind speed, denoted Ueff. Ueff is calibrated against the 10 m wind speed provided by meteorological models (U10 m) over a set of large eddy simulations (LESs) made for known synthetic emission rates and resampled according to a given instrument characteristics (spatial resolution, noise model, etc.). Thus, Ueff can be calibrated for specific instruments and observing conditions. Varon et al. (2021) provide an effective wind speed calibration model for Sentinel-2-like Earth imagers: . This IME effective wind speed calibration slope, which is lower than 1, reflects the fact that the plume extent L, defined as the square root of the plume area, is smaller than the actual plume length for long narrow plumes observed over land. This definition of L is chosen for its simplicity and because the plume mask is ventilated by turbulent diffusion rather than uniform transport (Varon et al., 2018). Besides, using this effective wind speed calibration implicitly assumes that the plume is observed in the same conditions as those used for the LES calibration, including for instance that the full extent of the plume is visible as per the given instrument sensitivity.
2.3.2 Effective wind calibration of partial plume observation in IME
The IME method is critically sensitive to the plume mask extent. For a homogeneous plume of N pixels, the source rate Q increases linearly with . In practice, the plume is not homogeneous, the number of pixels above the instrument detection threshold relates to the emission rate, and truncating the plume mask because of external factors (low albedo, clouds, etc.) biases Q. This IME sensitivity stems from the effective wind speed calibration that relies on an LES sampling of the whole plume per the given instrument characteristics. Any systematic plume mask truncation therefore needs to be calibrated for. For the NS2 observation, only the small sea-foam patch provides a high enough signal that could allow observation of part of the methane plume above its source. This specific case therefore requires a custom effective wind calibration.
We consequently repurpose an ensemble of LESs computed for a 275 × 275 m2 source area (grossly the NS2 foam patch size) by Maasakkers et al. (2022), scale them to emission rates ranging from 100 to 1000 t h−1, resample them according to L8/S-2B instrumental characteristics, and perform an effective wind speed calibration that only includes the pixels located above the source area in the plume mask. Following Varon et al. (2021), we perform a linear regression of Ueff against U10 m that is more appropriate for Sentinel-2-like instruments than the logarithm-based regression first proposed in Varon et al. (2018). We obtain the following NS2 custom effective wind speed calibration with an outlier-resilient Huber regression: , with a standard deviation of data to fit mismatch values of 1.1 m s−1 (Fig. S8 supporting this result is provided in the Supplement). This 1.88 calibration factor is significantly different from the slope value given in Sect. 2.3.1, which is applicable for ideal conditions over land. Its value higher than 1 reflects a different plume definition compared to ideal conditions over land and must be interpreted as methane excess observed above the area source under-representing the actual emission rate of the full area source. Indeed, only the downwind plume integrates emissions from the all the area source, not the concentration field right above it. Actually, this IME effective wind speed calibration slope close to 2 is consistent with expectations from mass balance of a uniformly ventilated area source (wind direction above it is unique and not changing, a fair assumption at the scale of the NS2 leak) as shown by Buchwitz et al. (2017).
2.4 Monte Carlo ensemble approach for evaluating Nord Stream 2 leak rates as seen by Landsat 8 and Sentinel-2B
We use a Monte Carlo ensemble approach to calculate the average methane leak rate from NS2, as seen by L8 and S-2B, using MBSP and IME with our custom calibrations. We consider six different parameters that impact MBSP and/or IME results to generate a Monte Carlo ensemble of leak rate quantifications.
- 1.
In MBSP, we use the distribution of sea-foam albedo spectral dependence calibrations and randomly pick a calibration value from the satellite-wise sets of sea-foam observations in ship trails described in Sect. 2.2.2. By doing so, we implicitly follow the underlying distributions of each satellite-wise sea-foam spectral dependence calibration value.
- 2.
To capture the uncertainty in the background, we estimate a non-enhanced methane background over the NS2 sea-foam patch. It is computed by applying MBSP using a calibration coefficient exactly equal to the fitted ratio obtained from the NS2 sea-foam pixels, thus compensating for possible methane enhancements. We then compute the standard deviation of this background signal and use it to randomly shift the MBSP background enhancement by sampling a Gaussian distribution with a standard deviation of and centered on zero.
- 3.
We vary the plume mask extent by varying the minimum s1 TOA reflectance value for a pixel to be included in the plume mask. These minimum s1 TOA reflectance thresholds sample uniform distributions covering [0,0.07] for L8 and [0,0.045] for S-2B. We use different maximum thresholds for each satellite because the maximum TOA reflectance observed by L8 in the NS2 patch is higher than for S-2B (see Fig. 1).
- 4.
Following Schuit et al. (2023), we include four different 10 m wind speeds to better account for wind speed uncertainty. Three come from meteorological reanalysis products: the European Centre for Medium-Range Weather Forecasts (ECMWF) ERA5 (Hersbach et al., 2020), the Global Forecasting System (GFS) from NOAA National Centers for Environmental Prediction (NCEP, 2000), and the Goddard Earth Observing System Forward Processing (GEOS-FP, Molod et al., 2012). Furthermore, we include the in situ wind speed measured at Bornholm Airport, which is located about 50 km away from the NS2 leak (IEM, 2023). For 29 September, we obtain wind speeds of 4.1, 6.6, 4.8, and 3.6 m s−1 from ERA5, GFS, GEOS-FP, and airport measurements, respectively; and for 30 September, we obtain wind speeds of 5.0, 6.3, 6.3, and 5.7 m s−1, respectively. We randomly pick one of these four wind speeds.
- 5.
To account for wind speed error, we evaluate the differences between the three reanalysis models (ERA5, GEOS-FP, GFS) and in situ measurements made at Bornholm Airport for 2022. On average, we find a standard deviation of 1.6 m s−1. We therefore sample the wind speed error from a Gaussian distribution with a 1.6 m s−1 standard deviation and centered on zero.
- 6.
We account for effective wind speed calibration errors by randomly sampling data–fit mismatch values from the distribution shown in the Supplement (Fig. S8). By doing so, we implicitly follow the slightly non-Gaussian skewed distribution that these mismatches show.
We generate a Monte Carlo ensemble of 1 000 000 members for each satellite overpass and report their averages and standard deviations as uncertainty.
Besides these ensemble metrics, we also seek to determine which input parameters contribute most to the obtained ensemble variance. Thus, we also compute the first-order sensitivity indices Si for our six parameters:
where Xi, with , represents the six parameters that we explore; Q represents the leak rates that we compute; is the expectation across all parameters values but with Xi that is fixed; is the variance across all Xi values; and V is the usual variance. Citing Lo Piano et al. (2021), the plain language meaning of Si is “the fractional reduction in the variance of Q which would be obtained on average if Xi could be fixed”.
Here, we only rely on our single satellite-wise Monte Carlo ensembles and follow Lo Piano et al. (2021) to estimate Si by directly calculating as the variance of the smoothed Q against Xi scatter plot. As we randomly pick values from small sets for the sea-foam albedo spectral dependence calibrations and wind speed products, we compute for each discrete value that Xi can take. For wind speed and effective wind speed errors, as well as minimum albedo and methane enhancement shifts, where we sample continuous distributions, we use 1000 bins of 1000 ensemble members to smooth the Monte Carlo ensemble results.
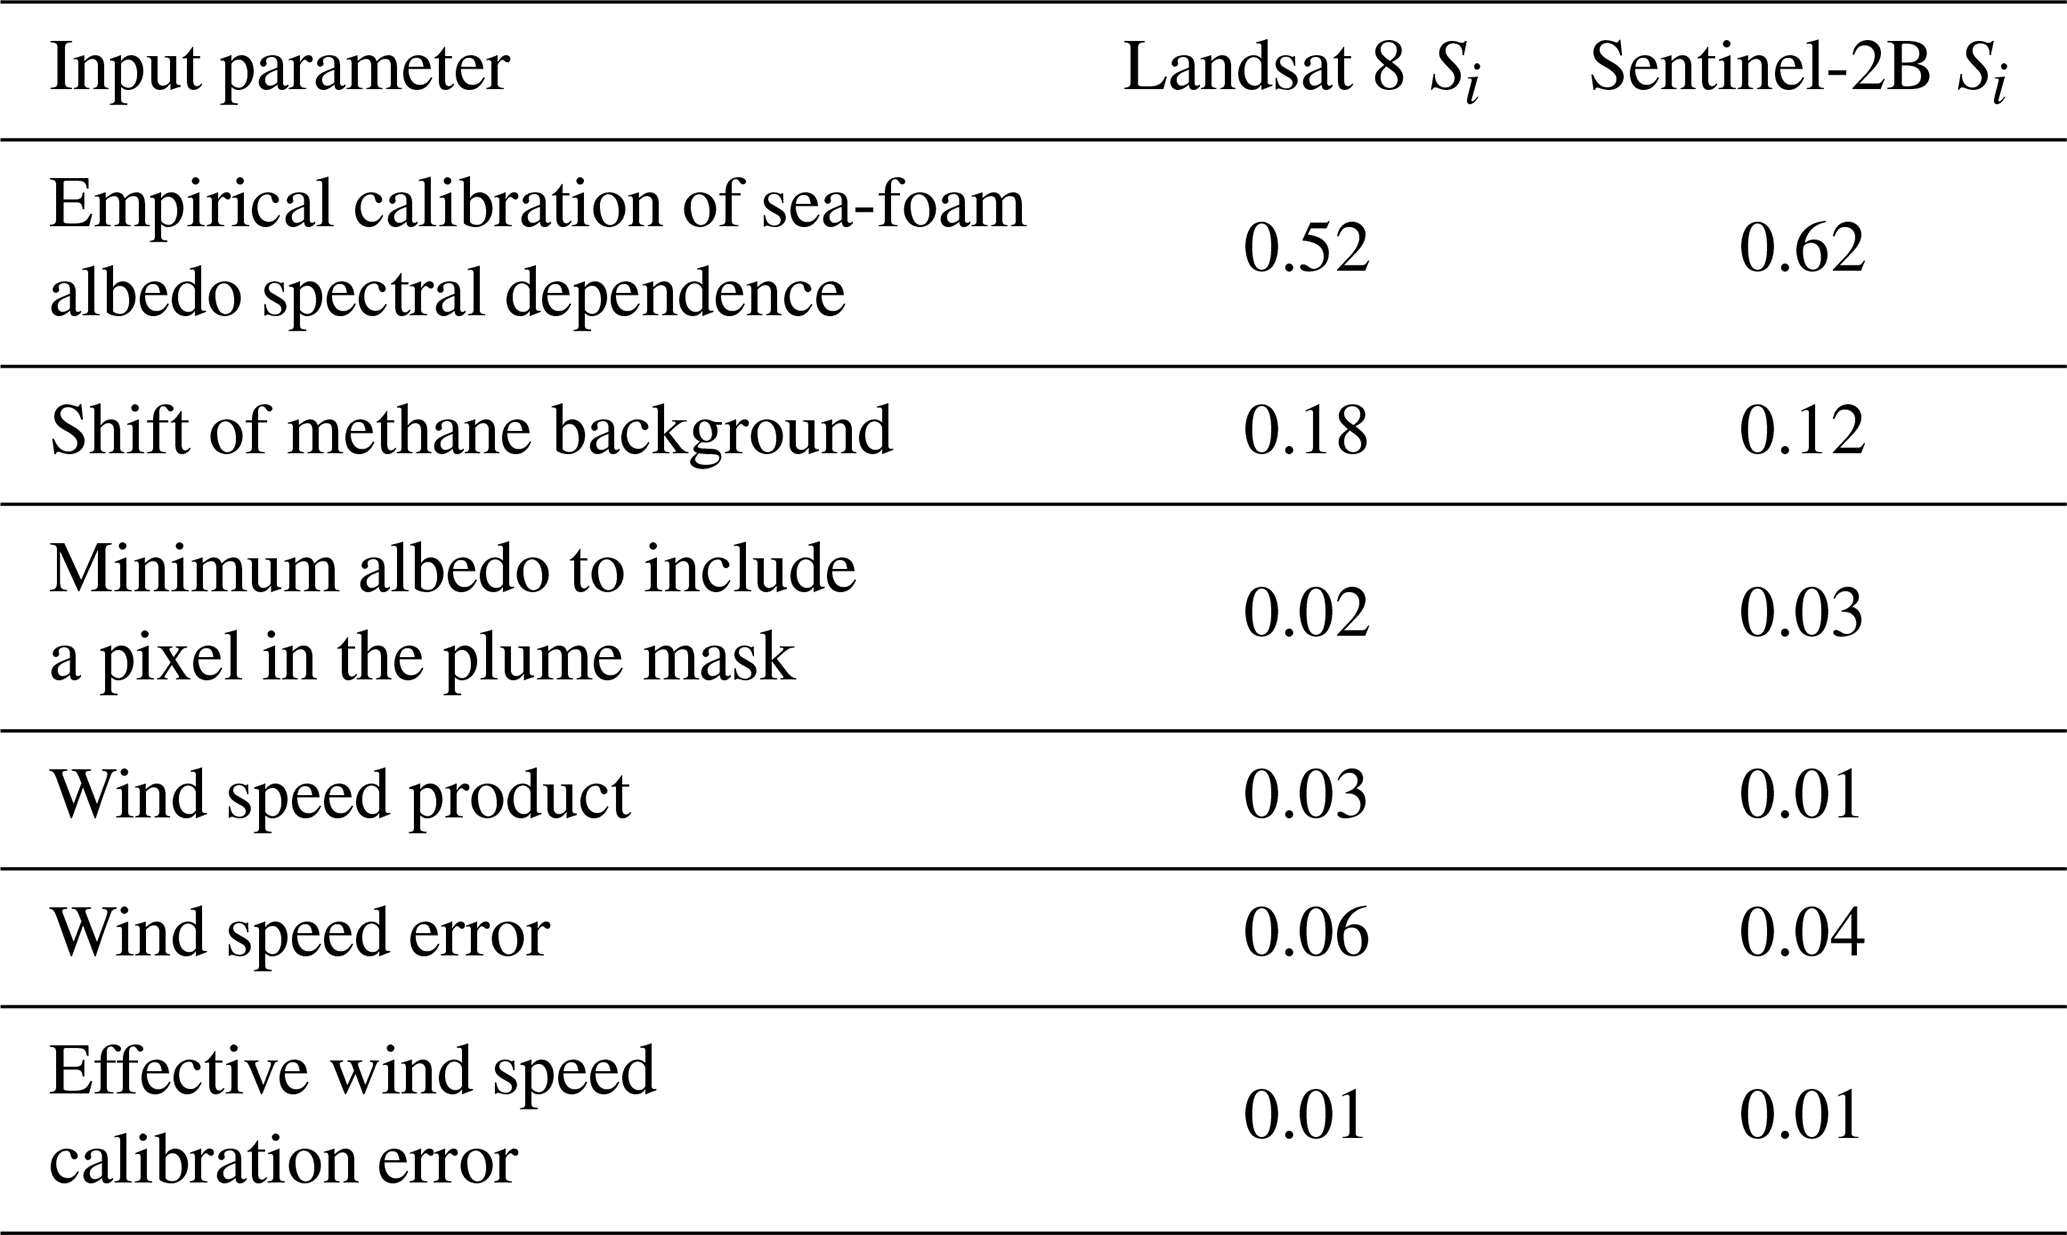
Figure 5 shows the distribution of leak rate values within the Monte Carlo ensembles for L8 and S-2B. We obtain ensemble-averaged methane leak rates of 507 ± 673 t h−1 and 496 ± 640 t h−1 for L8 and S-2B, respectively. In addition, Table 1 provides the first-order sensitivity indices Si corresponding to these uncertainties (the smoothed scatter plots supporting these indices are provided in the Supplement). From these indices, we conclude that the uncertainty of the sea-foam albedo spectral dependence calibration mainly drives these Monte Carlo ensemble uncertainties. This is illustrated by the color scale applied to the distributions included in Fig. 5: leak rates decrease and eventually become negative with increasing empirical sea-foam albedo spectral dependence calibration values.
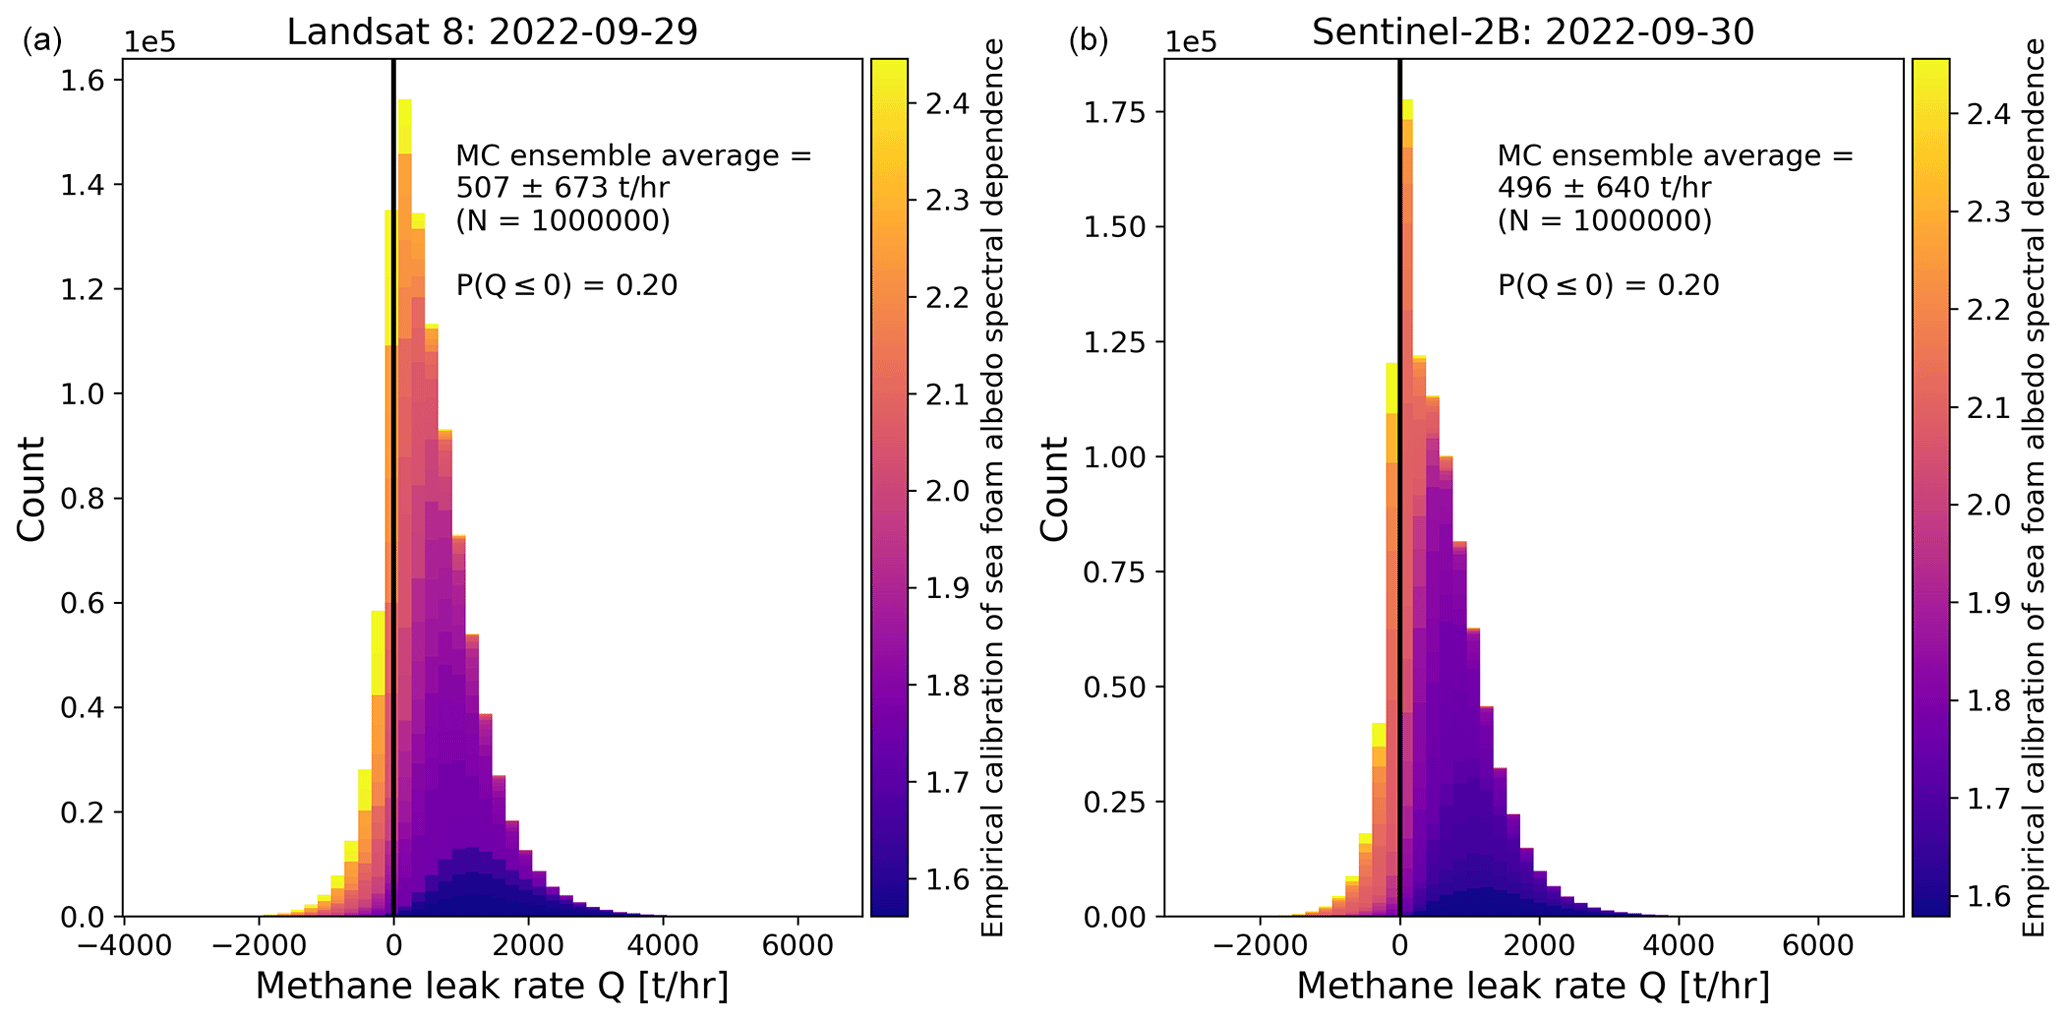
Figure 5Distributions of methane emission rate values for the Landsat 8 (a) and Sentinel-2B (b) ensembles. Monte Carlo ensemble means and standard deviations are shown in the panel legends, along with the fraction of null or negative emission rates, denoted as P(Q≤0). The color scale shows the contributions of different sea-foam albedo spectral dependence calibration values to the overall distribution of leak rates within the ensemble.
Table 1First-order sensitivity indices Si, computed for each satellite observation and all six parameters included in our Monte Carlo ensembles.
The individual L8 and S-2B ensemble distributions have ±1σ uncertainty intervals that include zero emissions, and both show . These separate L8 and S-2B estimates may not be independent. For example, similar lookup tables or IME effective wind calibration errors or biases may hamper them. However, if we opportunistically assume that they are independent, we can generate an ensemble representing the averaged combined L8 and S-2B NS2 leak rate. We obtain an averaged L8 and S-2B NS2 methane leak rate of 502 ± 464 t h−1, with . Both single- and dual-overpass estimates show positive means and higher probabilities for positive Q values (80 %–88 %) than negative ones (12 %–20 %). This result hints that L8 and S-2B likely sensed a methane-related signal, which could be related to an emission magnitude of hundreds of metric tons per hour.
Because this NS2 observation case is singular and recent, very few results to compare to have been published. GHGSat reports leak rates of 79 and 29 t h−1 for their NS2 glint observations made on 30 September (GHGSat, 2022). Jia et al. (2022) report no result for L8 and a methane leak rate of 72 ± 38 t h−1 for S-2B, while also acknowledging significant uncertainties in their methodology regarding the spectral reflectance of bubbles and the partial imaging of the methane plume. The work performed here precisely describes the origin of the challenges posed by these specific NS2 observations, addresses them through custom calibrations, and provides a comprehensive uncertainty analysis. All previously reported NS2 methane leak rates for 30 September are comprised within our large zero-including uncertainty range obtained for S-2B on that day.
We have evaluated the possibility of extracting methane emission information from Landsat 8 (L8) and Sentinel-2B (S-2B) observations of the Nord Stream 2 (NS2) pipeline leak.
We have shown how the unusual observations of a sea-foam patch surrounded by dark still sea (and clouds for L8) challenge implicit underlying assumptions in both the multi-band single-pass (MBSP) and integrated mass enhancement (IME) methods. For MBSP, we showed that an external empirical calibration of the sea-foam albedo spectral dependence is needed and provided one by using sea-foam observations in ship trails. This underlines how extreme surface heterogeneity can hamper the standard albedo spectral dependence calibration in MBSP. For IME, we showed that emission rate quantifications are critically sensitive to plume mask truncation, and we provided an effective wind speed calibration customized to the NS2 leak for a plume only observed over a small sea-foam patch. Plume masks over land can be truncated due to cloud coverage or dark albedo artifacts (waterbodies like rivers and lakes), which then cause a similar emission rate underestimation.
Using these two-fold customized calibrations for MBSP and IME in a Monte Carlo ensemble approach, we have assessed that no firm conclusion can be made about individual L8 or S-2B detection of the NS2 methane leak. Positive methane leak rates appear to be more likely than negative ones in both single- and dual-overpass Monte Carlo ensemble estimates, and they point towards a best estimate of 502 ± 464 t h−1, assuming L8 and S-2B quantifications are independent.
Overall, we see our work as a methodological cautionary tale illustrating how implicit method assumptions need to be considered and compensated for in unusual observation cases such as this one. Our nuanced results with large uncertainties are not surprising: this exceptional Nord Stream leak event pushed Earth imagers that were not initially designed to observe greenhouse gases – much less over water – to their very limits.
Landsat 8 and Sentinel-2B data used in this work are publicly available and were retrieved from the Google Earth Engine as 2 km side square images of given targets, from collections LANDSAT/LC08/C02/T1_TOA (https://developers.google.com/earth-engine/datasets/catalog/
LANDSAT_LC08_C02_T1_TOA#bands, USGS/Google, 2024) and COPERNICUS/S2_HARMONIZED (https://developers.google.
com/earth-engine/datasets/catalog/COPERNICUS_S2_HARMON
IZED#bands, European Union/ESA/Copernicus, 2024), respectively. All images are listed in the Supplement.
The supplement related to this article is available online at: https://doi.org/10.5194/amt-17-2777-2024-supplement.
MD and JDM conceived the study. MD performed the satellite data analysis and emission rate quantifications, with supervision from JDM and IA. DJV performed the tailored Nord Stream 2 effective wind speed calibration. MD wrote this article with feedback from all co-authors.
At least one of the (co-)authors is a member of the editorial board of Atmospheric Measurement Techniques. The peer-review process was guided by an independent editor, and the authors also have no other competing interests to declare.
Publisher’s note: Copernicus Publications remains neutral with regard to jurisdictional claims made in the text, published maps, institutional affiliations, or any other geographical representation in this paper. While Copernicus Publications makes every effort to include appropriate place names, the final responsibility lies with the authors.
This work is in part supported through the ESA-funded MethaneCAMP project. Copernicus (modified) Sentinel-2 data (2022) have been used. Authors are grateful to Itziar Irakulis-Loitxate and Otto Hasekamp for the helpful discussions and comments while designing this work. The authors are also grateful to the two referees whose comments helped improve this work.
This research has been supported by the European Space Agency (MethaneCAMP project).
This paper was edited by Frank Hase and reviewed by Philipp Hochstaffl and Chris Sioris.
Buchwitz, M., Schneising, O., Reuter, M., Heymann, J., Krautwurst, S., Bovensmann, H., Burrows, J. P., Boesch, H., Parker, R. J., Somkuti, P., Detmers, R. G., Hasekamp, O. P., Aben, I., Butz, A., Frankenberg, C., and Turner, A. J.: Satellite-derived methane hotspot emission estimates using a fast data-driven method, Atmos. Chem. Phys., 17, 5751–5774, https://doi.org/10.5194/acp-17-5751-2017, 2017. a
Drusch, M., Del Bello, U., Carlier, S., Colin, O., Fernandez, V., Gascon, F., Hoersch, B., Isola, C., Laberinti, P., Martimort, P., Meygret, A., Spoto, F., Sy, O., Marchese, F., and Bargellini, P.: Sentinel-2: ESA's Optical High-Resolution Mission for GMES Operational Services, Remote Sens. Environ., 120, 25–36, https://doi.org/10.1016/j.rse.2011.11.026, 2012. a
European Union/ESA/Copernicus: Harmonized Sentinel-2 MSI: MultiSpectral Instrument, Level-1C (COPERNICUS/S2_HARMONIZED), Google Earth Engine [data set], https://developers.google.com/earth-engine/datasets/catalog/COPERNICUS_S2_HARMONIZED#bands, last access: 30 April 2024. a
Frankenberg, C., Thorpe, A. K., Thompson, D. R., Hulley, G., Kort, E. A., Vance, N., Borchardt, J., Krings, T., Gerilowski, K., Sweeney, C., Conley, S., Bue, B. D., Aubrey, A. D., Hook, S., and Green, R. O.: Airborne methane remote measurements reveal heavy-tail flux distribution in Four Corners region, P. Natl. Acad. Sci. USA, 113, 9734–9739, https://doi.org/10.1073/pnas.1605617113, 2016. a
GHGSat: GHGSat measures its largest emission from a single source ever from Nord Stream 2 leak, GHGSat, https://www.ghgsat.com/en/newsroom/ghgsat-nordstream/ (last access: 10 May 2023), 2022. a, b
Gordon, I., Rothman, L., Hargreaves, R., Hashemi, R., Karlovets, E., Skinner, F., Conway, E., Hill, C., Kochanov, R., Tan, Y., Wcisło, P., Finenko, A., Nelson, K., Bernath, P., Birk, M., Boudon, V., Campargue, A., Chance, K., Coustenis, A., Drouin, B., Flaud, J., Gamache, R., Hodges, J., Jacquemart, D., Mlawer, E., Nikitin, A., Perevalov, V., Rotger, M., Tennyson, J., Toon, G., Tran, H., Tyuterev, V., Adkins, E., Baker, A., Barbe, A., Canè, E., Császár, A., Dudaryonok, A., Egorov, O., Fleisher, A., Fleurbaey, H., Foltynowicz, A., Furtenbacher, T., Harrison, J., Hartmann, J., Horneman, V., Huang, X., Karman, T., Karns, J., Kassi, S., Kleiner, I., Kofman, V., Kwabia-Tchana, F., Lavrentieva, N., Lee, T., Long, D., Lukashevskaya, A., Lyulin, O., Makhnev, V., Matt, W., Massie, S., Melosso, M., Mikhailenko, S., Mondelain, D., Müller, H., Naumenko, O., Perrin, A., Polyansky, O., Raddaoui, E., Raston, P., Reed, Z., Rey, M., Richard, C., Tóbiás, R., Sadiek, I., Schwenke, D., Starikova, E., Sung, K., Tamassia, F., Tashkun, S., Vander Auwera, J., Vasilenko, I., Vigasin, A., Villanueva, G., Vispoel, B., Wagner, G., Yachmenev, A., and Yurchenko, S.: The HITRAN2020 molecular spectroscopic database, J. Quant. Spectrosc. Ra., 277, 107949, https://doi.org/10.1016/j.jqsrt.2021.107949, 2022. a
Hersbach, H., Bell, B., Berrisford, P., Hirahara, S., Horányi, A., Muñoz-Sabater, J., Nicolas, J., Peubey, C., Radu, R., Schepers, D., Simmons, A., Soci, C., Abdalla, S., Abellan, X., Balsamo, G., Bechtold, P., Biavati, G., Bidlot, J., Bonavita, M., De Chiara, G., Dahlgren, P., Dee, D., Diamantakis, M., Dragani, R., Flemming, J., Forbes, R., Fuentes, M., Geer, A., Haimberger, L., Healy, S., Hogan, R. J., Hólm, E., Janisková, M., Keeley, S., Laloyaux, P., Lopez, P., Lupu, C., Radnoti, G., de Rosnay, P., Rozum, I., Vamborg, F., Villaume, S., and Thépaut, J.-N.: The ERA5 global reanalysis, Q. J. Roy. Meteor. Soc., 146, 1999–2049, https://doi.org/10.1002/qj.3803, 2020. a
IEM: ASOS-AWOS-METAR Data Download, Iowa Environmental Mesonet (IEM), https://mesonet.agron.iastate.edu/ASOS/ (last access: 9 May 2023), 2023. a
International Methane Emissions Observatory (IMEO) [@MethaneData]: Satellite detects methane plume in Nord Stream leak, Twitter, https://twitter.com/MethaneData/status/1575610350548164608 (last access: 20 July 2023), posted: 12:15, 30 September 2022. a
IPCC: Summary for Policymakers, Cambridge University Press, Cambridge, United Kingdom and New York, NY, USA, 3–32, https://doi.org/10.1017/9781009157896.001, 2021. a
Irakulis-Loitxate, I., Gorroño, J., Zavala-Araiza, D., and Guanter, L.: Satellites Detect a Methane Ultra-emission Event from an Offshore Platform in the Gulf of Mexico, Environ. Sci. Tech. Let., 9, 520–525, https://doi.org/10.1021/acs.estlett.2c00225, 2022a. a
Irakulis-Loitxate, I., Guanter, L., Maasakkers, J. D., Zavala-Araiza, D., and Aben, I.: Satellites Detect Abatable Super-Emissions in One of the World's Largest Methane Hotspot Regions, Environ. Sci. Technol., 56, 2143–2152, https://doi.org/10.1021/acs.est.1c04873, 2022b. a
Jervis, D., McKeever, J., Durak, B. O. A., Sloan, J. J., Gains, D., Varon, D. J., Ramier, A., Strupler, M., and Tarrant, E.: The GHGSat-D imaging spectrometer, Atmos. Meas. Tech., 14, 2127–2140, https://doi.org/10.5194/amt-14-2127-2021, 2021. a
Jia, M., Li, F., Zhang, Y., Wu, M., Li, Y., Feng, S., Wang, H., Chen, H., Ju, W., Lin, J., Cai, J., Zhang, Y., and Jiang, F.: The Nord Stream pipeline gas leaks released approximately 220,000 tonnes of methane into the atmosphere, Environmental Science and Ecotechnology, 12, 100210, https://doi.org/10.1016/j.ese.2022.100210, 2022. a, b
Koepke, P.: Effective reflectance of oceanic whitecaps, Appl. Optics, 23, 1816–1824, https://doi.org/10.1364/AO.23.001816, 1984. a, b
Lauvaux, T., Giron, C., Mazzolini, M., d'Aspremont, A., Duren, R., Cusworth, D., Shindell, D., and Ciais, P.: Global assessment of oil and gas methane ultra-emitters, Science, 375, 557–561, https://doi.org/10.1126/science.abj4351, 2022. a
Lo Piano, S., Ferretti, F., Puy, A., Albrecht, D., and Saltelli, A.: Variance-based sensitivity analysis: The quest for better estimators and designs between explorativity and economy, Reliab. Eng. Syst. Safe., 206, 107300, https://doi.org/10.1016/j.ress.2020.107300, 2021. a, b
Lorente, A., Borsdorff, T., Butz, A., Hasekamp, O., aan de Brugh, J., Schneider, A., Wu, L., Hase, F., Kivi, R., Wunch, D., Pollard, D. F., Shiomi, K., Deutscher, N. M., Velazco, V. A., Roehl, C. M., Wennberg, P. O., Warneke, T., and Landgraf, J.: Methane retrieved from TROPOMI: improvement of the data product and validation of the first 2 years of measurements, Atmos. Meas. Tech., 14, 665–684, https://doi.org/10.5194/amt-14-665-2021, 2021. a, b
Maasakkers, J. D., Varon, D. J., Elfarsdóttir, A., McKeever, J., Jervis, D., Mahapatra, G., Pandey, S., Lorente, A., Borsdorff, T., Foorthuis, L. R., Schuit, B. J., Tol, P., van Kempen, T. A., van Hees, R., and Aben, I.: Using satellites to uncover large methane emissions from landfills, Science Advances, 8, eabn9683, https://doi.org/10.1126/sciadv.abn9683, 2022. a
Molod, A., Takacs, L., Suarez, M., Bacmeister, J., Song, I.-S., and Eichmann, A.: The GEOS-5 Atmospheric General Circulation Model: Mean Climate and Development from MERRA to Fortuna, Tech. rep., NASA, https://ntrs.nasa.gov/citations/20120011790 (last access: 26 April 2024), 2012. a
NCEP: NCEP FNL Operational Model Global Tropospheric Analyses, Tech. rep., NCEP, https://doi.org/10.5065/D6M043C6, 2000. a
Nisbet, E. G., Fisher, R. E., Lowry, D., France, J. L., Allen, G., Bakkaloglu, S., Broderick, T. J., Cain, M., Coleman, M., Fernandez, J., Forster, G., Griffiths, P. T., Iverach, C. P., Kelly, B. F. J., Manning, M. R., Nisbet-Jones, P. B. R., Pyle, J. A., Townsend-Small, A., al Shalaan, A., Warwick, N., and Zazzeri, G.: Methane Mitigation: Methods to Reduce Emissions, on the Path to the Paris Agreement, Rev. Geophys., 58, e2019RG000675, https://doi.org/10.1029/2019RG000675, 2020. a
Pandey, S., Gautam, R., Houweling, S., van der Gon, H. D., Sadavarte, P., Borsdorff, T., Hasekamp, O., Landgraf, J., Tol, P., van Kempen, T., Hoogeveen, R., van Hees, R., Hamburg, S. P., Maasakkers, J. D., and Aben, I.: Satellite observations reveal extreme methane leakage from a natural gas well blowout, P. Natl. Acad. Sci. USA, 116, 26376–26381, https://doi.org/10.1073/pnas.1908712116, 2019. a
Roy, D., Wulder, M., Loveland, T., Woodcock, C. E., Allen, R., Anderson, M., Helder, D., Irons, J., Johnson, D., Kennedy, R., Scambos, T., Schaaf, C., Schott, J., Sheng, Y., Vermote, E., Belward, A., Bindschadler, R., Cohen, W., Gao, F., Hipple, J., Hostert, P., Huntington, J., Justice, C., Kilic, A., Kovalskyy, V., Lee, Z., Lymburner, L., Masek, J., McCorkel, J., Shuai, Y., Trezza, R., Vogelmann, J., Wynne, R., and Zhu, Z.: Landsat-8: Science and product vision for terrestrial global change research, Remote Sens. Environ., 145, 154–172, https://doi.org/10.1016/j.rse.2014.02.001, 2014. a
Sanderson, K.: What do Nord Stream methane leaks mean for climate change?, Nature, 30 September 2022, https://doi.org/10.1038/d41586-022-03111-x, 2022. a
Schuit, B. J., Maasakkers, J. D., Bijl, P., Mahapatra, G., van den Berg, A.-W., Pandey, S., Lorente, A., Borsdorff, T., Houweling, S., Varon, D. J., McKeever, J., Jervis, D., Girard, M., Irakulis-Loitxate, I., Gorroño, J., Guanter, L., Cusworth, D. H., and Aben, I.: Automated detection and monitoring of methane super-emitters using satellite data, Atmos. Chem. Phys., 23, 9071–9098, https://doi.org/10.5194/acp-23-9071-2023, 2023. a, b
Sentinel-Hub: EO Browser, https://apps.sentinel-hub.com/eo-browser (last access: 21 July 2023), 2023. a
USGS/Google: USGS Landsat 8 Collection 2 Tier 1 TOA Reflectance (LANDSAT/LC08/C02/T1_TOA), Google Earth Engine [data set], https://developers.google.com/earth-engine/datasets/catalog/LANDSAT_LC08_C02_T1_TOA#bands, last access: 30 April 2024. a
Varon, D. J., Jacob, D. J., McKeever, J., Jervis, D., Durak, B. O. A., Xia, Y., and Huang, Y.: Quantifying methane point sources from fine-scale satellite observations of atmospheric methane plumes, Atmos. Meas. Tech., 11, 5673–5686, https://doi.org/10.5194/amt-11-5673-2018, 2018. a, b, c, d
Varon, D. J., Jervis, D., McKeever, J., Spence, I., Gains, D., and Jacob, D. J.: High-frequency monitoring of anomalous methane point sources with multispectral Sentinel-2 satellite observations, Atmos. Meas. Tech., 14, 2771–2785, https://doi.org/10.5194/amt-14-2771-2021, 2021. a, b, c, d, e, f
Veefkind, J., Aben, I., McMullan, K., Förster, H., de Vries, J., Otter, G., Claas, J., Eskes, H., de Haan, J., Kleipool, Q., van Weele, M., Hasekamp, O., Hoogeveen, R., Landgraf, J., Snel, R., Tol, P., Ingmann, P., Voors, R., Kruizinga, B., Vink, R., Visser, H., and Levelt, P.: TROPOMI on the ESA Sentinel-5 Precursor: A GMES mission for global observations of the atmospheric composition for climate, air quality and ozone layer applications, Remote Sens. Environ., 120, 70–83, https://doi.org/10.1016/j.rse.2011.09.027, 2012. a
Whitlock, C. H., Bartlett, D. S., and Gurganus, E. A.: Sea foam reflectance and influence on optimum wavelength for remote sensing of ocean aerosols, Geophys. Res. Lett., 9, 719–722, https://doi.org/10.1029/GL009i006p00719, 1982. a, b