the Creative Commons Attribution 4.0 License.
the Creative Commons Attribution 4.0 License.
 | 22 Apr 2026
A novel technique for the humidity dependent calibration of hypoiodous acid (HOI) and iodine (I2)
Stephen J. Andrews
Maya Zmajkovic
Phil Rund
Becky Alexander
Joel Thornton
Andrew Peters
Peter Karadakov
Lucy J. Carpenter
Hypoiodous acid (HOI) and molecular iodine (I2) are important precursors of reactive gaseous iodine, which plays an important role in the oxidative capacity of the atmosphere and in aerosol formation in the marine boundary layer. HOI and I2 are emitted from the ocean surface and recycled on atmospheric aerosol via heterogeneous chemistry. Measurements of these molecules, which are typically present in the marine boundary layer at the low-to-sub part per trillion (ppt) level, are sparse, in part due to difficulties in quantification with a lack of appropriate instrumentation and calibration techniques. A novel calibration technique is developed for HOI via generation from I2 hydrolysis and then 1:1 conversion of HOI back to I2 through a NaI trap, allowing the sensitivity of HOI to be calculated relative to I2, which is readily calibrated using a permeation tube system. Using this calibration method, we describe the use of a reduced pressure high resolution chemical ionisation mass spectrometer (CIMS) to characterise the sensitivities of HOI and I2 over a range of humidities representative of the marine boundary layer and to measure these molecules in the field. At humidities of over 50 % RH, the CIMS sensitivity of I2 is humidity independent whereas HOI exhibits a slight negative humidity dependence. The effect of inlet interactions on HOI and I2 signals is investigated, with HOI observed to convert to I2. The implications of these inlet interactions and humidity sensitivities for future ambient measurement configurations are discussed.
- Article
(7986 KB) - Full-text XML
- BibTeX
- EndNote


Iodine species play an important role in atmospheric chemistry and climate. They influence the oxidative capacity of the atmosphere through the destruction of ozone (O3) (Chameides and Davis, 1980; Solomon et al., 1994; Read et al., 2008; Saiz-Lopez et al., 2014; Sherwen et al., 2016a) and alteration of hydrogen oxides (HOx) and nitrogen oxides (NOx) cycles (Simpson et al., 2015; Saiz-Lopez and von Glasow, 2012). They can also oxidize elemental mercury (Calvert and Lindberg, 2004; Auzmendi-Murua et al., 2014; Lee et al., 2024) and are involved in new particle formation, with iodine oxide radicals (IO), produced during the reaction between O3 and iodine, self-reacting and further ozonising to form I2O5 which can hydrolyse to form HIO3 (O'Dowd et al., 2002; Sipilä et al., 2016; Finkenzeller et al., 2023).
Of the halogens, iodine has the most profound impact on tropospheric O3 cycling and significantly modifies the atmospheric response to anthropogenic perturbations of ozone precursor emissions. Global model simulations show that atmospheric iodine chemistry lowers the global tropospheric O3 burden by 6 %–20 % and reduces O3 concentrations by several parts per billion (ppb), with significant effects over polluted and populated regions (Saiz-Lopez et al., 2014; Sherwen et al., 2016a, b; Wang et al., 2021b; Pound et al., 2023; Caram et al., 2023). The dominant source of atmospheric iodine is from the oceans, primarily from the reaction of O3 and iodide on the sea surface (Garland et al., 1980; Carpenter et al., 2013; MacDonald et al., 2014), resulting in the emission of molecular iodine (I2) and hypoiodous acid (HOI). HOI is thought to be the largest source, representing ≈75 % of iodine emissions into the troposphere (Sherwen et al., 2016a). In the atmosphere, I2 and HOI rapidly photolyse, producing reactive iodine radicals that catalytically destroy O3 (Saiz-Lopez and von Glasow, 2012; Simpson et al., 2015). This cycle represents a negative feedback mechanism, whereby increased O3 concentrations are offset by increased iodine emissions (Carpenter et al., 2013; Prados-Roman et al., 2015). In fact, model calculations project that future increases in anthropogenic O3 will be buffered by iodine (Iglesias-Suarez et al., 2020), which has implications for future air quality. Ice core records have shown that there has been a tripling of atmospheric iodine since 1950 (Cuevas et al., 2018; Legrand et al., 2018), likely due to increased anthropogenic O3 production. Recent measurements of iodine radicals in the lower stratosphere (Koenig et al., 2020) have also demonstrated the potential for iodine to contribute to stratospheric ozone depletion. Iodine has a far higher O3 destruction potential than chlorine (Klobas et al., 2021) and has been implicated as a potential reason for the unexplained decrease in extra-polar lower stratospheric O3 (Koenig et al., 2020), which is a region where O3 changes exert strong radiative effects on climate (Neale et al., 2025).
Despite the significance of HOI and I2 as the main emission source of atmospheric iodine, and of HOI as a sink for the iodine oxide (IO) radical, there have been few measurements of these compounds. Measurements of I2, which has been detected by both Differential Optical Absorption Spectroscopy (DOAS) and by Chemical Ionisation Mass Spectrometry (CIMS), have typically been restricted to coastal areas (Saiz-Lopez and Plane, 2004; Bitter et al., 2005; Peters et al., 2005; Mahajan et al., 2009; Huang et al., 2010) with only one measurement in the remote ocean region (Lawler et al., 2014). There has so far been only one directly quantified measurement of HOI, by CIMS, also in a coastal region rather than the open ocean (Tham et al., 2021). There are several challenges that contribute to the scarcity of measurements of these molecules. The mixing ratios of iodine compounds are low, in the sub-ppt to 10 ppt range over the ocean, due to their short atmospheric lifetimes (Saiz-Lopez et al., 2012; Lawler et al., 2014). In addition, halogen compounds can undergo heterogeneous chemistry on the surfaces of instrument inlets, resulting in loss or potentially addition of signal (Neuman et al., 2010; Liao et al., 2012, 2014; Le Breton et al., 2017; Peng et al., 2022). Further, there is a lack of highly sensitive and selective measurement techniques and instrumentation to measure and quantify these compounds. Given that reactive halogen chemistry is increasingly being incorporated into global chemistry transport models, there is an urgent requirement for observations to help provide constraints and improve model capabilities.
Chemical ionisation mass spectrometry is increasingly being used in the measurement of trace atmospheric gases due to its high sensitivity and selectivity, high time-resolution, soft ionisation, and ability to directly measure compounds in the field with minimal sample preparation (Huey, 2007; Lee et al., 2014; Zhang et al., 2023; Riva et al., 2024). Reagent ions are generated and interact with sample molecules in an ion molecule reactor (IMR) to produce analyte ions, such as through charge transfer or adduct formation reactions. Various reagent ions have been used to measure atmospheric halogen species such as SF to measure HCl and ClONO2 (Marcy et al., 2005), NO to measure HIO3 (Sipilä et al., 2016; Finkenzeller et al., 2023), and SF to measure bromine and chlorine compounds such as Br2, Cl2, BrCl, IBr, and BrO (Sjostedt and Abbatt, 2008; Buys et al., 2013; Roscoe et al., 2014). More recently, I− has been used for a wide range of chlorine and bromine atmospheric species including Cl2, Br2, ClNO2, BrNO2, ClONO2, ClO, BrO, HCl, HOCl, HOBr, BrCl, and various chlorine-containing OVOCs (Kercher et al., 2009; Lee et al., 2014, 2018; Custard et al., 2016; Le Breton et al., 2017; Priestley et al., 2018). However, the I− reagent ion is not effective in measuring trace levels of iodine species as they can be formed during the generation of the reagent gas (Wang et al., 2021a). An alternative is to use Br− as a reagent ion. This has previously been used to measure Cl2, HO2, H2SO4 and HNO3 (Lawler et al., 2011; Sanchez et al., 2016; Rissanen et al., 2019; Wang et al., 2020) and more recently to detect various iodine species such as I2, HOI, ICl and IBr using a chemical ionisation atmospheric pressure interface time-of-flight (CI-APi-TOF) mass spectrometer (Tham et al., 2021; Wang et al., 2021a; He et al., 2023). A reduced pressure Br-CIMS has also been developed which can produce analyte ions through an AIM (adduct ionisation mechanism) IMR (Riva et al., 2024). The instrument operates at medium pressures (50–500 mbar) producing low electric fields ( Td or field-free conditions), which reduces the chances of fragmentation and promotes adduct formation as the primary method of analyte formation. This loses some of the sensitivity compared to higher pressure CIMS instruments due to the reduced numbers of collisions occurring in the IMR. However, this is compensated for with an increased linear range of detected compounds through promotion of adduct formation.
It has previously been shown that water can form an adduct with halide (I−, Br−) reagent ions (Reaction R1), which can subsequently act as a reagent ion itself (Reaction R3) (Lee et al., 2014; Wang et al., 2021a). The formation enthalpy between a sample molecule and the hydrated reagent ion is lower than with the dry reagent ion (He et al., 2023), and so increasing humidity should result in a decrease in sensitivity, as the proportion of dry reagent ions decreases. However, for small molecules (<8 atoms), increasing humidity has generally been shown to increase sensitivity (Lee et al., 2014; Iyer et al., 2016). This was explained by Quantum Rice-Ramsperger-Kassel (QRRK) theory (Rice and Ramsperger, 1927; Kassel, 1928) which treats the halide adduct cluster as a collection of identical harmonic oscillators (vibrational modes) at the same frequency. On formation of the cluster, the energy produced is distributed amongst the cluster vibrational modes. Not all vibrational modes are considered accessible with experimental evidence suggesting the number of accessible vibrational modes is about half of the total number of vibrational modes (Laidler, 1987). The cluster will fragment if energy above a critical threshold is localised in a single vibrational mode. The rate at which this occurs for a cluster (the decay rate) is calculated by Eq. (1) (Kurtén et al., 2010; Lee et al., 2014).
where k is the decay rate (s−1), ν is the average vibrational frequency of the cluster (cm−1), s is the number of accessible vibrational modes, m is the quantised binding energy and j is the quantised total thermal energy of the cluster (binding energy plus thermal energy of the individual molecules). m and j are quantised by dividing their calculated energies (cm−1) by ν.
Adding a water molecule to the cluster increases the number of vibrational modes, which decreases the probability that the critical energy threshold is reached in a single oscillator (Kurtén et al., 2010), resulting in a decrease in the decay rate of the newly formed clusters (Reactions R4 and R5). Additionally, a lower energy fragmentation pathway is available for the hydrated adduct (Reaction R6), which kicks out the water molecule and keeps the sample molecule and reagent ion together.
where A is the sample molecule.
This kinetic enhancement via the water molecule is in competition with the thermodynamic effect of lower formation enthalpy and will affect different sample molecules to different degrees, requiring the humidity dependence of every molecule of interest to be quantified. Additionally, the humidity dependence will vary between instruments due to differences in IMR conditions and instrument tuning settings.
In this work, the ability for the Br-CIMS to detect and quantify the iodine species I2 and HOI is demonstrated, and the impact of changing humidity on the instrument sensitivity to these molecules is quantified.
2.1 Bromide Time-of-Flight Chemical Ionisation Mass Spectrometry (CIMS)
The measurement of I2 and HOI were performed using a Vocus S Chemical Ionisation Time-of-Flight (CI-TOF) Mass Spectrometer (Tofwerk, Switzerland), a high resolution (R≈5000) instrument that can produce Br− reagent ions and Br-adduct analyte ions through a Vocus Aim reactor. The operational principles of the instrument and the AIM reactor are described in detail by Riva et al. (2024).
The Br− reagent ions are generated by passing 0.25 SLPM ultra-high purity N2 gas over a permeation tube held at 80 °C containing > 99 % benzene, C6H6, and trace amounts of bromoethane, C2H5Br. This gas mixture is passed into a vacuum ultraviolet (VUV) ion source where UV light is emitted from a Kr lamp at 116.487 and 123.584 nm which is absorbed by the benzene, generating photoelectrons (Reaction R7) (Ji et al., 2020; Breitenlechner et al., 2022). These photoelectrons react with the C2H5Br, generating Br− ions (Reaction R8) (Riva et al., 2024).
The Br− reagent ions are passed into an ion-molecule reactor (IMR) where they are joined by 1.8 SLPM of sample gas which has been passed into the sampling inlet and through a 0.475 mm critical orifice. The IMR is temperature controlled at 50 °C and pressure controlled at 50 mbar using a vacuum pump (IDP3, Agilent Technologies). The Br− reacts with sample molecules to form adduct ions. These are drawn through another critical orifice and travel through four differentially pumped chambers which remove neutral molecules and focus the ions into a narrow beam before entering the drift region of the time-of-flight (ToF) chamber. Ions in the TOF chamber are extracted in discrete packets at a frequency of 18.02 kHz and converted into mass spectra using an MCP detector with a preamplifier over a range of 7–510 Th. The extracted packets are averaged over a period of 1 s which is also the speed of data collection. Data averaging, mass calibration, peak assignment, peak fitting and peak integration were all performed using the software package Tofware (version 4.0.1, Aerodyne Research Inc.) used in Igor Pro 9 software (Wavemetrics). This data was then exported and analysed further using the R language for statistical computing (R Core Team).
2.2 Humidity generation
The calibrations performed in this work were made over a humidity range from near complete dryness to almost 100 % RH in order to be able to correct for effects caused by variations in ambient humidity in field measurements. This was achieved by humidifying the N2 gas entering the instrument to various degrees using an in-house dynamic liquid calibration unit (LCU). The operation of this liquid calibration system has been described elsewhere (Yeoman et al., 2022) but is briefly covered here. The LCU is comprised of a proportional liquid-gas mixing valve (Bronkhorst) which controls the mass flow of liquid measured by a mini-Coriolis flow meter (Bronkhorst). It introduces a mass flow controlled zero-air dilution gas to aerosolize and fully evaporate the liquid into a temperature-controlled mixing region. The liquid is pressurized without gas contact, using a custom-built pneumatic cylinder with wetted materials of glass and PTFE.
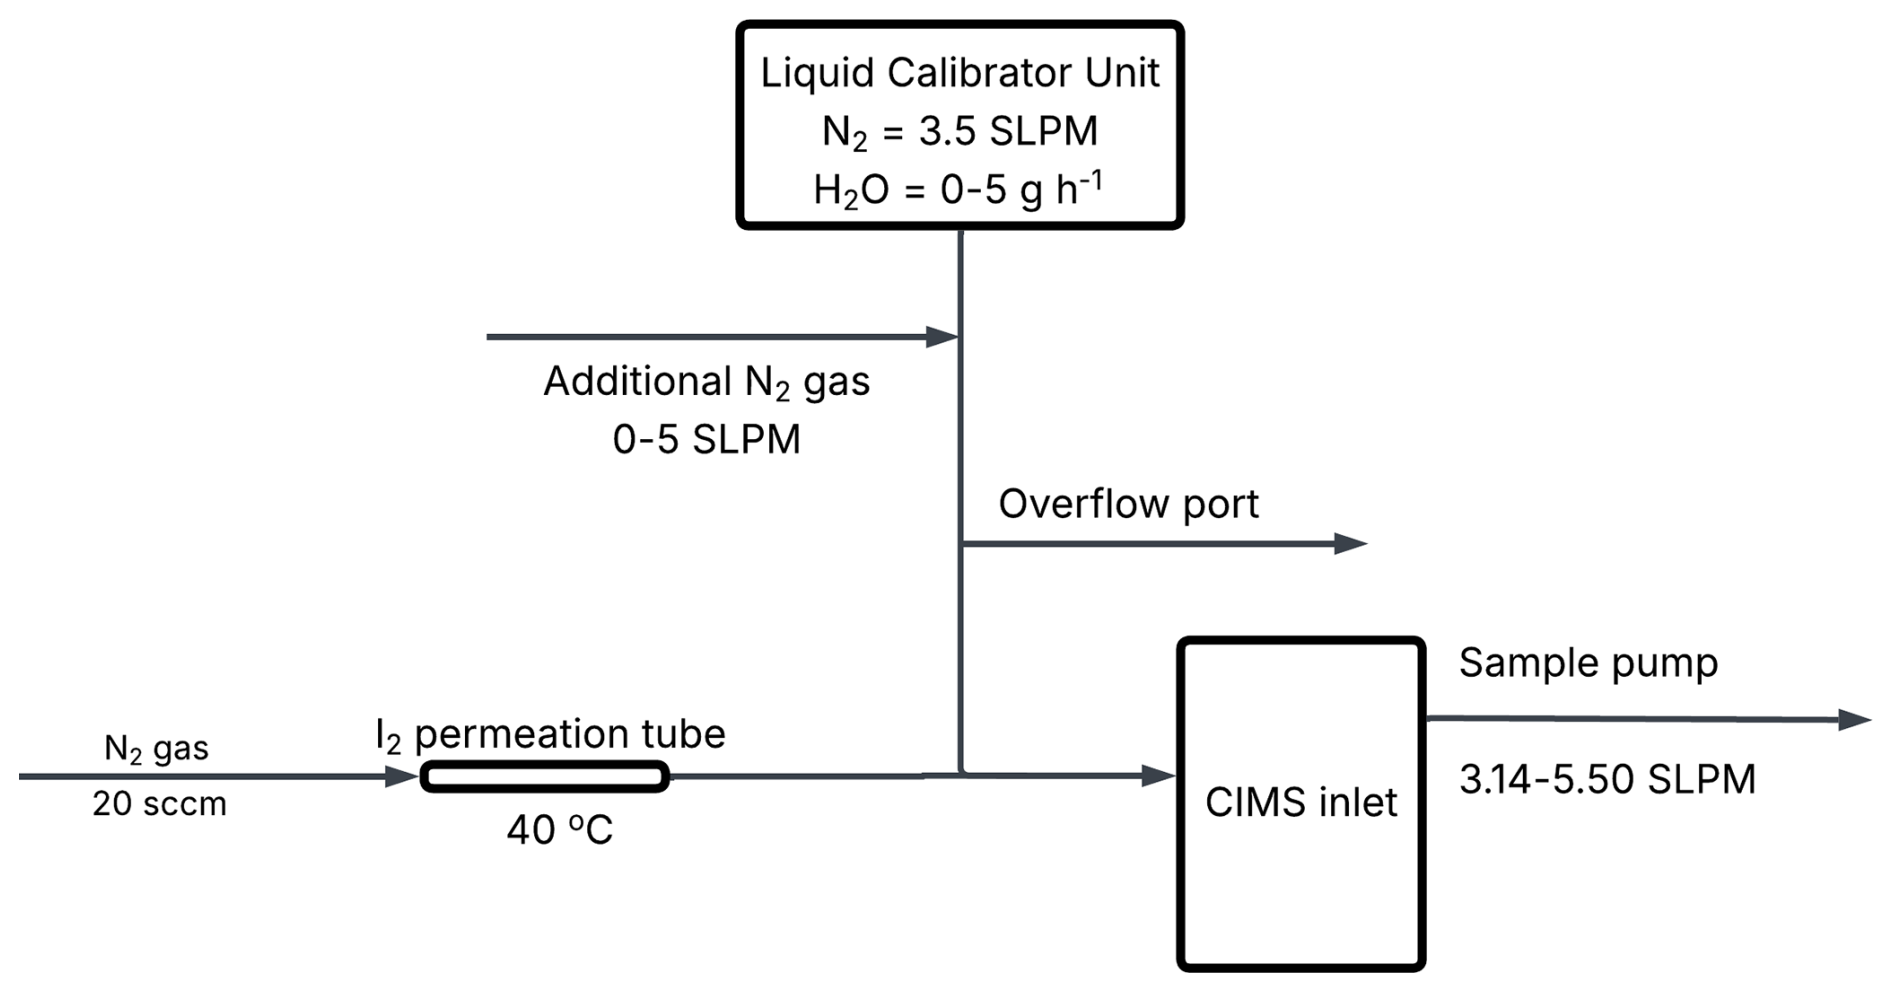
The gas output of the LCU was maintained at 3.5 SLPM and the water concentration ranged from 0–5 g h−1. During the I2 calibrations, an additional flow of N2 gas was used to further increase the gas output. The tubing between the LCU outlet and the additional flow was heated to prevent saturation and condensation of the water vapour.
2.3 Calibration setup
2.3.1 I2 calibration
An I2 permeation tube was constructed by adding solid I2 crystals (99.99 %, Sigma-Aldrich) into a o.d. thin-walled PFA tube with the ends heat sealed closed. The permeation tube was held in a temperature-controlled permeation holder at 40 °C. The temperature variation in the holder was minimal, at ± 0.1 °C, and is included in the uncertainty calculation. The permeation tube was continuously swept by 20 sccm high-purity oxygen-free N2 gas. The emission rate was calculated gravimetrically by measuring the mass of the permeation tube over a period of 6 months. Measurements were taken on average every 3 weeks with each data point representing the average of 6 sequential mass measurements, as shown in Fig. A1. The emission rate was calculated from the gradient of Fig. A1 and corresponds to an emission rate of 34.7 ± 0.21 ng min−1 with little variation seen during the measurement period.
A schematic of the I2 calibration setup is shown in Fig. 1. Humidified N2 gas from the LCU was used to dilute the permeation gas flow and the CIMS internal sample pump was used to sample this diluted I2 permeation gas. Before mixing with the permeation gas, the dilution gas was first split, with some diluting the I2 permeation gas and some passing through an overflow port. The amount of dilution gas mixing with the permeation gas depends on how much flow the CIMS sample pump pulls towards the instrument. By changing this sample flow rate and hence the dilution of the permeation gas, the concentration of I2 was altered, allowing for the construction of calibration curves at different humidity levels. Concentrations of I2 generated during the calibrations ranged from 1–3×10¹⁰ molecules cm−3 (600–1000 ppt at SATP).
2.3.2 HOI calibration
HOI was generated from the hydrolysis of I2 (Reaction R9) in an experimental setup similar to that previously developed for the generation of HOBr in a study by Liao et al. (2012). 500 sccm of N2 gas was passed over the same I2 permeation tube from the I2 calibration and mixed with 500 sccm N2 gas which had been humidified by passing through a bubbler containing Milli-Q water. This was passed over wetted AgNO3 crystals (99 % Fluorochem) in a 9.5 cm long o.d. PFA tube. A small aqueous layer forms on the AgNO3 crystal surface, in which I2 hydrolysis occurs (Reaction R9). The AgNO3 reacts with the generated I− and H+ (Reactions R10–12), pushing the (Reaction R9) equilibrium in favour of HOI production.
The resulting I2 and HOI gas mixture was diluted by humidified N2 gas from the LCU before being drawn into the CIMS at a flow rate of ≈4.1 SLPM. The AgNO3 reactor tube and instrument inlet were wrapped in heating tape and heated to 50 °C to avoid HOI loss to the tube and inlet walls. The quantification of HOI is achieved by the inclusion of a trap containing sodium iodide (NaI) crystals (99 %, Sigma-Aldrich). When the trap is in place, HOI is converted back into I2 (Reaction R13).
The sensitivity of HOI relative to I2 was found by comparing the HOI signal loss and I2 signal gain from Reaction (R13). A 1:1 conversion of HOI to I2 was assumed, consistent with the approach of Liao et al. (2012) for the equivalent HOBr–Br2 system. Figure 2 shows the simplified schematic of the calibration setup and an idealised example of the relative change between I2 and HOI. As water is required in the HOI generation step, the calibrations are performed at high humidity. Lowering the humidity of the N2 gas should allow for lower humidity calibrations, but this will reduce the yield of HOI produced by (Reaction R9), making it more difficult to observe the change in I2 signal.
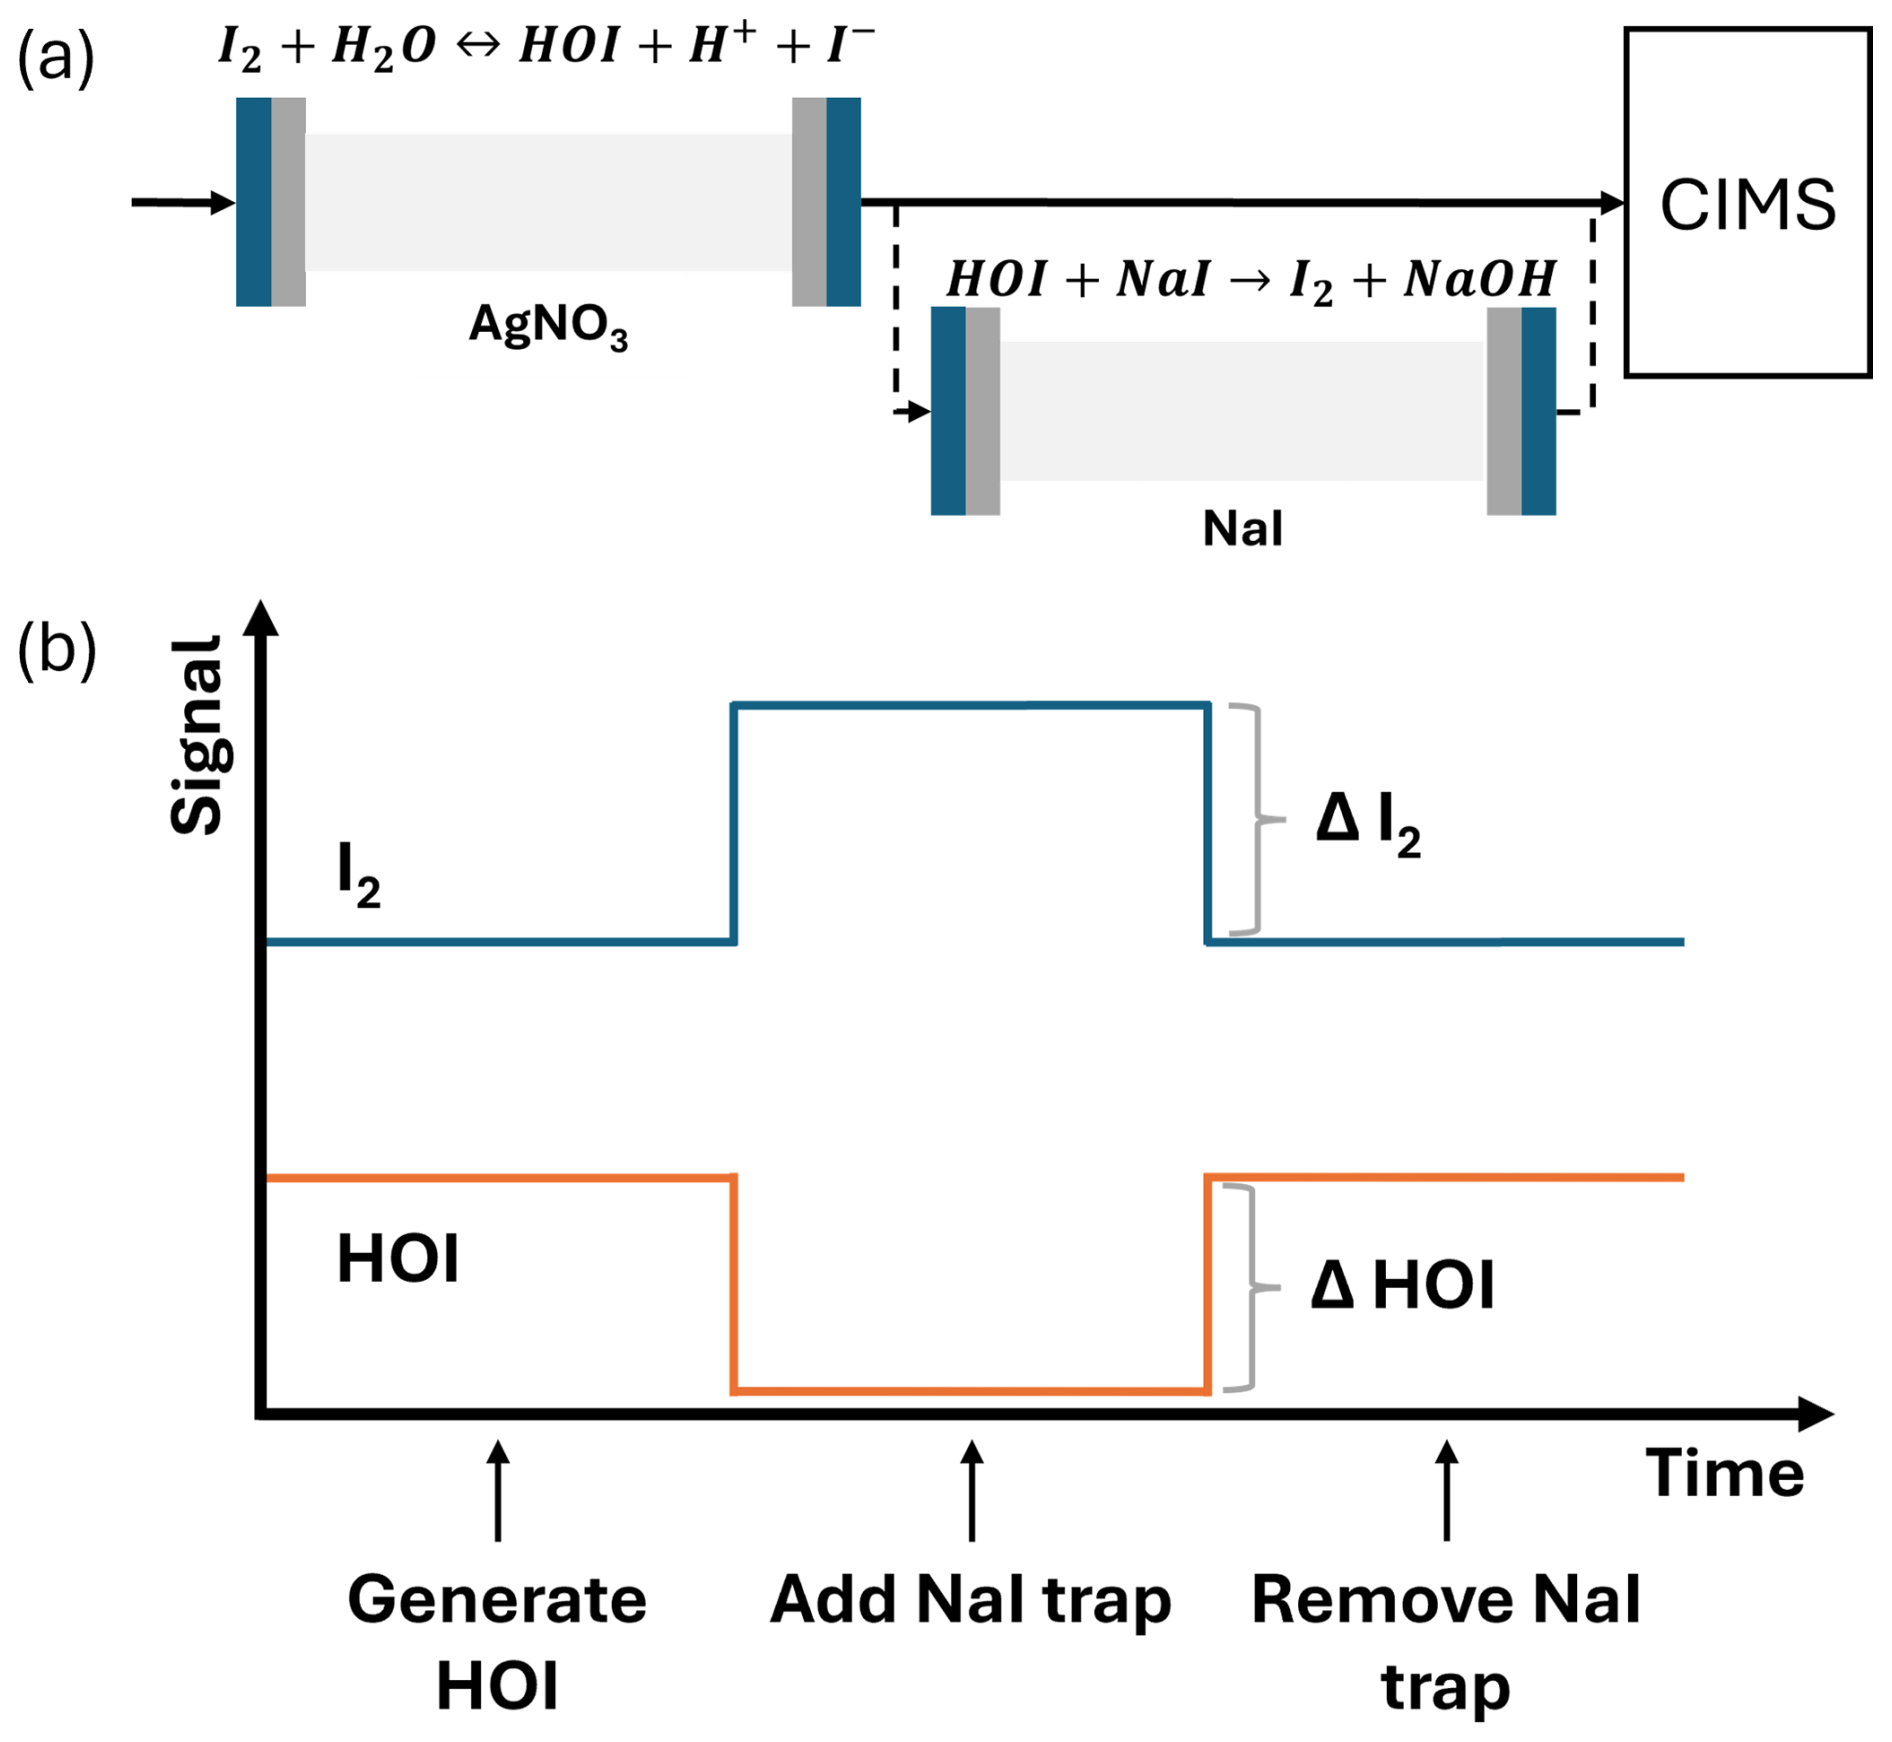
Figure 2(a) A simplified schematic of the HOI calibration setup with reactions shown for HOI generation and destruction. (b) An idealised example of the change in HOI and I2 signal in the CIMS on addition and removal of the NaI trap.
2.4 Field measurements at Tudor Hill Marine Atmospheric Observatory, Bermuda
The CIMS instrument was deployed during the Bermuda boundary Layer Experiment on the Atmospheric Chemistry of Halogens (BLEACH) field campaign in June 2022. The instrument was stationed at the Tudor Hill Marine Atmospheric Observatory (THMAO) on the west coast of the island of Bermuda (32.26° N, 64.88° W). At this site, the instrument was placed on top of a temporary sampling tower at 10 m above ground level and 40 m above sea level. The ion source gas was supplied by an air compressor connected to a nitrogen membrane and connected to the instrument by stainless steel tubing. The instrument was contained in an air-conditioned water-resistant enclosure and located at the top of the tower, minimising the potential for inlet effects to occur. The sample inlet was a short (15 cm, 1.27 cm outer diameter) length of PFA tube. A PTFE guard was placed at the entrance of the inlet tube, with an opening at the bottom, orientated 90° to the inlet. This allowed air to enter at a 90° bend and continue to the instrument while reducing the number of particles entering the CIMS as they impact onto the inlet walls. The sampling rate was 4.1 L min−1, resulting in an inlet residence time of 0.59 s. The Reynolds number was 155, indicating laminar flow once the air was past an 8.5 cm entrance length.
2.5 Quantum chemical calculations
Quantum chemical calculations were used to find the vibrational frequency, binding energy and number of vibrational modes for the adducts I2Br− and HOIBr−. These were performed using Gaussian 16, Revision C.02 (Frisch et al., 2019), including all electrons in the correlation calculations through “MP2(Full)” and “CCSD(T,Full)”. The geometries of the adducts were optimised at the MP2 level and then single-point energies were calculated, at these geometries, at the CCSD(T) level. All geometry optimisations were carried out under the “VeryTight” convergence criteria, and the optimised geometries were confirmed as local minima through subsequent frequency calculations. All calculations used the standard aug-cc-pVTZ basis set for all atoms except iodine, and the aug-cc-pVTZ-PP ECP basis from the Basis Set Exchange (Pritchard et al., 2019) for iodine. We refer to this combination as “aug-cc-pVTZ-PP`”. Binding enthalpies were obtained by adding together the energy difference E (complex) – E (reactants) at the CCSD(T) level to the corresponding difference between the thermal corrections to the enthalpy at the MP2 level (the thermal corrections to the enthalpy involve vibrational contributions, hence the need to have these at the level at which the geometries were optimised). The values are shown in Table 1.
Table 1The calculated vibrational frequencies, binding energy, total thermal energy and vibrational modes of the I2Br− and HOIBr− clusters. The decay rate is found using Eq. (1).
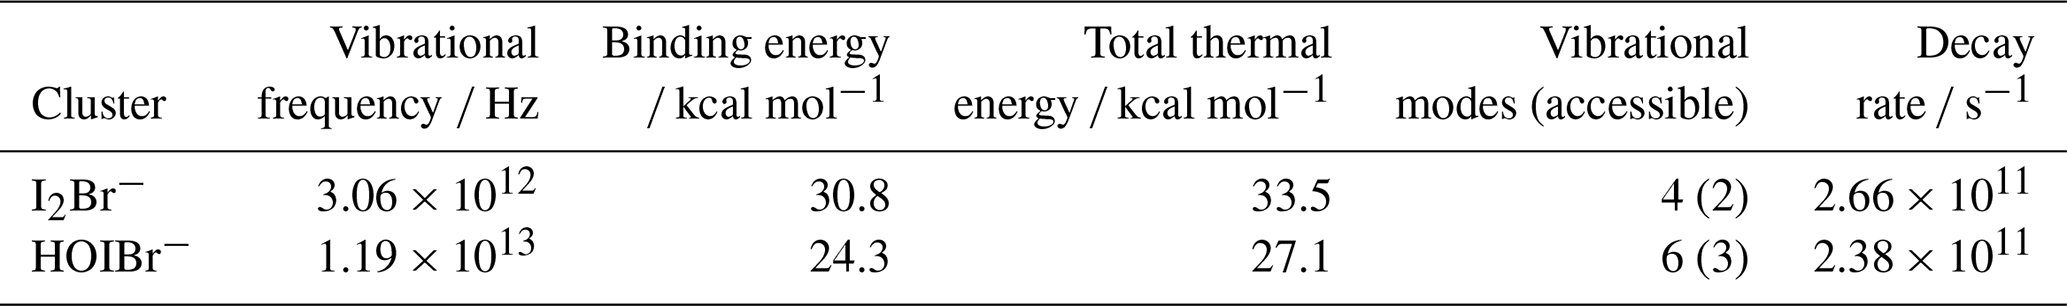
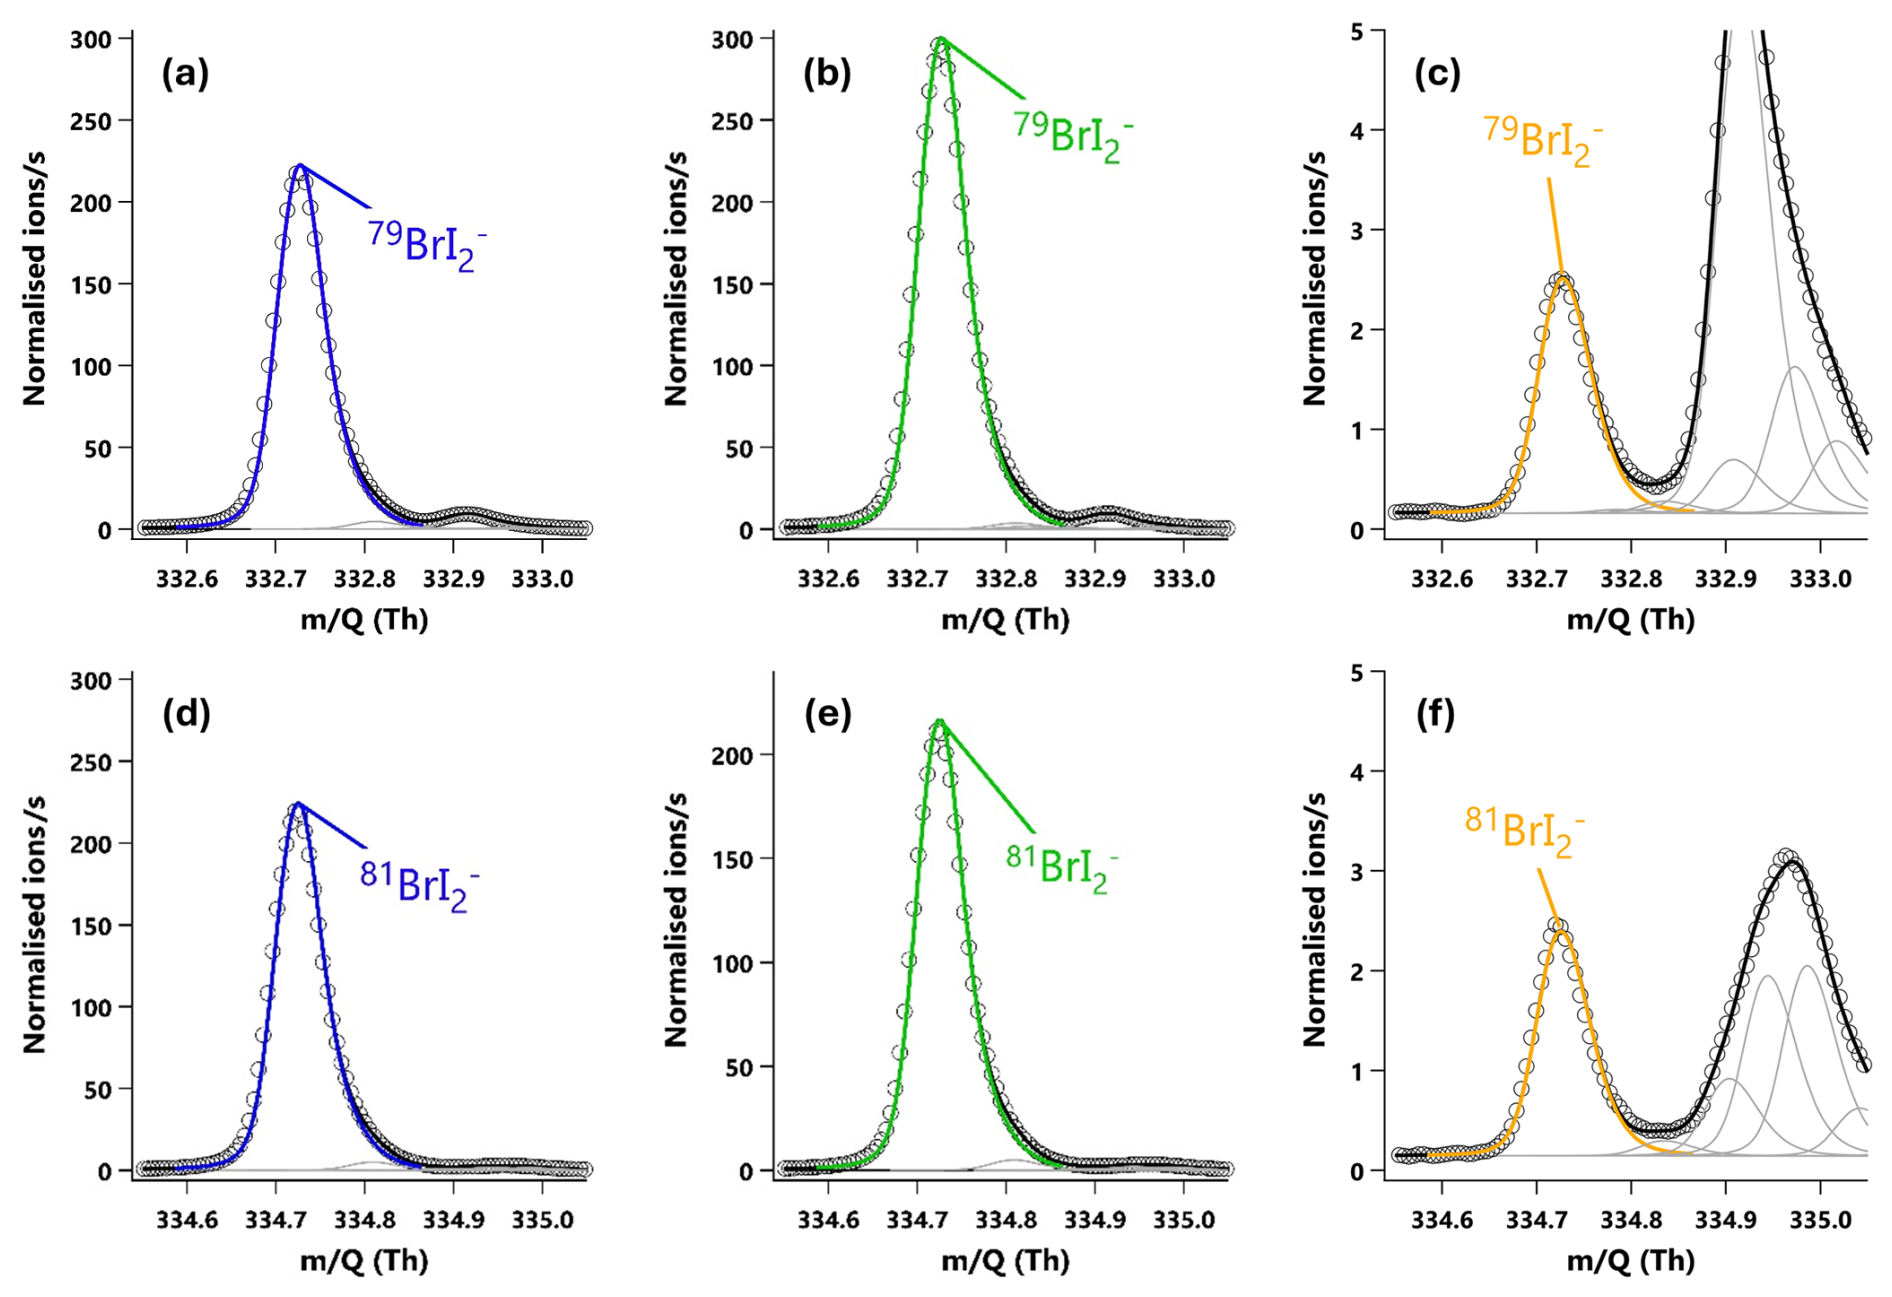
Figure 320 min averaged high resolution single peak mass spectra fits for the molecular ion peak (a, b, c) and primary isotope peak (d, e, f) for I2. The signal intensities correspond to mixing ratios of (a) 190.2 ppt, (b) 254.0 ppt and (c) 1.37 ppt. (a, d) The I2 signal during an HOI calibration run without the NaI trap. (b, e) The I2 signal during an HOI calibration run on addition of the NaI trap. (c, f) Ambient air measurements of I2 in a high humidity environment.
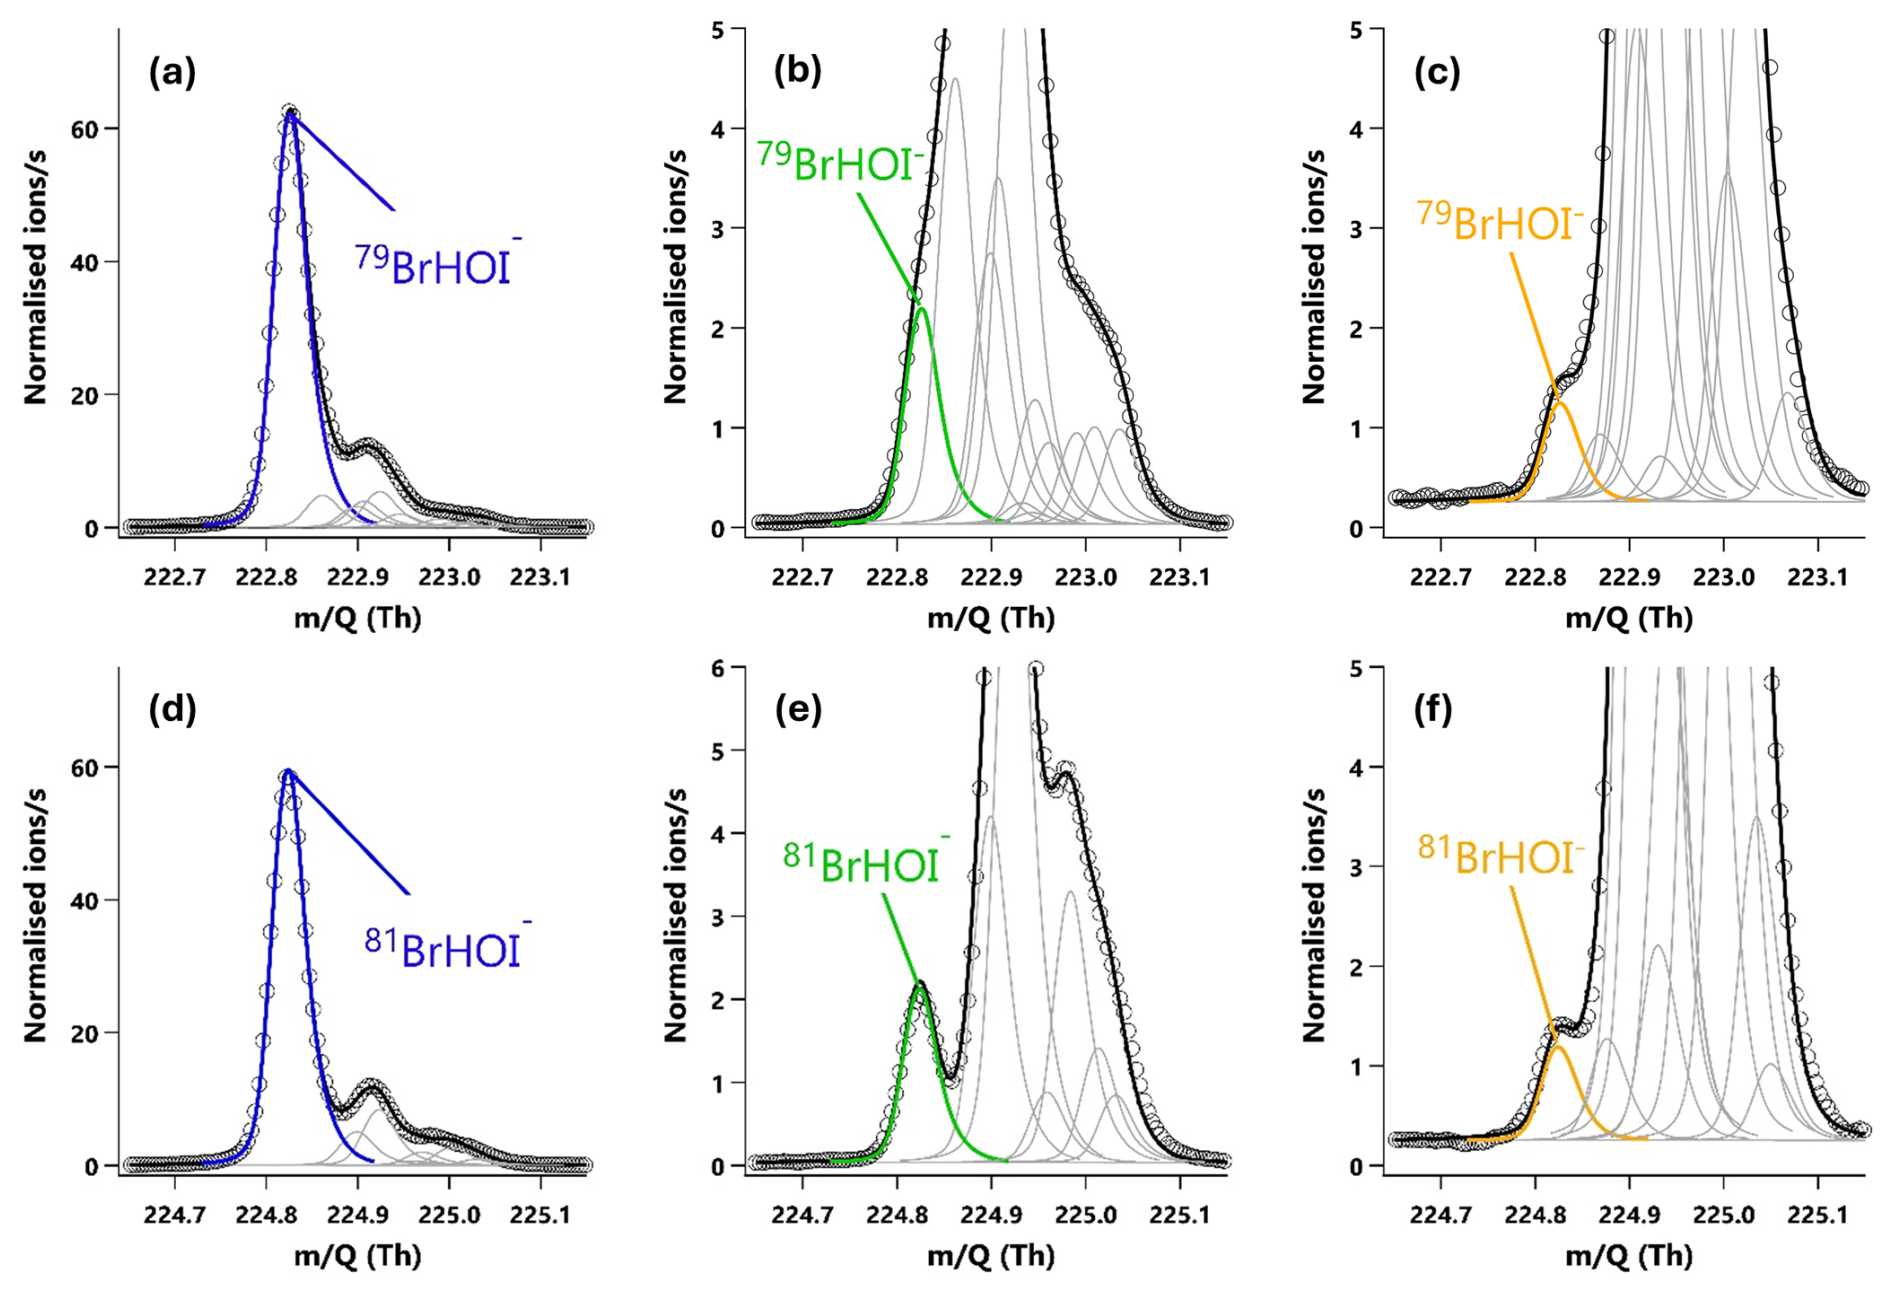
Figure 420 min averaged high resolution single peak mass spectra fits for the molecular ion peak (a, b, c) and primary isotope peak (d, e, f) for HOI. The signal intensities correspond to mixing ratios of (a) 60.8 ppt, (b) 2.2 ppt and (c) 0.87 ppt. (a, d) The HOI signal during an HOI calibration run without the NaI trap. (b, e) The HOI signal during an HOI calibration run on addition of the NaI trap. (c, f) Ambient air measurements of HOI in a high humidity environment.
3.1 Detection of iodine compounds
I2 and HOI were detected as adducts with Br−, with the two I2Br− isotopes observed at and 334.73 Th and the two HOIBr− isotopes at 222.83 and 224.83 Th. The single peak mass spectra fits for I2 are shown in Fig. 3, and in Fig. 4 for HOI, taken from an HOI calibration experiment and of ambient air at Tudor Hill, Bermuda. At the instrument resolution of 5000, the high mass defect of the I2Br− adduct allows it to be clearly differentiated from other peaks even during ambient conditions at low mixing ratios. The HOIBr− adduct has a smaller mass defect, and subsequently has more overlap with interferent peaks. During the HOI generation stage of the calibration (Fig. 4a), the HOI signal is significantly greater than any interferent peaks. However, on addition of the NaI trap (Fig. 4b), or during ambient measurements (Fig. 4c), the HOI signal overlaps with other interferent peaks. Despite this, the resolution is sufficient for Tofware's multi-peak fitting algorithm (Stark et al., 2015) to identify HOI even at very low mixing ratios. The signal can be further verified by examining the fit of the HOI isotope peak (Fig. 4d–f), calculated by the Tofware software. Detection limits during field conditions are discussed in Sect. 3.7.
3.2 Signal normalisation
The I2 and HOI adducts are formed from a pseudo first order reaction between the sample molecules and the reagent ions, and the adduct signal intensity is proportional to the reagent ions available. During experiments, the quantity of available reagent ions fluctuates over time. This can be due to variations in the efficiency of the ion source in generating the reagent ions, or with slight changes within the instrument. This variation can be corrected for by normalising the analyte signal against the sum of the reagent ions measured by the instrument, shown in Eq. (2). For CIMS instruments, the normalised signal is typically reported per million reagent ions, with units of normalised counts per second per million reagent ion counts per second (ncps). It has been reported that normalisation can compensate up to 50 % reagent ion depletion from sample molecules (Riva et al., 2024).
where A is the sample molecule.
3.3 I2 humidity dependence
The humidity of the instrument IMR, where the reagent ion collisions occur, is not directly measured but has been related to the sample relative humidity (Wang et al., 2021a; He et al., 2023) and/or vapour pressure of water (Lee et al., 2014, 2018). An alternative method is to use the ratio between the first reagent ion water cluster, H2OBr−, and the dry reagent ion, Br− (Dörich et al., 2021), Eq. (3). This has the advantage of not requiring further equipment to measure humidity levels during calibrations and accounts for any changes that may occur when the gas flows through the inlet. The so-called “water ratio” is used hereon to represent humidity. The water ratio is compared against absolute humidity measured during the BLEACH campaign in Fig. A4. Previous studies have shown that IMR temperature can impact the proportions of the hydrated and dry reagent ions, though this has been performed over a wide range of temperatures (Robinson et al., 2022). Figure A4 shows that there was little variation in the IMR temperature (± 0.6 °C) and pressure (± 0.35 mbar) during the BLEACH campaign and that these changes did not noticeably affect the water ratio at different humidities.
I2 calibrations were performed at a range of different humidities generated by changing the water mass supplied by the LCU. The range of I2 concentrations for each humidity was between 1–3×10¹⁰ molecules cm−3; about two orders of magnitude higher than what would typically be observed in the atmosphere. Ideally, the concentration range would be comparable to atmospheric levels, but limitations in the amount of gas dilution and water mass flow restricted the minimum concentrations that could be used. Low pressure CIMS instruments reportedly have large linear ranges, particularly when normalising to the reagent ion (Riva et al., 2024), and so it is assumed in this work that the calibration range is within the linear range of the instrument. The I2 sensitivity was determined by calculating the gradient of the calibration curves with units of ncps cm3 molecules−1. The instrument response over the calibration range demonstrated a high degree of linearity, an example of which is shown in Fig. 5.
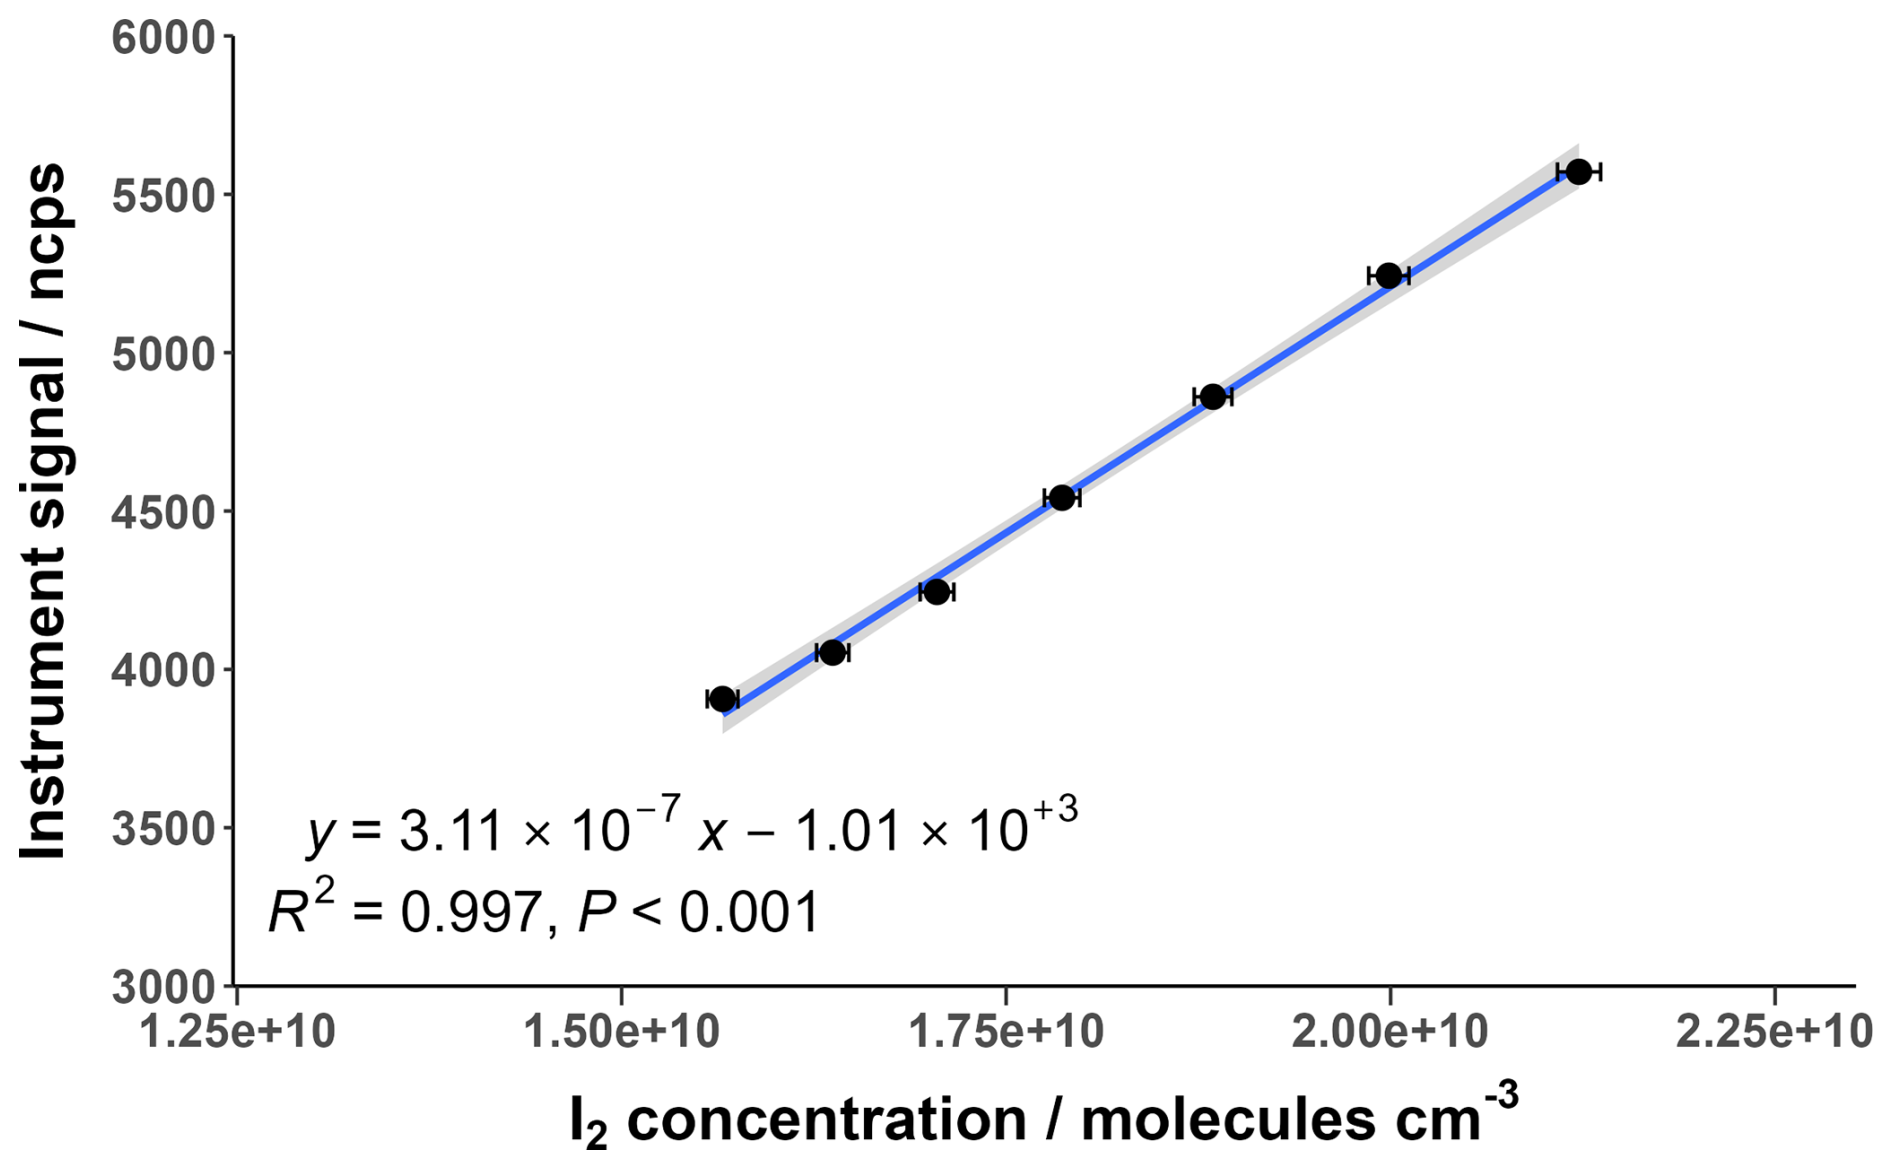
Figure 5Normalised instrument signal against I2 concentration for an example calibration at a water ratio of 1.05. The shaded area represents the 95 % confidence interval of the fitted curve. Error bars indicate the calculated propagated uncertainty of the I2 concentration, shown in Sect. 3.5.
The change in I2 sensitivity at different humidities is demonstrated in Fig. 6. Above a water ratio of ∼0.7, the sensitivity of I2 is effectively humidity-independent with a sensitivity of () ncps cm3 molecules−1. This is four times more sensitive than the average sensitivity of () ncps cm3 molecules−1 at near dryness (average water ratio =0.0022), which can be attributed to the stabilising effect of the H2O molecule on the formed adduct. As humidity is increased, this stabilising effect is balanced out by more adduct formation occurring via the BrH2O− reagent ion, which is a less exothermic reaction (Wang et al., 2021a). There is also an increase in the formation of the second water cluster, Br(H2O), at very high humidities, shown in Fig. 7. There appears to be no literature on whether this cluster also acts as a reagent ion for I2. However, it is unlikely to act as one due to an additional collisional reaction needed for formation of Br(H2O) and the likely even lower formation enthalpy between the second water cluster and a sample molecule. The second water cluster may have an indirect effect on the reduction of the increase in sensitivity. At very high humidities, the proportion of dry reagent ion continues to decrease with the first water cluster proportion remaining steady while the second water cluster increases. This suggests the formation rate of the first water cluster is being matched by its conversion to the second water cluster. This will still reduce the amount of adduct formation occurring through the more exothermic dry reagent ion pathway but will not produce an increase in sensitivity via water stabilisation. These factors potentially explain the emergence of the humidity-independent region above the 0.7 water ratio.
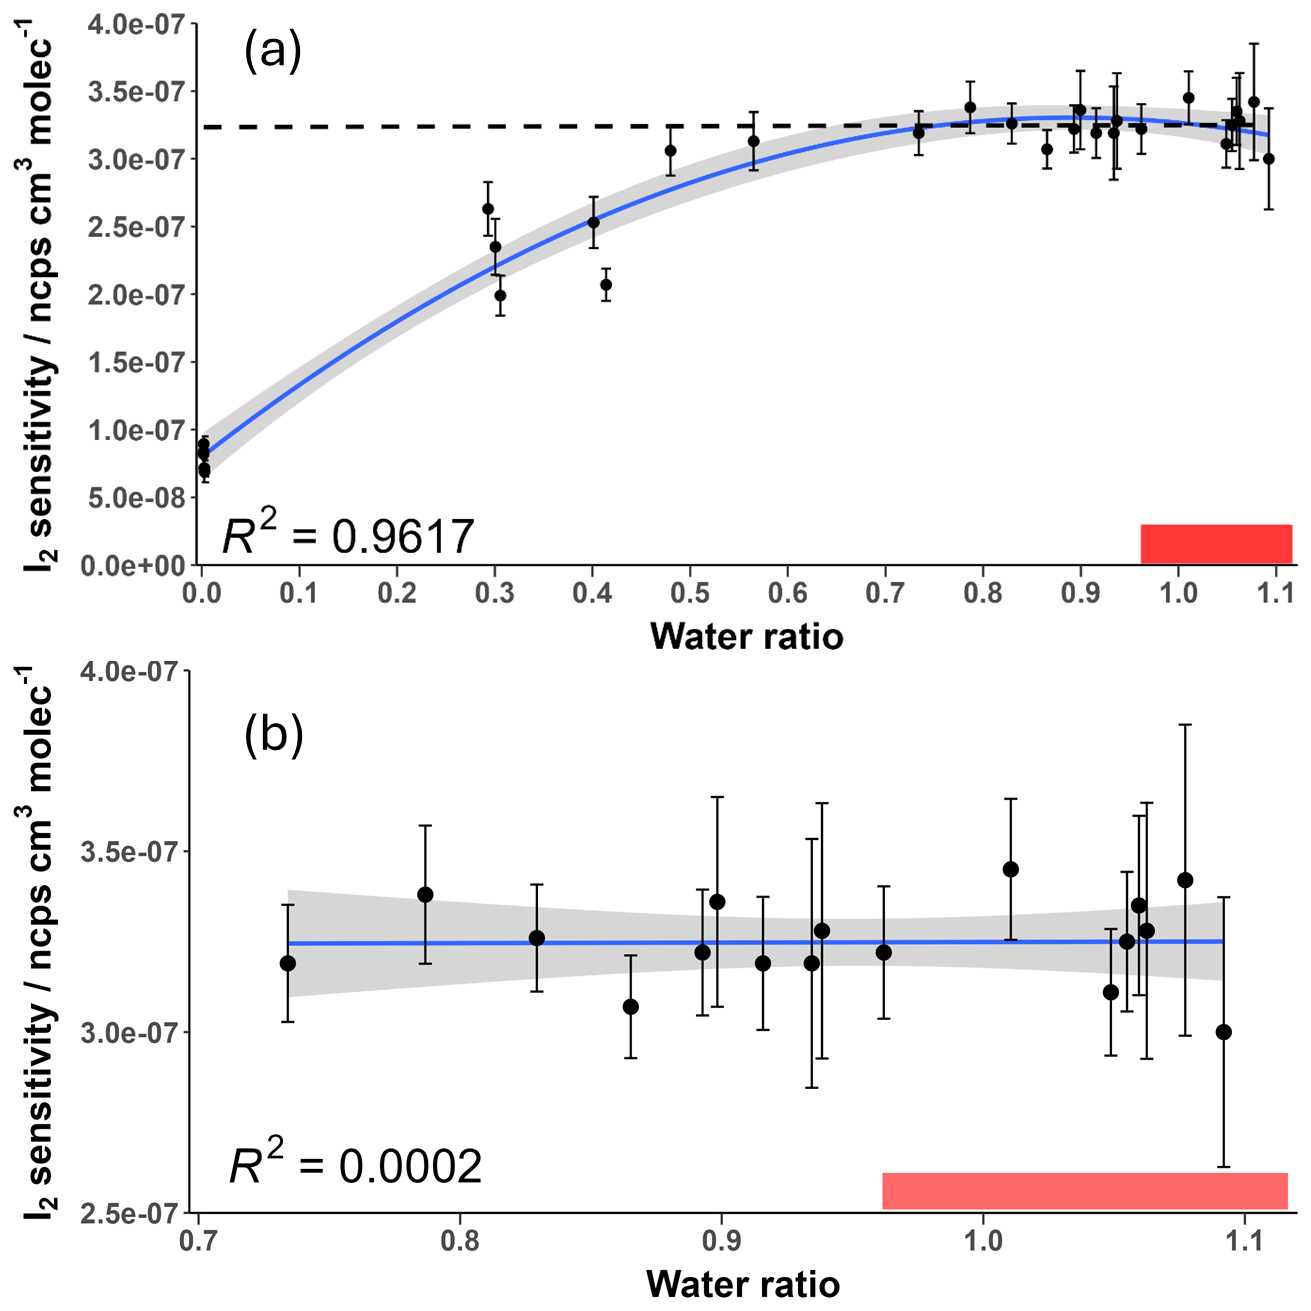
Figure 6Measured I2 sensitivity at different humidity levels over (a) the full range and (b) the humidity-independent range. Error bars represent the calculated error for each sensitivity value described in Sect. 3.5. The shaded grey area represents the 95 % confidence interval of the fitted curve. The shaded red region represents the ambient water ratio observed in the marine boundary layer at Tudor Hill, Bermuda. The dotted line in (a) is the average of the data points in (b).
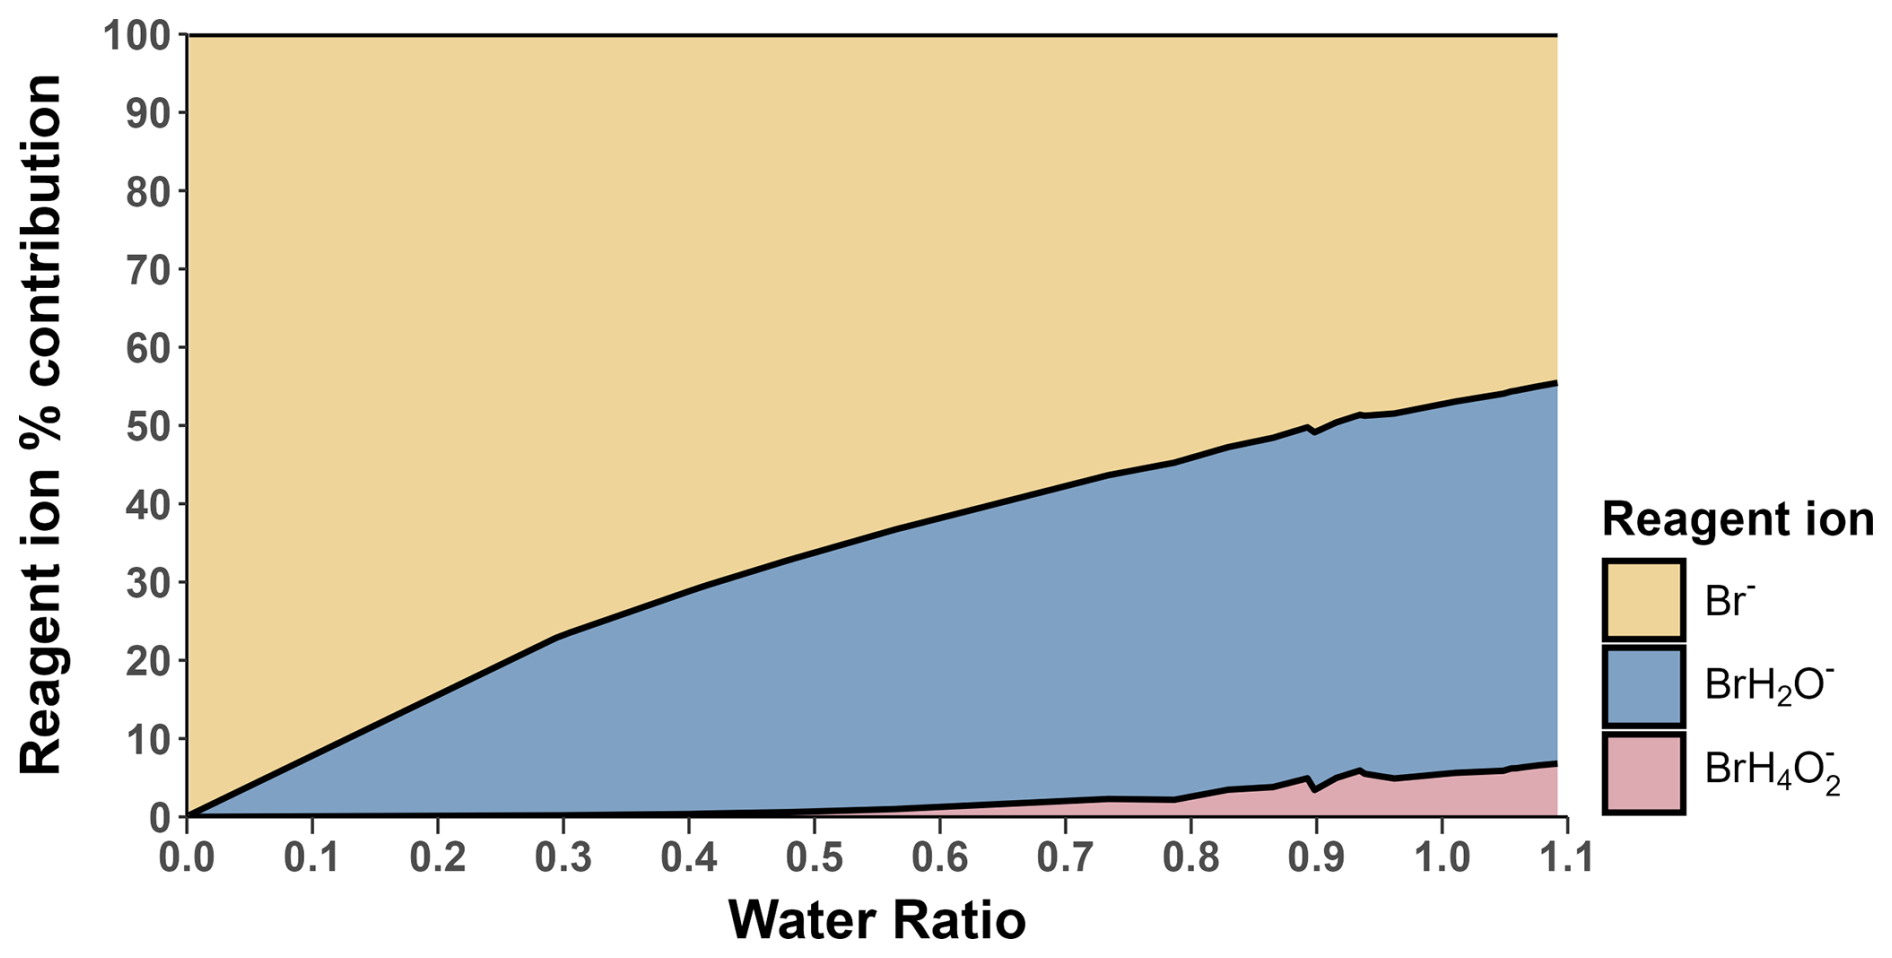
Figure 7The percentage contribution of the Br− ion (yellow), BrH2O− ion (blue) and BrH4O ion (pink) at different water ratios. The values shown are the average contributions of these ions detected during the I2 calibration runs.
3.4 HOI calibration and humidity dependence
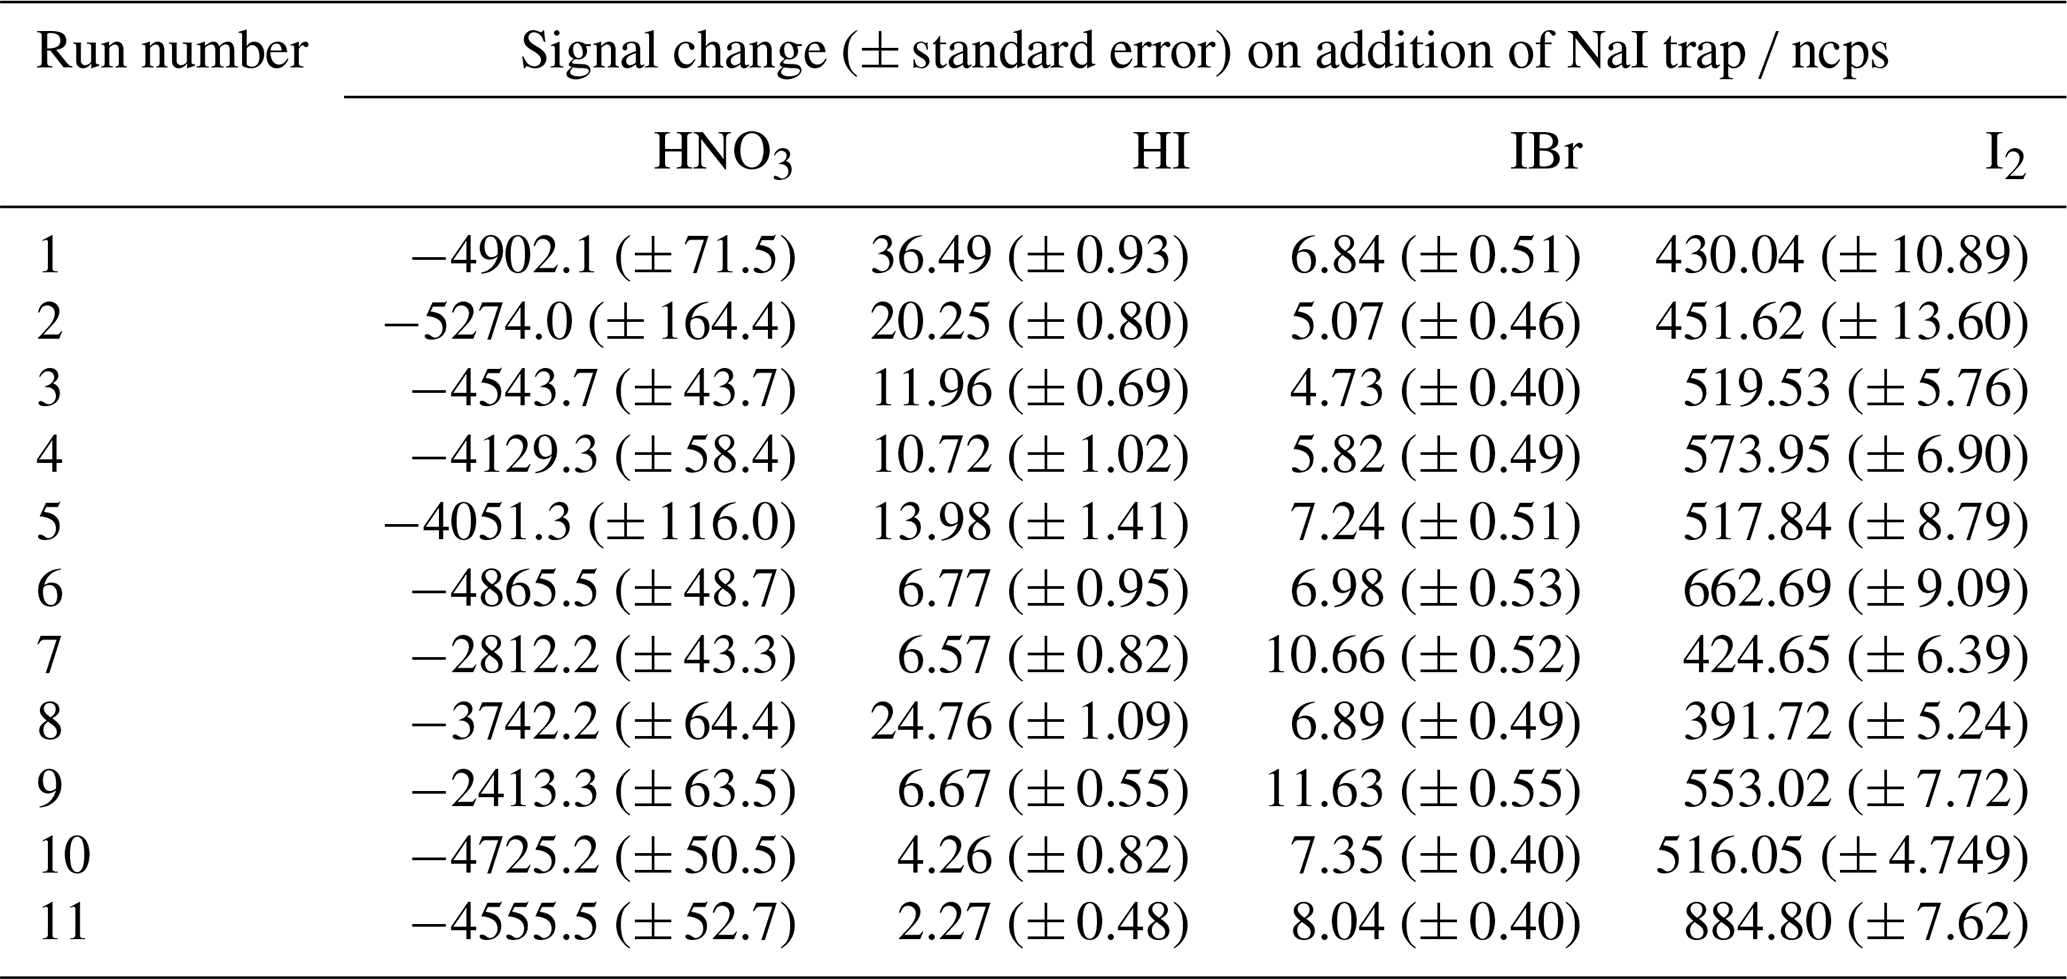
The relative sensitivity of HOI compared to I2 (termed the ratio) was quantified by comparing the change in signal of HOI and I2 with and without the NaI trap in place, with an example calibration shown in Fig. 8. With no trap in place, the ratio of HOI to I2 signal was found to be around 1:5. On addition of the NaI trap, almost all of the HOI signal was removed with a corresponding increase in I2 signal observed. For the equivalent HOBr–Br2 system in the Liao et al. (2012) system, the conversion of HOBr to Br2 was assumed to be 1:1. Here, the 1:1 HOI to I2 conversion assumption was tested by measuring the signal of various other iodine-containing compounds, to determine whether any other significant reaction pathways were occurring during the production and destruction of HOI. The mass spectra of these other iodine compounds are shown including the NaI trap in Fig. A2 and without the trap in Fig. A3. Some of these compounds have substantial overlapping interfering peaks, and it is not possible at the instrument resolution to determine how real their signals are. Of these compounds, only HI and IBr had both distinct enough peaks and showed a small increase on addition of the NaI trap. The increase in HI and IBr signals were much smaller than for I2, which represented 96 % of the change in signal, as shown in Table A1. The production of HI is likely from the reaction of NaI and HNO3, which is produced via (Reaction R12) in the HOI generation step, rather than from HOI. It is possible that the IBr signal may be produced from HOI, for example if there was some contaminant NaBr also present in the trap. Conversely, any contaminant bromine compounds in the gas stream may react with the NaI trap, producing the IBr. However, the average standard error of the I2 signal change is already higher than the increase in IBr signal, and so the production of IBr can be considered negligible against the other uncertainties of the calibration and the assumed 1:1 conversion of HOI to I2 can be maintained.
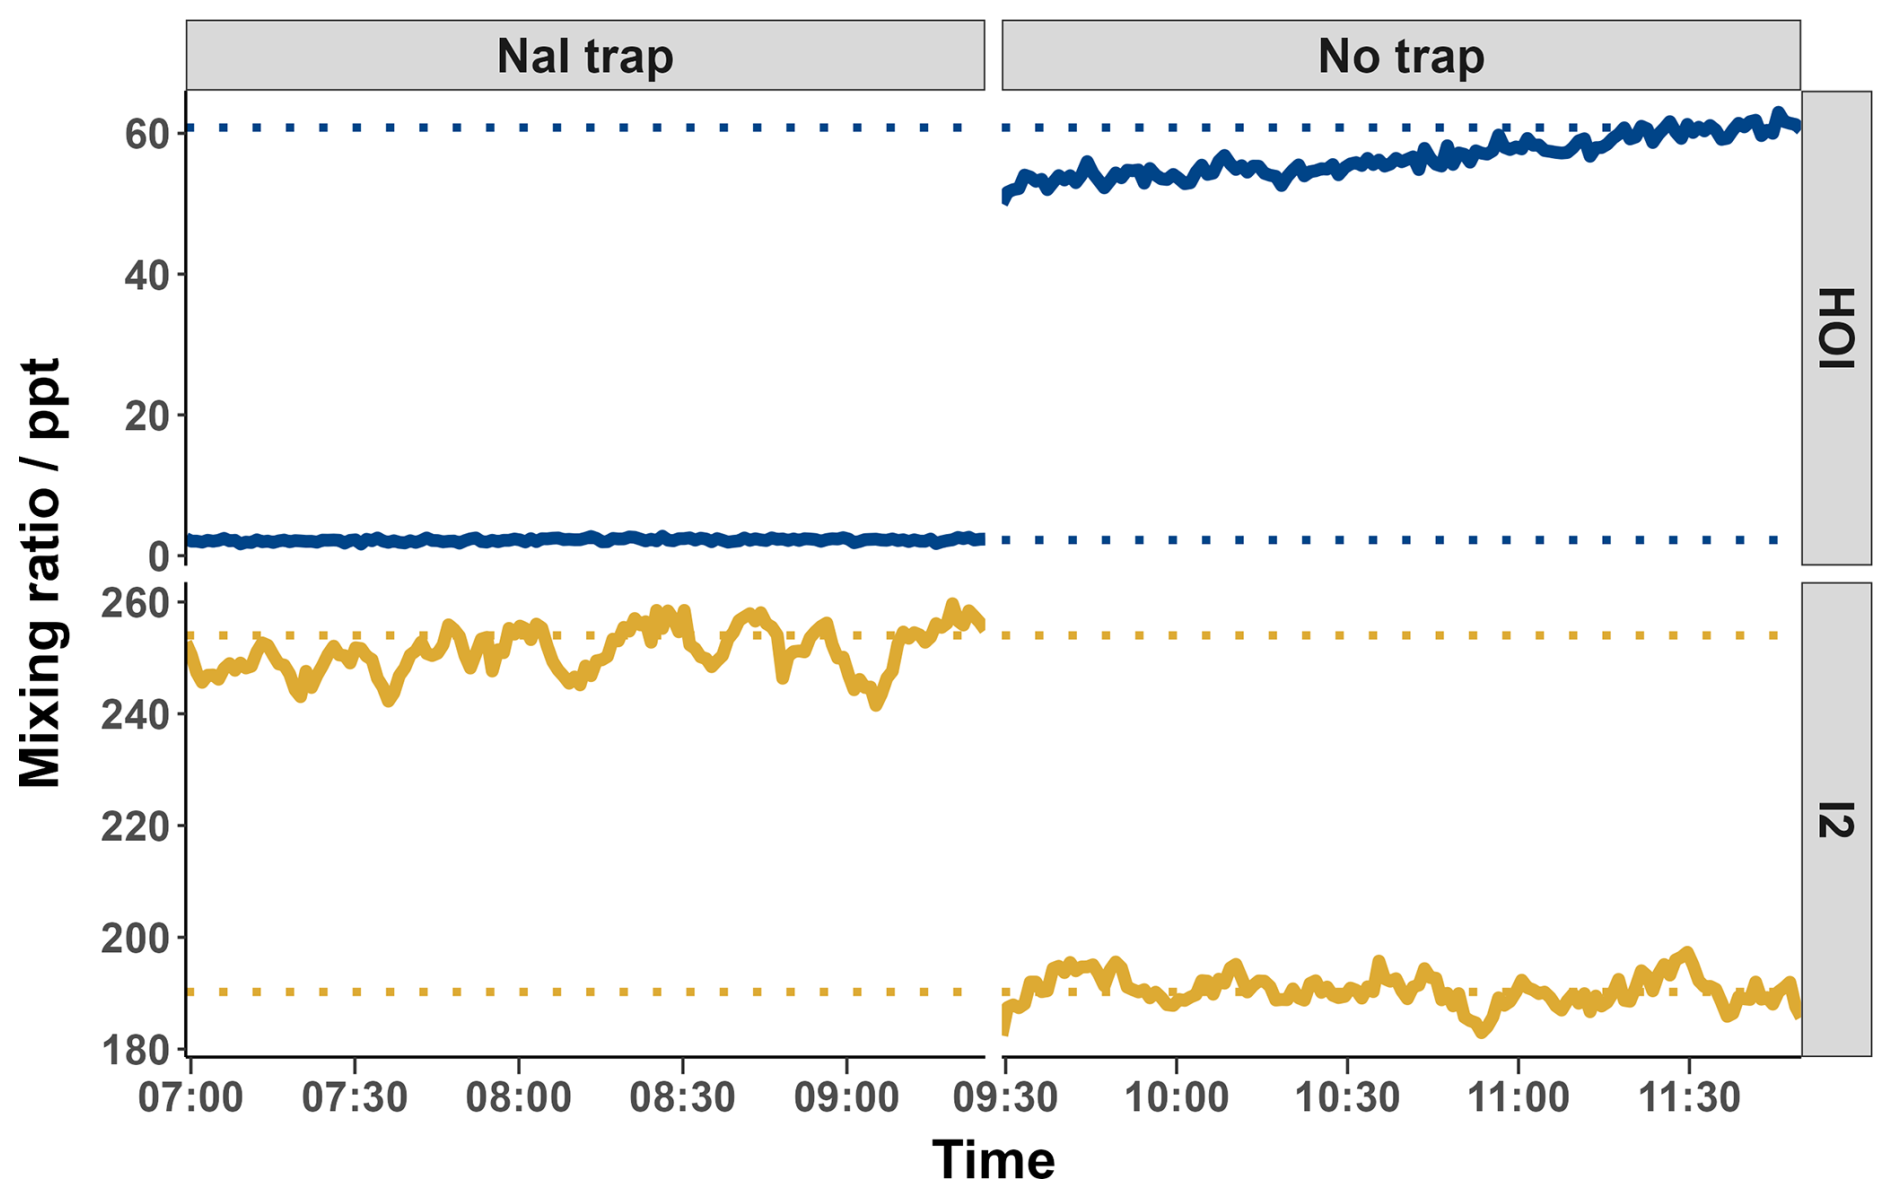
Figure 81 min averaged HOI and I2 mixing ratios with and without the inclusion of the NaI trap. Dotted lines indicate the average mixing ratio of the final 20 min of each run. Values were calculated according to the calibration curve from Fig. 9.
The HOI calibration experiments were performed at different water ratios to determine how the ratio changes with humidity. As water was required to generate HOI in the first stage of the calibration, the experiments were only able to be performed at relatively high humidity, between water ratios of 0.7 and 1.1. This range corresponds to the humidity-independent region found for I2. The humidity dependence of the ratio is shown in Fig. 9.
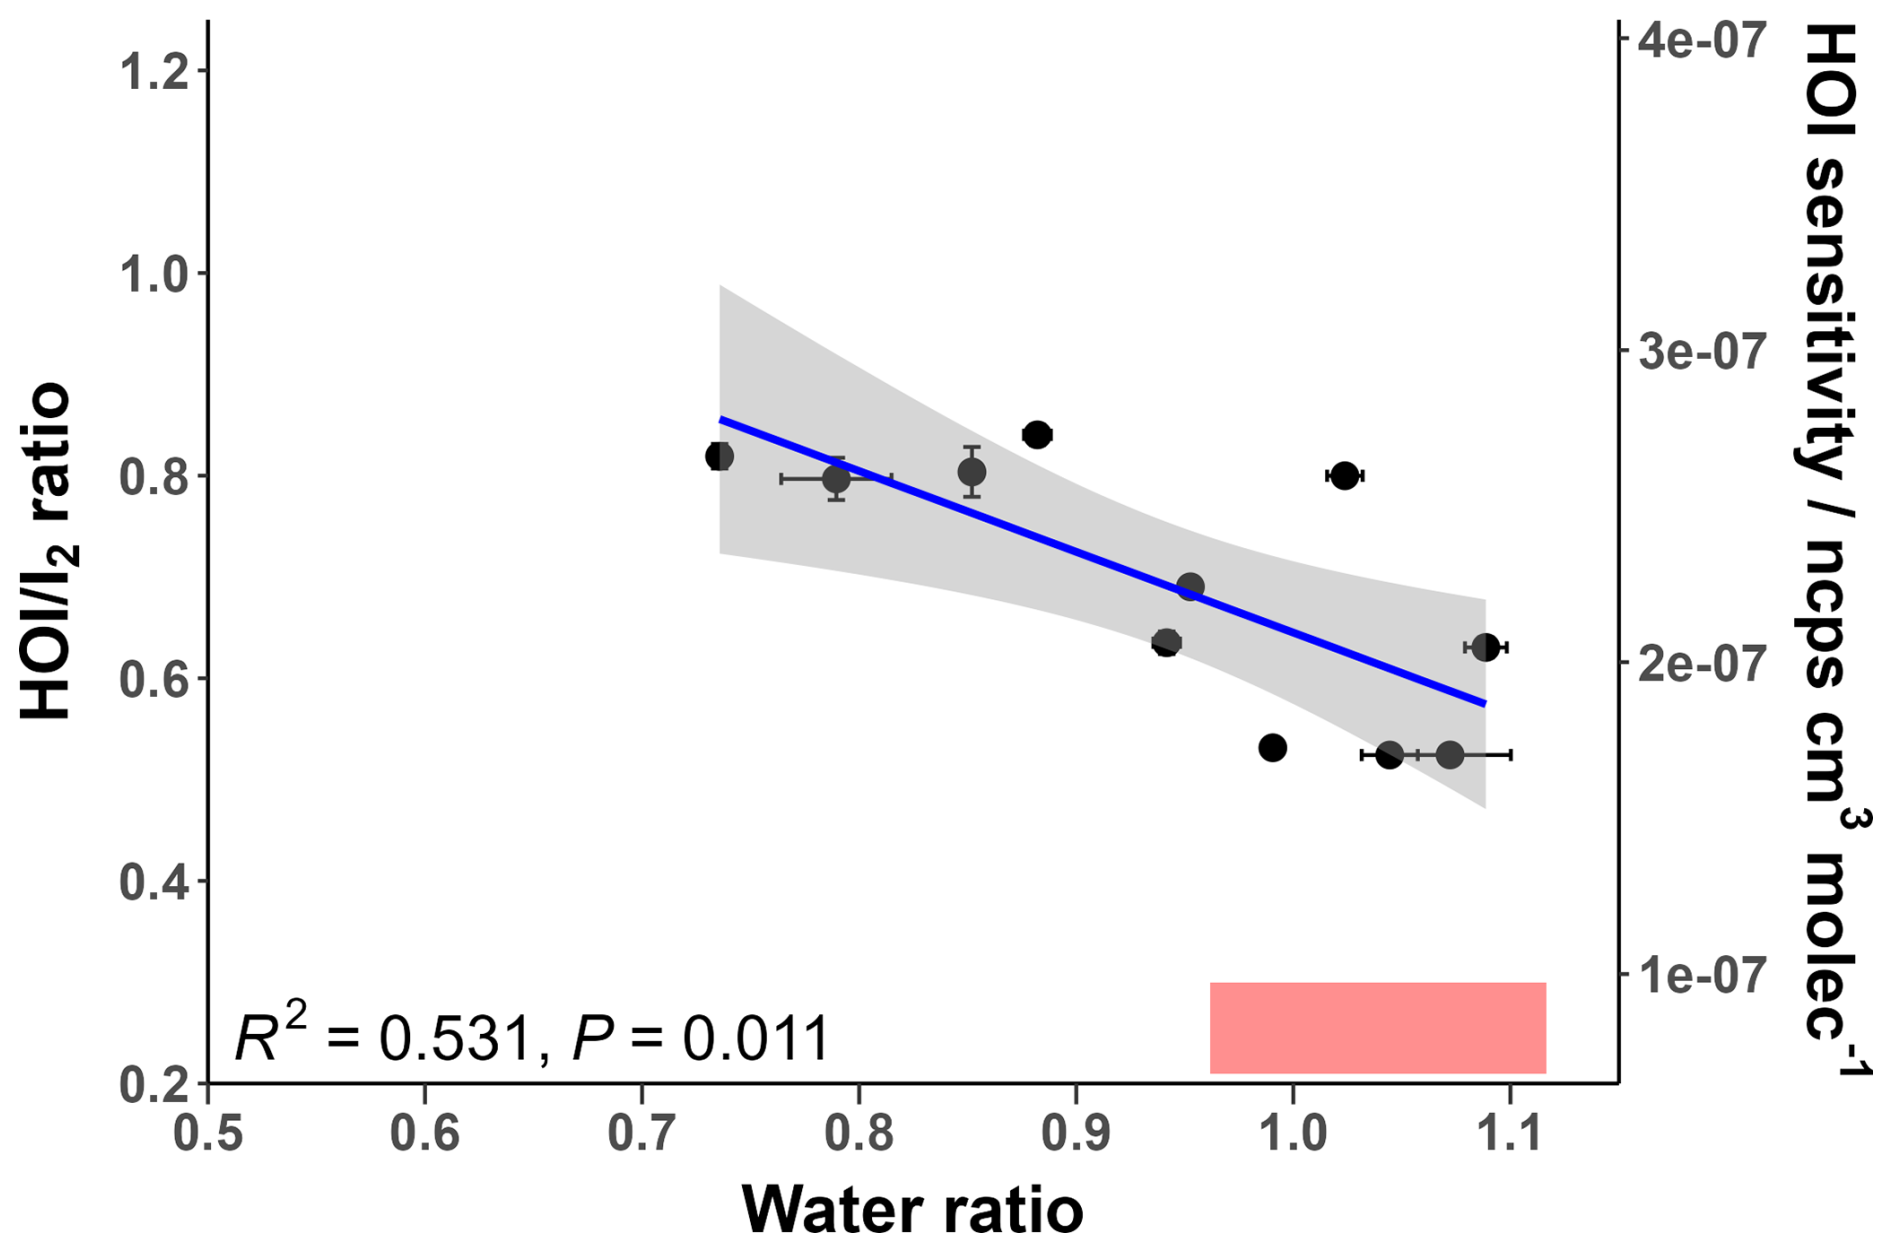
Figure 9The relative sensitivity of HOI compared to I2 ( ratio) at different water ratio values. The regression line follows the equation . The secondary y-axis shows the corresponding HOI sensitivity compared to the ratio. The shaded grey area represents the 95 % confidence interval of the fitted regression line. The shaded red region represents the ambient water ratio observed in the marine boundary layer at Tudor Hill, Bermuda.
Figure 9 shows that the ratio moderately correlates with increasing humidity; the correlation is statistically significant with a P-value below 0.05. As the humidity dependence of I2 is independent over this measurement range, this decrease is attributed to a decreasing sensitivity for HOI. This can be explained from a QRRK theory standpoint. As seen in Table 1, the HOIBr− cluster has more accessible vibrational modes than I2Br−, so the increase in vibrational modes from the presence of water will have a smaller stabilising effect for HOIBr− than for I2Br−. Additionally, the formation enthalpy for the HOIBr− cluster is lower than for I2Br−, and so the effect of reducing the amount of formation via the dry reagent ion has a more pronounced effect on the HOIBr− cluster.
3.5 Sensitivity measurement uncertainty
Propagation of error was used to calculate the uncertainty of the I2 and HOI sensitivities. This can be calculated using the exact formula of propagation, assuming that variables are independent of each other, as shown in Eq. (4).
where a, b, c,..., n are the variables of the function x, is the partial derivative of the variable with respect to x, and σn is the error of the individual variable.
3.5.1 I2
The I2 concentration error was calculated from the propagation of the uncertainties of the emission of the I2 permeation tube, the temperature of the permeation tube holder, and the total gas flow from the sample pump to give a relative error of 0.7 %. The uncertainty of the sensitivity from a specific humidity calibration was calculated from the propagated uncertainty of the I2 concentration and the instrument signal for each point in the calibration curve, as shown in Fig. 5. The uncertainties of the sensitivities in the humidity independent region can be averaged using Eq. (5) as these can be considered as repeats.
where σi is the uncertainty of a particular sensitivity measurement and n is the number of measurements made in the humidity independent region.
This resulted in a sensitivity uncertainty of ncps cm3 molecules−1 for the humidity-independent region, corresponding to a relative error of 1.9 %. This was repeated for the dry calibration sensitivities to produce an uncertainty of ncps cm3 molecules−1 which represents a relative error of 4.0 %. This uncertainty encompasses both calibration and humidity-dependence uncertainties, but not background (zero) or inlet effects (see Sect. 3.6).
3.5.2 HOI
The sensitivity of HOI was determined relative to I2 based on the linear model in Fig. 9. The uncertainty of the HOI sensitivity at a specific water ratio was found from the uncertainty of the I2 sensitivity at that water ratio propagated with the uncertainty of the gradient and intercept of the linear model. This results in an uncertainty of ncps cm3 molecules−1 for the HOI sensitivity, corresponding to an average relative error of 19.8 % with a range of 16 %–25 %, neglecting any background and inlet effects.
3.6 Inlet loss considerations
Measuring gas-phase compounds through an instrument inlet will introduce gas-wall interactions that can lead to loss of signal or require conditioning to reach a steady state (Krechmer et al., 2016; Huang et al., 2018; Deming et al., 2019). Additionally, halogen compounds can undergo heterogeneous chemistry on inlet walls, resulting in conversion to other halogen compounds. This is particularly the case for the hypohalous acids and has been observed for HOBr and HOCl when measured by CIMS instruments (Neuman et al., 2010; Liao et al., 2014; Le Breton et al., 2017; Peng et al., 2022). While all halogen compounds experience these wall interactions, it is particularly pronounced for iodine compounds, leading to large losses and uncertainties in measurements. Previous measurements of I2 have found sample line losses between 18 %–40 % (Shaw and Carpenter, 2013; Carpenter et al., 2013). For HOI, the calibration performed by Tham et al. (2021) modelled the loss of HOI through their inlet system via diffusion to the inlet walls which contributed to their total HOI uncertainty of ± 55 %.
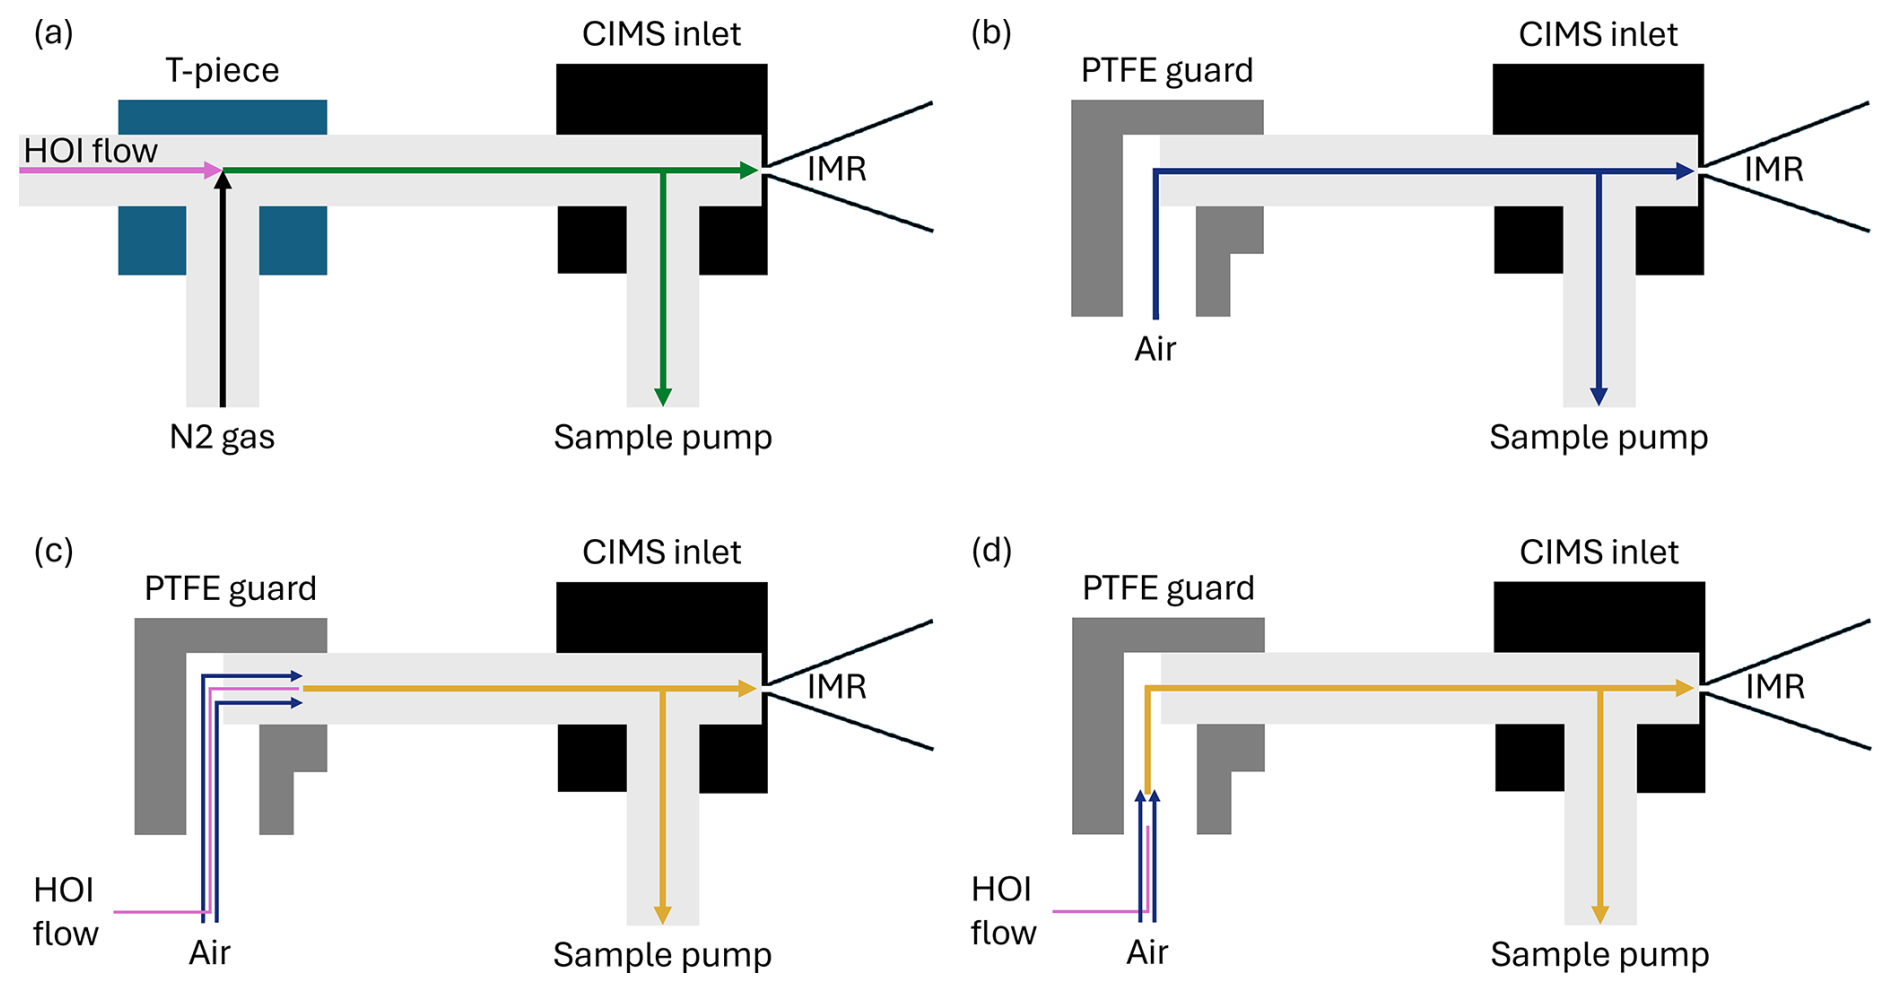
Figure 10Simplified diagrams of the CIMS inlet setup during (a) the HOI calibration experiments, (b) sampling of air at Tudor Hill in Bermuda, (c) the line loss experiment bypassing the PTFE guard bend, (d) the line loss experiment including the bend from the PTFE guard.
The effect of inlet losses is heavily influenced by the instrument setup. This means that any differences in inlet configuration between calibrations and field measurements need to be accounted for. When deployed in the field, the inlet for this instrument had a PTFE guard, allowing sample air to enter the inlet at a 90° angle, shown in Fig. 10b. The guard was implemented with the intention that light gas-phase molecules could navigate around the bend without loss to the walls, but heavier aerosol particles could not, reducing the potential for aerosol to block the entrance to the CIMS instrument. However, when calibrating, the calibration gas was directed linearly into the sampling inlet, shown in Fig. 10a. The effect of this difference was investigated.
Two inlet loss experiments were performed, one using a PFA T-piece to investigate the effect of physically having a bend in place, and another with the PTFE guard that had been salted with sea water to mimic field conditions. A line of PFA tubing was attached to the output of the HOI calibration system and held in two configurations: one where it is pushed past the bend as shown in Fig. 10c and one where it is held before it, Fig. 10d. This required altering the dilution flow to laboratory air to accommodate this configuration. The effect of the T-piece and PTFE guard on the normalised signal of HOI and I2, along with other iodine compounds that are potentially present, are shown in Table 2.
Table 2The normalised signal ± 1 standard deviation of various iodine species measured during the direct and bended inlet configurations for the T-piece and PTFE guard inlet loss experiments.
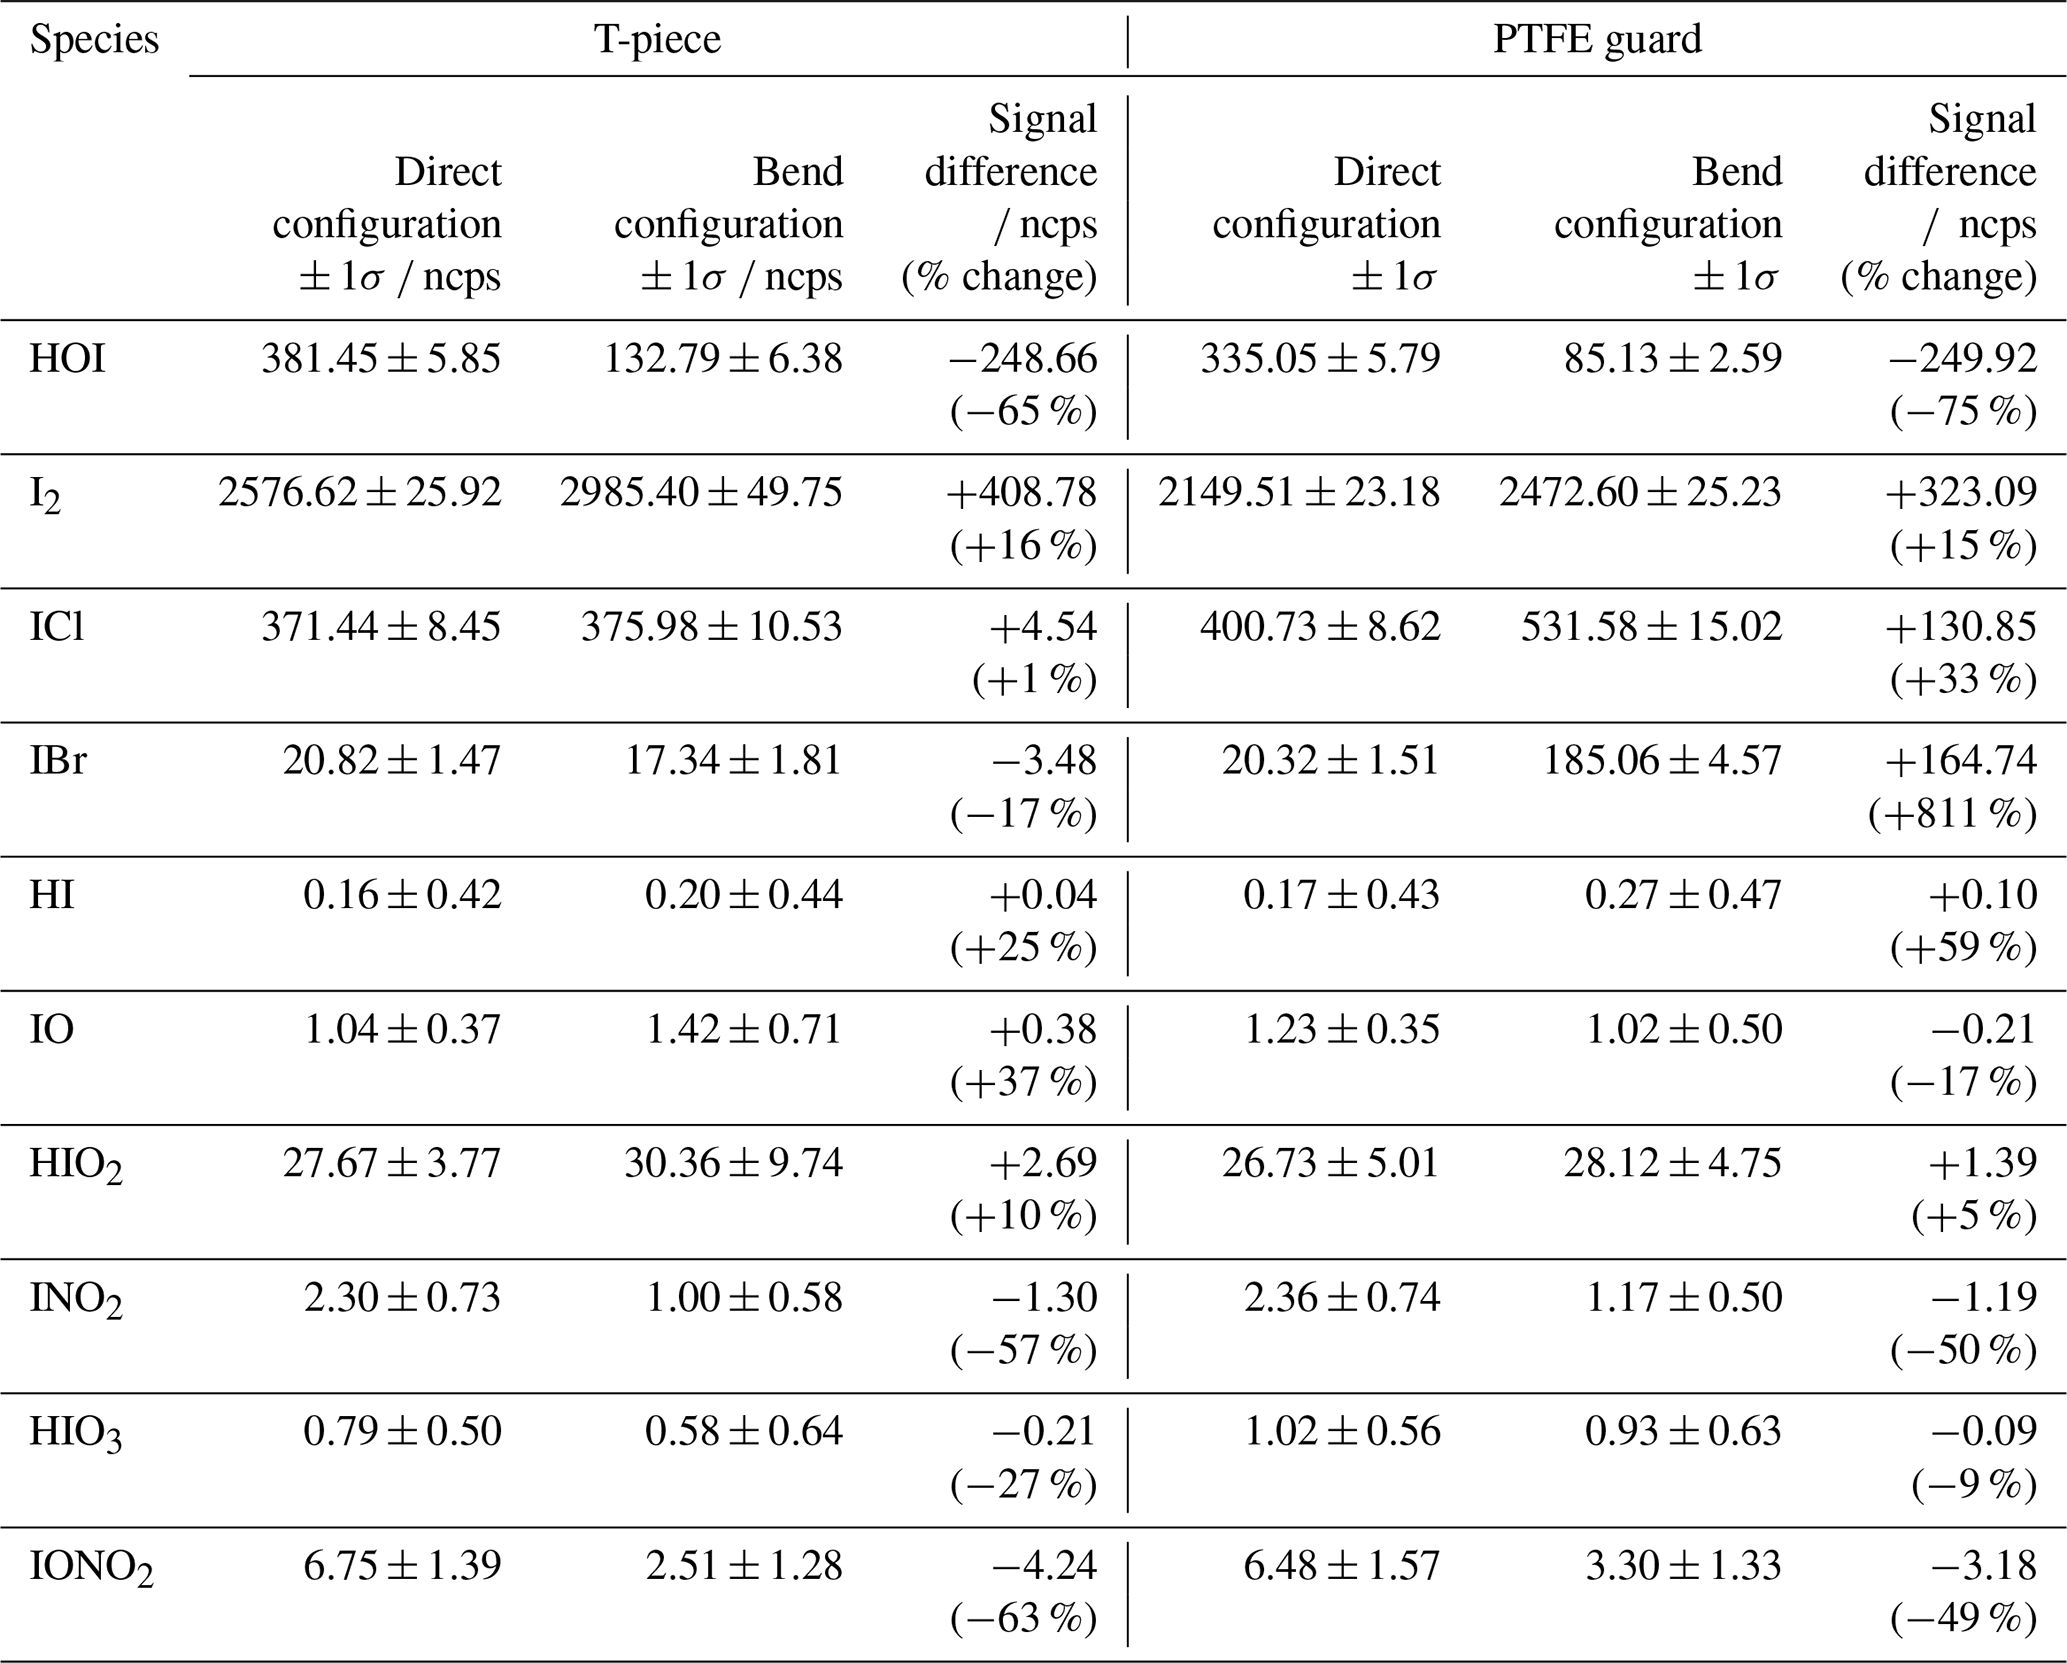
For both the T-piece and the guard, the direct signal is comparable in intensity to the signal seen during the HOI calibrations, with the exception of ICl, which is much higher than previously seen. When including the bend into the T-piece experiment, little variation in signal is observed for ICl, HI, IO, HIO2, and HIO3, with changes smaller than the standard deviation of the signal. There is a slight decrease in the IBr, INO2, and IONO2 signal, but the total quantity of loss from these compounds is small compared to the total loss (<4 %) The most noticeable loss is observed with HOI, along with an accompanying increase in I2. When converted into mixing ratios this corresponded to a 42.7 ppt (65 %) HOI decrease and a 50.5 ppt (16 %) increase in I2. This conversion of HOI to I2 likely proceeds via the reverse iodine hydrolysis reaction (Reaction R14). The I− required is most likely from the HOI generation reaction in (Reaction R8), which becomes coated on the inlet walls. It is unknown how much I− is present during field measurements, and so the observed I2 increase found during the inlet loss tests may be an overestimate compared to atmospheric conditions.
With the salted PTFE guard, a higher proportion of HOI was lost (75 % decrease) compared to the T-piece although the amount lost was similar at 43.4 ppt. Meanwhile the proportion of I2 gain remained about the same (15 % increase) but the amount has decreased to 40.0 ppt. There is a marked increase in IBr and ICl signal and the other iodine species remain at similar levels to the T-piece run. Cl− and Br− are abundant in sea salt aerosol and are known to react with HOI (Vogt et al., 1999; Braban et al., 2007; Tham et al., 2021), which is the likely reason for the increase in ICl and IBr and further loss of HOI compared to the T-piece experiment. The sensitivities for ICl and IBr have not been measured for Br-CIMS instruments. However, it has been suggested that sensitivities should be similar to that of I2 (Wang et al., 2021a). If it is assumed that ICl and IBr have the same response to humidity as I2, the signal change would correspond to a 16.9 and 20.2 ppt increase, respectively. This is far higher than would be expected from the additional HOI loss and may suggest there are additional pathways present to produce ICl and IBr.
3.7 Application to atmospheric HOI and I2 data
I2 and HOI were measured by the Br-CIMS during the BLEACH campaign in June 2022 with the inlet configuration shown in Fig. 10b. Background signals were measured by flowing dry nitrogen (N2) through a zero port in the CIMS inlet and through the instrument critical orifice to the IMR, with the rest of the sampled air directed through the sample pump. These zero measurements were repeated hourly, and the signal was linearly interpolated between measurements, providing a value for the background signal during sampling periods. The limit of detection (LoD) for I2 and HOI were calculated from an extended zeroing period during the campaign as 3 standard deviations of the Allen variance of the zeroing period, similarly to that described in Riva et al. (2024). These corresponded to detection limits of 0.14 ppt for I2 and 0.27 ppt for HOI.
The HOI calibration could not be performed at dryness, making zero subtraction difficult to quantify. The ratio from Fig. 9 could be extrapolated to dryness at the y-intercept which would result in a dry HOI sensitivity that is 1.44 times higher than I2. However, the 95 % confidence interval of the intercept is ± 0.43, suggesting a low precision when extrapolating from this calibration. An alternative method is to use the quantum chemical calculations to compare the decay rate between the HOIBr− and I2Br− clusters. Using the values from Table 1, the decay rate of HOIBr− is slightly slower than I2Br−, which would suggest a slightly higher sensitivity at dryness. However, this value is still similar to the decay rate of I2Br−, and so the dry sensitivity of I2 could be used as a conservative estimate of the dry HOI sensitivity.
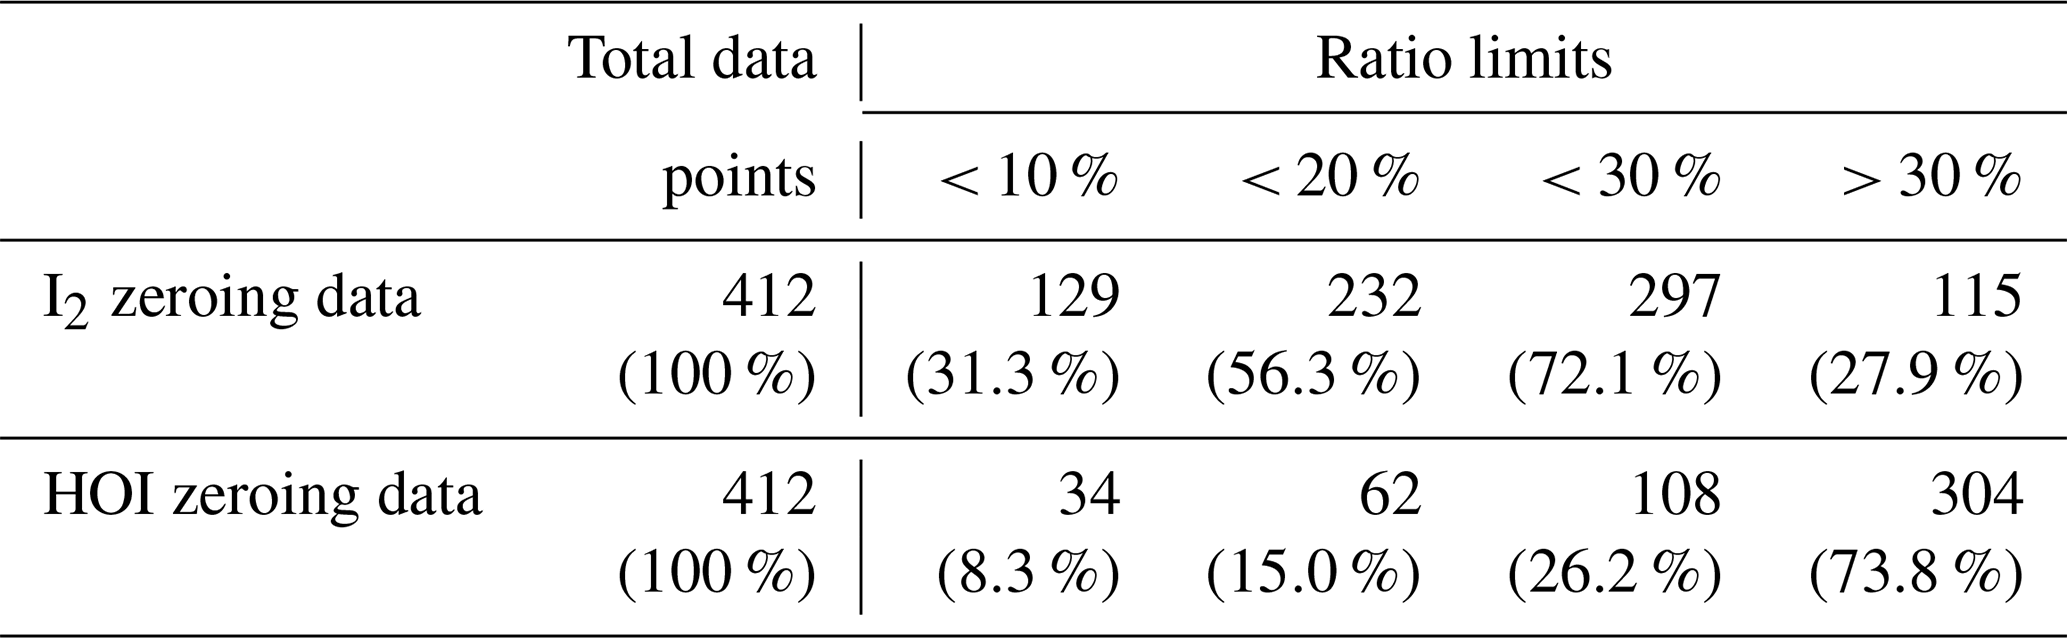
It is also possible that any signal observed in the zero for HOI and I2 was due to instrument noise rather than any interferent compounds. This was tested by comparing the relative signal intensities of two major isotope peaks of the I2Br− and HOIBr− adducts. The theoretical ratios between I279Br− and I281Br− and HOI79Br− and HOI81Br− are 1:0.975 and 1:0.977, respectively. The zero data was tested to see whether the ratio between the isotope peaks were within 10, 20 or 30 % of this ratio. These values are shown in Table 3. For I2, 72 % of the zero data fell within the 30 % ratio limit, suggesting that the signal is generally real and needs to be accounted for by zero subtraction. For HOI, 74 % of the zero data had isotope ratios that were greater than the 30 % tolerance, indicating that the signal generally may not be real. Both the sample and zero timeseries for HOI and I2 are shown in Fig. A5. The sample timeseries, without zero subtraction, can be considered as an upper limit of the HOI and I2 mixing ratios.
Table 3The instrument zero data points during the BLEACH campaign that fell within various limits of the theoretical isotope ratio between the I2Br− and HOIBr− adduct signals. A ratio value that was greater than 30 % of the theoretical value was considered to be outside the ratio tolerance.
Measured signals were converted into mixing ratios using the calibrations from Sect. 3.3 and 3.4 and applying the loss corrections described in Sect. 3.5. The data was then zero subtracted using the linearly interpolated instrument zeros. Figure 11 shows the loss-corrected timeseries and diurnal cycles for I2 and HOI. After zero subtractions and loss corrections, I2 was detected between 0–0.7 ppt with some mixing ratios dropping to negative values. HOI ranged from 0.2–6.0 ppt after its zero subtractions and loss corrections. There was little pattern in the diurnal cycle for I2 with the average signal being between 0.1–0.3 ppt during both the day and night. The observed mixing ratios of I2 are similar to previous open ocean measurements at the Cape Verde Atmospheric Observatory of <0.02–0.6 and <0.03–1.67 ppt in May 2007 and 2009 respectively (Lawler et al., 2014). These previous measurements observed a diurnal cycle for I2 peaking at night, as expected due to its rapid photolysis. A diurnal cycle was not observed in our data, indicating either inlet or background effects which were not adequately quantified by our experiments or an unknown or poorly quantified daytime source of I2. Potential daytime sources include heterogeneous reactions of photochemically produced oxidants such as HOI with iodide on the surface of aerosols (Vogt et al., 1999; Moon et al., 2026) or on the sea surface (Pound et al., 2024), photochemical oxidation of iodide (Raso et al., 2017) or photochemical reduction of iodate (Reza et al., 2024). However, these would have to be occurring close to the measurement site due to the fast photolytic lifetime of I2. Additionally, the release of I2 from aerosol is also a likely contributor to the inlet effects, due to buildup of aerosol on the inlet. With the inlet setup used in this work, these processes are indistinguishable. The overall uncertainty of the I2 measurements made during the BLEACH campaign, as seen in Sect. 3.7.1, and the fact that they were near to the detection limit of 0.14 ppt means that caution should be applied in interpreting the data.
In contrast, a regular diurnal pattern was observed for HOI, with the signal consistently around 1 ppt during the night and increasing during the day to an average peak of around 3 ppt. There are no reported mixing ratios of HOI in the open ocean to compare to these values. The closest comparison is to the measurement of HOI at the coastal site of Mace Head (Tham et al., 2021). There, a diurnal cycle was also observed, with low nighttime mixing ratios and an increase during the day. However, the amounts seen at Mace Head during the day were much higher (up to 66.6 ppt), likely due to photochemical reactions caused by I2 emission by macroalgae (Tham et al., 2021).
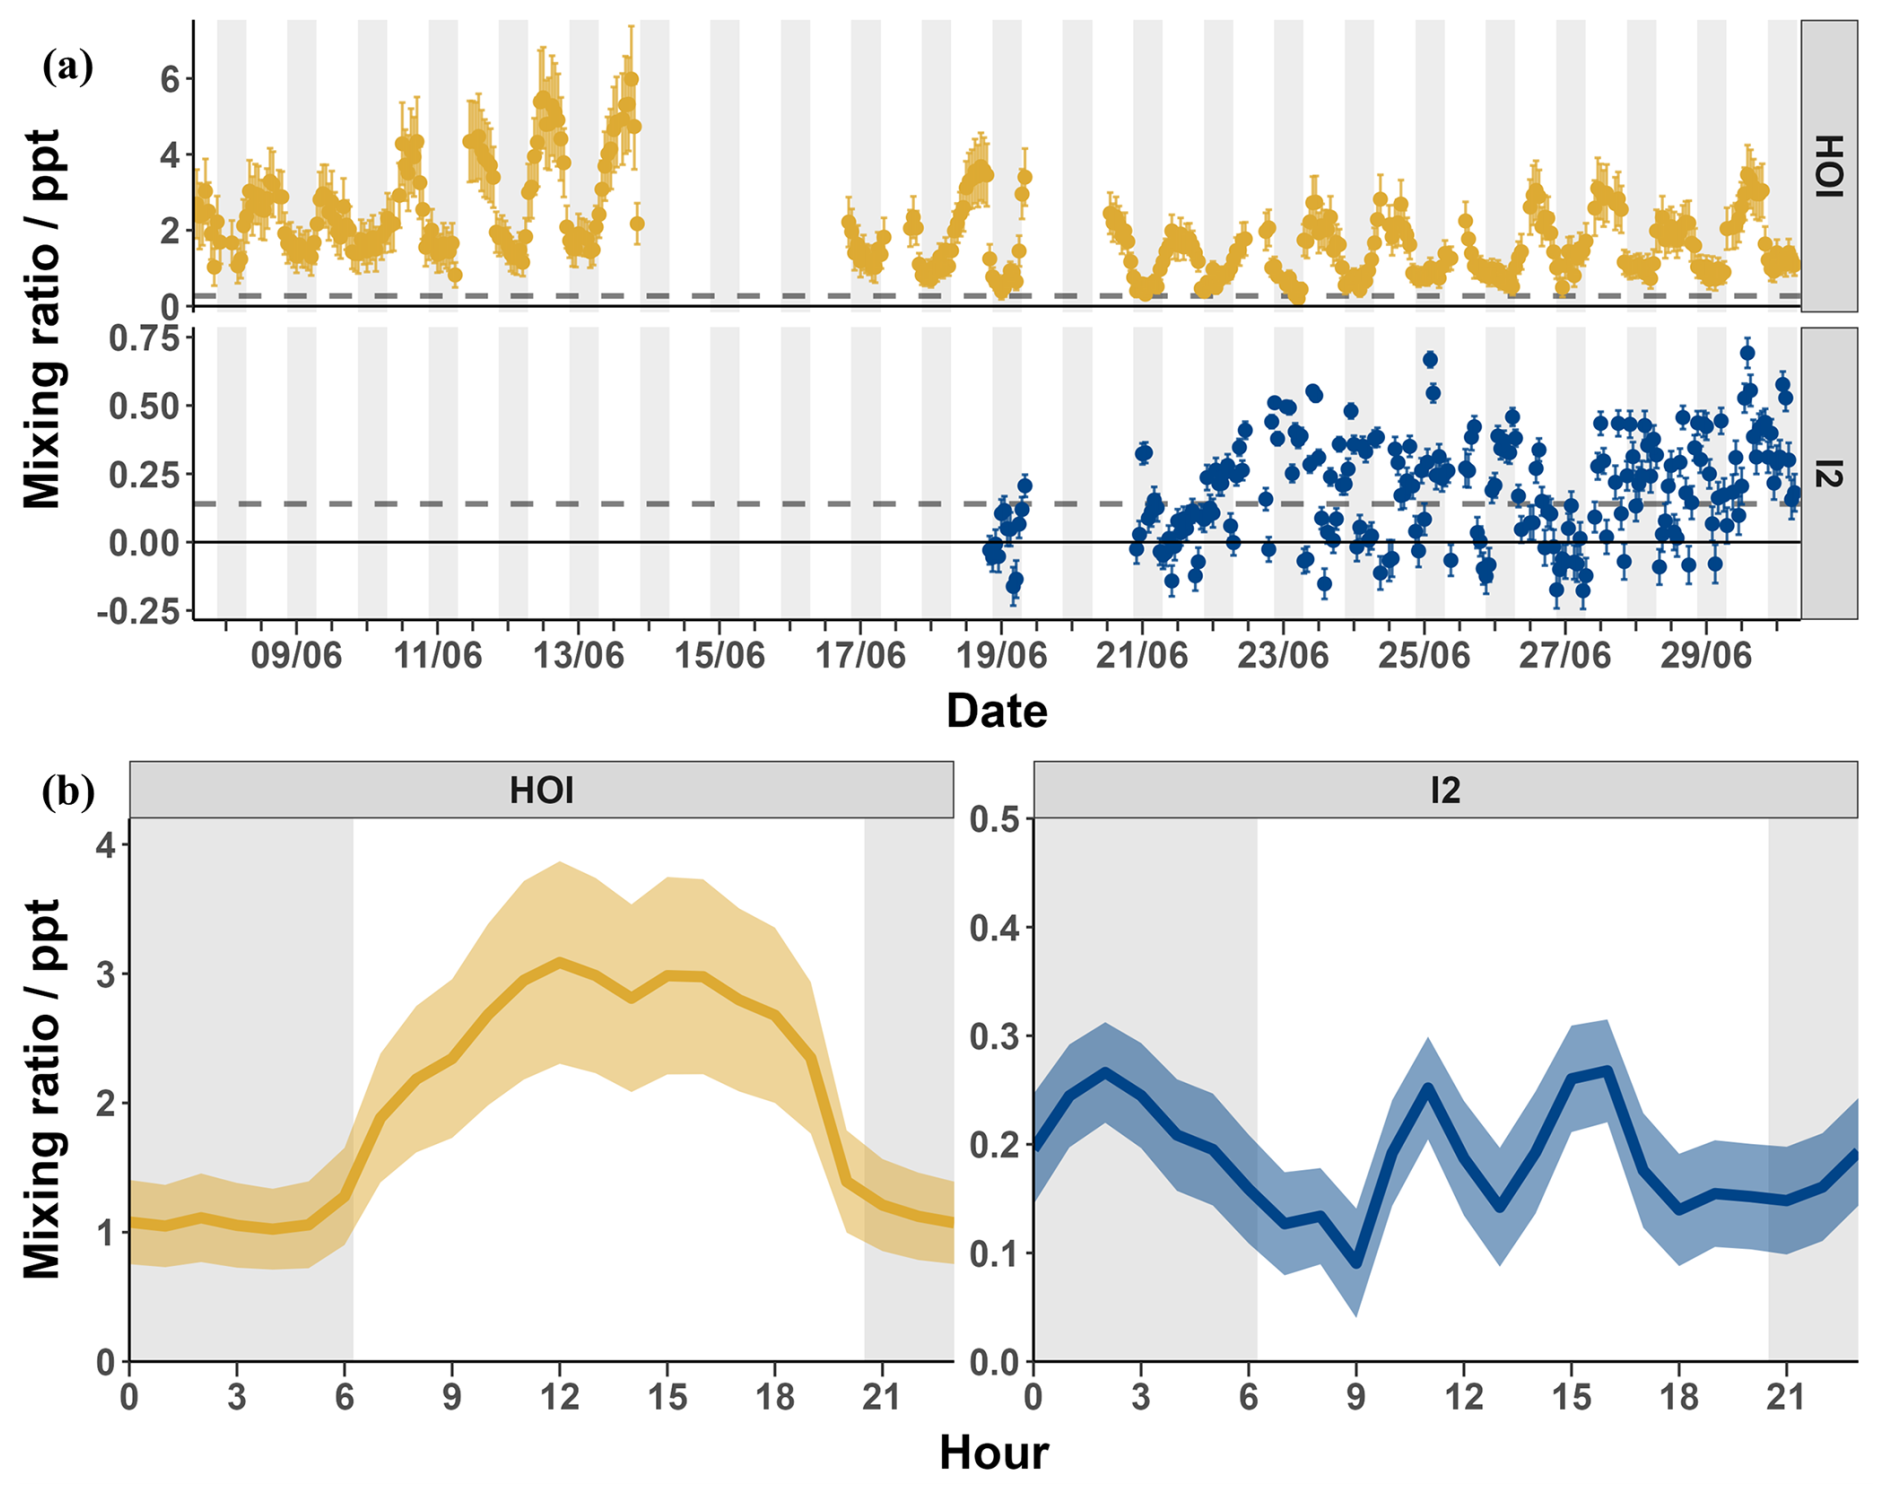
Figure 11The timeseries (a) and diurnal cycle (b) of the mixing ratios of I2 (blue) and HOI (yellow) from the BLEACH campaign in June 2022 after zero subtraction and loss correction. The dashed line indicates the limit of detection for each compound. The average relative uncertainty of I2 was ± 28.7 % and for HOI was ± 27.7 %.
3.7.1 Measurement uncertainties of atmospheric data
The uncertainty of the I2 and HOI mixing ratios were again calculated by propagation of uncertainty. This was calculated from the uncertainty of the humidity independent sensitivity, twice the uncertainty of the dry sensitivity from the linear interpolation calculation, and the uncertainty of the instrument signal during the inlet loss experiment. This resulted in an average relative error throughout the BLEACH campaign of 28.7 % for I2 and 27.7 % for HOI. There are a number of other uncertainties from the inlet loss experiment that cannot be quantified and so the uncertainty for I2 and HOI should be considered a lower limit. In future work, repeated experiments may be able to account for these uncertainties by finding a standard deviation of the loss correction value.
There have been few atmospheric measurements of HOI and I2 due to the requirement of highly sensitive and selective instrumentation and the lack of readily available calibration methods for HOI. In this study, we demonstrate a novel method for the generation and calibration of HOI at ppt levels, utilising its interconversion to I2 via chemical traps. The presence of potential interferent iodine compounds was found to be negligible and the calibration was shown to be repeatable over a range of humidities. The developed calibration method was utilised to ascertain the humidity dependence of the CIMS for HOI and I2. It was found that at humidities typical of the marine boundary layer, I2 exhibited a humidity-independent sensitivity whereas HOI showed a slight negative dependency. A possible explanation, supported by QRRK theory, is that higher humidities increase the proportion of the Br(H2O)− reagent ion, which has a lower adduct formation enthalpy with HOI and I2 compared to the Br− reagent ion, resulting in decreased sensitivities. However, the presence of H2O increases the available vibrational modes of the adduct, improving the energy distribution and stabilisation of the adduct and increasing its sensitivity. This effect is greater for I2Br− as it has fewer harmonic oscillators than HOIBr− and these two opposing factors mean that the sensitivity of I2Br− is humidity independent. However, this stabilisation is not sufficient in the case of the HOIBr− adduct to mitigate the increasing proportion of Br(H2O)− vs. Br− reagent ions, resulting in a decreased sensitivity at high humidities.
Heterogeneous chemistry and inlet wall losses are a perennial problem in the measurement of acidic and reactive species, which can be exacerbated depending on the inlet configuration. When using the inlet configuration made for field measurements, up to 75 % of the HOI signal was lost compared to the calibration setup. This was accompanied by a corresponding increase in I2 signal, suggesting that this loss occurred via the reverse hydrolysis of iodine.
After correcting for humidity sensitivities and inlet losses, we detected I2 and HOI in the marine boundary layer during the BLEACH campaign at Tudor Hill, Bermuda in June 2022 at mixing ratios of between 0–0.7 ppt for I2 and 0.2–6.0 ppt for HOI. The overall uncertainty of these measurements was calculated as ± 28.7 % for I2 and ± 27.7 % for HOI. These uncertainties can be considered as lower limits as there were additional uncertainties from the inlet loss experiment that were not quantifiable.
In future work, the accuracy for I2 and HOI could be improved by performing background measurements at similar humidity levels to the ambient measurements, reducing the need to account for large differences in sensitivities from different humidities. Additionally, further work on the HOI calibration can further constrain the uncertainty of the humidity dependent ratio over a wider range of humidities. Finally, development of atmospheric detection of HOI and I2 should focus on using instrument inlets that can minimise inlet effects for these compounds, reducing the need to perform correction tests. Any correction tests that are performed should be done before, during, and after field measurement collection to best characterise any inlet artifacts and changes during the measurements.
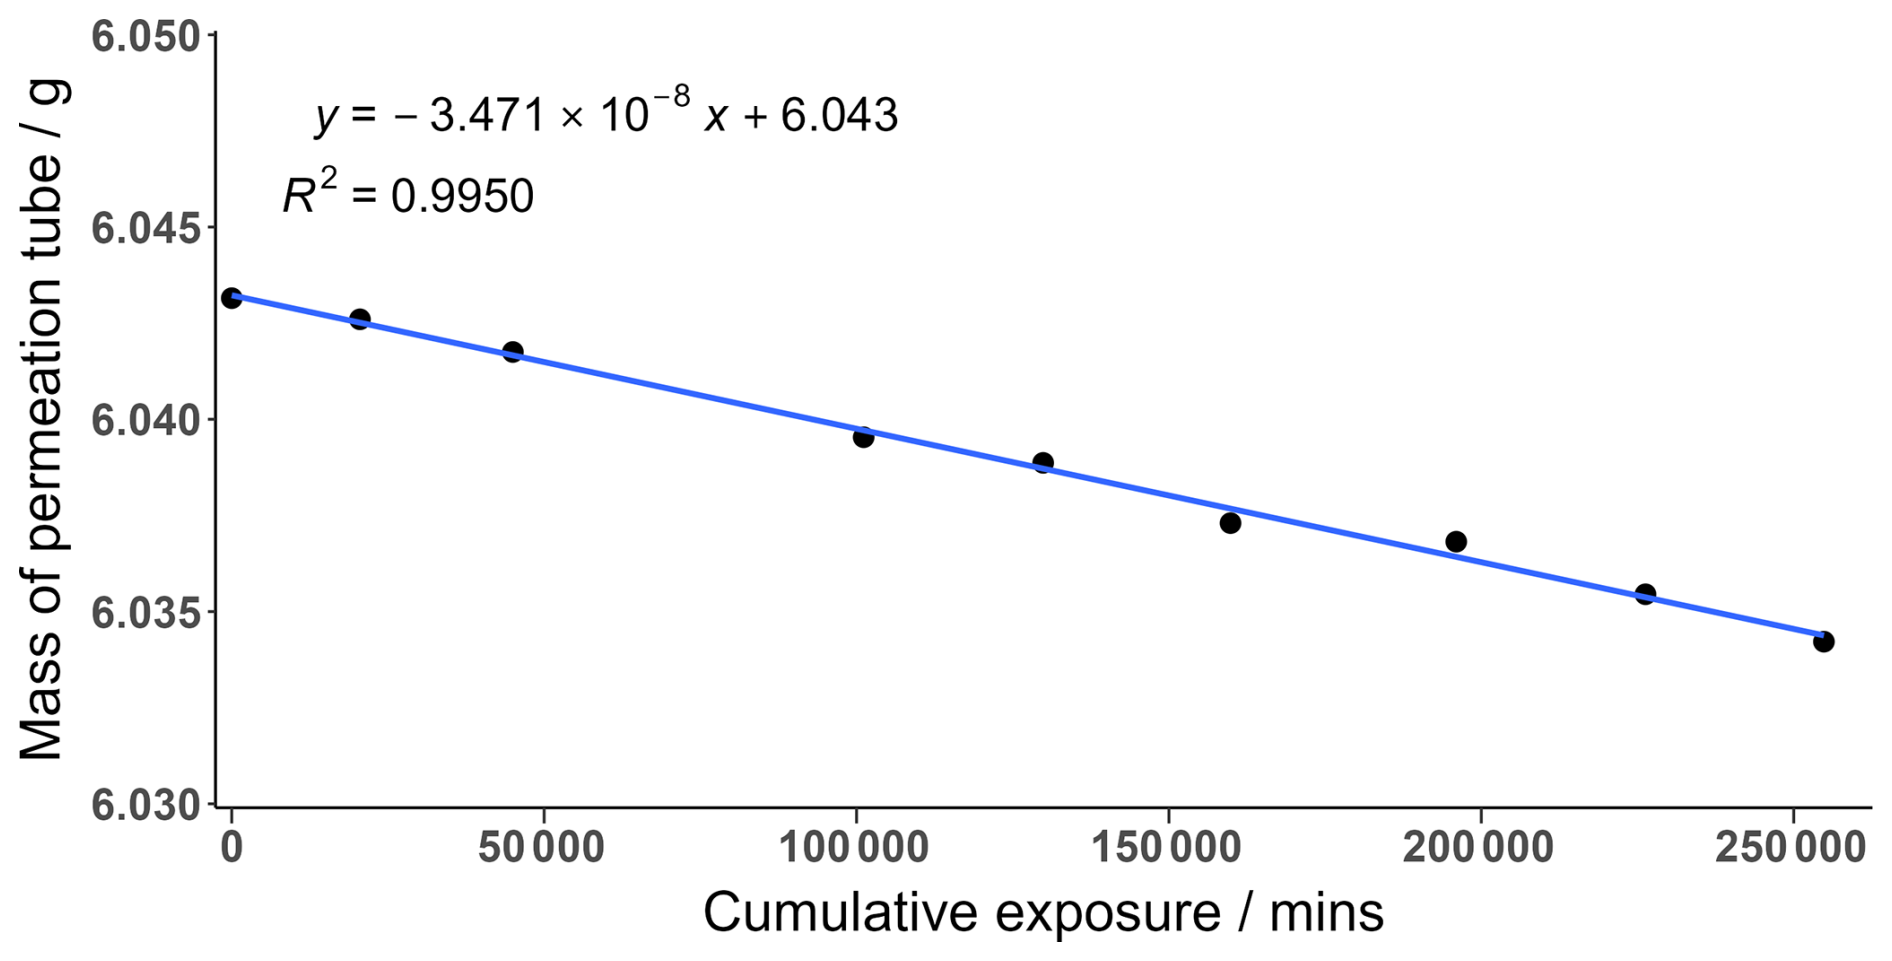
Figure A1The mass loss of an I2 permeation tube over time. The gradient represents the emission rate of the permeation tube. Each data point is the average of 6 measurements.
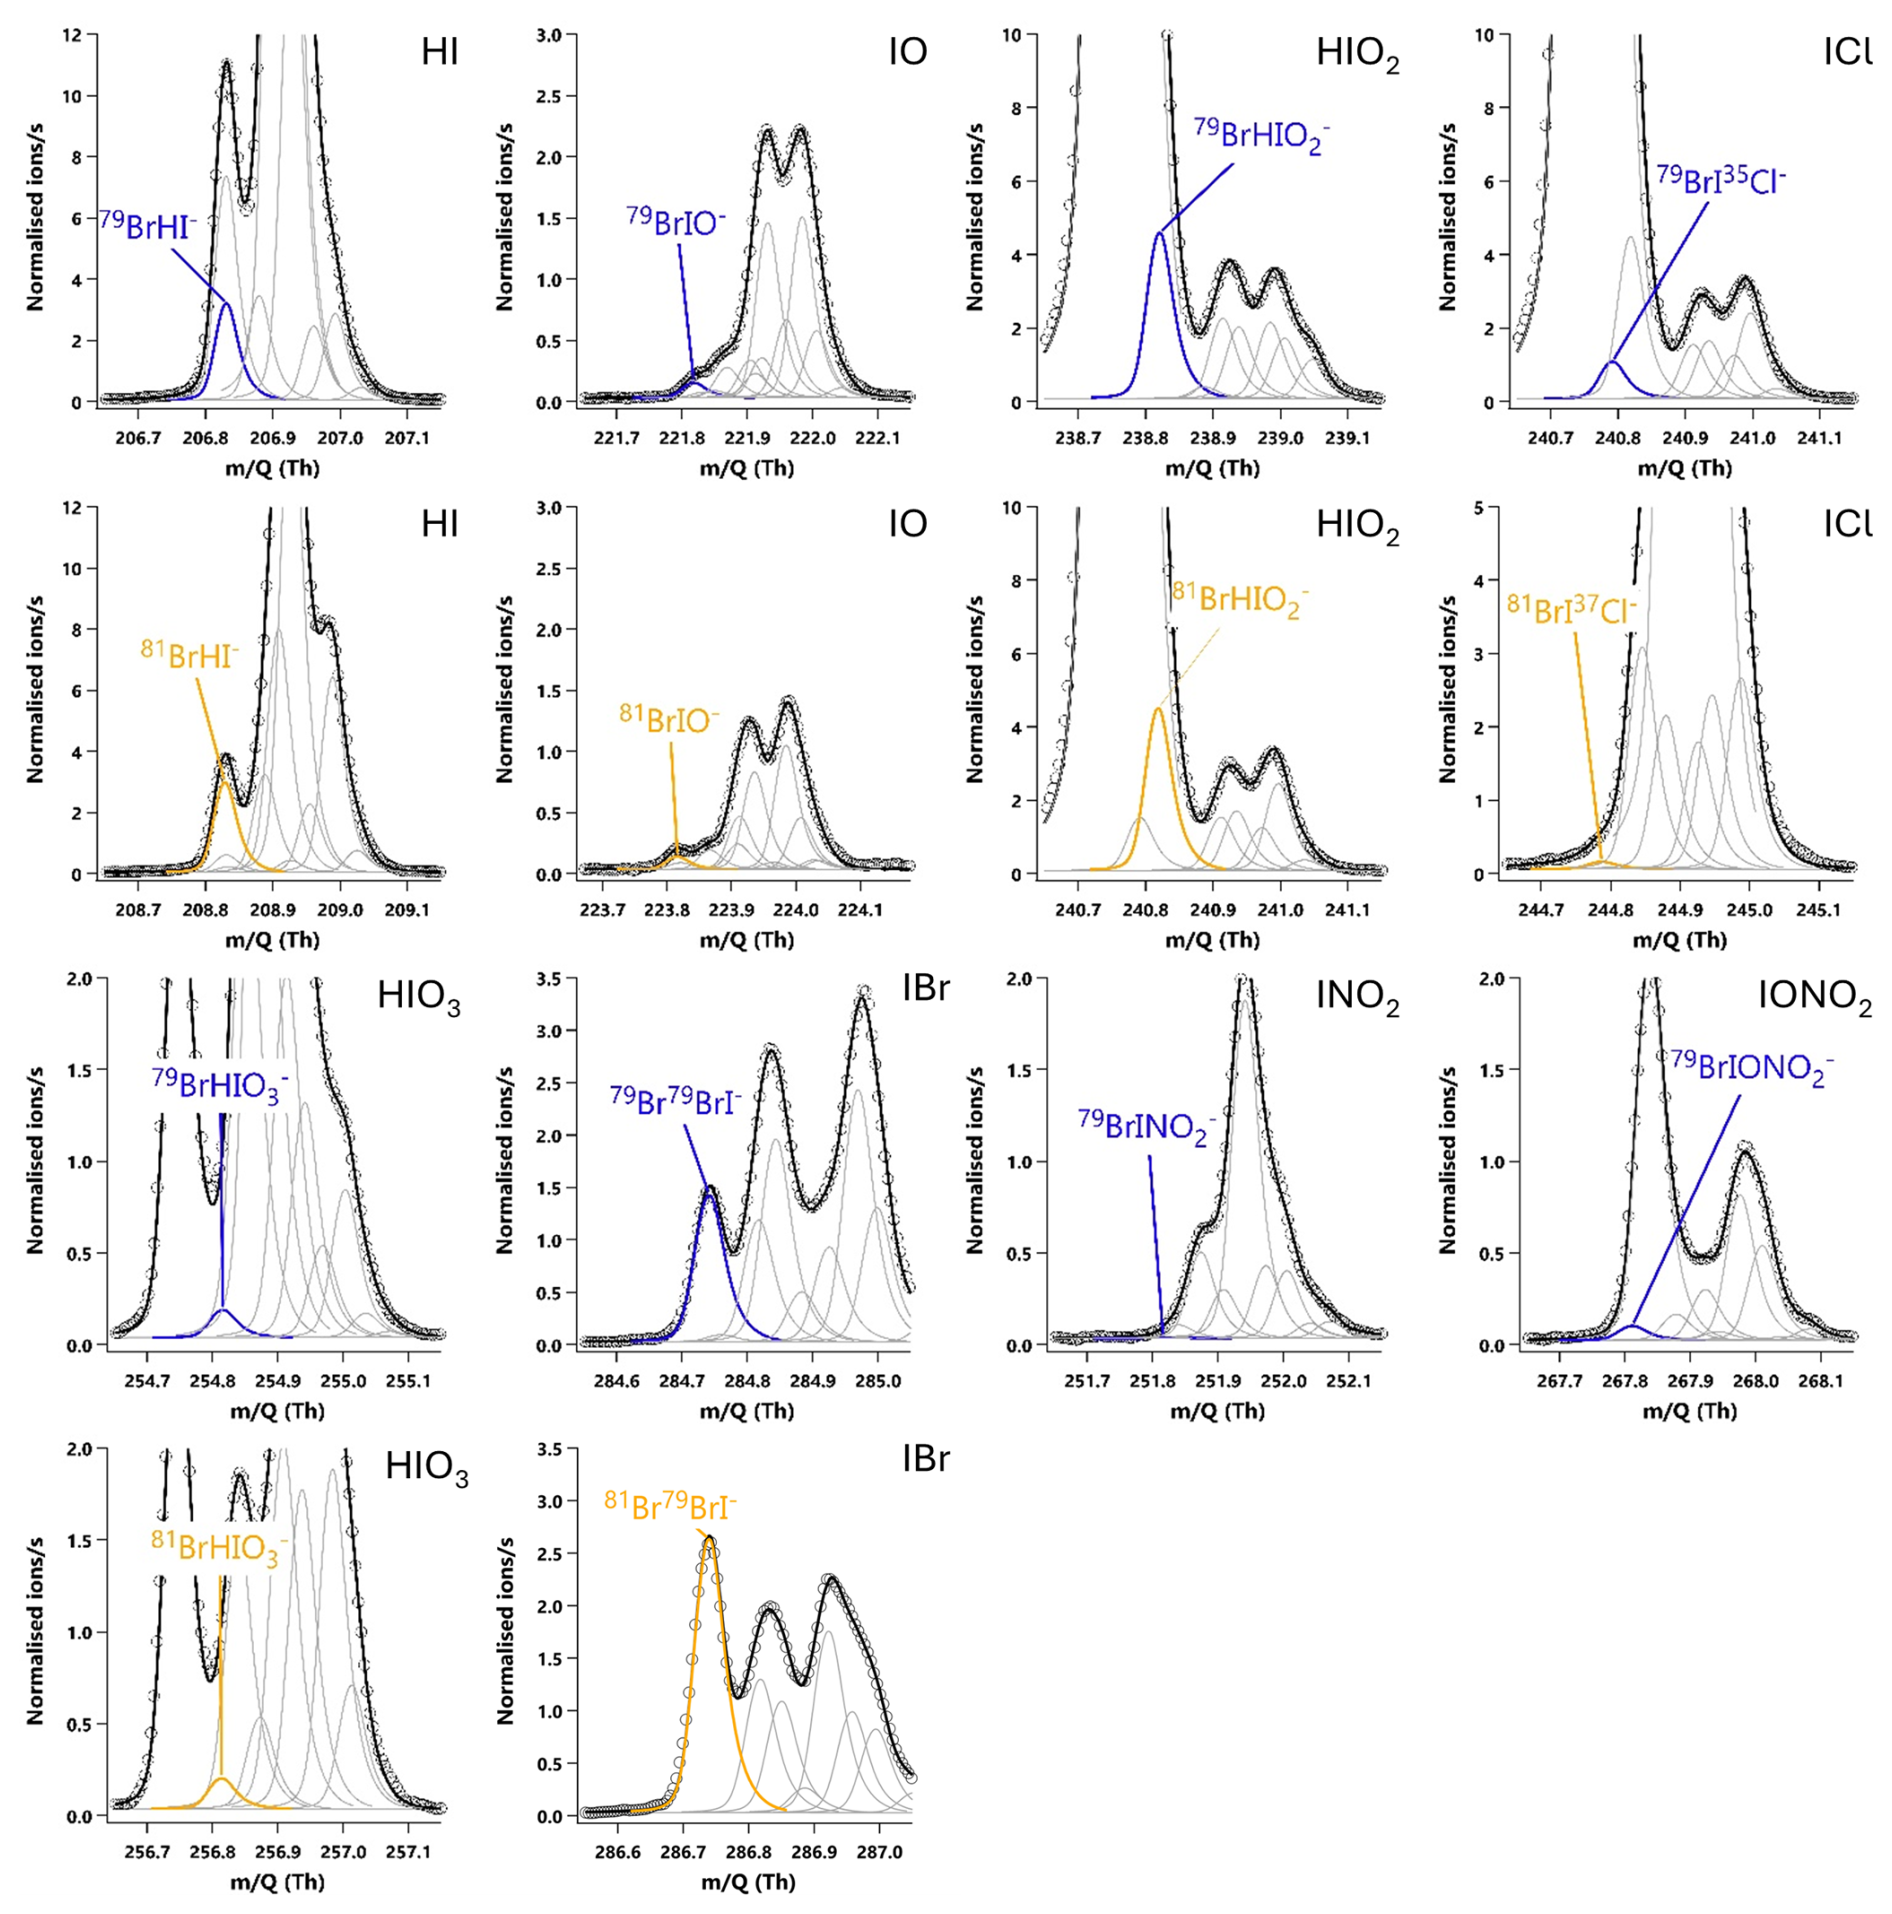
Figure A220 min averaged high resolution single peak mass spectra fits for potential iodine containing compounds during the HOI calibrations with the NaI trap in place. The molecular ion peak is shown in blue with the primary isotope peak in gold with an exception for 81Br37Cl− as this was the isotope used to calculate the BrICl signal. Isotope peak shapes were determined using the Tofware software. The isotope peaks of BrINO and BrIONO were not able to be visualised by the software.
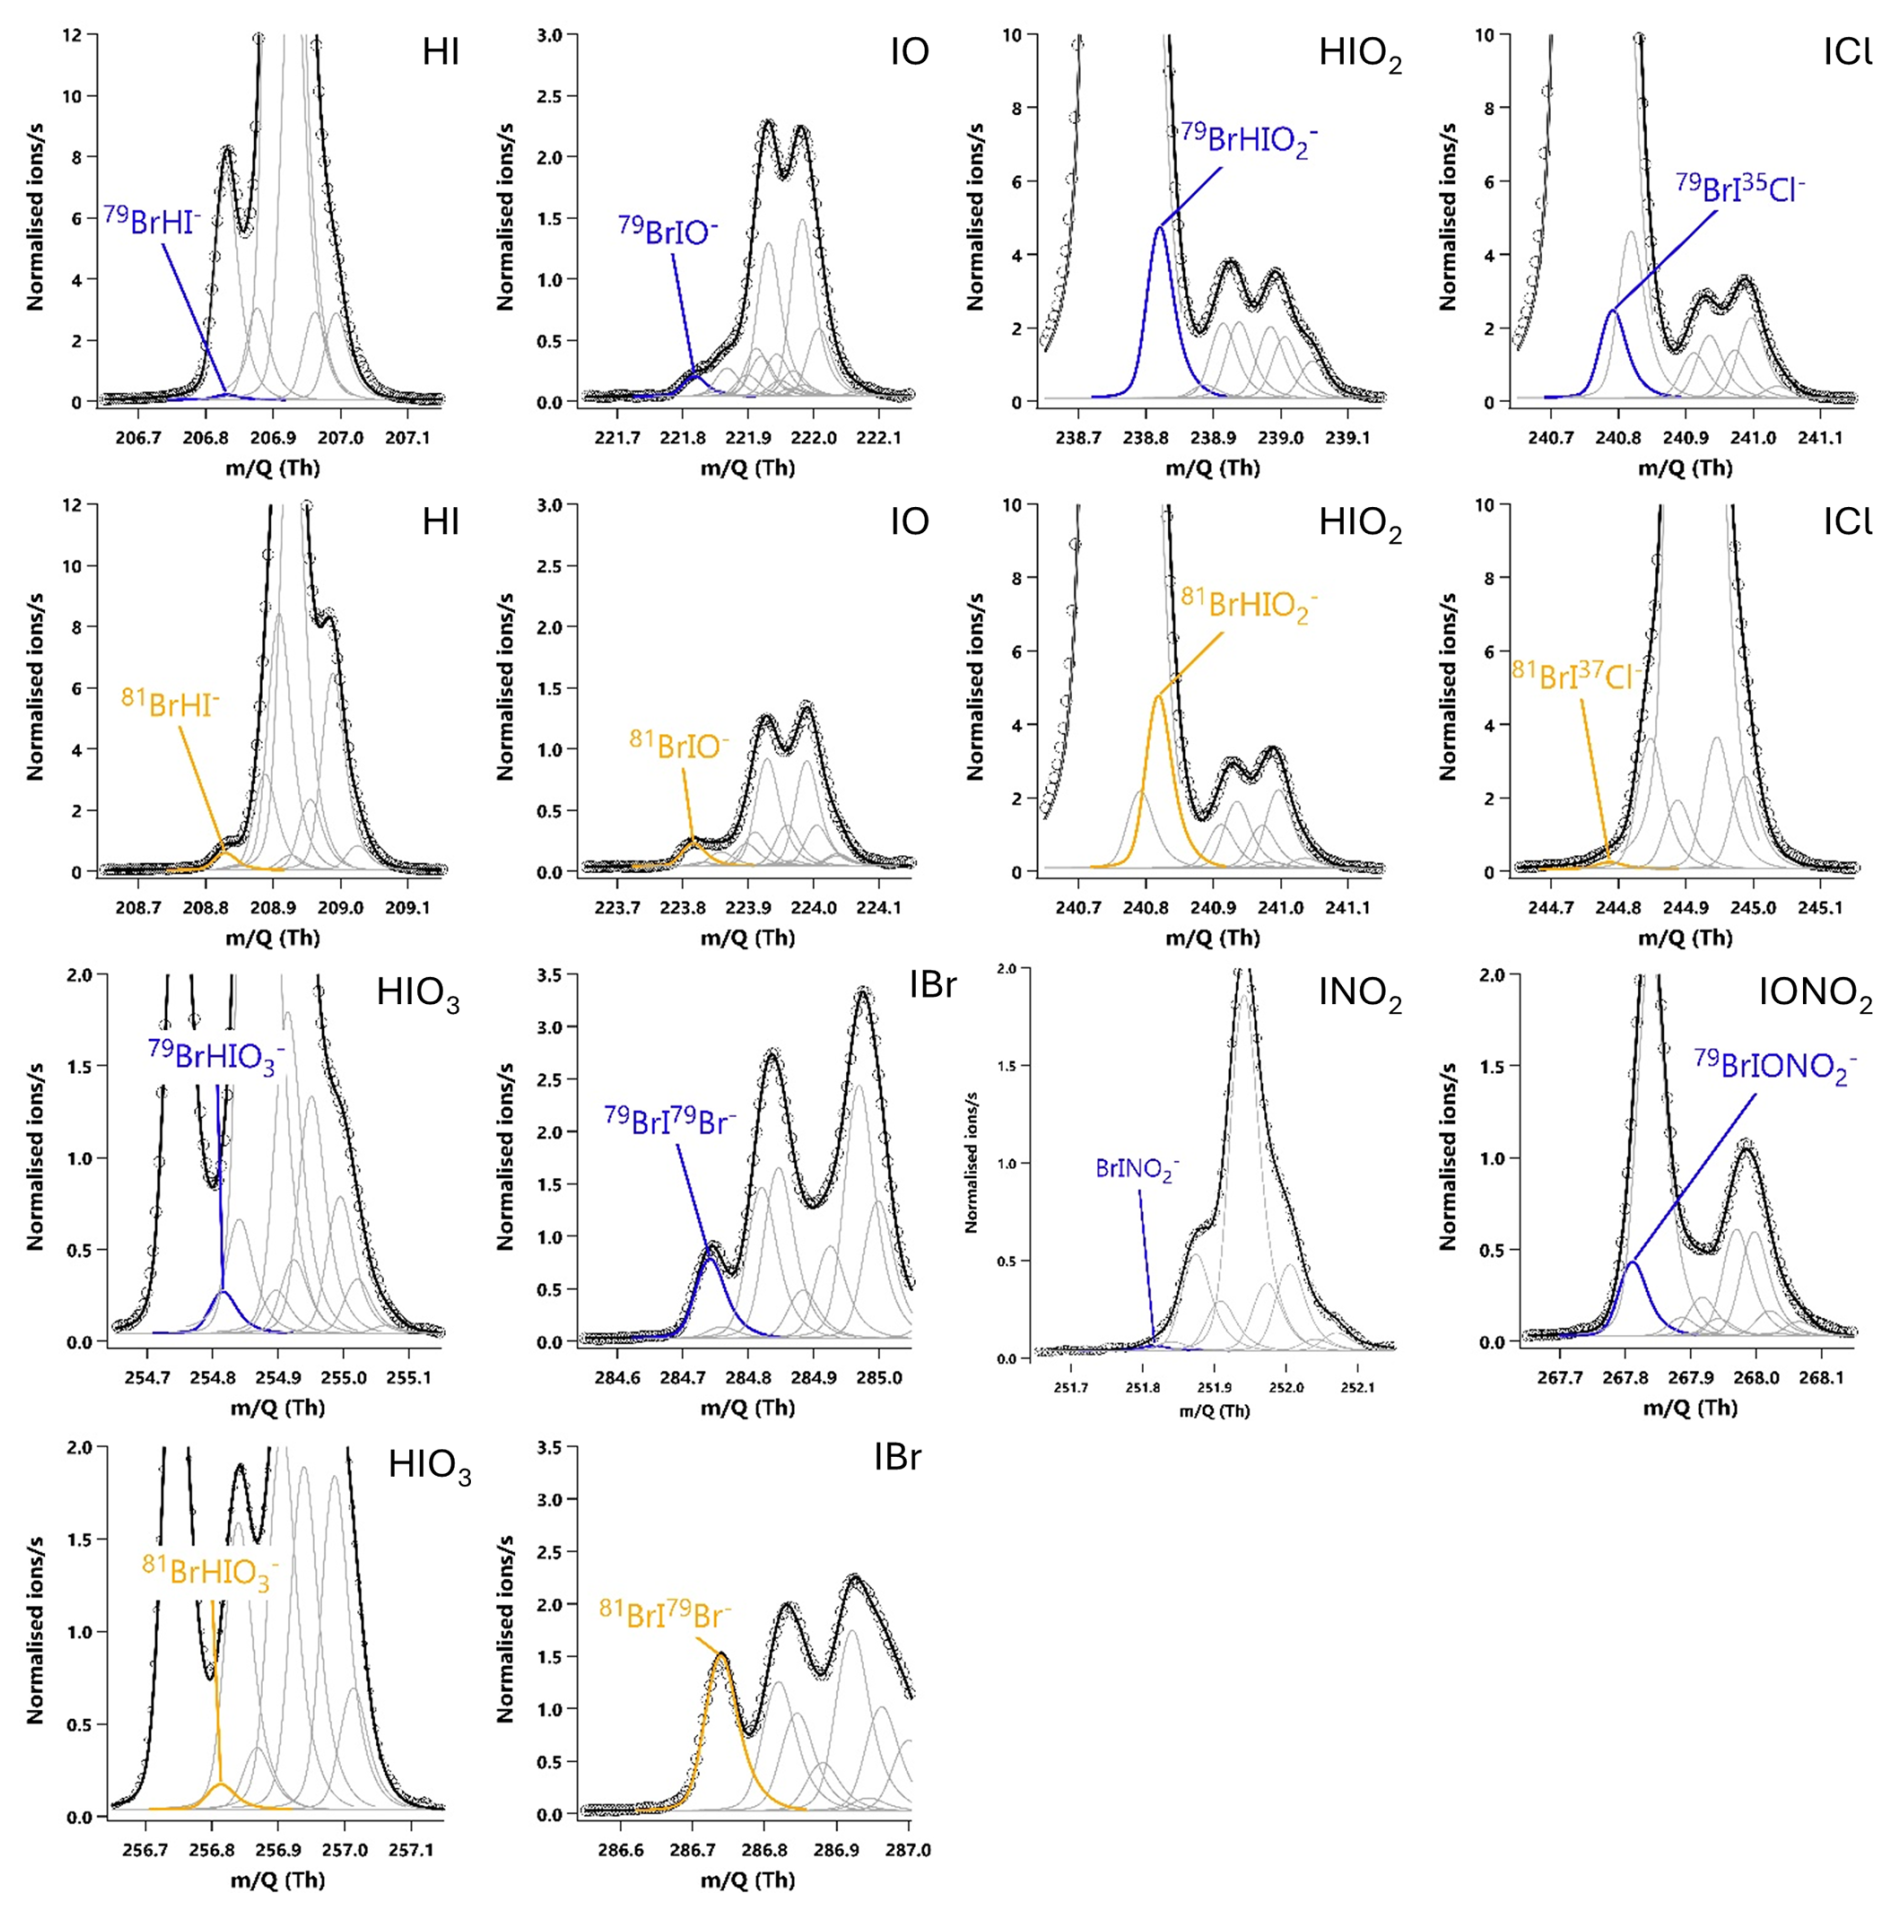
Figure A320 min averaged high resolution single peak mass spectra fits for potential iodine containing compounds during the HOI calibrations after the removal of the NaI trap. The molecular ion peak is shown in blue with the primary isotope peak in gold with an exception for 81Br37Cl− as this was the isotope used to calculate the BrICl signal. Isotope peak shapes were determined using the Tofware software. The isotope peaks of BrINO and BrIONO were not able to be visualised by the software.
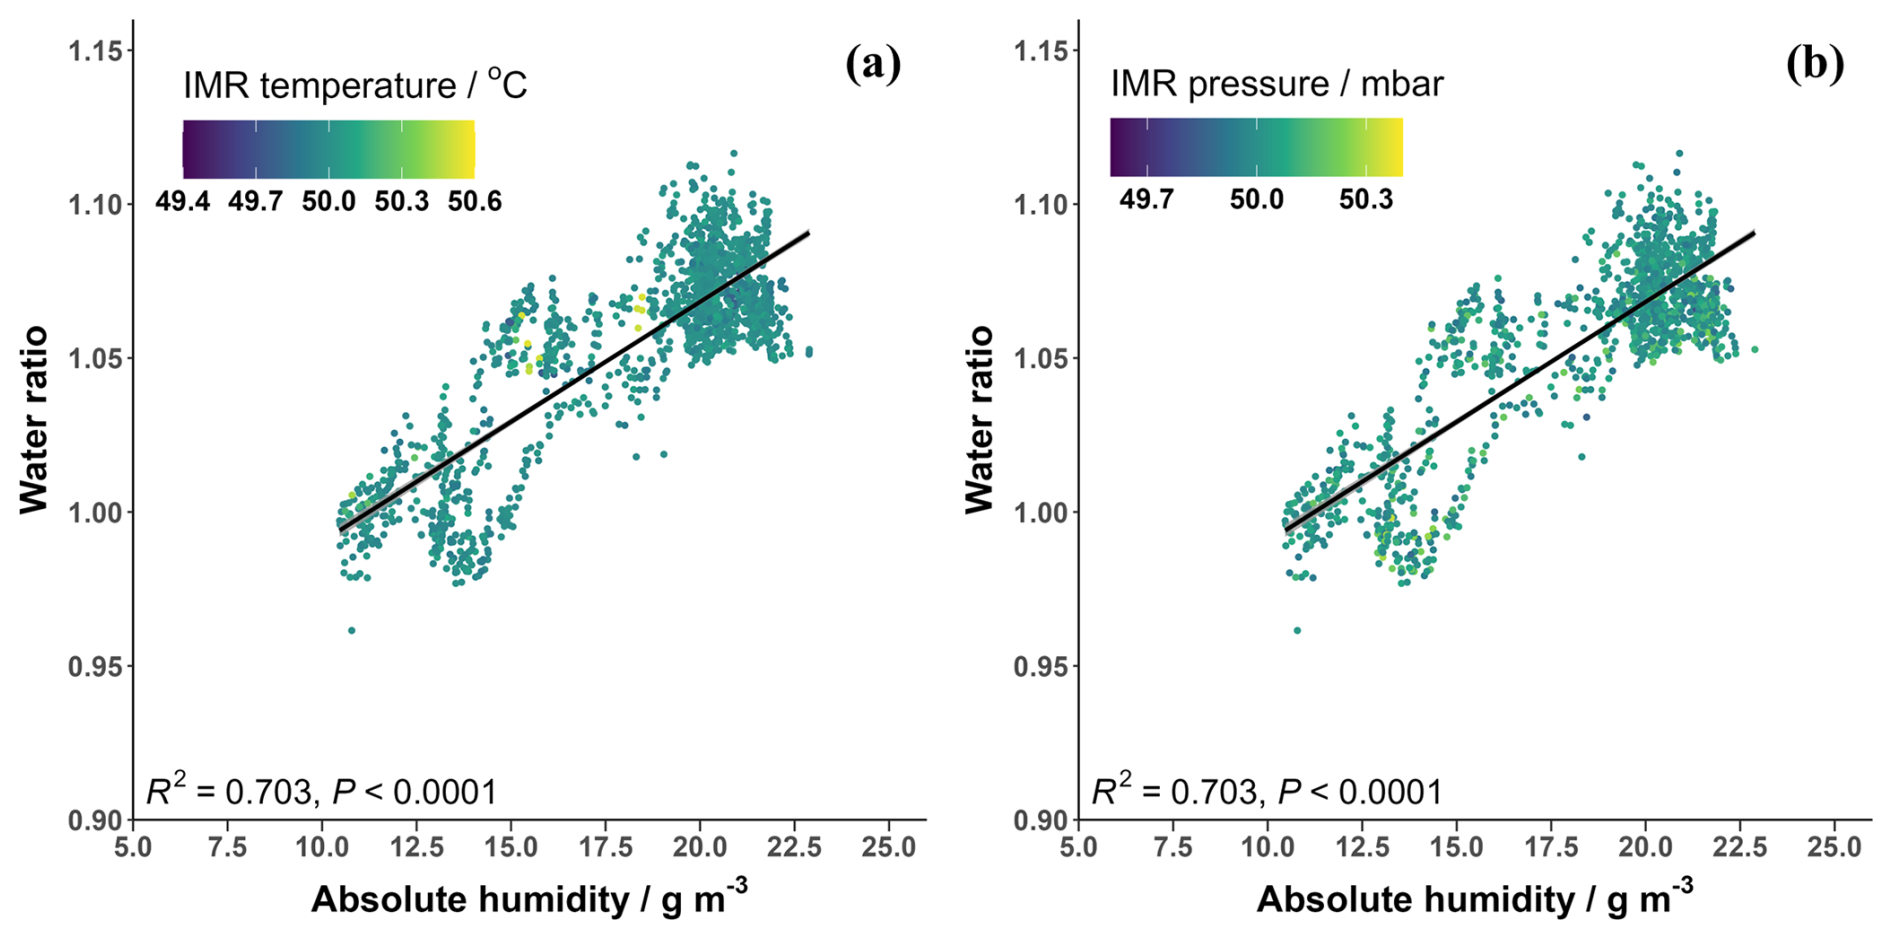
Figure A4The water ratio in the CIMS IMR plotted against the absolute humidity measured during the BLEACH campaign coloured by (a) the variation in IMR temperature and (b) the variation in IMR pressure.
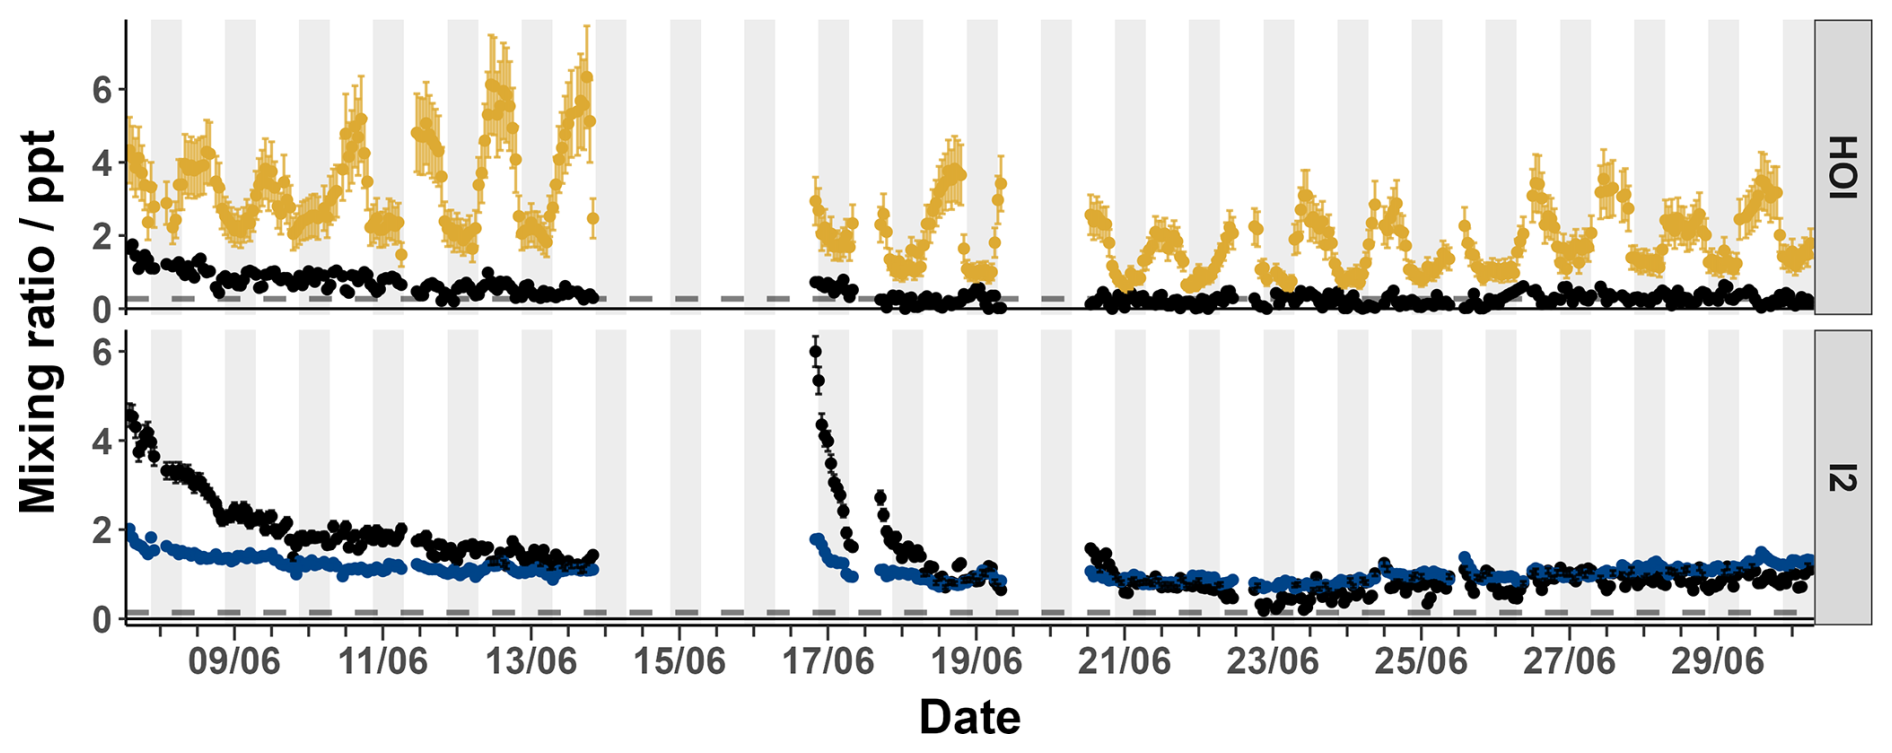
Figure A5The timeseries of the sample mixing ratios of HOI (yellow) and I2 (blue) along with their corresponding zero mixing ratios (black) from the BLEACH campaign in June 2022. The dashed line indicates the limit of detection for each compound.
Table A1The signal change (in normalised ion counts per second) of HNO3, HI, IBr and I2 along with their calculated standard errors during the HOI calibration runs upon addition of the NaI trap.
Datasets for the figures shown are available at: https://doi.org/10.15124/48ade8f3-d750-4fe6-a2d9-b8f69bf86262 (Marden, 2025).
LM, MS, LJC and SJA designed and developed the humidity dependence calibrations for I2 which were conducted by LM. MS, PR and JT developed the HOI calibration method and was adapted and conducted in lab experiments by LM and MZ. BA was responsible for the management and coordination of the BLEACH field campaign and AP was responsible for the management and usage of the Tudor Hill Marine Atmospheric Observatory. PBK performed the quantum chemical calculations. LM and LJC prepared the paper, and all authors reviewed the paper.
The contact author has declared that none of the authors has any competing interests.
Publisher's note: Copernicus Publications remains neutral with regard to jurisdictional claims made in the text, published maps, institutional affiliations, or any other geographical representation in this paper. The authors bear the ultimate responsibility for providing appropriate place names. Views expressed in the text are those of the authors and do not necessarily reflect the views of the publisher.
The authors would like to thank John Halfacre, William Drysdale, Allison Moon, Alyson Fritzmann and Gordon Novak for their help during the BLEACH summer campaign.
This research was supported by the European Research Council, Horizon Europe European Research Council (grant no. 833290). BA, JT and PR were supported by NSF AGS 2109323. The Tudor Hill Marine Atmospheric Observatory was supported by the National Science Foundation's Chemical Oceanography Program, grant OCE-2123053.
This paper was edited by Mingjin Tang and reviewed by two anonymous referees.
Auzmendi-Murua, I., Castillo, A., and Bozzelli, J.: Mercury Oxidation via Chlorine, Bromine, and Iodine under Atmospheric Conditions: Thermochemistry and Kinetics, J. Phys. Chem. A, 118, 2959–2975, https://doi.org/10.1021/jp412654s, 2014.
Bitter, M., Ball, S. M., Povey, I. M., and Jones, R. L.: A broadband cavity ringdown spectrometer for in-situ measurements of atmospheric trace gases, Atmos. Chem. Phys., 5, 2547–2560, https://doi.org/10.5194/acp-5-2547-2005, 2005.
Braban, C. F., Adams, J. W., Rodriguez, D., Cox, R. E., Crowley, J. N., and Schuster, G.: Heterogeneous reactions of HOI, ICl and IBr on sea salt and sea salt proxies, Phys. Chem. Chem. Phys., 9, 3136–3148, https://doi.org/10.1039/b700829e, 2007.
Breitenlechner, M., Novak, G. A., Neuman, J. A., Rollins, A. W., and Veres, P. R.: A versatile vacuum ultraviolet ion source for reduced pressure bipolar chemical ionization mass spectrometry, Atmos. Meas. Tech., 15, 1159–1169, https://doi.org/10.5194/amt-15-1159-2022, 2022.
Buys, Z., Brough, N., Huey, L. G., Tanner, D. J., von Glasow, R., and Jones, A. E.: High temporal resolution Br2, BrCl and BrO observations in coastal Antarctica, Atmos. Chem. Phys., 13, 1329–1343, https://doi.org/10.5194/acp-13-1329-2013, 2013.
Calvert, J. G. and Lindberg, S. E.: The potential influence of iodine-containing compounds on the chemistry of the troposphere in the polar spring. II. Mercury depletion, Atmos. Environ., 38, 5105–5116, https://doi.org/10.1016/j.atmosenv.2004.05.050, 2004.
Caram, C., Szopa, S., Cozic, A., Bekki, S., Cuevas, C. A., and Saiz-Lopez, A.: Sensitivity of tropospheric ozone to halogen chemistry in the chemistry–climate model LMDZ-INCA vNMHC, Geosci. Model Dev., 16, 4041–4062, https://doi.org/10.5194/gmd-16-4041-2023, 2023.
Carpenter, L. J., MacDonald, S. M., Shaw, M. D., Kumar, R., Saunders, R. W., Parthipan, R., Wilson, J., and Plane, J. M. C.: Atmospheric iodine levels influenced by sea surface emissions of inorganic iodine, Nat. Geosci., 6, 108–111, https://doi.org/10.1038/ngeo1687, 2013.
Chameides, W. L. and Davis, D. D.: IODINE – ITS POSSIBLE ROLE IN TROPOSPHERIC PHOTOCHEMISTRY, J. Geophys. Res.-Oceans, 85, 7383–7398, https://doi.org/10.1029/JC085iC12p07383, 1980.
Cuevas, C. A., Maffezzoli, N., Corella, J. P., Spolaor, A., Vallelonga, P., Kjaer, H. A., Simonsen, M., Winstrup, M., Vinther, B., Horvat, C., Fernandez, R. P., Kinnison, D., Lamarque, J. F., Barbante, C., and Saiz-Lopez, A.: Rapid increase in atmospheric iodine levels in the North Atlantic since the mid-20th century, Nat. Commun., 9, 6, https://doi.org/10.1038/s41467-018-03756-1, 2018.
Custard, K., Pratt, K., Wang, S., and Shepson, P.: Constraints on Arctic Atmospheric Chlorine Production through Measurements and Simulations of Cl2 and ClO, Environ. Sci. Technol., 50, 12394–12400, https://doi.org/10.1021/acs.est.6b03909, 2016.
Deming, B. L., Pagonis, D., Liu, X., Day, D. A., Talukdar, R., Krechmer, J. E., de Gouw, J. A., Jimenez, J. L., and Ziemann, P. J.: Measurements of delays of gas-phase compounds in a wide variety of tubing materials due to gas–wall interactions, Atmos. Meas. Tech., 12, 3453–3461, https://doi.org/10.5194/amt-12-3453-2019, 2019.
Dörich, R., Eger, P., Lelieveld, J., and Crowley, J. N.: Iodide CIMS and : the detection of HNO3 as NO in the presence of PAN, peroxyacetic acid and ozone, Atmos. Meas. Tech., 14, 5319–5332, https://doi.org/10.5194/amt-14-5319-2021, 2021.
Finkenzeller, H., Iyer, S., He, X.-C., Simon, M., Koenig, T. K., Lee, C. F., Valiev, R., Hofbauer, V., Amorim, A., Baalbaki, R., Baccarini, A., Beck, L., Bell, D. M., Caudillo, L., Chen, D., Chiu, R., Chu, B., Dada, L., Duplissy, J., Heinritzi, M., Kemppainen, D., Kim, C., Krechmer, J., Kürten, A., Kvashnin, A., Lamkaddam, H., Lee, C. P., Lehtipalo, K., Li, Z., Makhmutov, V., Manninen, H. E., Marie, G., Marten, R., Mauldin, R. L., Mentler, B., Müller, T., Petäjä, T., Philippov, M., Ranjithkumar, A., Rörup, B., Shen, J., Stolzenburg, D., Tauber, C., Tham, Y. J., Tomé, A., Vazquez-Pufleau, M., Wagner, A. C., Wang, D. S., Wang, M., Wang, Y., Weber, S. K., Nie, W., Wu, Y., Xiao, M., Ye, Q., Zauner-Wieczorek, M., Hansel, A., Baltensperger, U., Brioude, J., Curtius, J., Donahue, N. M., Haddad, I. E., Flagan, R. C., Kulmala, M., Kirkby, J., Sipilä, M., Worsnop, D. R., Kurten, T., Rissanen, M., and Volkamer, R.: The gas-phase formation mechanism of iodic acid as an atmospheric aerosol source, Nat. Chem., 15, 129–135, https://doi.org/10.1038/s41557-022-01067-z, 2023.
Frisch, M. J., Trucks, G. W., Schlegel, H. B., Scuseria, G. E., Robb, M. A., Cheeseman, J. R., Scalmani, G., Barone, V., Petersson, G. A., Nakatsuji, H., Li, X., Caricato, M., Marenich, A. V., Bloino, J., Janesko, B. G., Gomperts, R., Mennucci, B., Hratchian, H.P., Ortiz, J. V., Izmaylov, A. F., Sonnenberg, J. L., Williams-Young, D., Ding, F., Lipparini, F., Egidi, F., Goings, J., Peng, B., Petrone, A., Henderson, T., Ranasinghe, D., Zakrzewski, V. G., Gao, J., Rega, N., Zheng, G., Liang, W., Hada, M., Ehara, M., Toyota, K., Fukuda, R., Hasegawa, J., Ishida, M., Nakajima, T., Honda, Y., Kitao, O., Nakai, H., Vreven, T., Throssell, K., Montgomery, J. A., Jr., Peralta, J. E., Ogliaro, F., Bearpark, M. J., Heyd, J. J., Brothers, E. N., Kudin, K. N., Staroverov, V. N., Keith, T. A., Kobayashi, R., Normand, J., Raghavachari, K., Rendell, A. P., Burant, J. C., Iyengar, S. S., Tomasi, J., Cossi, M., Millam, J. M., Klene, M., Adamo, C., Cammi, R., Ochterski, J. W., Martin, R. L., Morokuma, K., Farkas, O., Foresman, J. B., and Fox, D. J.: Gaussian 16, Revision C.02, Gaussian Inc., Wallingford CT, https://gaussian.com (last access: 5 April 2026), 2019.
Garland, J. A., Elzerman, A. W., and Penkett, S. A.: THE MECHANISM FOR DRY DEPOSITION OF OZONE TO SEAWATER SURFACES, J. Geophys. Res.-Oceans, 85, 7488–7492, https://doi.org/10.1029/JC085iC12p07488, 1980.
He, X.-C., Shen, J., Iyer, S., Juuti, P., Zhang, J., Koirala, M., Kytökari, M. M., Worsnop, D. R., Rissanen, M., Kulmala, M., Maier, N. M., Mikkilä, J., Sipilä, M., and Kangasluoma, J.: Characterisation of gaseous iodine species detection using the multi-scheme chemical ionisation inlet 2 with bromide and nitrate chemical ionisation methods, Atmos. Meas. Tech., 16, 4461–4487, https://doi.org/10.5194/amt-16-4461-2023, 2023.
Huang, R.-J., Seitz, K., Buxmann, J., Pöhler, D., Hornsby, K. E., Carpenter, L. J., Platt, U., and Hoffmann, T.: In situ measurements of molecular iodine in the marine boundary layer: the link to macroalgae and the implications for O3, IO, OIO and NOx, Atmos. Chem. Phys., 10, 4823–4833, https://doi.org/10.5194/acp-10-4823-2010, 2010.
Huang, Y., Zhao, R., Charan, S., Kenseth, C., Zhang, X., and Seinfeld, J.: Unified Theory of Vapor-Wall Mass Transport in Teflon-Walled Environmental Chambers, Environ. Sci. Technol., 52, 2134–2142, https://doi.org/10.1021/acs.est.7b05575, 2018.
Huey, L.: Measurement of trace atmospheric species by chemical ionization mass spectrometry: Speciation of reactive nitrogen and future directions, Mass Spectrom. Rev., 26, 166–184, https://doi.org/10.1002/mas.20118, 2007.
Iglesias-Suarez, F., Badia, A., Fernandez, R. P., Cuevas, C. A., Kinnison, D. E., Tilmes, S., Lamarque, J. F., Long, M. C., Hossaini, R., and Saiz-Lopez, A.: Natural halogens buffer tropospheric ozone in a changing climate, Nat. Clim. Change, 10, 147-+, https://doi.org/10.1038/s41558-019-0675-6, 2020.
Iyer, S., Lopez-Hilfiker, F., Lee, B., Thornton, J., and Kurtén, T.: Modeling the Detection of Organic and Inorganic Compounds Using Iodide-Based Chemical Ionization, J. Phys. Chem. A, 120, 576–587, https://doi.org/10.1021/acs.jpca.5b09837, 2016.
Ji, Y., Huey, L. G., Tanner, D. J., Lee, Y. R., Veres, P. R., Neuman, J. A., Wang, Y., and Wang, X.: A vacuum ultraviolet ion source (VUV-IS) for iodide–chemical ionization mass spectrometry: a substitute for radioactive ion sources, Atmos. Meas. Tech., 13, 3683–3696, https://doi.org/10.5194/amt-13-3683-2020, 2020.
Kassel, L. S.: Studies in homogeneous gas reactions II Introduction of quantum theory, J. Phys. Chem., 32, 1065–1079, https://doi.org/10.1021/j150289a011, 1928.
Kercher, J. P., Riedel, T. P., and Thornton, J. A.: Chlorine activation by N2O5: simultaneous, in situ detection of ClNO2 and N2O5 by chemical ionization mass spectrometry, Atmos. Meas. Tech., 2, 193–204, https://doi.org/10.5194/amt-2-193-2009, 2009.
Klobas, J., Hansen, J., Weisenstein, D., Kennedy, R., and Wilmouth, D.: Sensitivity of Iodine-Mediated Stratospheric Ozone Loss Chemistry to Future Chemistry-Climate Scenarios, Front. Earth Sci., 9, https://doi.org/10.3389/feart.2021.617586, 2021.
Koenig, T., Baidar, S., Campuzano-Jost, P., Cuevas, C., Dix, B., Fernandez, R., Guo, H., Hall, S., Kinnison, D., Nault, B., Ullmann, K., Jimenez, J., Saiz-Lopez, A., and Volkamer, R.: Quantitative detection of iodine in the stratosphere, P. Natl. Acad. Sci. USA, 117, 1860–1866, https://doi.org/10.1073/pnas.1916828117, 2020.
Krechmer, J., Pagonis, D., Ziemann, P., and Jimenez, J.: Quantification of Gas-Wall Partitioning in Teflon Environmental Chambers Using Rapid Bursts of Low-Volatility Oxidized Species Generated in Situ, Environ. Sci. Technol., 50, 5757–5765, https://doi.org/10.1021/acs.est.6b00606, 2016.
Kurtén, T., Kuang, C. A., Gómez, P., McMurry, P. H., Vehkamäki, H., Ortega, I., Noppel, M., and Kulmala, M.: The role of cluster energy nonaccommodation in atmospheric sulfuric acid nucleation, J. Chem. Phys., 132, 8, https://doi.org/10.1063/1.3291213, 2010.
Laidler, K. J.: Chemical Kinetics, 3rd Edn., Harper & Row, 531 pp., ISBN 0-06-043862-2, 1987.
Lawler, M. J., Sander, R., Carpenter, L. J., Lee, J. D., von Glasow, R., Sommariva, R., and Saltzman, E. S.: HOCl and Cl2 observations in marine air, Atmos. Chem. Phys., 11, 7617–7628, https://doi.org/10.5194/acp-11-7617-2011, 2011.
Lawler, M. J., Mahajan, A. S., Saiz-Lopez, A., and Saltzman, E. S.: Observations of I2 at a remote marine site, Atmos. Chem. Phys., 14, 2669–2678, https://doi.org/10.5194/acp-14-2669-2014, 2014.
Le Breton, M., Bannan, T., Shallcross, D., Khan, M., Evans, M., Lee, J., Lidster, R., Andrews, S., Carpenter, L., Schmidt, J., Jacob, D., Harris, N., Bauguitte, S., Gallagher, M., Bacak, A., Leather, K., and Percival, C.: Enhanced ozone loss by active inorganic bromine chemistry in the tropical troposphere, Atmos. Environ., 155, 21–28, https://doi.org/10.1016/j.atmosenv.2017.02.003, 2017.
Lee, B. H., Lopez-Hilfiker, F. D., Veres, P. R., McDuffie, E. E., Fibiger, D. L., Sparks, T. L., Ebben, C. J., Green, J. R., Schroder, J. C., Campuzano-Jost, P., Iyer, S., D’Ambro, E. L., Schobesberger, S., Brown, S. S., Wooldridge, P. J., Cohen, R. C., Fiddler, M. N., Bililign, S., Jimenez, J. L., Kurtén, T., Weinheimer, A. J., Jaegle, L., and Thornton, J. A.: Flight Deployment of a High-Resolution Time-of-Flight Chemical Ionization Mass Spectrometer: Observations of Reactive Halogen and Nitrogen Oxide Species, J. Geophys. Res.-Atmos., 123, 7670–7686, https://doi.org/10.1029/2017JD028082, 2018.
Lee, B. H., Lopez-Hilfiker, F. D., Mohr, C., Kurtén, T., Worsnop, D. R., and Thornton, J. A.: An Iodide-Adduct High-Resolution Time-of-Flight Chemical-Ionization Mass Spectrometer: Application to Atmospheric Inorganic and Organic Compounds, Environ. Sci. Technol., 48, 6309–6317, https://doi.org/10.1021/es500362a, 2014.
Lee, C., Elgiar, T., David, L., Wilmot, T., Reza, M., Hirshorn, N., McCubbin, I., Shah, V., Lin, J., Lyman, S., Hallar, A., Gratz, L., and Volkamer, R.: Elevated Tropospheric Iodine Over the Central Continental United States: Is Iodine a Major Oxidant of Atmospheric Mercury?, Geophys. Res. Lett., 51, https://doi.org/10.1029/2024GL109247, 2024.
Legrand, M., McConnell, J., Preunkert, S., Arienzo, M., Chellman, N., Gleason, K., Sherwen, T., Evans, M., and Carpenter, L.: Alpine ice evidence of a three-fold increase in atmospheric iodine deposition since 1950 in Europe due to increasing oceanic emissions, P. Natl. Acad. Sci. USA, 115, 12136-12141, 10.1073/pnas.1809867115, 2018.
Liao, J., Huey, L. G., Scheuer, E., Dibb, J. E., Stickel, R. E., Tanner, D. J., Neuman, J. A., Nowak, J. B., Choi, S., Wang, Y., Salawitch, R. J., Canty, T., Chance, K., Kurosu, T., Suleiman, R., Weinheimer, A. J., Shetter, R. E., Fried, A., Brune, W., Anderson, B., Zhang, X., Chen, G., Crawford, J., Hecobian, A., and Ingall, E. D.: Characterization of soluble bromide measurements and a case study of BrO observations during ARCTAS, Atmos. Chem. Phys., 12, 1327–1338, https://doi.org/10.5194/acp-12-1327-2012, 2012.
Liao, J., Huey, L. G., Liu, Z., Tanner, D. J., Cantrell, C. A., Orlando, J. J., Flocke, F. M., Shepson, P. B., Weinheimer, A. J., Hall, S. R., Ullmann, K., Beine, H. J., Wang, Y., Ingall, E. D., Stephens, C. R., Hornbrook, R. S., Apel, E. C., Riemer, D., Fried, A., Mauldin III, R. L., Smith, J. N., Staebler, R. M., Neuman, J. A., and Nowak, J. B.: High levels of molecular chlorine in the Arctic atmosphere, Nat. Geosci., 7, 91–94, https://doi.org/10.1038/ngeo2046, 2014.
MacDonald, S. M., Gómez Martín, J. C., Chance, R., Warriner, S., Saiz-Lopez, A., Carpenter, L. J., and Plane, J. M. C.: A laboratory characterisation of inorganic iodine emissions from the sea surface: dependence on oceanic variables and parameterisation for global modelling, Atmos. Chem. Phys., 14, 5841–5852, https://doi.org/10.5194/acp-14-5841-2014, 2014.
Mahajan, A., Oetjen, H., Saiz-Lopez, A., Lee, J., McFiggans, G., and Plane, J.: Reactive iodine species in a semi-polluted environment, Geophys. Res. Lett., 36, https://doi.org/10.1029/2009GL038018, 2009.
Marcy, T., Gao, R., Northway, M., Popp, P., Stark, H., and Fahey, D.: Using chemical ionization mass spectrometry for detection of HNO3, HOl, and CIONO2 in the atmosphere, Int. J. Mass Spectrom., 243, 63–70, https://doi.org/10.1016/j.ijms.2004.11.012, 2005.
Marden, L.: A novel technique for the humidity dependent calibration of hypoiodous acid (HOI) and iodine (I2): Data resources, University of York [data set], https://doi.org/10.15124/48ade8f3-d750-4fe6-a2d9-b8f69bf86262, 2025.
Moon, A. R., Liu, L., Wang, X., Chan, Y.-C., Fritzmann, A., Pound, R., Lees, A., Marden, L., Evans, M., Carpenter, L. J., Stutz, J., Thornton, J. A., Novak, G., Rollins, A., Schill, G. P., He, X.-C., Finkenzeller, H., Reza, M., Volkamer, R., Bates, K. H., Saiz-Lopez, A., Mahajan, A. S., and Alexander, B.: Aerosol iodine recycling is a major control on tropospheric reactive iodine abundance, Atmos. Chem. Phys., 26, 2353–2389, https://doi.org/10.5194/acp-26-2353-2026, 2026.
Neale, P. J., Hylander, S., Banaszak, A. T., Häder, D. P., Rose, K. C., Vione, D., Wängberg, S. Å., Jansen, M. A. K., Busquets, R., Andersen, M. P. S., Madronich, S., Hanson, M. L., Schikowski, T., Solomon, K. R., Sulzberger, B., Wallington, T. J., Heikkilä, A. M., Pandey, K. K., Andrady, A. L., Bruckman, L. S., White, C. C., Zhu, L. P., Bernhard, G. H., Bais, A., Aucamp, P. J., Chiodo, G., Cordero, R. R., Petropavlovskikh, I., Neale, R. E., Olsen, C. M., Hales, S., Lal, A., Lingham, G., Rhodes, L. E., Young, A. R., Robson, T. M., Robinson, S. A., Barnes, P. W., Bornman, J. F., Harper, A. B., Lee, H., Calderón, R. M., Ossola, R., Paul, N. D., Revell, L. E., Wang, Q. W., and Zepp, R. G.: Environmental consequences of interacting effects of changes in stratospheric ozone, ultraviolet radiation, and climate: UNEP Environmental Effects Assessment Panel, Update 2024, Photoch. Photobio. Sci., 24, 357–392, https://doi.org/10.1007/s43630-025-00687-x, 2025.
Neuman, J. A., Nowak, J. B., Huey, L. G., Burkholder, J. B., Dibb, J. E., Holloway, J. S., Liao, J., Peischl, J., Roberts, J. M., Ryerson, T. B., Scheuer, E., Stark, H., Stickel, R. E., Tanner, D. J., and Weinheimer, A.: Bromine measurements in ozone depleted air over the Arctic Ocean, Atmos. Chem. Phys., 10, 6503–6514, https://doi.org/10.5194/acp-10-6503-2010, 2010.
O'Dowd, C., Hämeri, K., Mäkelä, J., Väkeva, M., Aalto, P., de Leeuw, G., Kunz, G., Becker, E., Hansson, H., Allen, A., Harrison, R., Berresheim, H., Geever, M., Jennings, S., and Kulmala, M.: Coastal new particle formation:: Environmental conditions and aerosol physicochemical characteristics during nucleation bursts: art. no. 8107, J. Geophys. Res.-Atmos., 107, https://doi.org/10.1029/2000JD000206, 2002.
Peng, X., Wang, T., Wang, W., Ravishankara, A. R., George, C., Xia, M., Cai, M., Li, Q., Salvador, C. M., Lau, C., Lyu, X., Poon, C. N., Mellouki, A., Mu, Y., Hallquist, M., Saiz-Lopez, A., Guo, H., Herrmann, H., Yu, C., Dai, J., Wang, Y., Wang, X., Yu, A., Leung, K., Lee, S., and Chen, J.: Photodissociation of particulate nitrate as a source of daytime tropospheric Cl2, Nat. Commun., 13, 939, https://doi.org/10.1038/s41467-022-28383-9, 2022.
Peters, C., Pechtl, S., Stutz, J., Hebestreit, K., Hönninger, G., Heumann, K. G., Schwarz, A., Winterlik, J., and Platt, U.: Reactive and organic halogen species in three different European coastal environments, Atmos. Chem. Phys., 5, 3357–3375, https://doi.org/10.5194/acp-5-3357-2005, 2005.
Pound, R., Durcan, D., Evans, M., and Carpenter, L.: Comparing the Importance of Iodine and Isoprene on Tropospheric Photochemistry, Geophys. Res. Lett., 50, https://doi.org/10.1029/2022GL100997, 2023.
Pound, R. J., Brown, L. V., Evans, M. J., and Carpenter, L. J.: An improved estimate of inorganic iodine emissions from the ocean using a coupled surface microlayer box model, Atmos. Chem. Phys., 24, 9899–9921, https://doi.org/10.5194/acp-24-9899-2024, 2024.
Prados-Roman, C., Cuevas, C. A., Hay, T., Fernandez, R. P., Mahajan, A. S., Royer, S.-J., Galí, M., Simó, R., Dachs, J., Großmann, K., Kinnison, D. E., Lamarque, J.-F., and Saiz-Lopez, A.: Iodine oxide in the global marine boundary layer, Atmos. Chem. Phys., 15, 583–593, https://doi.org/10.5194/acp-15-583-2015, 2015.
Priestley, M., le Breton, M., Bannan, T. J., Worrall, S. D., Bacak, A., Smedley, A. R. D., Reyes-Villegas, E., Mehra, A., Allan, J., Webb, A. R., Shallcross, D. E., Coe, H., and Percival, C. J.: Observations of organic and inorganic chlorinated compounds and their contribution to chlorine radical concentrations in an urban environment in northern Europe during the wintertime, Atmos. Chem. Phys., 18, 13481–13493, https://doi.org/10.5194/acp-18-13481-2018, 2018.
Pritchard, B., Altarawy, D., Didier, B., Gibson, T., and Windus, T.: New Basis Set Exchange: An Open, Up-to-Date Resource for the Molecular Sciences Community, J. Chem. Inf. Model., 59, 4814–4820, https://doi.org/10.1021/acs.jcim.9b00725, 2019.
Raso, A., Custard, K., May, N., Tanner, D., Newburn, M., Walker, L., Moore, R., Huey, L., Alexander, L., Shepson, P., and Pratt, K.: Active molecular iodine photochemistry in the Arctic, P. Natl. Acad. Sci. USA, 114, 10053–10058, https://doi.org/10.1073/pnas.1702803114, 2017.
Read, K. A., Mahajan, A. S., Carpenter, L. J., Evans, M. J., Faria, B. V. E., Heard, D. E., Hopkins, J. R., Lee, J. D., Moller, S. J., Lewis, A. C., Mendes, L., McQuaid, J. B., Oetjen, H., Saiz-Lopez, A., Pilling, M. J., and Plane, J. M. C.: Extensive halogen-mediated ozone destruction over the tropical Atlantic Ocean, Nature, 453, 1232–1235, https://doi.org/10.1038/nature07035, 2008.
Reza, M., Iezzi, L., Finkenzeller, H., Roose, A., Ammann, M., and Volkamer, R.: Iodine Activation from Iodate Reduction in Aqueous Films via Photocatalyzed and Dark Reactions, ACS Earth Space Chem., 8, 2495–2508, https://doi.org/10.1021/acsearthspacechem.4c00224, 2024.
Rice, O. K. and Ramsperger, H. C.: Theories of unimolecular gas reactions at low pressures, J. Ame. Chem. Soc., 49, 1617–1629, https://doi.org/10.1021/ja01406a001, 1927.
Rissanen, M. P., Mikkilä, J., Iyer, S., and Hakala, J.: Multi-scheme chemical ionization inlet (MION) for fast switching of reagent ion chemistry in atmospheric pressure chemical ionization mass spectrometry (CIMS) applications, Atmos. Meas. Tech., 12, 6635–6646, https://doi.org/10.5194/amt-12-6635-2019, 2019.
Riva, M., Pospisilova, V., Frege, C., Perrier, S., Bansal, P., Jorga, S., Sturm, P., Thornton, J. A., Rohner, U., and Lopez-Hilfiker, F.: Evaluation of a reduced-pressure chemical ion reactor utilizing adduct ionization for the detection of gaseous organic and inorganic species, Atmos. Meas. Tech., 17, 5887–5901, https://doi.org/10.5194/amt-17-5887-2024, 2024.
Robinson, M. A., Neuman, J. A., Huey, L. G., Roberts, J. M., Brown, S. S., and Veres, P. R.: Temperature-dependent sensitivity of iodide chemical ionization mass spectrometers, Atmos. Meas. Tech., 15, 4295–4305, https://doi.org/10.5194/amt-15-4295-2022, 2022.
Roscoe, H., Brough, N., Jones, A., Wittrock, F., Richter, A., Van Roozendael, M., and Hendrick, F.: Characterisation of vertical BrO distribution during events of enhanced tropospheric BrO in Antarctica, from combined remote and in-situ measurements, J. Quant. Spectrosc. Ra., 138, 70–81, https://doi.org/10.1016/j.jqsrt.2014.01.026, 2014.
Saiz-Lopez, A. and Plane, J.: Novel iodine chemistry in the marine boundary layer, Geophys. Res. Lett., 31, https://doi.org/10.1029/2003GL019215, 2004.
Saiz-Lopez, A. and von Glasow, R.: Reactive halogen chemistry in the troposphere, Chem. Soc. Rev., 41, 6448–6472, https://doi.org/10.1039/c2cs35208g, 2012.
Saiz-Lopez, A., Plane, J. M. C., Baker, A. R., Carpenter, L. J., von Glasow, R., Martin, J. C. G., McFiggans, G., and Saunders, R. W.: Atmospheric Chemistry of Iodine, Chem. Rev., 112, 1773–1804, https://doi.org/10.1021/cr200029u, 2012.
Saiz-Lopez, A., Fernandez, R. P., Ordóñez, C., Kinnison, D. E., Gómez Martín, J. C., Lamarque, J.-F., and Tilmes, S.: Iodine chemistry in the troposphere and its effect on ozone, Atmos. Chem. Phys., 14, 13119–13143, https://doi.org/10.5194/acp-14-13119-2014, 2014.
Sanchez, J., Tanner, D. J., Chen, D., Huey, L. G., and Ng, N. L.: A new technique for the direct detection of HO2 radicals using bromide chemical ionization mass spectrometry (Br-CIMS): initial characterization, Atmos. Meas. Tech., 9, 3851–3861, https://doi.org/10.5194/amt-9-3851-2016, 2016.
Shaw, M. and Carpenter, L.: Modification of Ozone Deposition and I2 Emissions at the Air-Aqueous Interface by Dissolved Organic Carbon of Marine Origin, Environ. Sci. Technol., 47, 10947–10954, https://doi.org/10.1021/es4011459, 2013.
Sherwen, T., Evans, M. J., Carpenter, L. J., Andrews, S. J., Lidster, R. T., Dix, B., Koenig, T. K., Sinreich, R., Ortega, I., Volkamer, R., Saiz-Lopez, A., Prados-Roman, C., Mahajan, A. S., and Ordóñez, C.: Iodine's impact on tropospheric oxidants: a global model study in GEOS-Chem, Atmos. Chem. Phys., 16, 1161–1186, https://doi.org/10.5194/acp-16-1161-2016, 2016a.
Sherwen, T., Schmidt, J. A., Evans, M. J., Carpenter, L. J., Großmann, K., Eastham, S. D., Jacob, D. J., Dix, B., Koenig, T. K., Sinreich, R., Ortega, I., Volkamer, R., Saiz-Lopez, A., Prados-Roman, C., Mahajan, A. S., and Ordóñez, C.: Global impacts of tropospheric halogens (Cl, Br, I) on oxidants and composition in GEOS-Chem, Atmos. Chem. Phys., 16, 12239–12271, https://doi.org/10.5194/acp-16-12239-2016, 2016b.
Simpson, W. R., Brown, S. S., Saiz-Lopez, A., Thornton, J. A., and von Glasow, R.: Tropospheric Halogen Chemistry: Sources, Cycling, and Impacts, Chem. Rev., 115, 4035–4062, https://doi.org/10.1021/cr5006638, 2015.
Sipilä, M., Sarnela, N., Jokinen, T., Henschel, H., Junninen, H., Kontkanen, J., Richters, S., Kangasluoma, J., Franchin, A., Peräkylä, O., Rissanen, M. P., Ehn, M., Vehkamäki, H., Kurten, T., Berndt, T., Petäjä, T., Worsnop, D., Ceburnis, D., Kerminen, V.-M., Kulmala, M., and O'Dowd, C.: Molecular-scale evidence of aerosol particle formation via sequential addition of HIO3, Nature, 537, 532–534, https://doi.org/10.1038/nature19314, 2016.
Sjostedt, S. and Abbatt, J.: Release of gas-phase halogens from sodium halide substrates: heterogeneous oxidation of frozen solutions and desiccated salts by hydroxyl radicals, Environ. Res. Lett., 3, https://doi.org/10.1088/1748-9326/3/4/045007, 2008.
Solomon, S., Garcia, R., and Ravishankara, A.: ON THE ROLE OF IODINE IN OZONE DEPLETION, J. Geophys. Res.-Atmos., 99, 20491–20499, 1994.
Stark, H., Yatayelli, R., Thompson, S., Kimmel, J., Cubison, M., Chhabra, P., Canagaratna, M., Jayne, J., Worsnop, D., and Jimenez, J.: Methods to extract molecular and bulk chemical information from series of complex mass spectra with limited mass resolution, Int. J. Mass Spectrom., 389, 26–38, https://doi.org/10.1016/j.ijms.2015.08.011, 2015.
Tham, Y. J., He, X.-C., Li, Q., Cuevas, C. A., Shen, J., Kalliokoski, J., Yan, C., Iyer, S., Lehmusjärvi, T., Jang, S., Thakur, R. C., Beck, L., Kemppainen, D., Olin, M., Sarnela, N., Mikkilä, J., Hakala, J., Marbouti, M., Yao, L., Li, H., Huang, W., Wang, Y., Wimmer, D., Zha, Q., Virkanen, J., Spain, T. G., O’Doherty, S., Jokinen, T., Bianchi, F., Petäjä, T., Worsnop, D. R., Mauldin, R. L., Ovadnevaite, J., Ceburnis, D., Maier, N. M., Kulmala, M., O’Dowd, C., Dal Maso, M., Saiz-Lopez, A., and Sipilä, M.: Direct field evidence of autocatalytic iodine release from atmospheric aerosol, P. Natl. Acad. Sci. USA, 118, e2009951118, https://doi.org/10.1073/pnas.2009951118, 2021.
Vogt, R., Sander, R., Von Glasow, R., and Crutzen, P.: Iodine chemistry and its role in halogen activation and ozone loss in the marine boundary layer: A model study, J. Atmos. Chem., 32, 375–395, https://doi.org/10.1023/A:1006179901037, 1999.
Wang, M., Kong, W., Marten, R., He, X., Chen, D., Pfeifer, J., Heitto, A., Kontkanen, J., Dada, L., Kürten, A., Yli-Juuti, T., Manninen, H. E., Amanatidis, S., Amorim, A., Baalbaki, R., Baccarini, A., Bell, D. M., Bertozzi, B., Bräkling, S., Brilke, S., Murillo, L. C., Chiu, R., Chu, B., De Menezes, L.-P., Duplissy, J., Finkenzeller, H., Carracedo, L. G., Granzin, M., Guida, R., Hansel, A., Hofbauer, V., Krechmer, J., Lehtipalo, K., Lamkaddam, H., Lampimäki, M., Lee, C. P., Makhmutov, V., Marie, G., Mathot, S., Mauldin, R. L., Mentler, B., Müller, T., Onnela, A., Partoll, E., Petäjä, T., Philippov, M., Pospisilova, V., Ranjithkumar, A., Rissanen, M., Rörup, B., Scholz, W., Shen, J., Simon, M., Sipilä, M., Steiner, G., Stolzenburg, D., Tham, Y. J., Tomé, A., Wagner, A. C., Wang, D. S., Wang, Y., Weber, S. K., Winkler, P. M., Wlasits, P. J., Wu, Y., Xiao, M., Ye, Q., Zauner-Wieczorek, M., Zhou, X., Volkamer, R., Riipinen, I., Dommen, J., Curtius, J., Baltensperger, U., Kulmala, M., Worsnop, D. R., Kirkby, J., Seinfeld, J. H., El-Haddad, I., Flagan, R. C., and Donahue, N. M.: Rapid growth of new atmospheric particles by nitric acid and ammonia condensation, Nature, 581, 184–189, https://doi.org/10.1038/s41586-020-2270-4, 2020.
Wang, M., He, X.-C., Finkenzeller, H., Iyer, S., Chen, D., Shen, J., Simon, M., Hofbauer, V., Kirkby, J., Curtius, J., Maier, N., Kurtén, T., Worsnop, D. R., Kulmala, M., Rissanen, M., Volkamer, R., Tham, Y. J., Donahue, N. M., and Sipilä, M.: Measurement of iodine species and sulfuric acid using bromide chemical ionization mass spectrometers, Atmos. Meas. Tech., 14, 4187–4202, https://doi.org/10.5194/amt-14-4187-2021, 2021a.
Wang, X., Jacob, D. J., Downs, W., Zhai, S., Zhu, L., Shah, V., Holmes, C. D., Sherwen, T., Alexander, B., Evans, M. J., Eastham, S. D., Neuman, J. A., Veres, P. R., Koenig, T. K., Volkamer, R., Huey, L. G., Bannan, T. J., Percival, C. J., Lee, B. H., and Thornton, J. A.: Global tropospheric halogen (Cl, Br, I) chemistry and its impact on oxidants, Atmos. Chem. Phys., 21, 13973–13996, https://doi.org/10.5194/acp-21-13973-2021, 2021b.
Yeoman, A., Heeley-Hill, A., Shaw, M., Andrews, S., and Lewis, A.: Inhalation of VOCs from facial moisturizers and the influence of dose proximity, Indoor Air, 32, https://doi.org/10.1111/ina.12948, 2022.
Zhang, Y., Liu, R., Yang, D., Guo, Y., Li, M., and Hou, K.: Chemical ionization mass spectrometry: Developments and applications for on-line characterization of atmospheric aerosols and trace gases, Trac-Trend. Anal. Chem., 168, https://doi.org/10.1016/j.trac.2023.117353, 2023.