the Creative Commons Attribution 4.0 License.
the Creative Commons Attribution 4.0 License.
 | 08 May 2026
Ground-based monitoring of nitrogen dioxide in Kumasi, Ghana, and its comparison with satellite observations
Benjamin Afotey
Tim Henrik Eckert
Magdalena Mairhofer
Águeda Gil Pascual
Emmanuel Yuorkuu
Philip Darko
Phiona Amakah
Klaas Folkert Boersma
Prince Junior Asilevi
Air pollution poses an increasing public health risk in many African cities, where systematic monitoring is limited by the high cost of reference-grade instrumentation. Satellite-based sensors such as TROPOMI on Sentinel-5P provide global coverage of atmospheric pollutants, including nitrogen dioxide (NO2), but their limited vertical resolution complicates the estimation of surface-level concentrations.
Palmes diffusion tubes offer a low-cost, low-tech alternative for measuring NO2 at the ground level. Combining satellite observations with data from ground-based diffusion tubes presents a promising approach for generating regional air quality maps, particularly in resource-limited settings. This study reports on the implementation of a pilot network of Palmes tubes in Kumasi, Ghana. To ensure sustainability and scalability, a local air quality laboratory was established to prepare and analyse the tubes using locally sourced materials and equipment.
Validation against tubes prepared and analysed by an accredited external laboratory demonstrated satisfactory agreement. Measurements from March 2025 revealed a wide range of NO2 concentrations, from an average of 7 µg m−3 in residential areas away from traffic and industry to peak values of 88 µg m−3 at heavily trafficked intersections – substantially exceeding the WHO 2021 guideline limits of 25 µg m−3 for 24 h exposure and 10 µg m−3 for annual mean concentrations.
Averaged satellite data showed the accumulation of NO2 plumes downwind of the city, though the relationship with surface-level measurements remains complex and needs further investigation. Column-to-surface ratios in Kumasi are significantly lower than those typically observed in European cities. Using a parametrization method based on ground-based measurements and TROPOMI retrievals, we find that TROPOMI underestimates tropospheric NO2 column densities by roughly a factor of 2.5 in March 2025. This underestimation is attributed to higher aerosol loading over Ghana, which reduces retrieval sensitivity in the troposphere and increases reliance on unrepresentative a priori profiles.
- Article
(8972 KB) - Full-text XML
- BibTeX
- EndNote


Ambient air pollution, in combination with household air pollution, is recognized by the World Health Organization (WHO) as a major global health threat, contributing to an estimated 6.7 million premature deaths each year. These deaths are primarily attributed to chronic health conditions such as cardiovascular diseases, respiratory disorders, and lung cancer, all of which reduce life expectancy (WHO, 2023).
Among the major air pollutants, nitrogen dioxide (NO2) is of particular concern (Wang et al., 2024). It is primarily produced through high-temperature combustion processes (Koziel et al., 2024), including emissions from vehicles, power generation, industrial operations, and various forms of biomass and waste burning (Huang et al., 2015; Qi et al., 2024; Chong et al., 2024). Prolonged exposure to elevated NO2 levels has been associated with respiratory illnesses such as bronchitis and emphysema, as it irritates the mucous membranes in the respiratory tract (Dons et al., 2018; Kim et al., 2020; Filonchyka and Peterson, 2025). Nitrogen oxides (NOx) are not only a precursor of particulate matter, but also play a key role in atmospheric photochemical reactions that produce tropospheric ozone (O3) (Strížik et al., 2016; Jin et al., 2023; Chameides et al., 1994), a pollutant which is also linked to respiratory diseases, especially aggravation of asthma in asthmatic patients (De Vries, 2021).
Beyond its impacts on human health, NO2 also contributes to environmental degradation. High concentrations have adverse impacts on the growth of vegetation and agricultural crops through acid rain, and which may lead to reductions in crop yield in high concentration areas (Van der Eerden and Duym, 1988).
In line with broader demographic trends across the African continent, Ghana – one of West Africa's leading economies – has undergone rapid population growth, with its population rising from approximately 25 million in 2010 to an estimated 35 million by 2025 (UN DESA, 2024). During the same period, the urbanization degree increased from 50 % to 59 %. This rapid urban expansion, coupled with growing transportation and industrial activity, has likely led to increasing levels of air pollution, particularly in urban centres.
According to WHO (2025) health statistics, stroke, ischemic heart disease, and lower respiratory infections are among the leading causes of death in Ghana – conditions that are strongly linked to long-term exposure to air pollution. To better understand and address these health burdens, localized and reliable data on air pollutant concentrations is urgently needed.
Continuous monitoring of ambient NO2 is essential to inform effective policy and public health responses (Takte et al., 2023; Ling et al., 2025). Dense measurement networks are preferred (Bi et al., 2020; Gao et al., 2015; Huang et al., 2022; Schneider et al., 2017; Fua et al., 2023) as concentrations vary strongly over space, especially near emission sources such as traffic and industrial zones. Globally, thousands of regulatory air quality monitoring stations (AQMs) provide NO2 data on hourly basis. However, the high costs of establishing and maintaining these stations limit their deployment, even in high-income countries. To the best of our knowledge, apart from the South African Air Quality Information System (Gwaze and Mashele, 2018), there are currently no other operational AQMs openly reporting NO2 measurements in Sub-Saharan Africa (OpenAQ, 2025).
Alternatively, air pollution levels can be measured using low-cost air quality sensors (LCSs). Most active LCSs for NO2, however, rely on electrochemical sensing elements, which are susceptible to cross-sensitivity with other reactive gases and are strongly influenced by temperature and humidity (Li et al., 2021; WMO, 2024). Their sensitivity can drift over the course of only few weeks (Mijling et al., 2018), necessitating a regular recalibration strategy – ideally performed alongside an AQM.
Passive samplers, such as Palmes diffusion tubes (PDTs), have been in use since 1976 (Palmes et al., 1976). These cost-effective devices are widely employed by environmental agencies to monitor NO2, particularly in areas that are otherwise undersampled (Medlanda et al., 2025). PDTs have also been used in citizen science monitoring campaigns across Europe, for example to measure local air quality and evaluate the street canyon effect in the city of Antwerp, Belgium (Voordeckers et al., 2021). Their low-cost and low-tech nature makes them also well-suited for continuous monitoring across the African continent. Although passive samplers have been deployed in temporary monitoring campaigns in cities such as Accra, Ghana (Wang et al., 2022), reliance on remote (often foreign) laboratories for the preparation and analysis of the samplers has posed a significant barrier to sustained, long-term monitoring.
To address this limitation, this study presents the development and first deployment of a locally managed and operated air quality laboratory at Kwame Nkrumah University of Science and Technology (KNUST) in Kumasi, Ghana's second-largest city. The facility enables local preparation, deployment, and analysis of NO2 diffusion tubes, supporting sustainable, cost-effective, and regionally scalable air quality monitoring.
In-situ measurements of NO2 are essential for a better interpretation of satellite-based measurements. Polar-orbiting satellite instruments such as TROPOMI use remote-sensing techniques to determine column densities of NO2 worldwide. However, without ground-based validation, the relationship between these column measurements and surface-level concentrations remains uncertain. In one of the few validation studies for sub-Saharan tropical cities, Yombo Phaka et al. (2023) show that incorrect a priori profile information in the TROPOMI retrievals leads to significant underestimation of the NO2 column densities over Kinshasa. Local measurements improve understanding of how satellite data should be interpreted in this part of the world, thereby enabling meaningful monitoring of regional surface concentrations from space.
The remainder of this paper is organized as follows: Sect. 2 describes the materials and methods used, including details of the diffusion tube deployment, laboratory procedures, and data analysis techniques. Section 3.2 presents the first in-situ NO2 measurement campaign conducted in Kumasi. Section 3.3 evaluates the performance of the KNUST laboratory in comparison to an accredited reference lab. Finally, Sect. 4 compares the ground-level measurements with satellite-derived NO2 columns to explore potential synergies for regional monitoring.
2.1 Palmes diffusion tubes
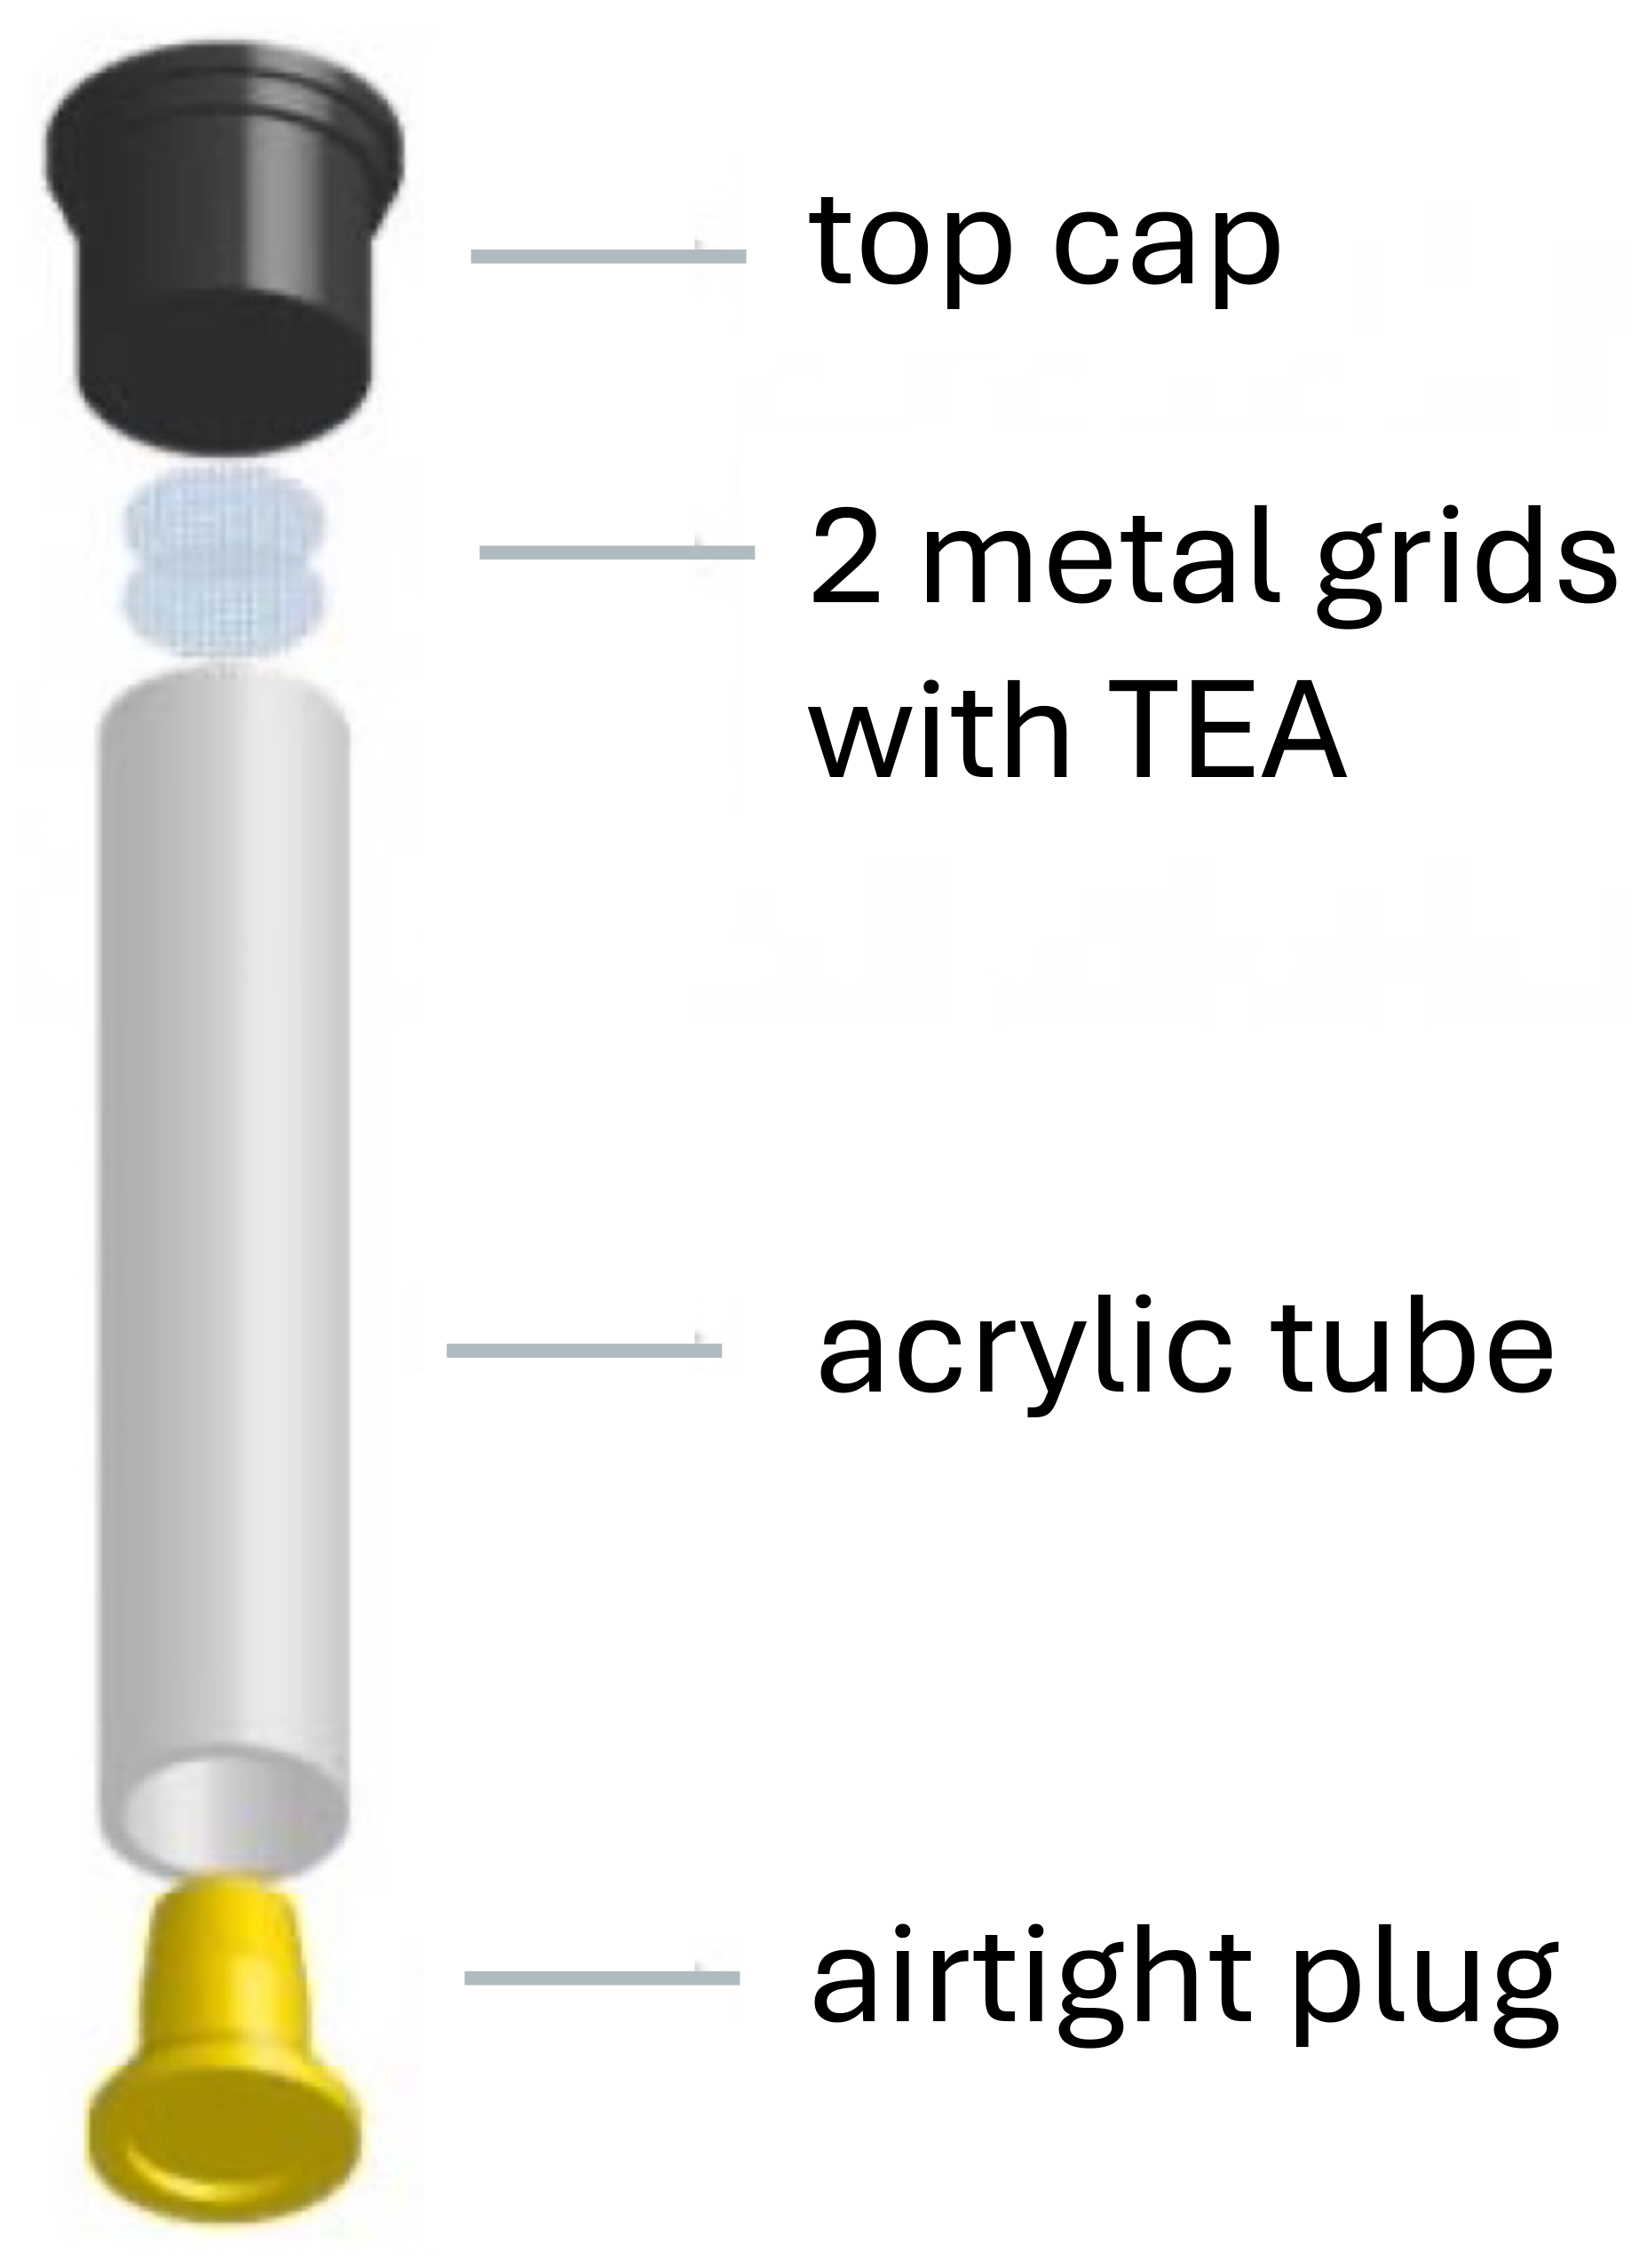
The measurement principle of a Palmes tube (Fig. 1) is based on molecular diffusion. The tube contains two fine stainless-steel grids impregnated with triethanolamine (TEA), a reagent that chemically binds NO2 upon contact, forming nitrite (NO). Diffusion takes place as there is a concentration difference between the open bottom of the tube (at ambient NO2 concentration) and the closed top (at zero concentration). After exposure, the tube is sealed and brought to the laboratory, where the accumulated nitrite on the grids is quantified through chemical analysis. This mass is then used to calculate the average ambient NO2 concentration at the sampling site over the exposure period. Due to the slow diffusion rate, PDTs are typically deployed for a four-week sampling duration. Shorter intervals, such as two weeks, are feasible but result in an increased measurement uncertainty.
2.2 Kumasi NO2 monitoring network
Kumasi is the capital of the Ashanti Region in southern Ghana and serves as a major metropolitan and commercial hub. As of 2024, the city has an estimated population of approximately 3.5 million, making it the second-most populous city in Ghana. Geographically, Kumasi is situated at approximately 6.69° N latitude and 1.62° W longitude, at an elevation of about 250 to 300 m above sea level. The city experiences a tropical rainforest climate, characterized by high humidity and relatively stable temperatures throughout the year, ranging between 21 and 31 °C. Kumasi has a bimodal rainfall pattern, with major rains typically occurring from March to July, and a shorter rainy season from September to November. Annual rainfall averages between 1300 and 1500 mm. The dry season, associated with the Harmattan winds, usually spans December to February, though residual precipitation may occur.
We strategically selected 20 monitoring sites across Kumasi to capture the spatial variability of NO2 pollution, such as high-traffic areas around marketplaces, health-sensitive zones such as hospitals, major industrial locations, and some urban background areas (Table 1). This categorization was intended to reflect the range of anthropogenic activities contributing to NOx emissions within the city and to assess potential exposure risks to different population groups. The location and classification of the sites is shown in Fig. 2.
Table 1Sites in Kumasi where Palmes diffusion tubes were deployed along with their coordinates.
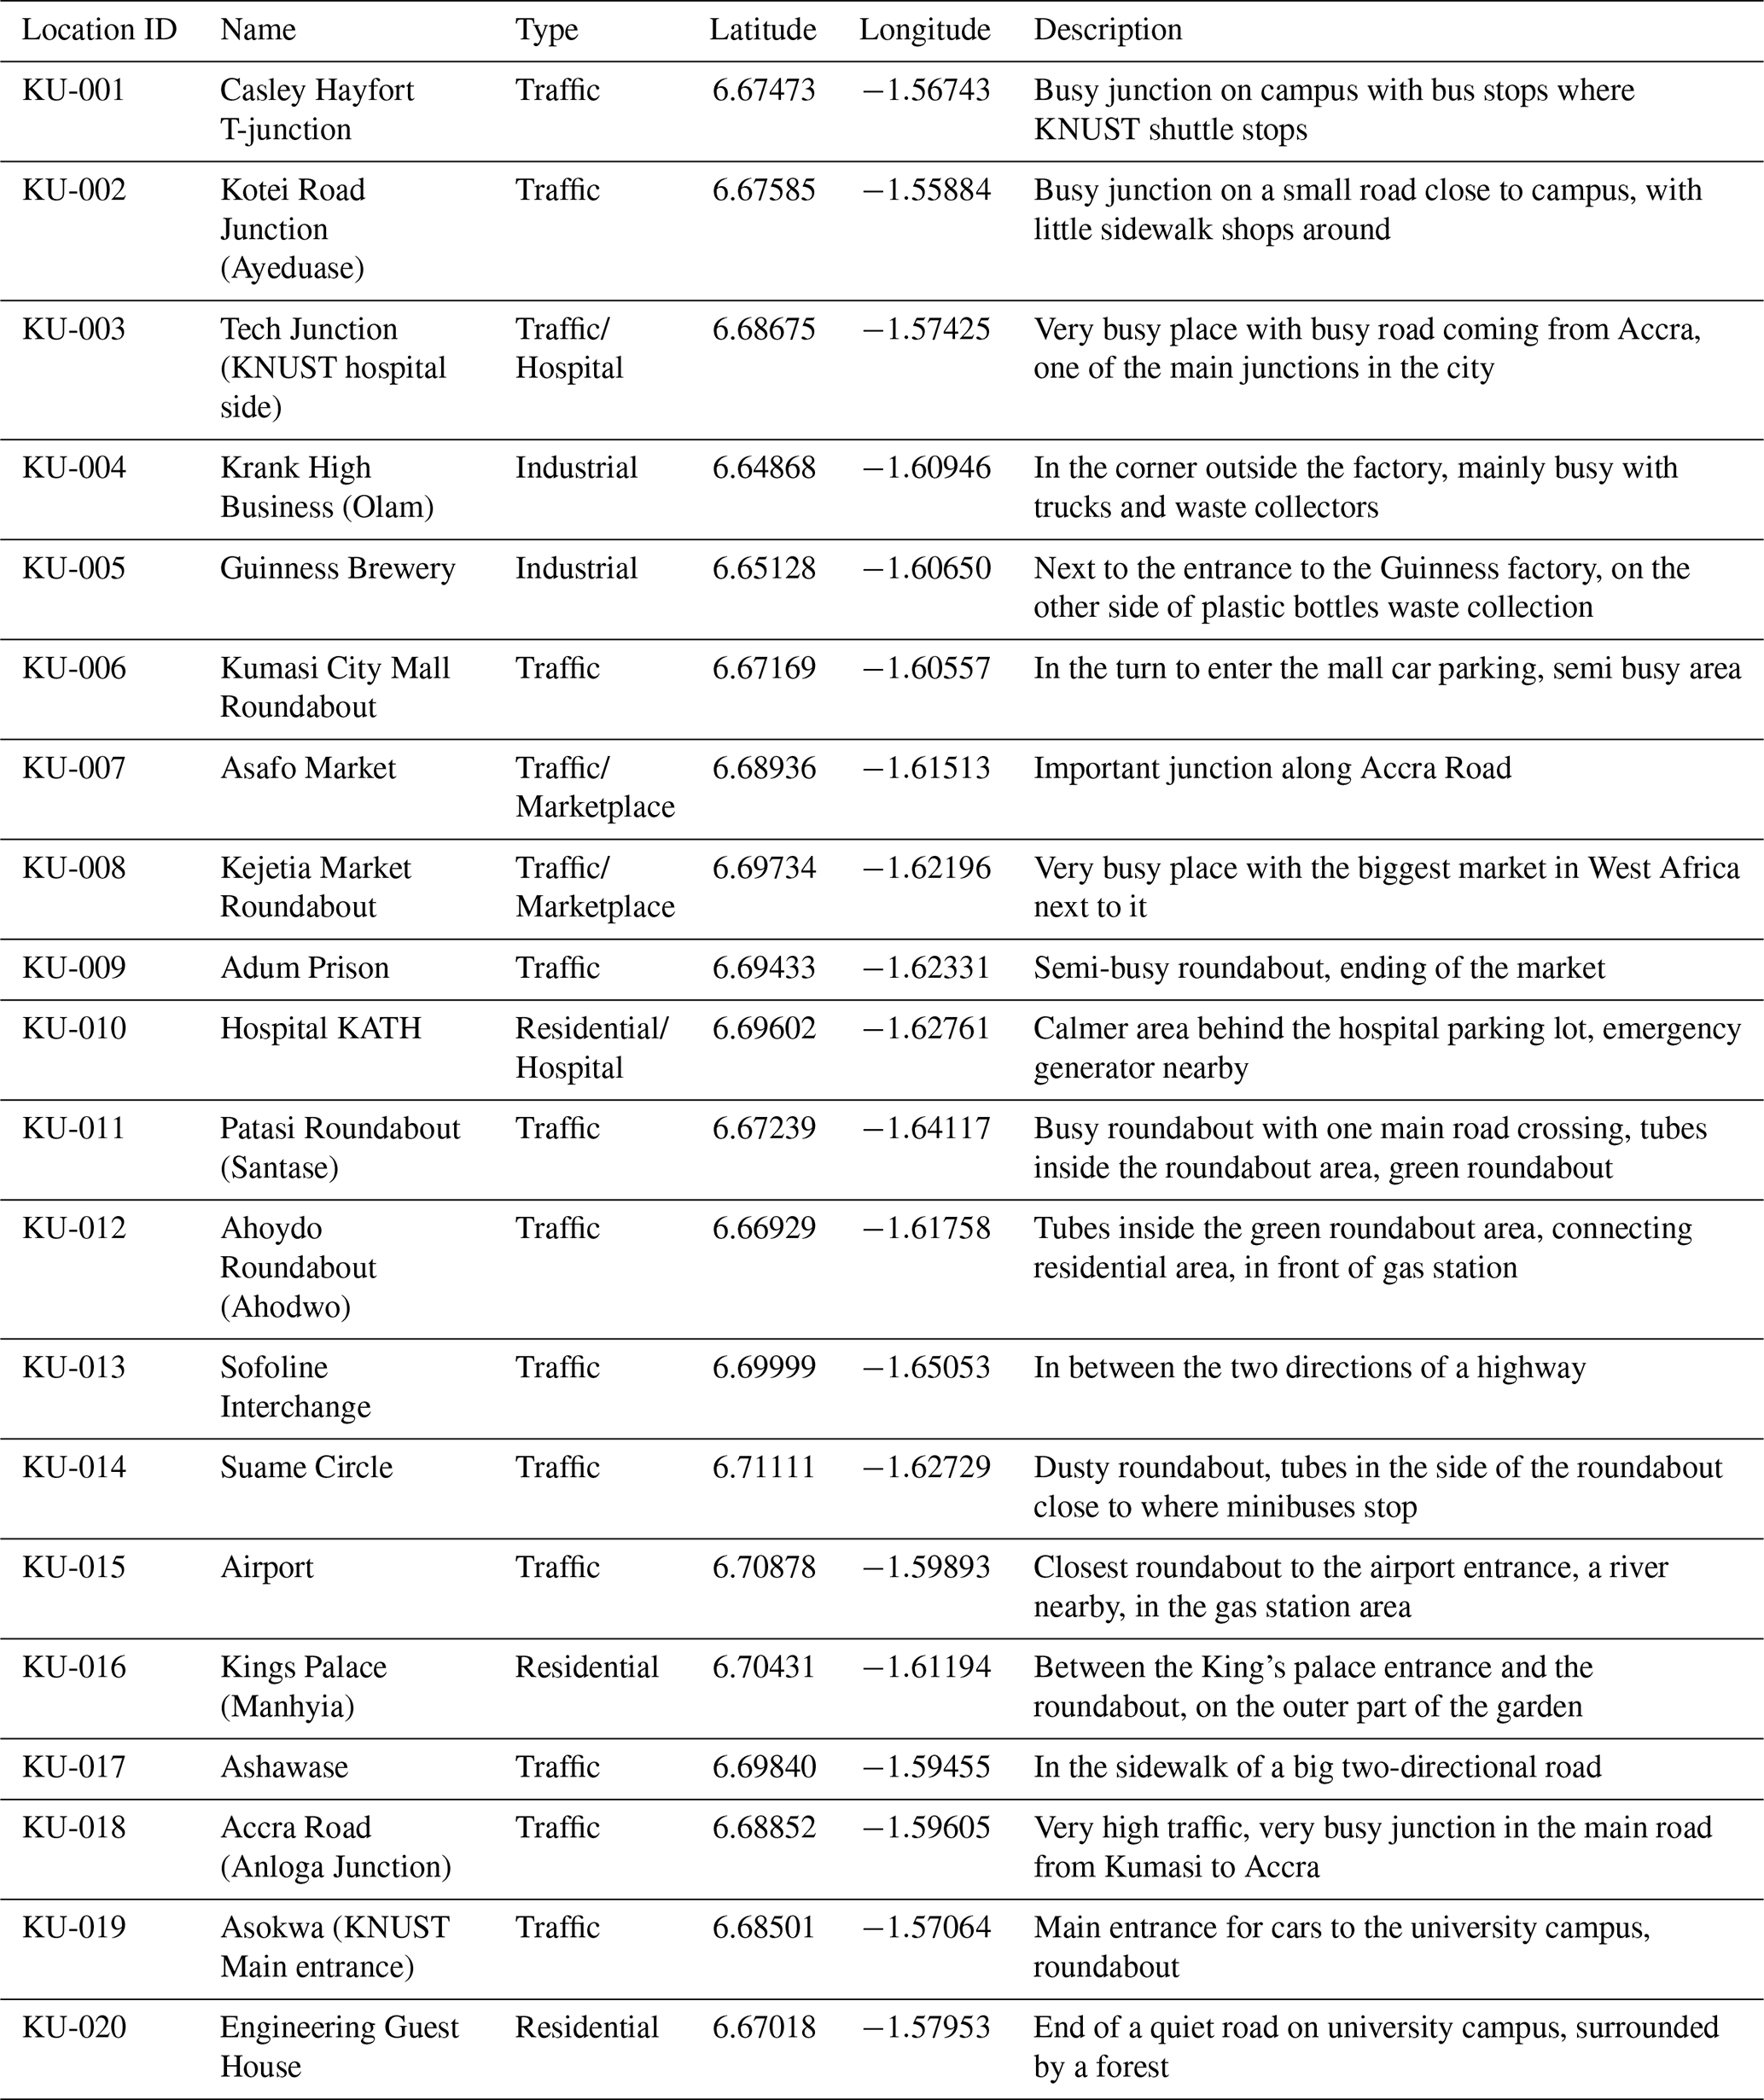
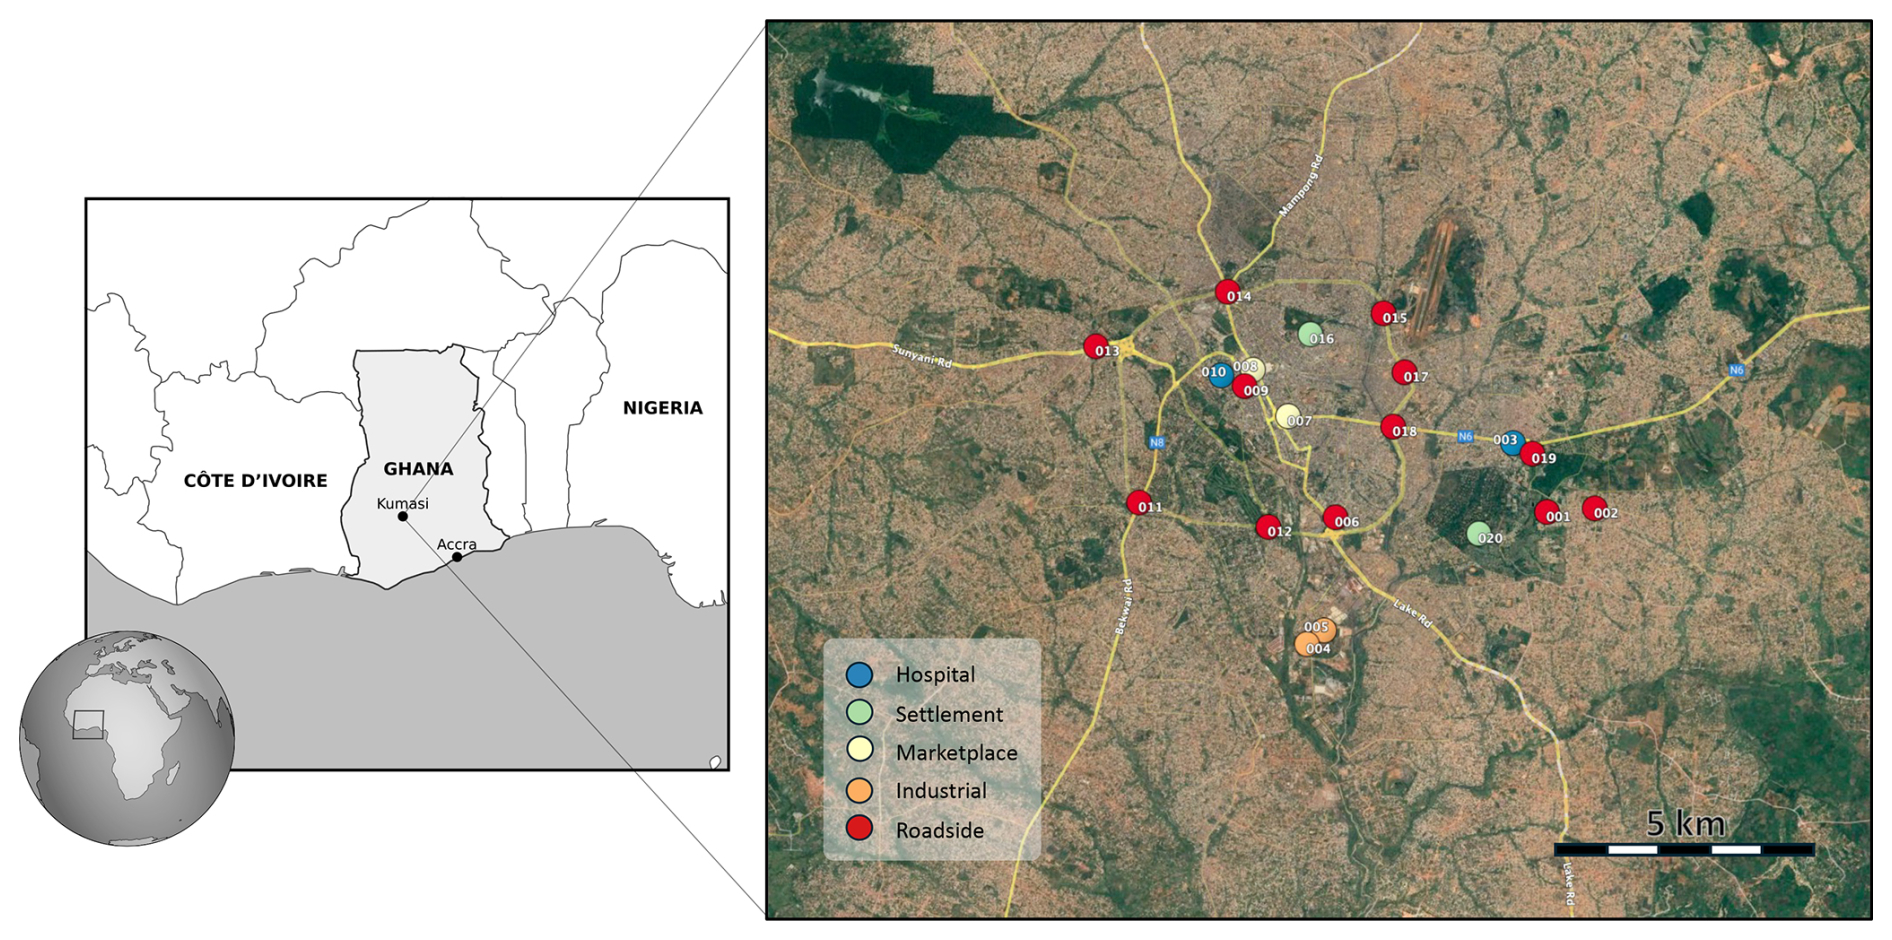
Figure 2Network locations and their classification within the city of Kumasi, Ghana. Satellite basemap taken from Google Maps © 2025 Google. Map accessed November 2025.
2.3 Creation of a local air quality laboratory
The objective was to establish the first independent, locally operated air quality (AQ) laboratory in Kumasi, capable of preparing and analysing diffusion tubes without dependence on foreign laboratories. The lab was designed with a focus on simplicity and economy – minimizing the use of costly equipment and consumables and avoiding complex analytical techniques.
The methodology for PDT preparation, deployment, and analysis followed the best practices outlined by Targa and Loader (2008), which served as the foundation for the lab's protocols. These guidelines were adapted as needed to suit local conditions (see Sect. 2.3.1 and 2.3.2).
The laboratory was developed collaboratively by three teaching assistants from the Chemical Engineering Department at KNUST and three master's students from the Faculty of Industrial Design Engineering at TU Delft, Netherlands. A comprehensive lab manual was created (published as Eckert et al., 2025) detailing all procedures step by step. This manual, along with instructional videos, now forms the core training resource for new local staff.
A Hach DR5000 spectrophotometer was donated by the Utrecht University, Netherlands. A 10 g bottle of N-(1-naphthyl) ethylenediamine dihydrochloride (NEDA) was imported to Ghana, which is sufficient for extended use. All other chemicals could be sourced locally. Tube holders were made from two pieces of wood (around 20 cm long) nailed together in an L-shape, see Fig. 4. The top part has 2 cm diameter holes to accommodate the tubes. The lower part, mounted to the poles, includes two holes for zip ties to secure it to a pole at the measurement site.
2.3.1 Diffusion tube preparation
Before assembling and preparing the diffusion tubes, all components undergo thorough cleaning to minimize the risk of cross-contamination. The cleaning process involves washing the parts with soap and warm water, followed by immersion in a 10 % hydrochloric acid (HCl) solution to remove any remaining residues or contaminants. The components are rinsed thoroughly with deionised water to eliminate any traces of the acid or impurities.
Once cleaned and dried, the stainless-steel grids are coated with the sticky TEA solution. This coating can be applied using one of two methods. In the pipetting method, a solution of 20 % TEA in deionised water is used, with approximately 50 microlitres of TEA solution applied to each tube. Alternatively, the dipping method involves immersing the grid in a TEA solution mixed with 50 % acetone. The grids are thoroughly mixed in the solution and then air-dried on an absorbent surface (paper towel) to allow the coating to adhere properly.
2.3.2 Diffusion tube analysis
After exposure, the batch of collected samples are analysed at the laboratory. The procedure involves three main steps: (1) extraction of nitrite from the coated grids of the exposed tubes using Saltzman/Griess reagents as colorimetric reagents, (2) spectrophotometric analysis of the resulting solution to quantify the mass of nitrite formed, and (3) calculation of the average ambient concentration of NO2 based on the amount of nitrite detected (absorbance at 542 nm) and the known exposure duration.
First, 3 mL of Griess reagent is added to the grids of each test tube to extract the nitrite and facilitate colour development. The Griess reagent is prepared by mixing equal volumes of two solutions: 0.14 mg L−1 NEDA, and 0.02 g L−1 sulphanilamide solution. This solution was prepared by dissolving sulphanilamide in 95 % () deionized water and 5 % () hydrochloric acid (37 % concentrated HCl).
Before analysing a new batch of samples, and after preparing fresh reagent, a calibration curve is established to define the relationship between absorbance and nitrite mass. This involves measuring the colour development (colourification) of standard sodium nitrite (NaNO2) solutions at known concentrations. The absorbance of each standard solution is recorded at 542 nm using a spectrophotometer. The calibration always includes a blank (zero standard) to correct for any offset.
Once the calibration curve is constructed, the absorbance values of the extracted diffusion tube samples can be used to determine the amount of nitrite formed during exposure.
2.3.3 Calculation of ambient NO2 concentration
The average temperature and pressure during exposure is needed in the calculation of the ambient NO2 concentration from the nitrite mass. The following formula is used:
here, C is the average concentration of NO2 during the measurement (in µg m−3) at reference temperature Tref (293 K) and reference pressure Pref (1013 hPa). ms is the mass of nitrite in the sample measured in the laboratory (μg), and mb is the mass of nitrite measured in a blank sample in the laboratory (µg). The blank sample is taken from the same batch of tubes but has not been exposed to the environment. T and P represent the average temperature and atmospheric pressure at the measurement location in Kelvin and hPa, respectively. t is the exposure time, i.e. the time between opening and closing the sampling tubes (s). θ is the sampling uptake rate (m3 s−1), determined by diffusion in the tube:
D is the diffusion coefficient of NO2 (m2 s−1), A is the cross-sectional area of the tube ( m2), and L is the length of the tube ( m). D is temperature-dependent and is calculated from a reference diffusion coefficient Drefd ( m2 s−1 at 298 K) using:
where T is again the average temperature at the measurement location (in K). Trefd is the reference temperature (here 298 K), and n=1.81 is the empirical best fit for NO2 in air (Massman, 1998).
2.4 Satellite observations
TROPOMI is a nadir-viewing imaging spectrometer aboard the Sentinel-5P satellite (Veefkind et al., 2012). Launched in October 2017, it is orbiting the Earth in a sun-synchronous orbit at an altitude of approximately 800 km. The overpass time is around 13:30 local solar time.
The chemical composition of the atmosphere is obtained from hyperspectral measurements of sunlight backscattered by Earth's atmosphere. From the position and depth of the absorption lines the column density of trace gases like NO2 can be determined (e.g. van Geffen et al., 2020). The retrieval algorithm converts the so-called slant column density into a total vertical column density and separates the total column density in a stratospheric and a tropospheric part.
The tropospheric column density Vtrop represents the total number of NO2 molecules contained within a vertical column with unit area in the troposphere. If n(l) represents the number density at height l, then the column density is given by
In practice, the satellite retrieval algorithm provides an estimate of this value. The retrieved column depends on how sensitive the measurement is to concentrations at different altitudes. This vertical sensitivity is described by the averaging kernel A(l), such that
The averaging kernel (AK) quantifies how a perturbation in the true (but unknown) atmospheric profile at height l affects the retrieved column (Eskes and Boersma, 2003). Values larger than 1 imply high sensitivity to that layer, while values near 0 indicate low sensitivity.
In discrete form, for an atmosphere divided into a finite set of layers, Eq. (5) becomes
where Vl represents the partial column density in layer l. The elements Al are calculated using a radiative transfer model that incorporates an a priori profile, scattering and absorption by clouds and surface, as well as observation-specific parameters such as the solar zenith angle and the instrument's viewing geometry.
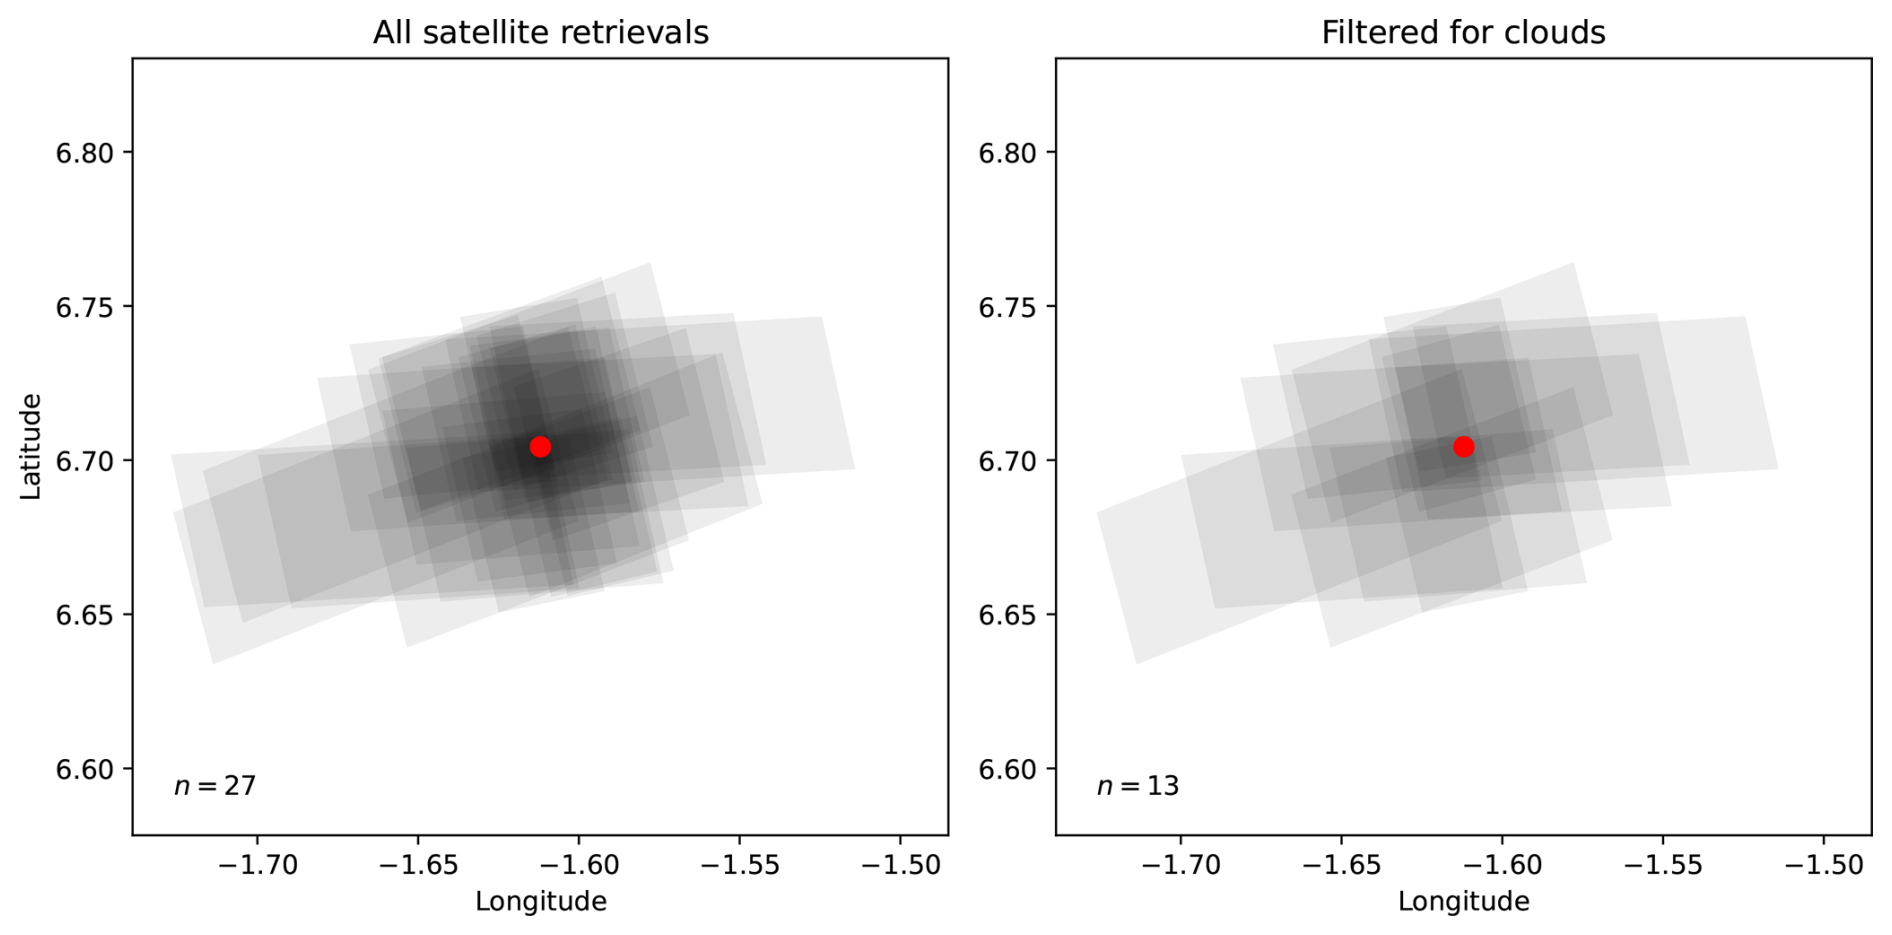
Figure 3Sampling of location KU-016 (red dot) by TROPOMI during the measurement campaign (7 March–3 April). The left panel shows all satellite footprints in this period for a 28×28 km2 area (n=27); the right panel shows only satellite footprints from valid retrievals under sufficiently cloud-free conditions (n=13).
We use the latest level-2 retrieval product for TROPOMI tropospheric NO2 column densities and their associated AKs, version 2.4 (Eskes et al., 2022; van Geffen et al., 2022), which can be downloaded at the Copernicus Data Space Ecosystem (https://dataspace.copernicus.eu/, last access: 13 April 2026). The averaging kernel calculation of the retrieval is based on a priori profiles from the global chemistry model TM5-MP (Williams et al., 2017), run at a 1°×1° spatial resolution.
Maps of average tropospheric column densities corresponding to the Palmes measurement period are created by stacking all footprints of retrievals marked with a quality value >0.75, i.e. valid retrievals with cloud radiance fraction below 50 %. Each overpass, a given location is sampled by a different satellite footprint, see Fig. 3. As larger footprints are less representative for the area, we take a weighted average of individual retrievals covering that location
taking weighting factor , with Ai representing the area of footprint i.
2.5 Kumasi measurement campaign
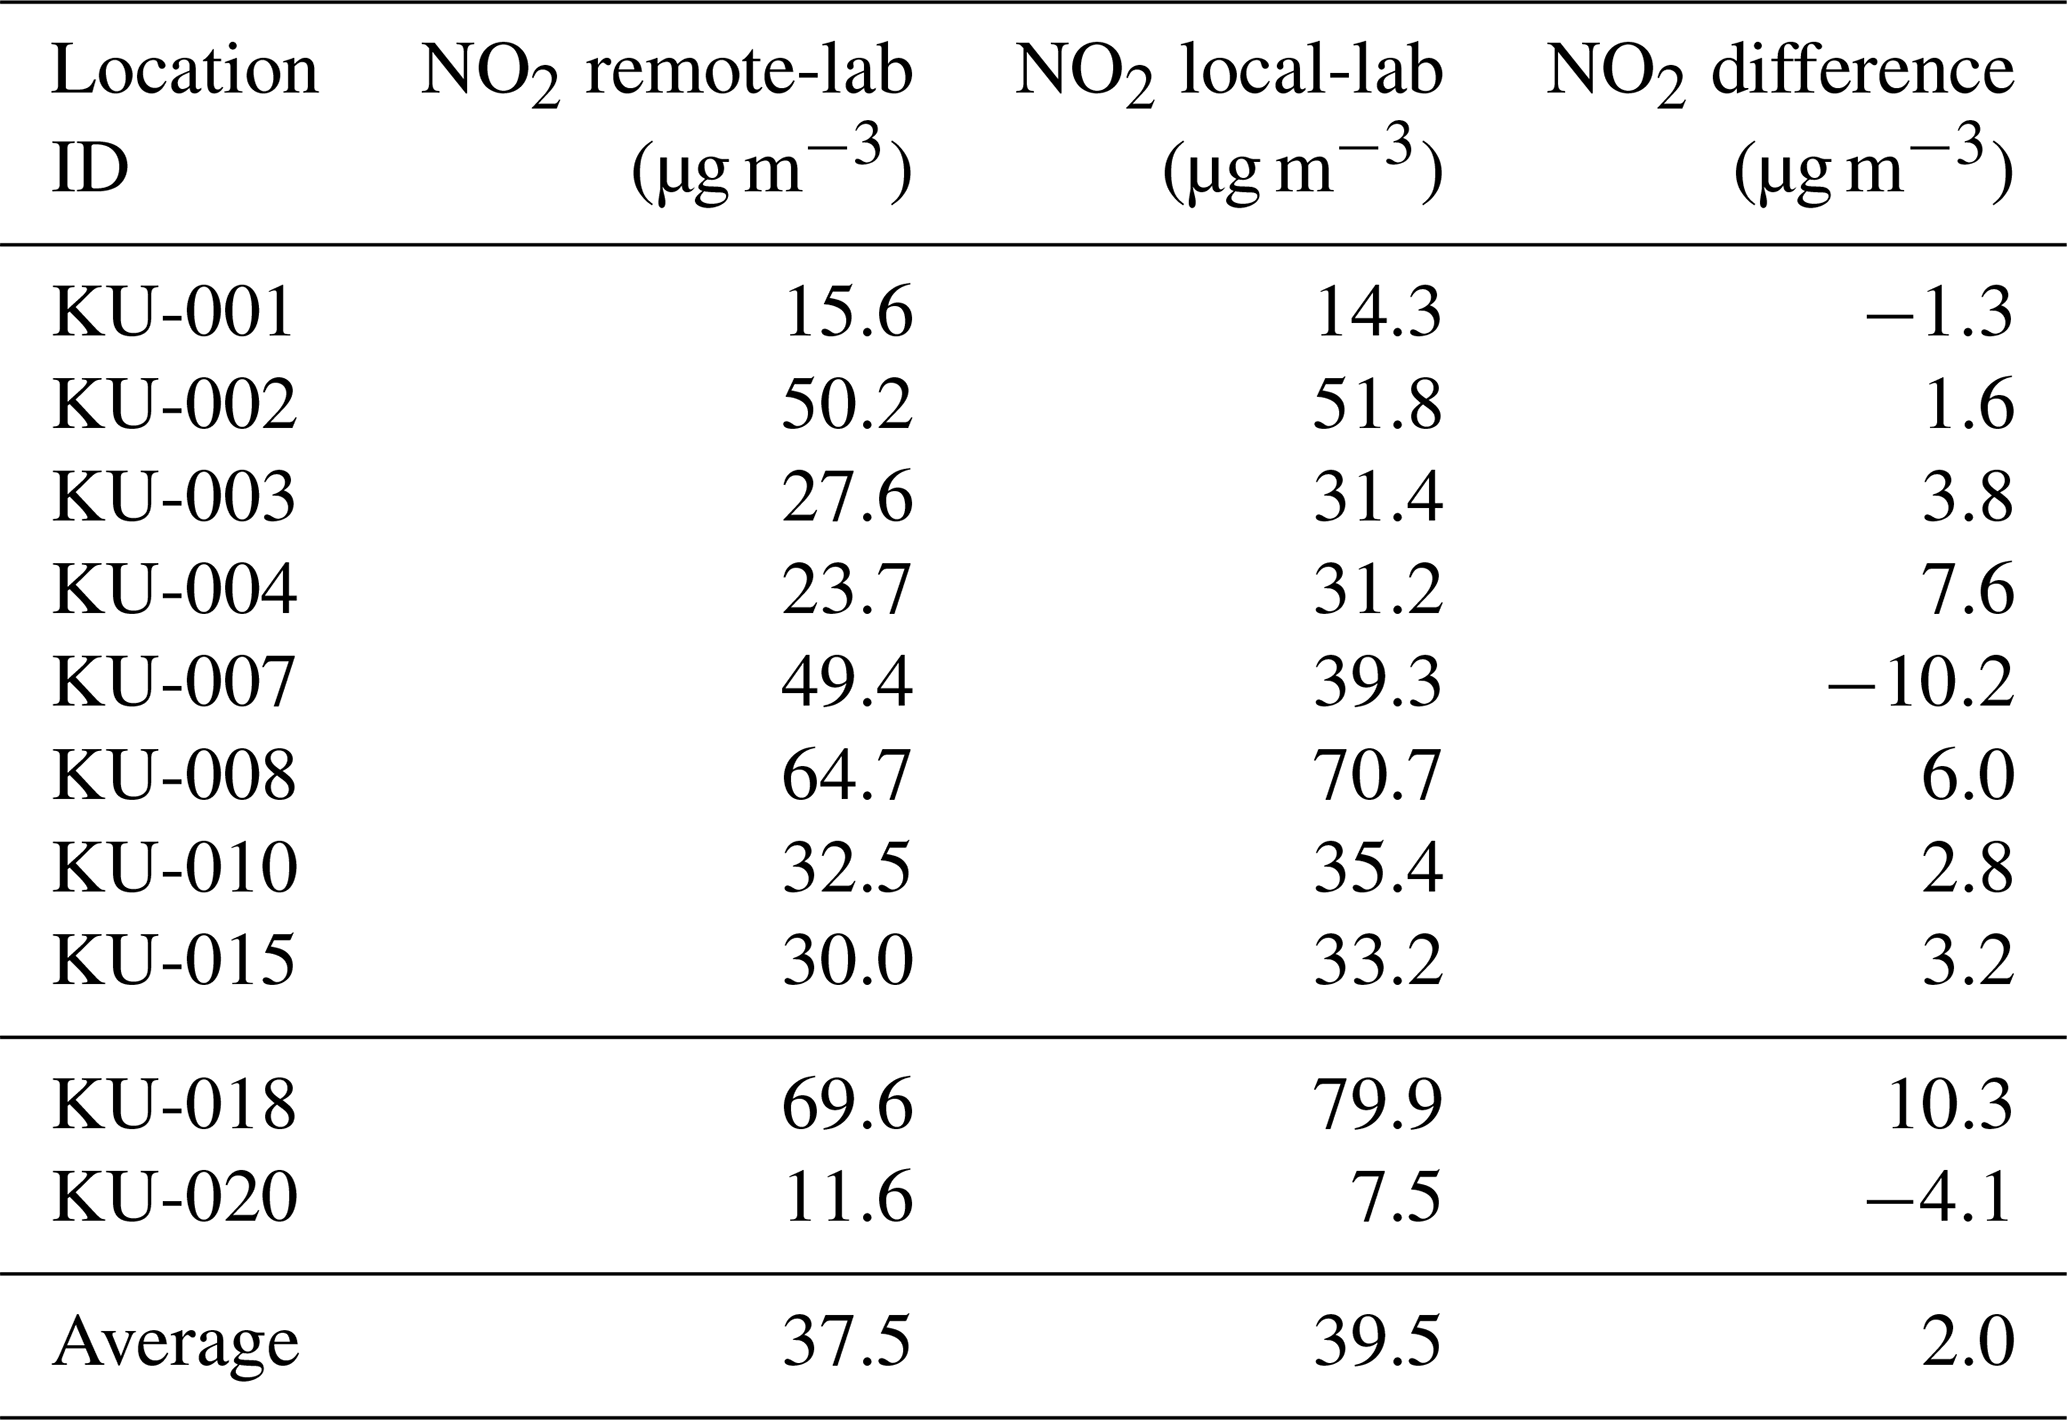
For the Kumasi measurement campaign, we used two batches of 50 tubes, prepared and analysed by Buro Blauw Luchtkwaliteit – an ISO 17025-accredited air quality laboratory based in Wageningen, the Netherlands. The tubes (referred to as “remote-lab tubes”) were prepared within two weeks prior to deployment and analysed within four weeks following exposure. In addition, 100 unprepared tubes of the same type and material were brought from Buro Blauw to Ghana. These were prepared and analysed at the newly established laboratory facility at KNUST (referred to as “local-lab tubes”). By conducting side-by-side measurements, the performance and reliability of the local laboratory could be evaluated (see Sect. 3.2). After use, the local-lab tubes were cleaned and recycled in subsequent measurement cycles.
To explore scalable solutions for Palmes networks in Ghana and other countries on the continent, we also tested diffusion tubes made from materials available at local markets. Development and validation of these locally made tubes is ongoing and will be presented in a separate study.
The tube holders were mounted on existing poles using tie wraps, positioned at a height of approximately 3.5 m (see Fig. 4). The remote-lab diffusion tubes were deployed across all 20 selected monitoring sites. To assess the precision of the method, duplicate (duplo) measurements were conducted at each location.
In addition, blank tubes were installed at 8 of the sites. These tubes were sealed (i.e., not exposed to ambient air) by keeping their end plugs in place. This allowed for the evaluation of potential degradation of the TEA coating over the course of the measurement period.
Table 2Meteorological data with mean temperature and pressure during the NO2 measurement cycles.
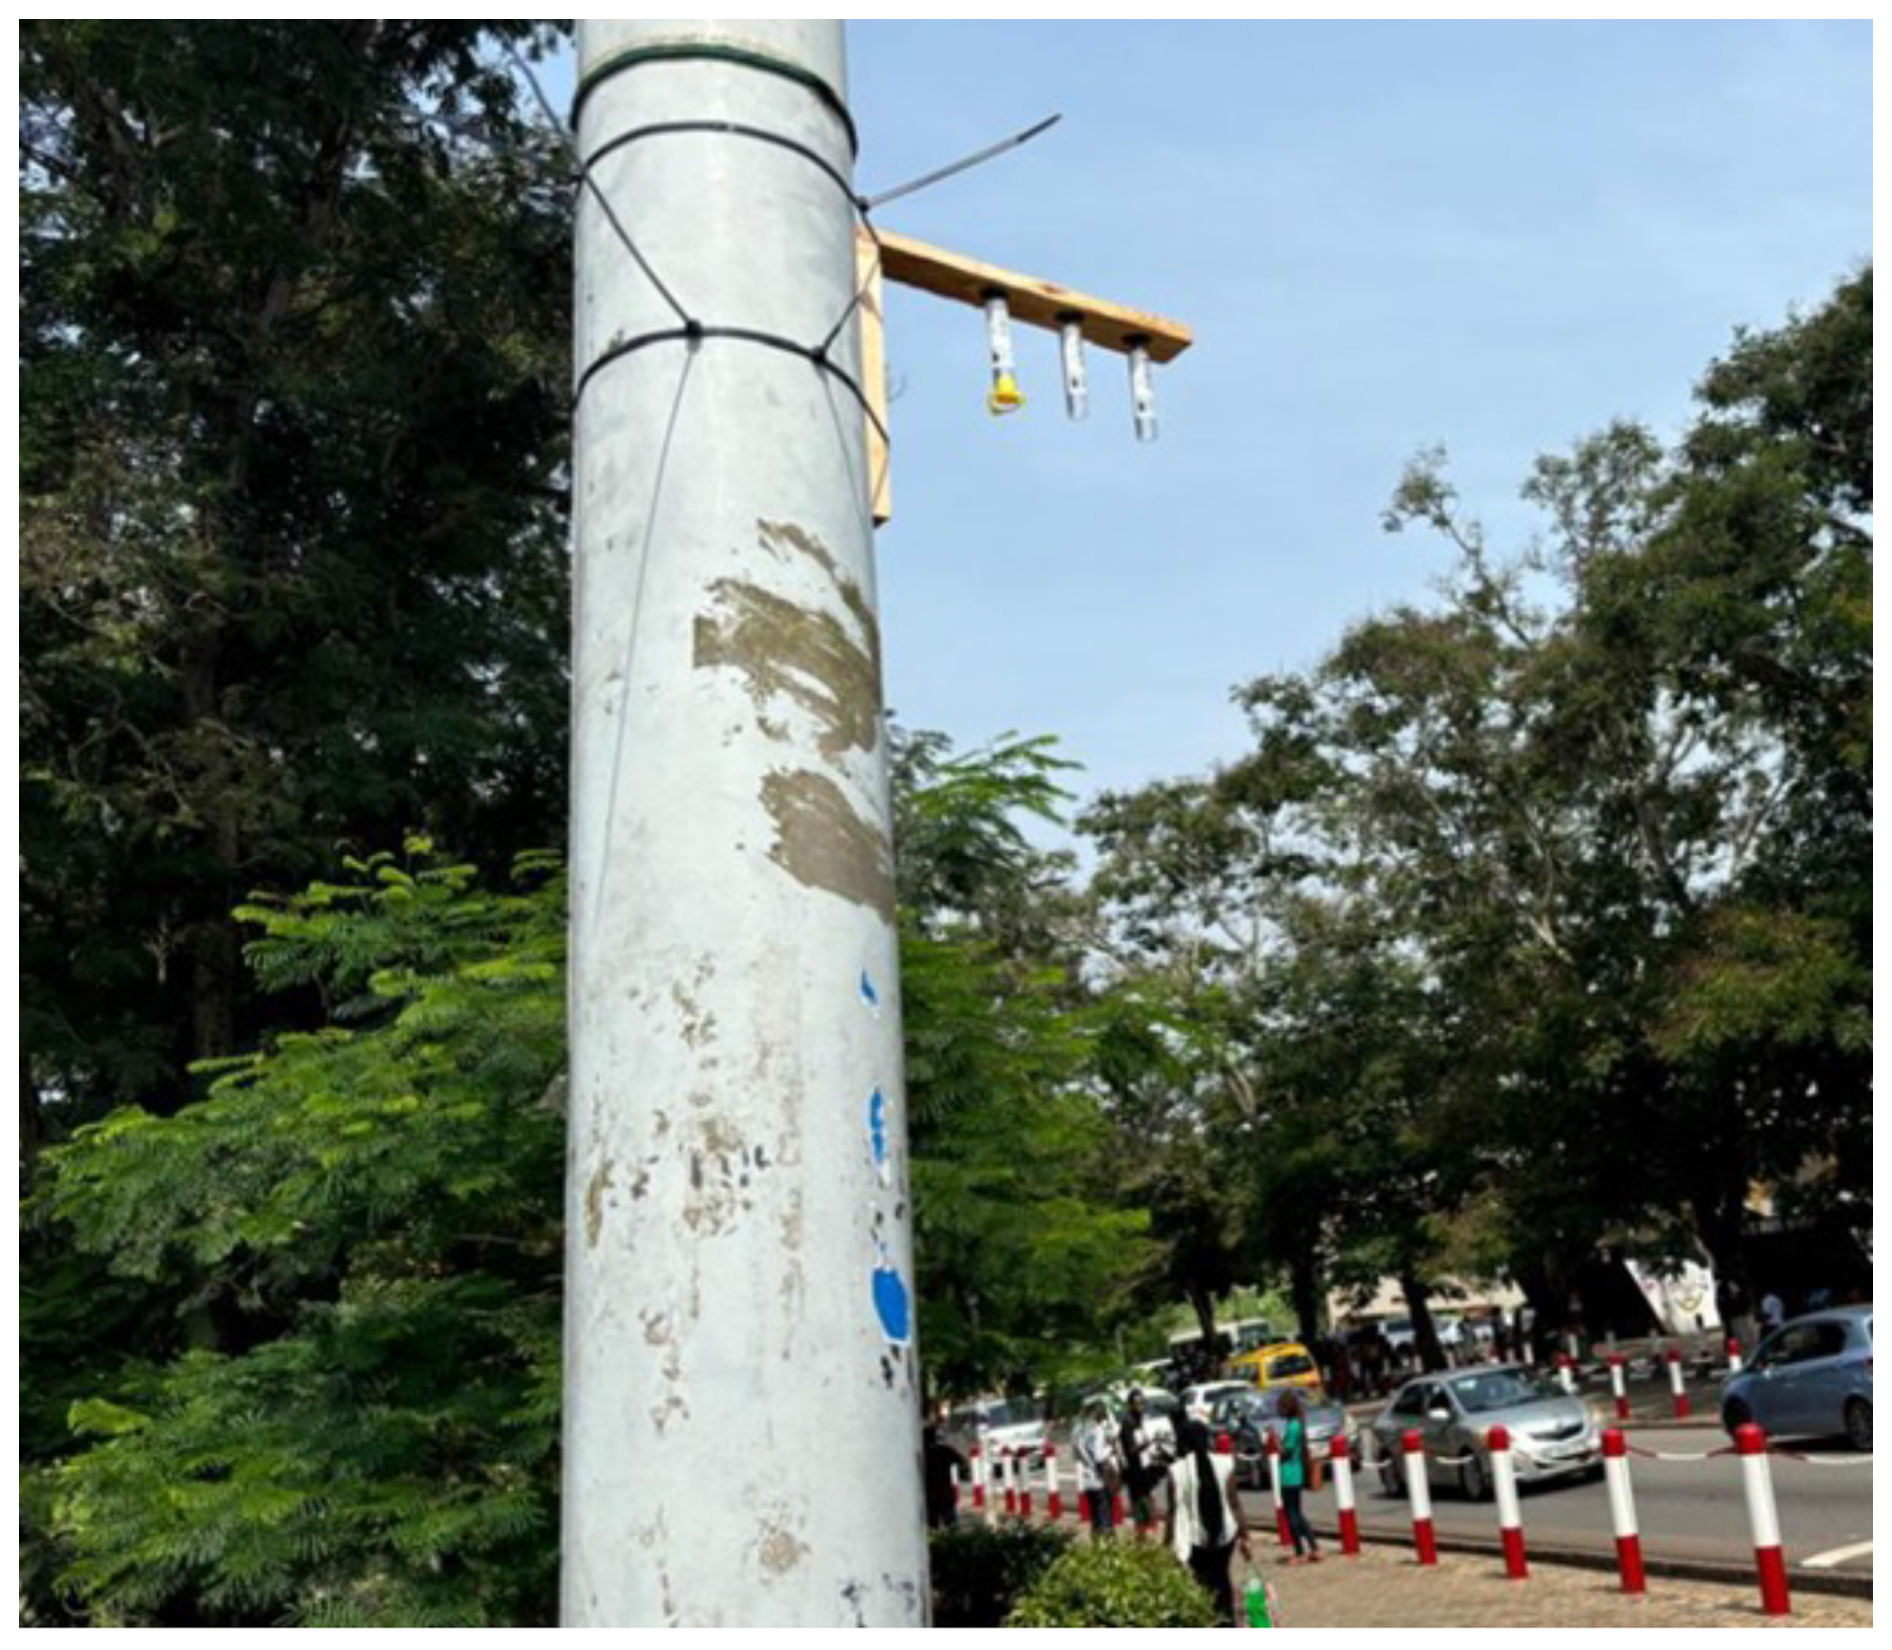
Figure 4Deployed Palmes diffusion tubes mounted on site: one blank sample and two tubes measuring in duplo.
The measurement campaign consisted of two sampling cycles, each lasting approximately two weeks (see Table 2). At the start of Cycle 1, remote-lab diffusion tubes were placed in tube holders mounted on signposts or lamp posts found at the 20 monitoring sites. At the end of Cycle 1, the tubes were retrieved and replaced with those designated for Cycle 2. For this cycle, additional local-lab tubes were deployed alongside the remote-lab tubes at 10 of the sites to enable side-by-side comparison. All tubes were successfully retrieved at the end of both cycles, with none missing. No insects or spiders were found inside. Following the recommendations of Targa and Loader (2008), the tubes were stored in a dark and, as much as possible, cool location both before and after deployment.
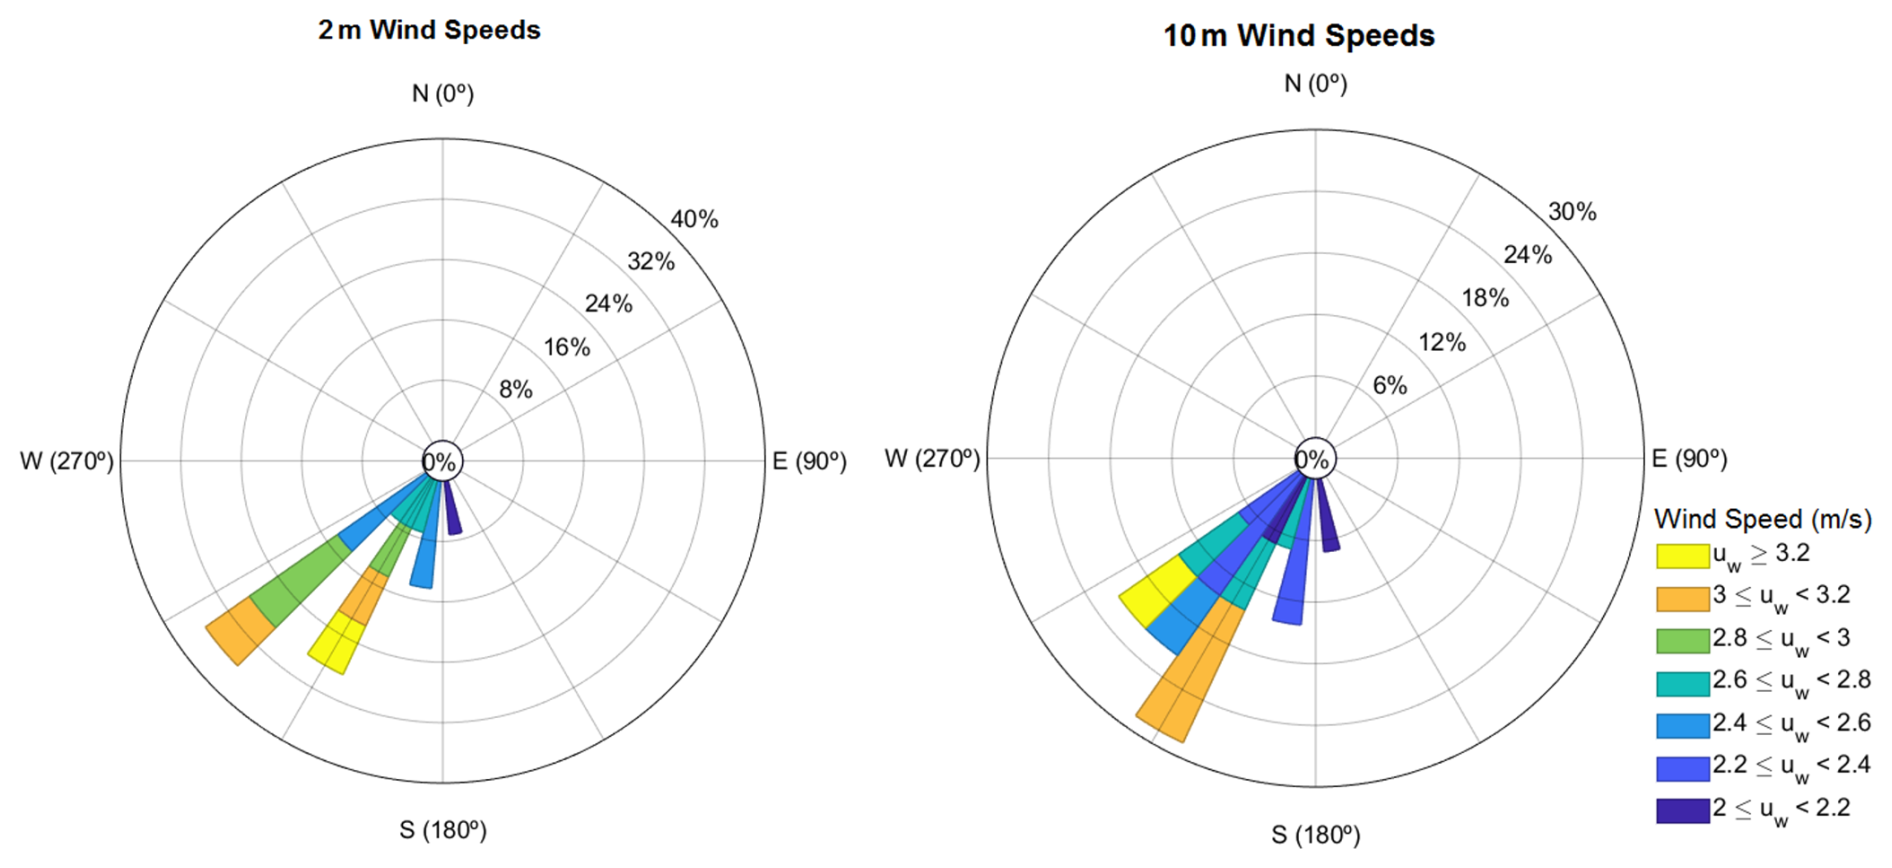
Historical hourly meteorological data for Kumasi Airport (287 m above sea level), obtained from Open Meteo's Historical Forecast API (https://open-meteo.com/en/docs/historical-forecast-api, last access: 13 April 2026), indicate that weather conditions were comparable across both sampling cycles. The average temperature during the measurement period was 28.3 °C, with an average surface pressure of 978 hPa (see Table 2). Prevailing winds in March were predominantly south-westerly, as illustrated by the wind roses in Fig. 5. Average wind speeds at 10 m were 6.8 and 6.2 km h−1 for Cycle 1 and 2, respectively. The total precipitation in Cycle 1 was 35 mm, accumulated in 35 rainy hours. The total precipitation in Cycle 2 was 114 mm, accumulated in 88 rainy hours.
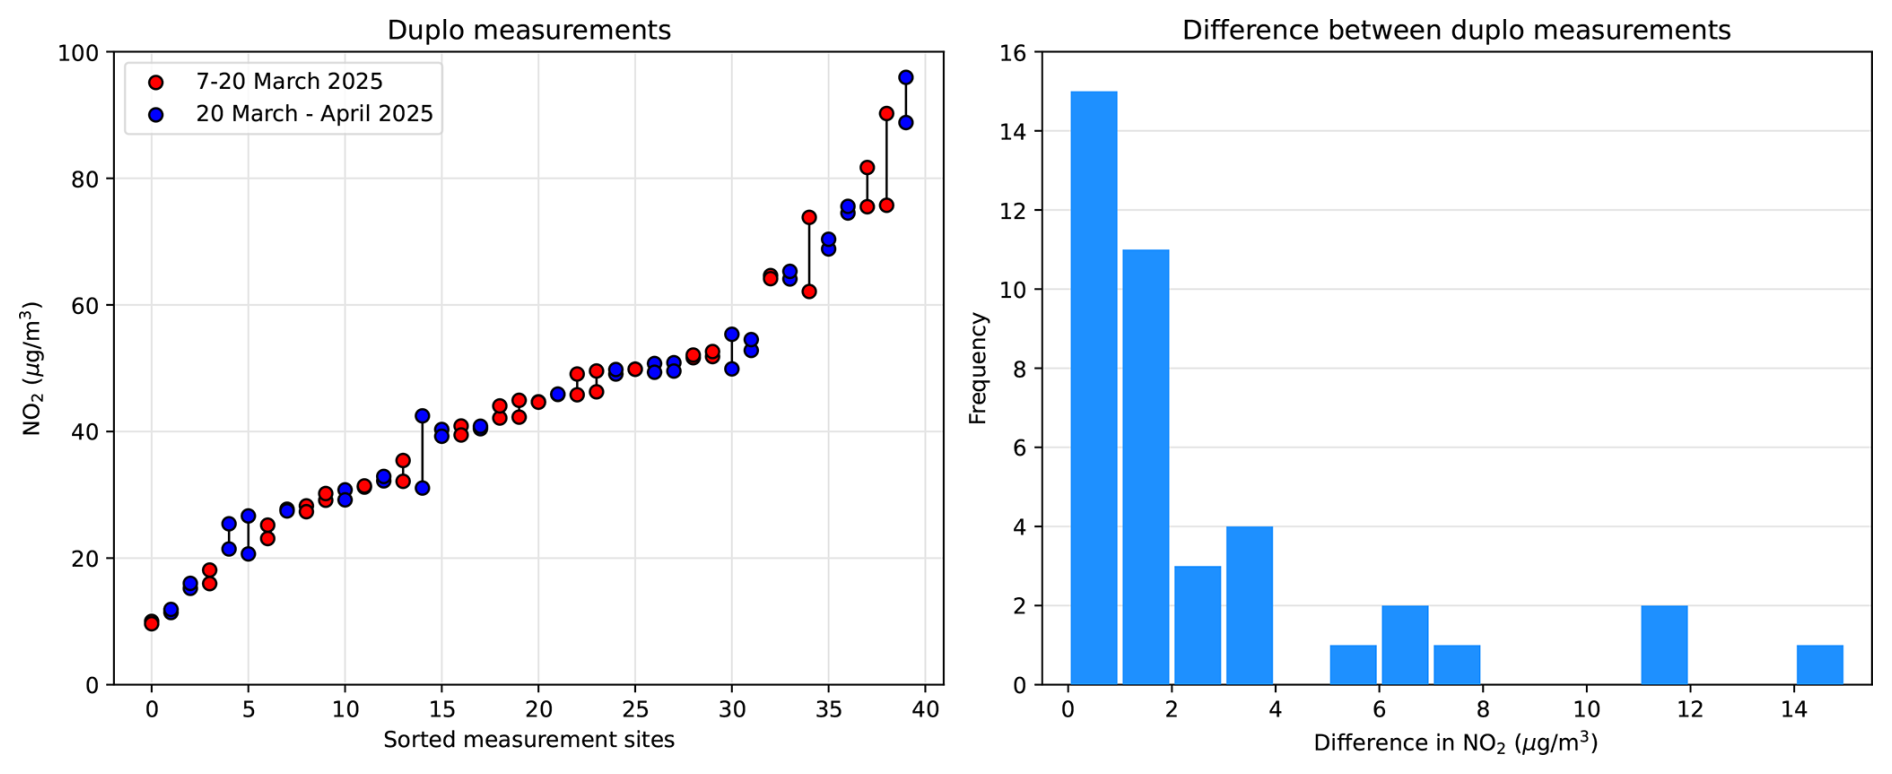
Figure 6Results of duplo measurements done in the Kumasi network, sorted from small to large NO2 concentrations (left). Most duplos agree within 2 µg m−3 (right).
3.1 Precision and measurement bias
A total of 40 duplo measurements were conducted across the monitoring locations. As shown in Fig. 6, 15 duplos (37.5 %) exhibited a difference of less than 1 µg m−3, while 26 duplicates (65 %) showed a difference of less than 2 µg m−3. Using the variance of the differences in the duplo measurements, we estimate the precision of the method at 3.0 µg m−3.
It should be noted that the exposure period was relatively short – only two weeks. For the more commonly used four-week exposure period, a higher level of precision is expected.
Eight on-site blank measurements were performed, 4 at each sampling cycle. One tube, 070-035, was kept as a lab blank, shielded from sunlight under room temperature conditions. The results are listed in Table 3.
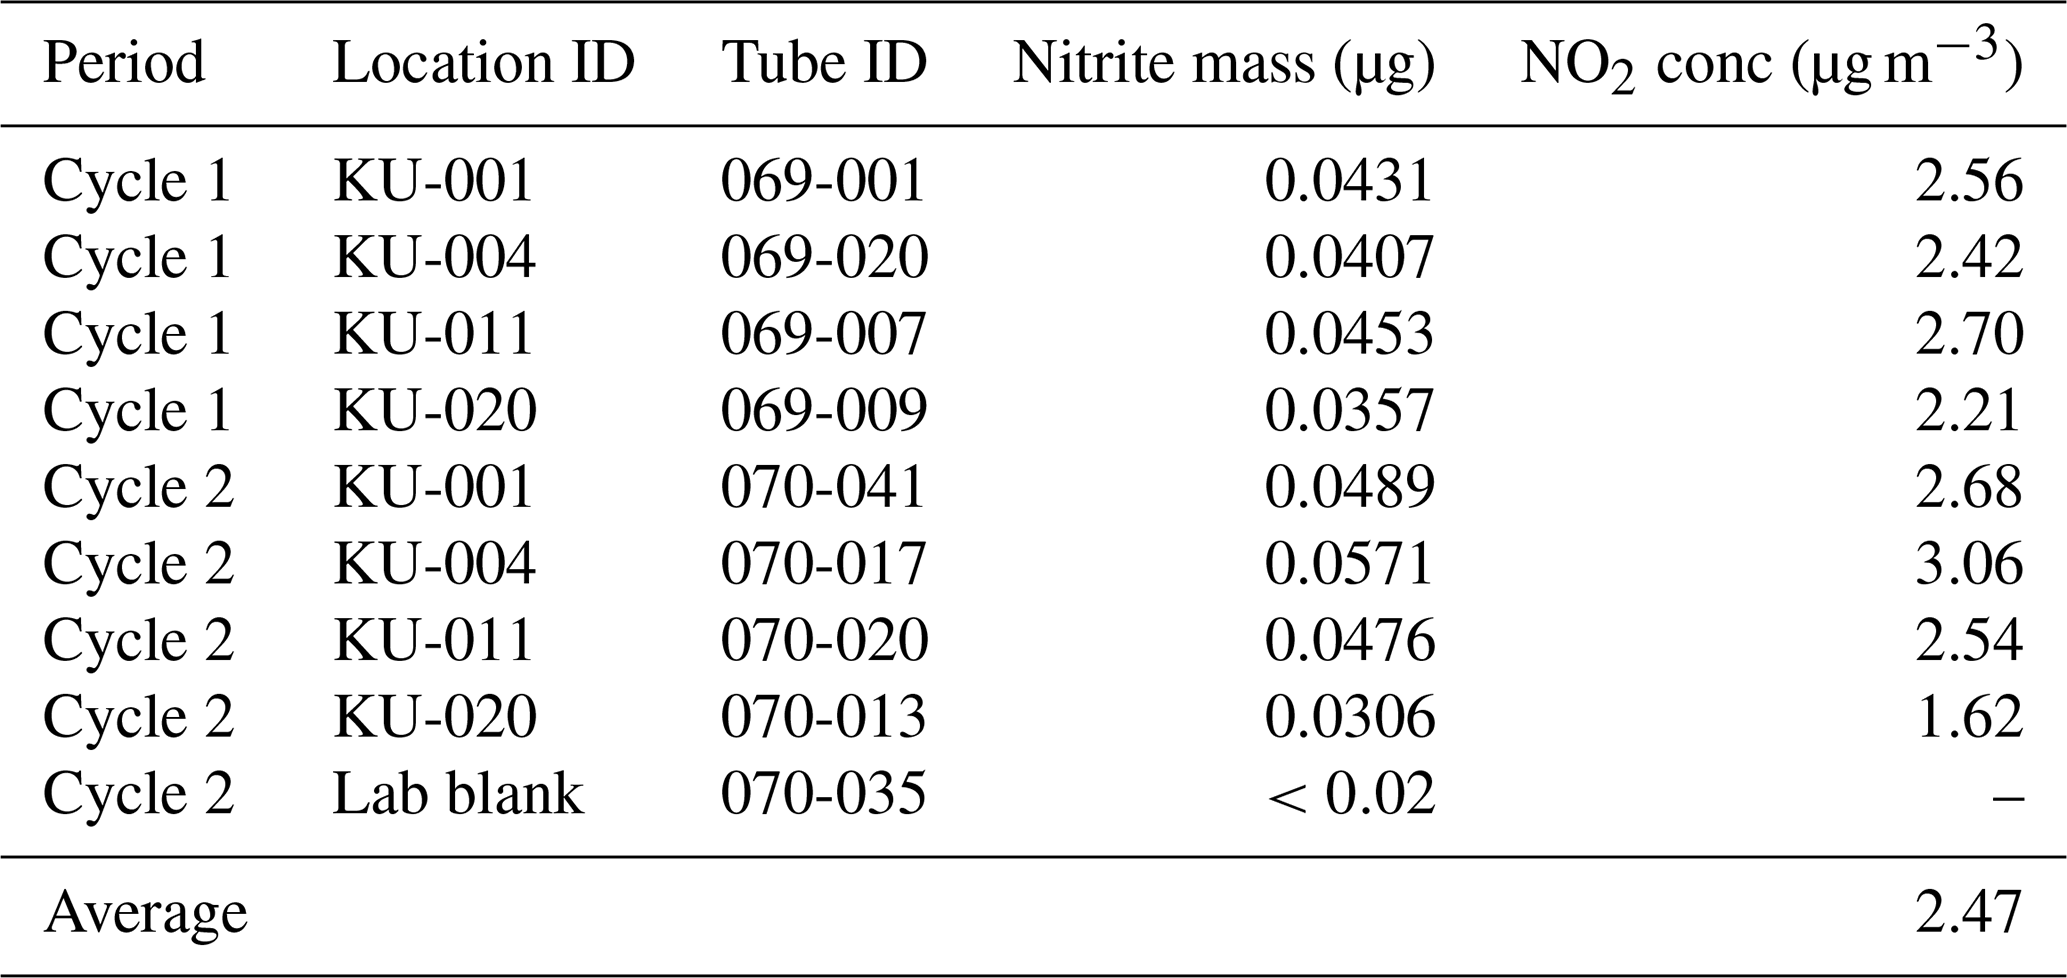
The average of the on-site blank samples is 2.47 µg m−3 in Cycle 1 and 2.48 µg m−3 in Cycle 2. The nitrite mass of the lab blank was found to be below the detection limit of 0.02 µg. The nitrite formation found in the other tubes is therefore assumed to originate from degradation of the TEA once exposed to elevated temperatures and solar radiation at the sampling site. Assuming that a similar degradation effect also occurs in the exposed (non-blank) tubes, we account for this bias by subtracting 2.47 µg m−3 in the results.
Consistent exposure across sites was ensured by mounting all diffusion tubes on free-standing poles using identical holders. Nevertheless, the simple design of the tube holders provides little protection against radiation and wind. In particular, wind-induced turbulence can shorten the effective diffusion path and increase the uptake rate. Heal et al. (2019) identify wind as the largest contributor to bias, potentially leading to overestimations of several tens of percent. In addition, local temperature differences – such as between shaded and sun-exposed locations – may introduce site-specific bias. A better-designed mounting system that shields the tubes from wind and radiation should help reduce this bias in future measurements.
3.2 Kumasi network measurements in March 2025
Table 4 lists the NO2 concentrations found at the network locations, where the duplo measurements have been averaged and bias-corrected by 2.47 µg m−3. Differences between the two measurement periods are minimal. This is consistent with the nearly identical meteorological conditions during both cycles, in terms of temperature, wind speed and wind direction. Notably, the more frequent light rain in Cycle 2 hardly influences the NO2 concentrations. Averaging the results for each site provides a more robust dataset, considered to be representative of air quality conditions in Kumasi during March 2025.
Table 4Estimated NO2 concentrations at the network locations after bias correction, sorted from small to large values, for 7–20 March 2025 (Cycle 1) and 20 March–3 April 2025 (Cycle 2).
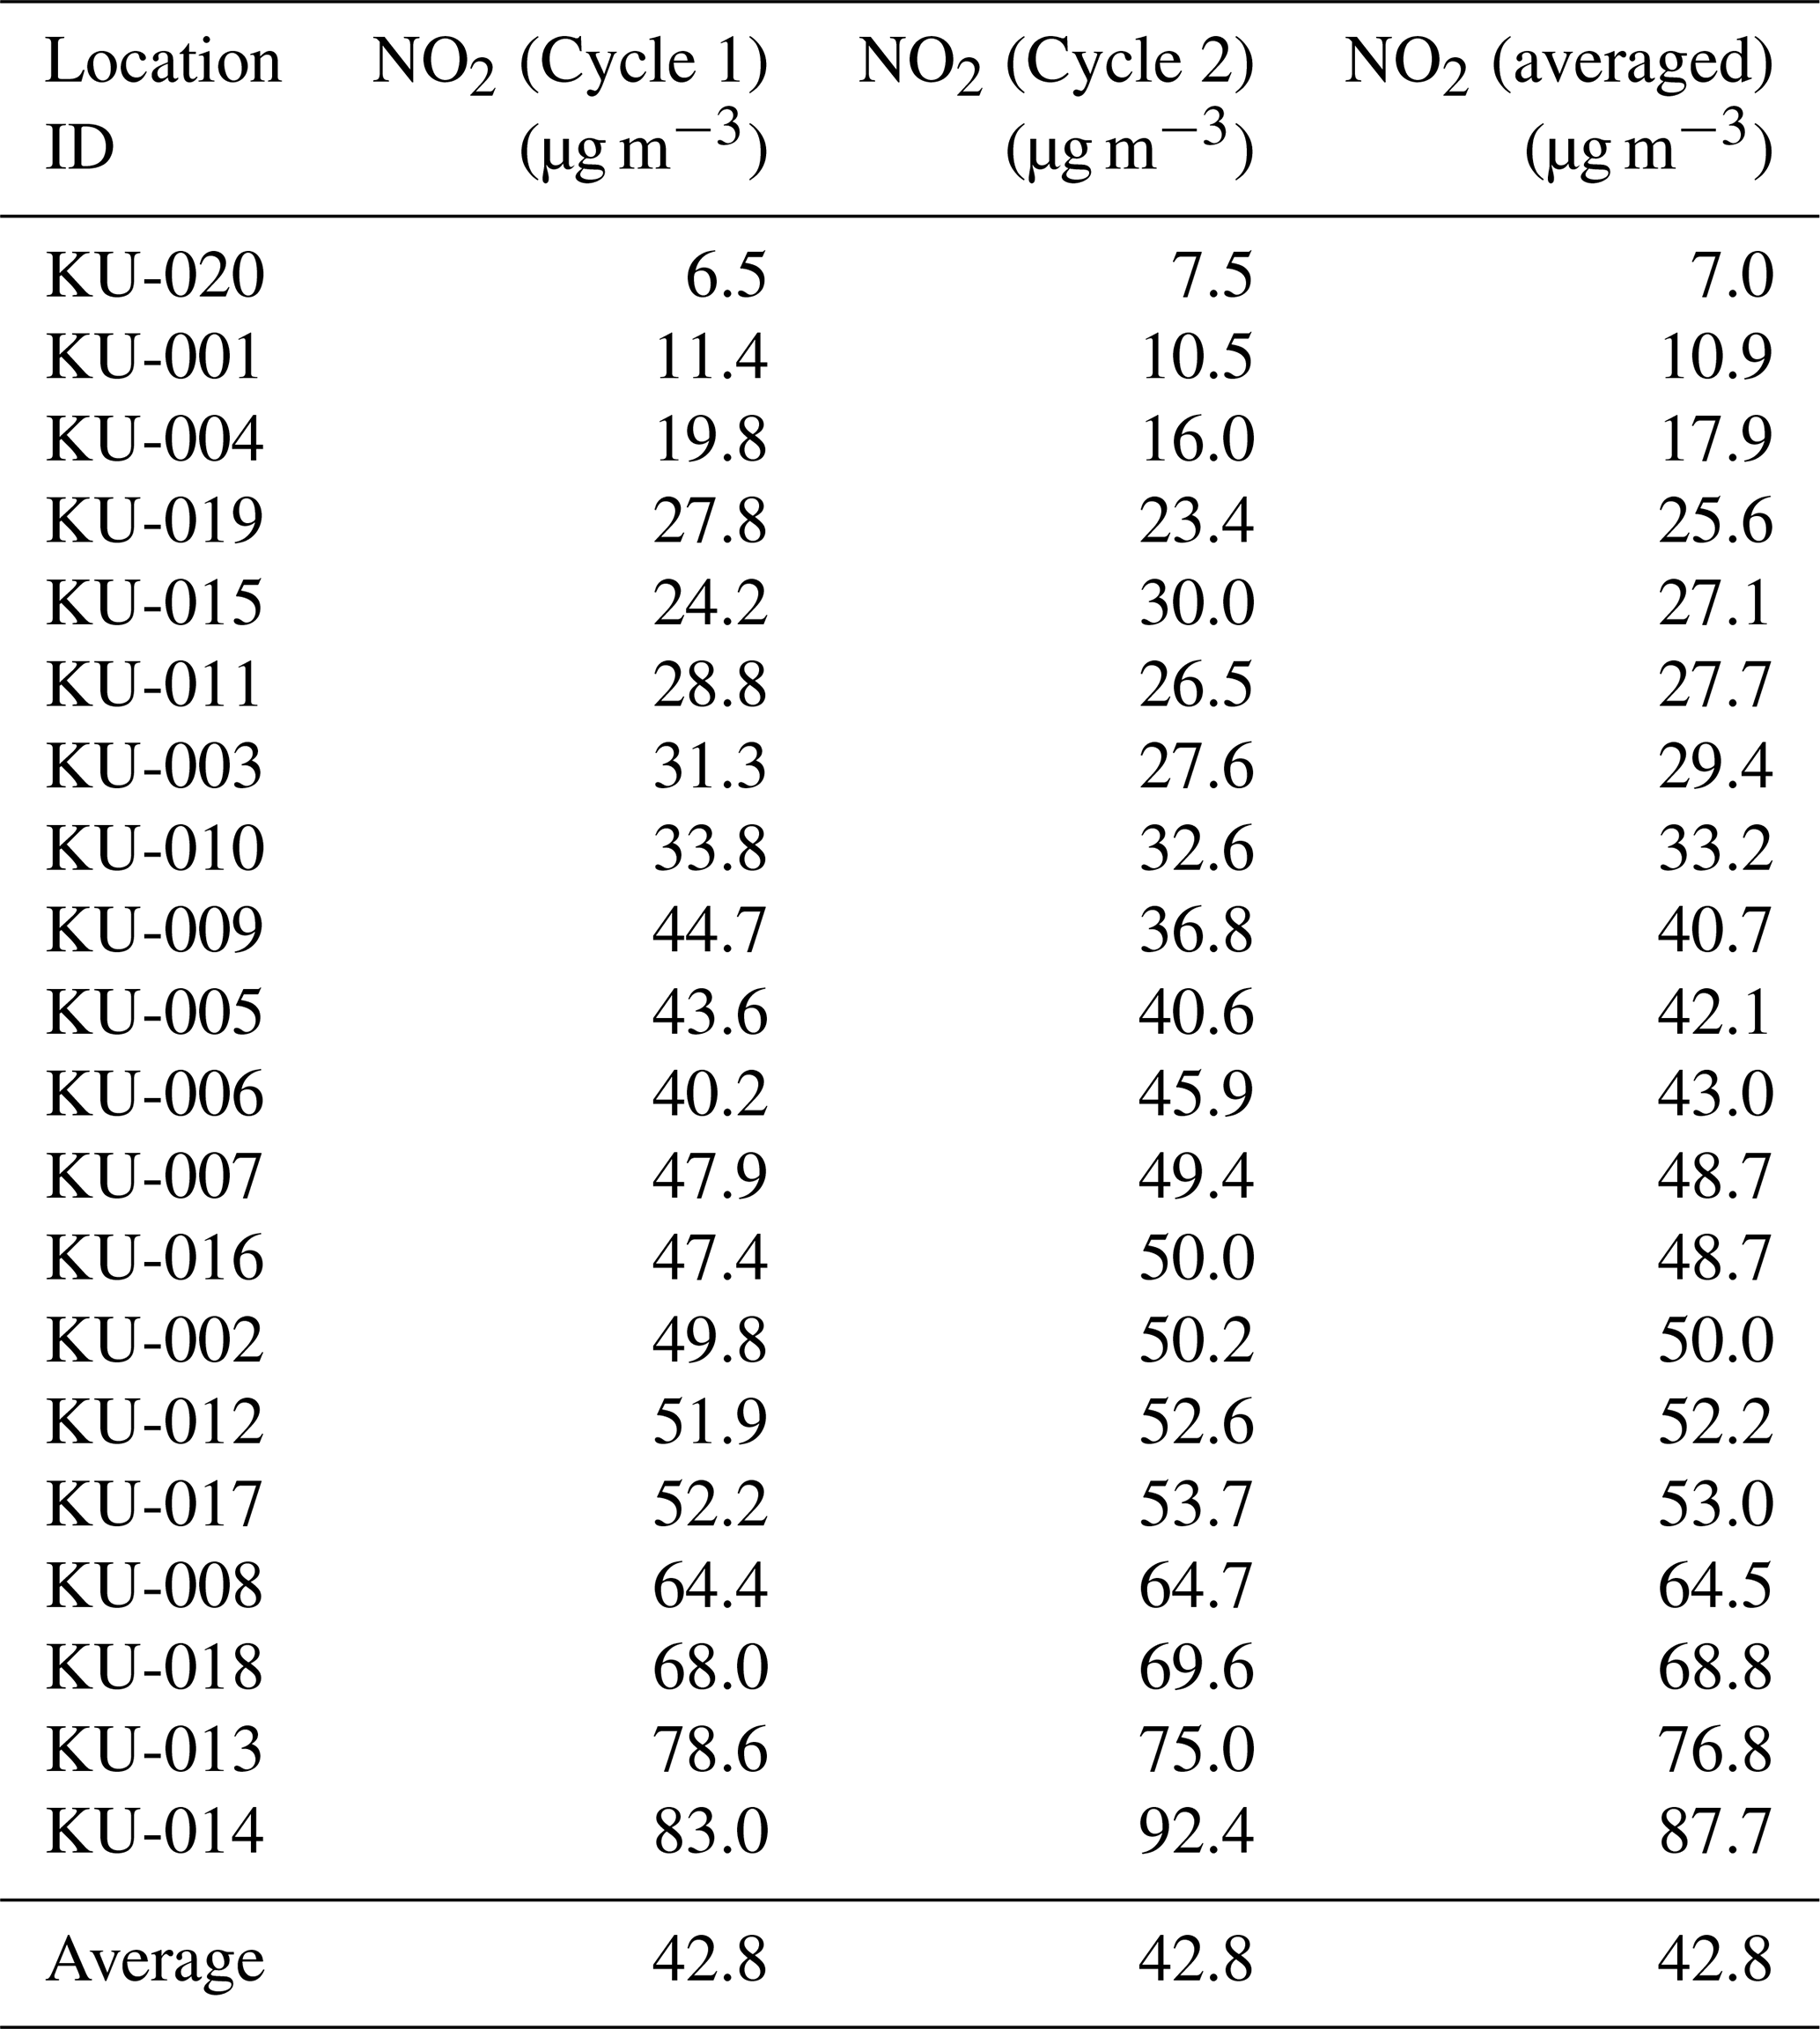
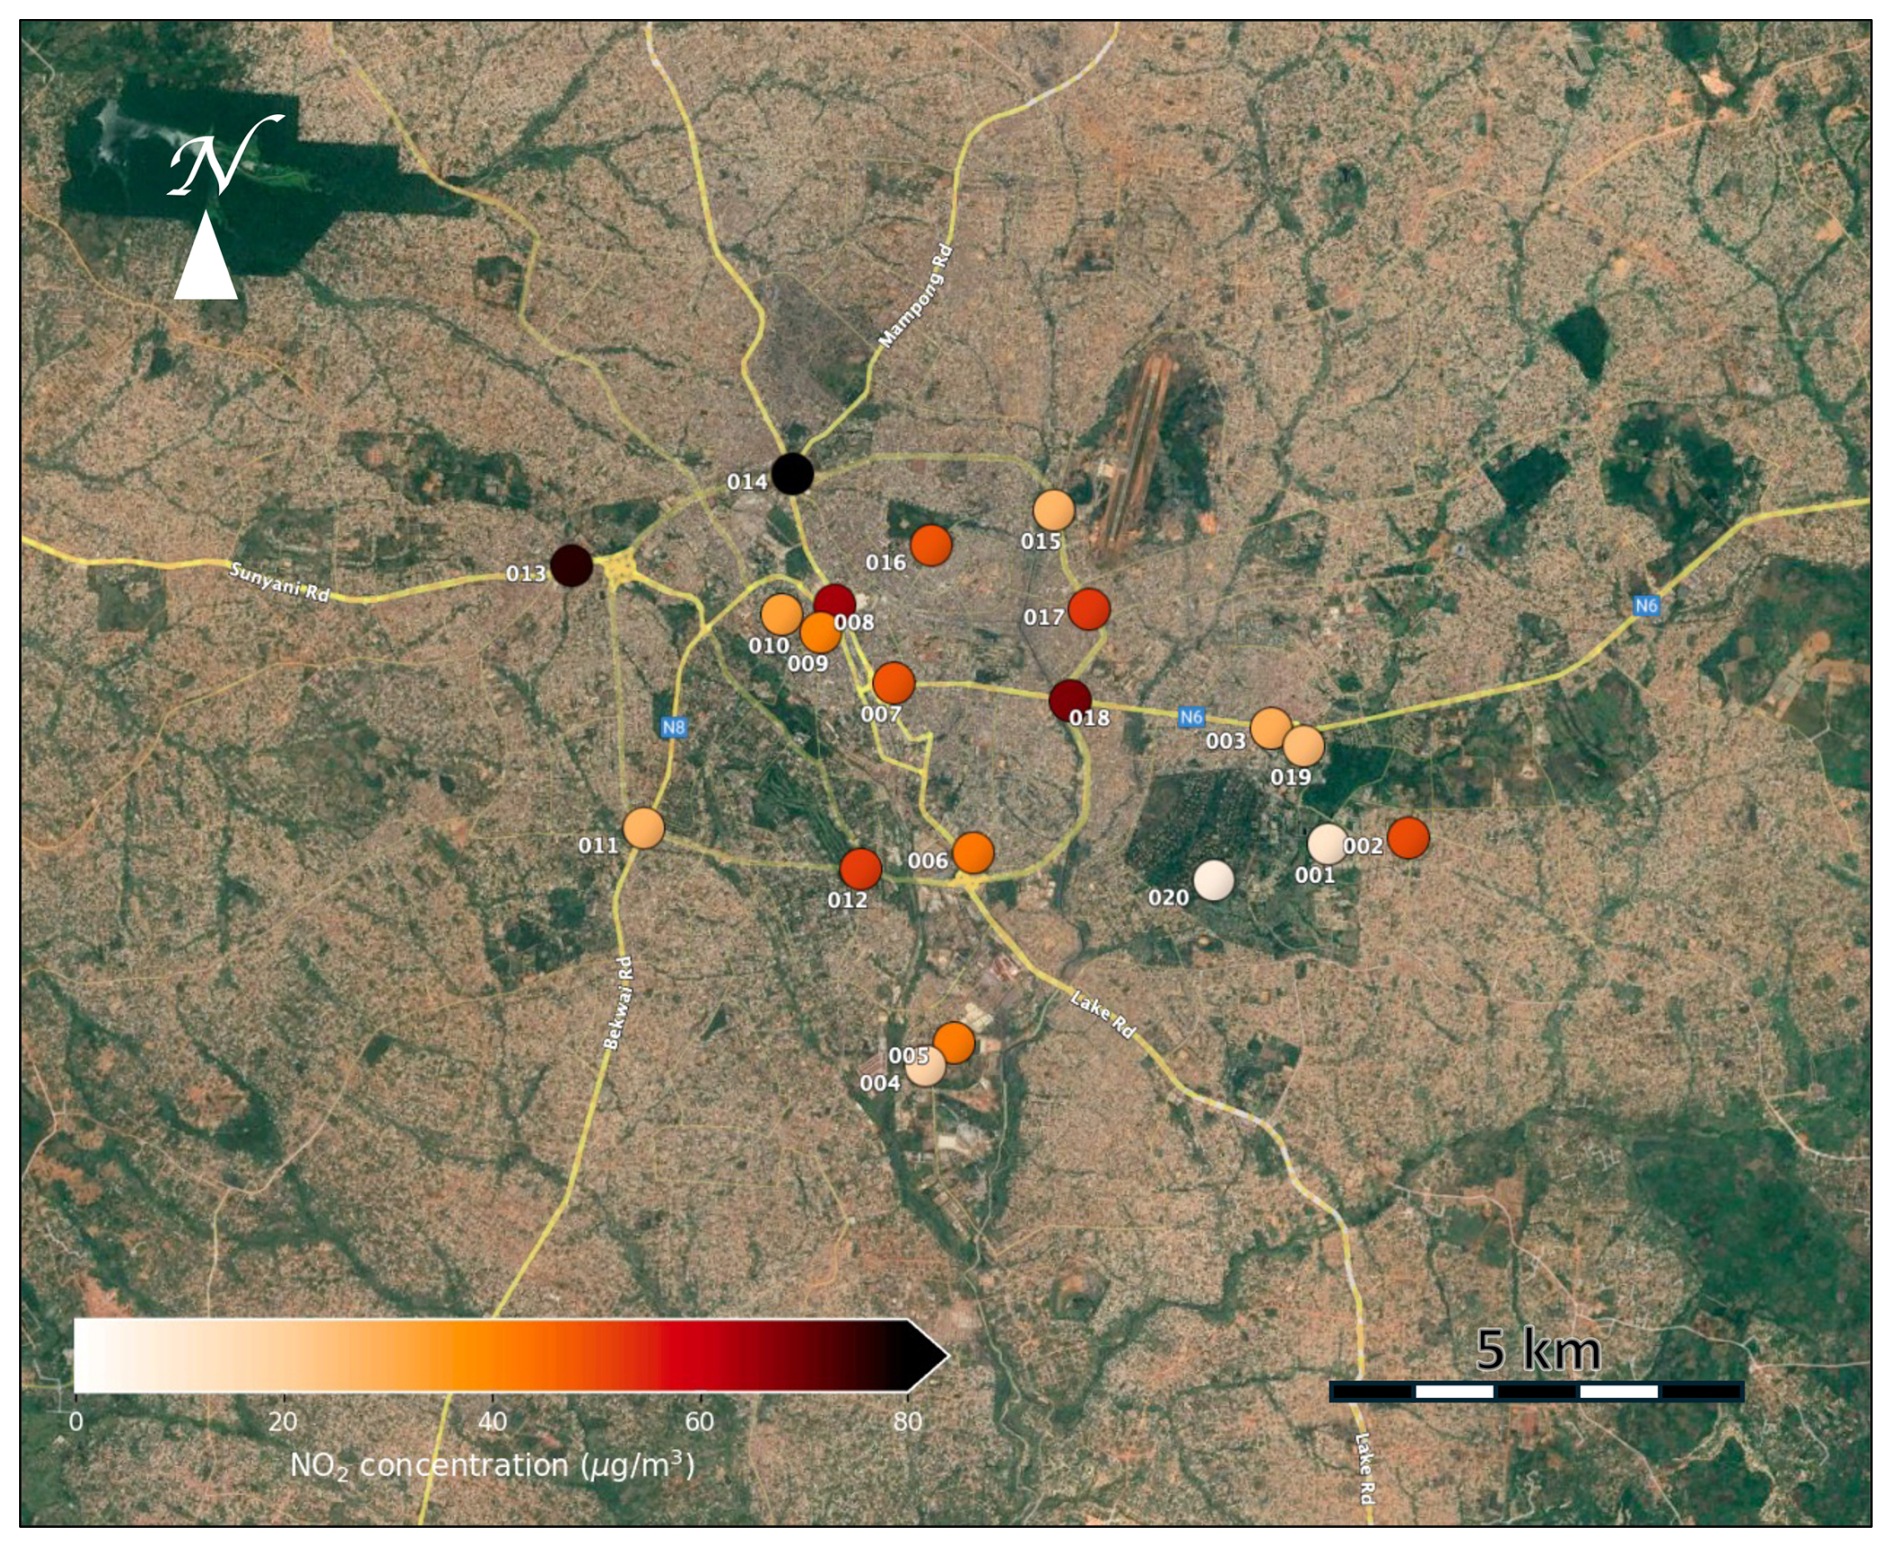
Figure 7NO2 concentrations measured in Kumasi by PDTs in March 2025. (Basemap taken from Google Maps © 2025 Google.).
A wide range of NO2 concentrations was observed across Kumasi, as illustrated in Fig. 7. The spatial distribution clearly indicates that NO2 levels are predominantly influenced by road traffic.
The lowest NO2 concentration – 7 µg m−3 – was recorded at KU-020 (Engineering Guest House), located within the green and relatively traffic-free KNUST campus. In contrast, the highest concentrations were found at traffic-dense locations, including KU-018 (Anloga Junction, 69 µg m−3), KU-013 (Sofoline Interchange, 77 µg m−3), and KU-014 (Suame Circle, 88 µg m−3).
Measurements taken at industrial sites (KU-004 and KU-005) did not show outstanding concentrations, suggesting that industrial emissions are not a major contributor to ambient NO2 levels in these areas.
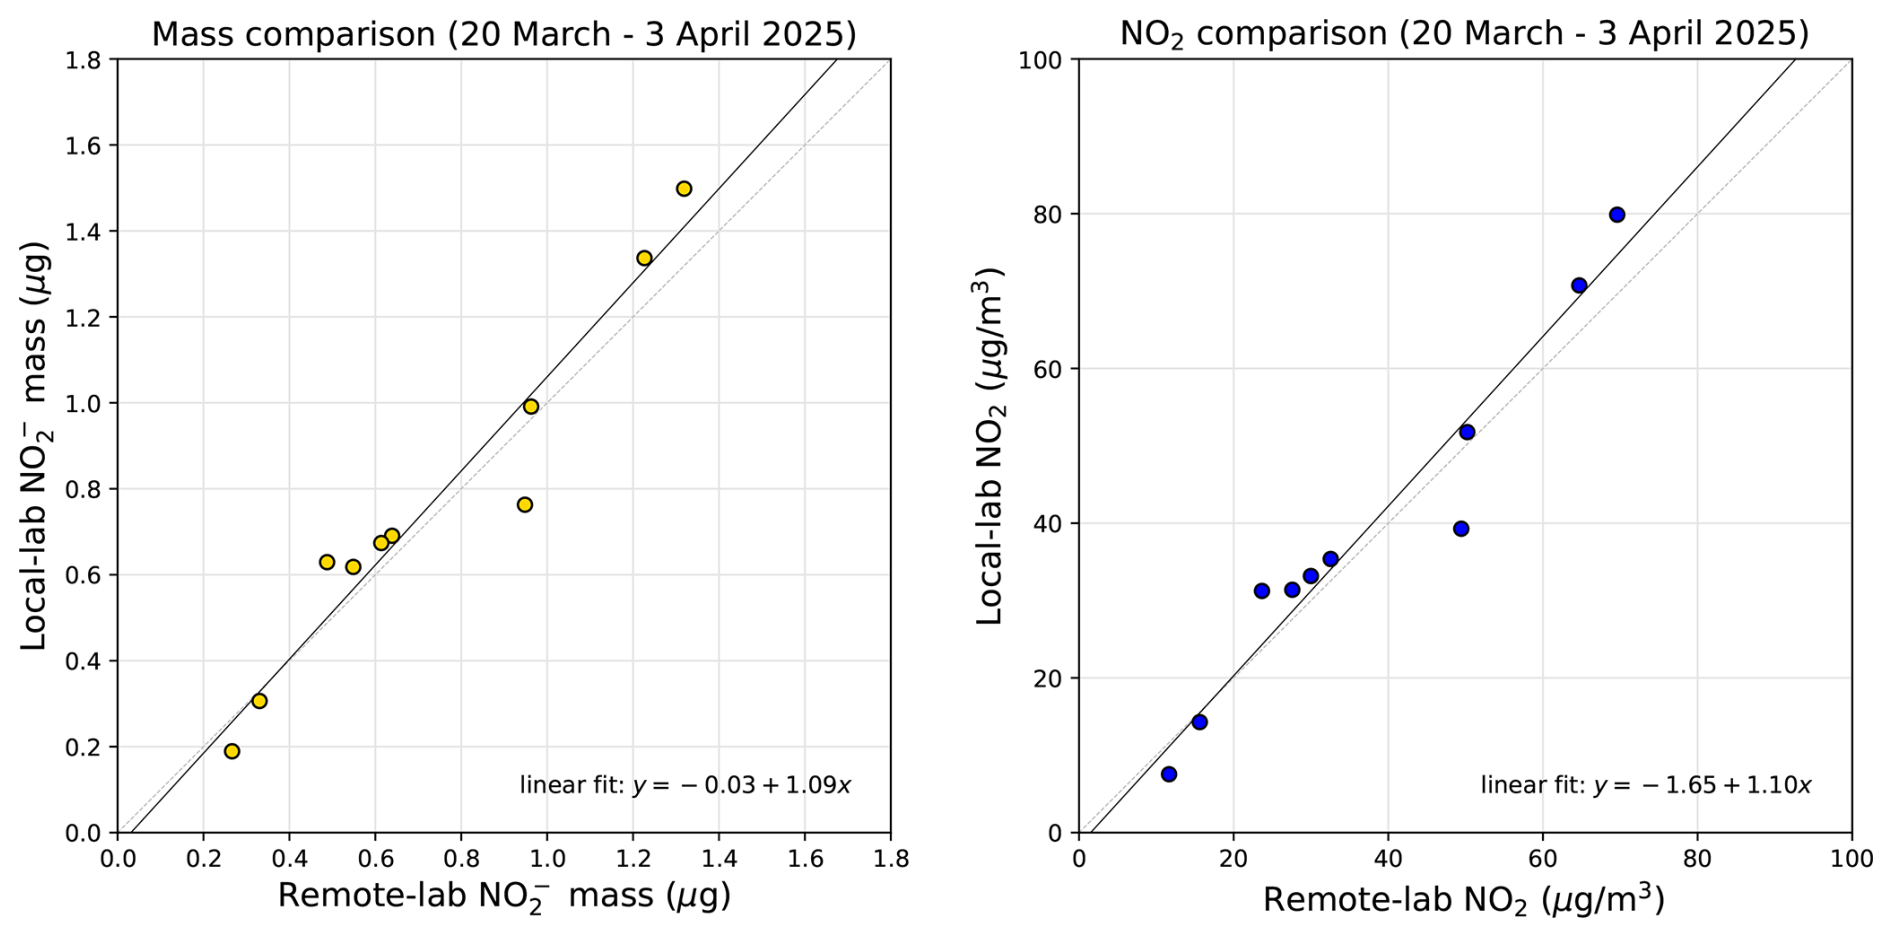
Figure 8Comparison of results between tubes prepared and analysed at the local KNUST lab and tubes prepared and analysed at the remote accredited lab. (left) The mass determination, and (right) the conversion to ambient NO2 concentration.
3.3 Validation of locally prepared and analysed tubes
During Cycle 1, the air quality laboratory facility at KNUST was established and became operational. For Cycle 2, 10 locally prepared tubes were deployed alongside remote-lab tubes at 10 sites within the measurement network. The local-lab tubes were analysed shortly after their collection at the end of Cycle 2. Since they are made from the same materials and have identical dimensions as the remote-lab tubes, they are assumed to experience similar degradation and were therefore corrected by subtracting 2.47 µg m−3.
The scatter plots in Fig. 8 show data pairs closely aligned with the 1:1 line, indicating strong agreement between the two sets of measurements. The relatively low scatter demonstrates that the KNUST laboratory can reliably reproduce results comparable to those of the accredited laboratory.
The measured values for each data pair are presented in Table 5. Note that the remote laboratory results are generally lower than those from the local laboratory, possibly due to sample degradation during the 27 d delay before analysis, compared with 2 d for the local lab. The uncertainty in the differences, however, is too large to claim a real bias.
To estimate the uncertainty in NO2 concentrations determined by the local laboratory, we calculate the variance of the differences Di between paired measurements. This allows us to approximate the error associated with the PDT results from the local lab, σlocal, using the following relation:
where is the mean of the differences, here 2.0 µg m−3, and σremote represents the estimated uncertainty of duplicate measurements analysed at the accredited (remote) laboratory, estimated in Sect. 3.1 to be 3.0 µg m−3. Based on this approach, the resulting uncertainty in NO2 concentration for the local laboratory is estimated at 5.1 µg m−3.
It should be noted that this estimate is not very robust due to the small sample size (n=10) and the relatively short exposure period of two weeks.
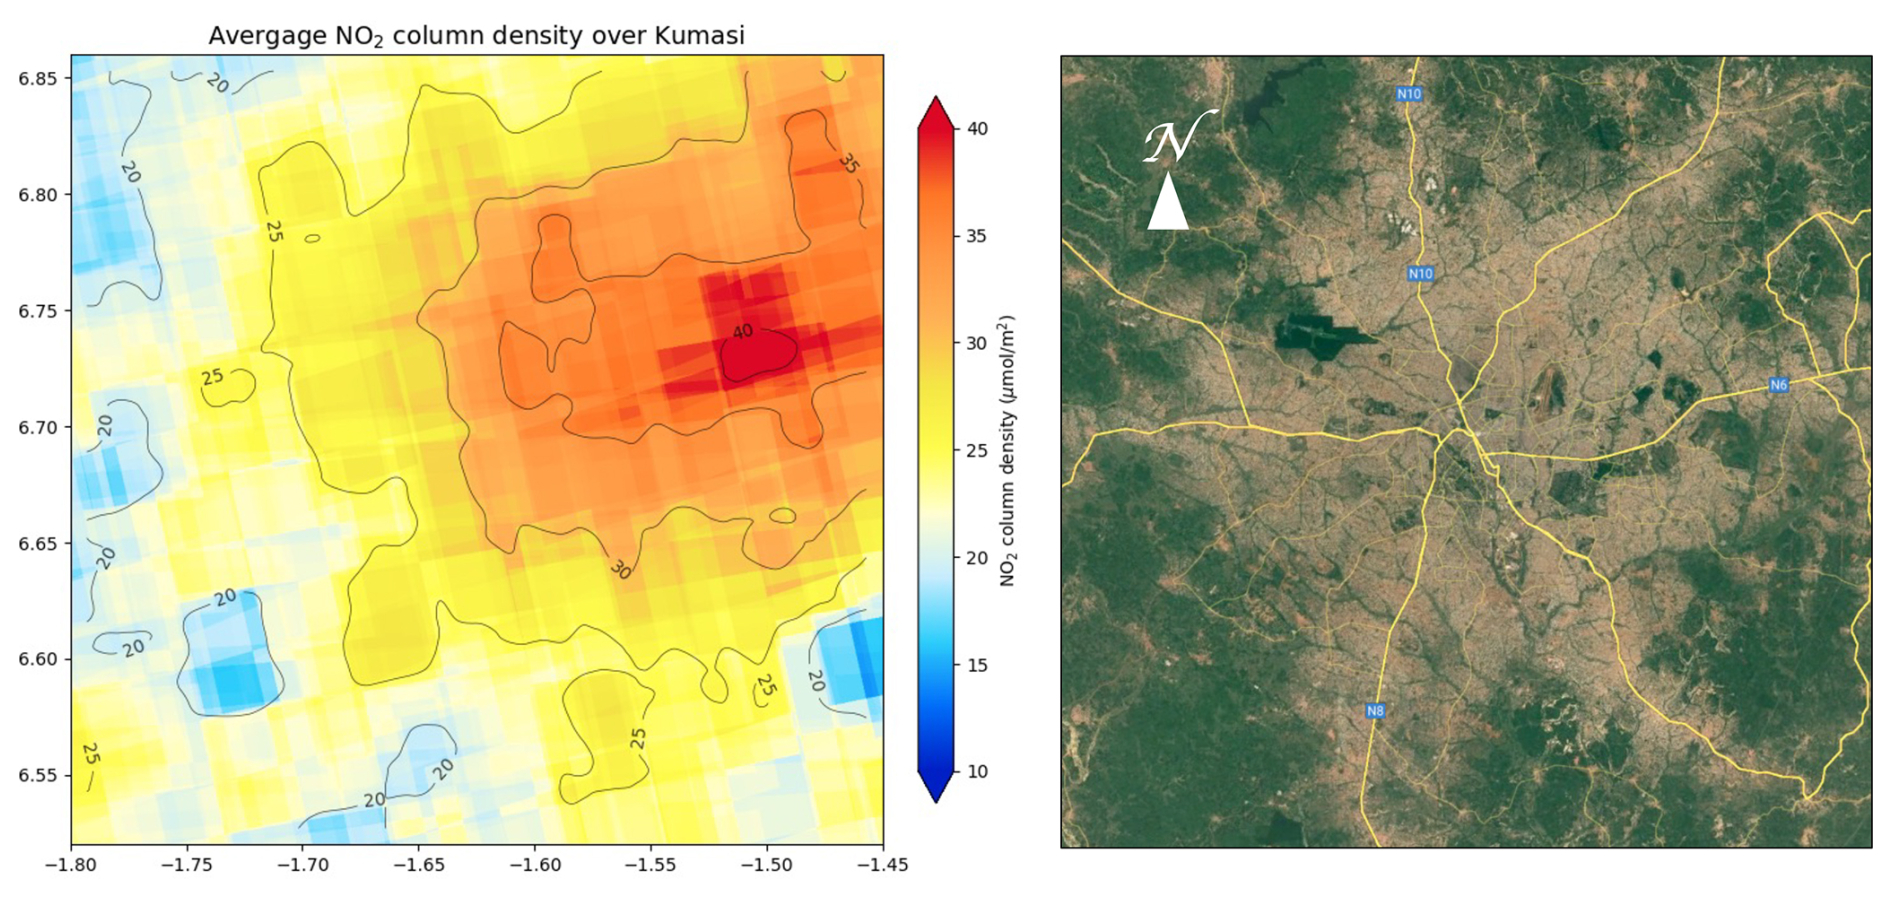
Figure 9Averaged satellite measurement of tropospheric NO2 columns density over Kumasi from 7 March to 3 April 2025. The map represents an area of 38×38 km2. Contour lines are shown for the measurement field smoothed with a Gaussian kernel of σ=400 m. (Basemap taken from Google Maps © 2025 Google.).
Satellite observations of tropospheric NO2 obtained from TROPOMI and averaged over the Kumasi region for the period 7 March–3 April 2025 are presented in Fig. 9. Clearly visible is the build-up of NO2 column densities downwind (northeast) under the prevailing south-westerly winds. Also visible are the pockets of cleaner air in the unbuilt areas between the suburbs west and south of Kumasi.
4.1 Column-to-surface ratio
Comparison of Figs. 7 and 9 shows no clear spatial relation between the satellite column measurements and the surface concentrations. The elevated NO2 levels found in downwind regions are not readily apparent in the surface measurements, although they might be detectable with a more extended ground-based monitoring network that includes more urban background stations.
The main reason for the poor spatial relation is the scale mismatch: TROPOMI's footprint (5.5×3.5 km2 at best) averages the sharp local gradients found near strong emission sources such as traffic arteries. The relationship is further complicated by the unknown vertical distribution of NO2, as tropospheric columns integrate contributions from air masses of different origins, ages, and mixing states. Additional atmospheric modelling would therefore be needed to resolve fine-scale structures in surface air pollution from satellite observations (see, e.g., Mijling et al., 2025).
Other limitations for direct comparison include the once-daily overpass of TROPOMI, which captures NO2 concentrations around 13:30 local solar time, which might not be representative for daily averages. Furthermore, since the satellite retrievals rely on sufficiently cloud-free conditions, the lack of data under cloudy conditions can introduce a sampling bias in monthly averages (see e.g. Glissenaar et al., 2025).
Nevertheless, it is interesting to look at the ratio between average tropospheric column densities and average ground concentrations on an urban scale, as TROPOMI retrievals of tropospheric columns have been shown to correlate strongly with in-situ surface measurements, particularly in urban environments (Cersosimo et al., 2020; Goldberg et al., 2021; Ialongo et al., 2020; Jeong and Hong, 2021). Understanding this relationship provides a basis to monitor surface concentrations using satellite measurements alone. Table 6 compares the column-to-surface ratio for Kumasi with those of European cities of similar size for March 2025.
Table 6Comparison between average tropospheric column densities from TROPOMI and surface concentrations for different cities in March 2025, sorted from high to low column.
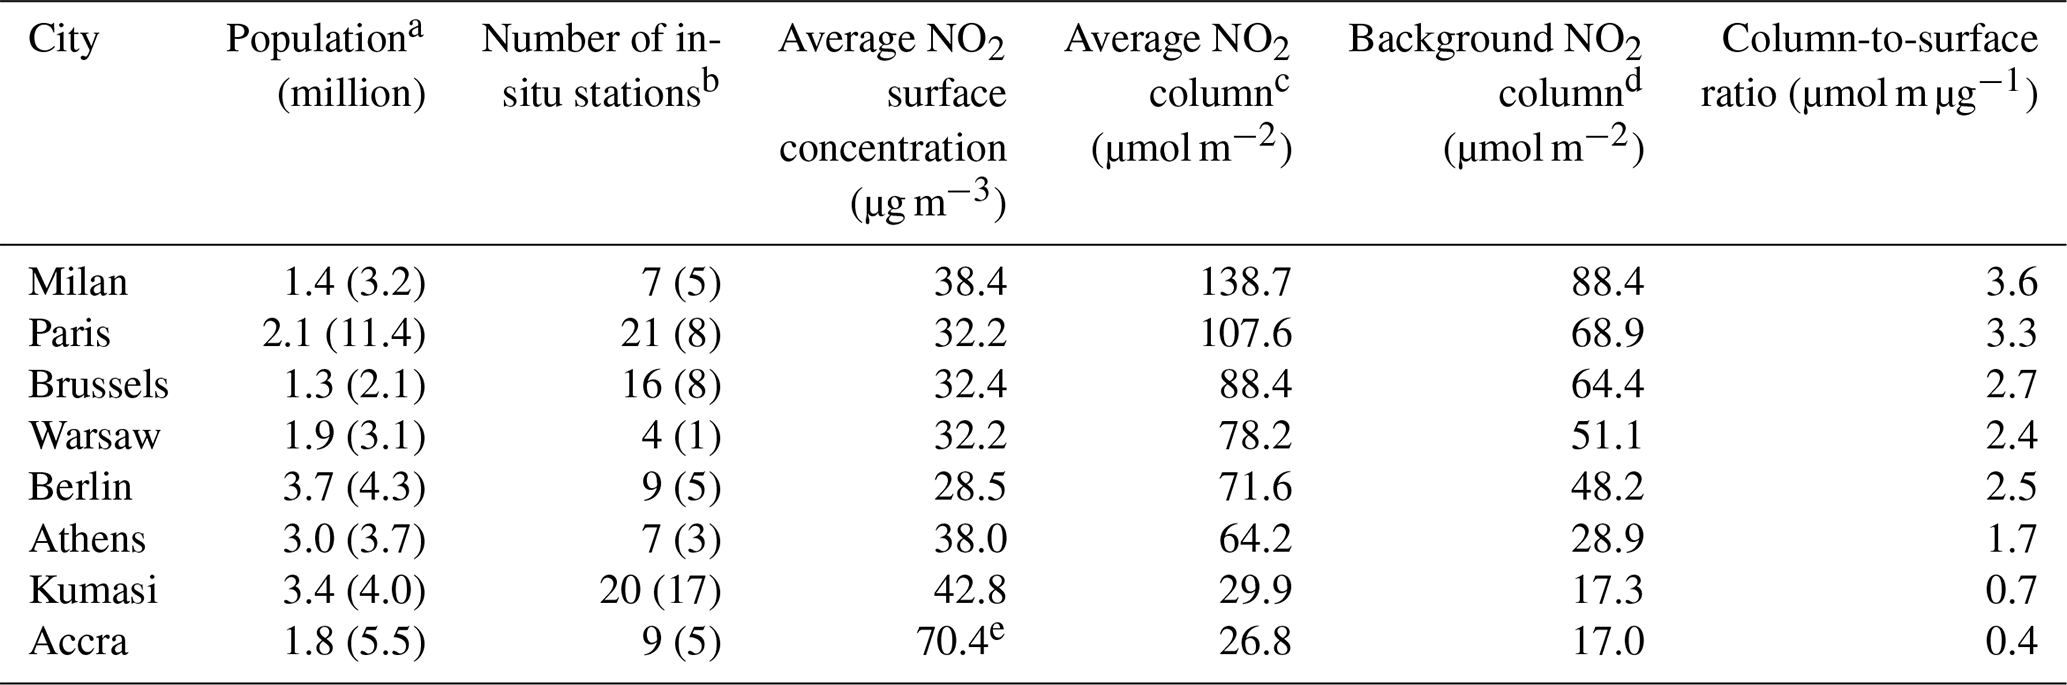
a Estimated urban population. Between parenthesis the metropolitan population. b Within 10 km radius; between parenthesis the number of reference stations classified as traffic station. c Area averaged tropospheric column density, radius 10 km around city centre. d Lowest tropospheric column concentration found in a radius of 15 km around city centre. e Average for March 2020 from Ogawa passive samplers (Wang et al., 2022).
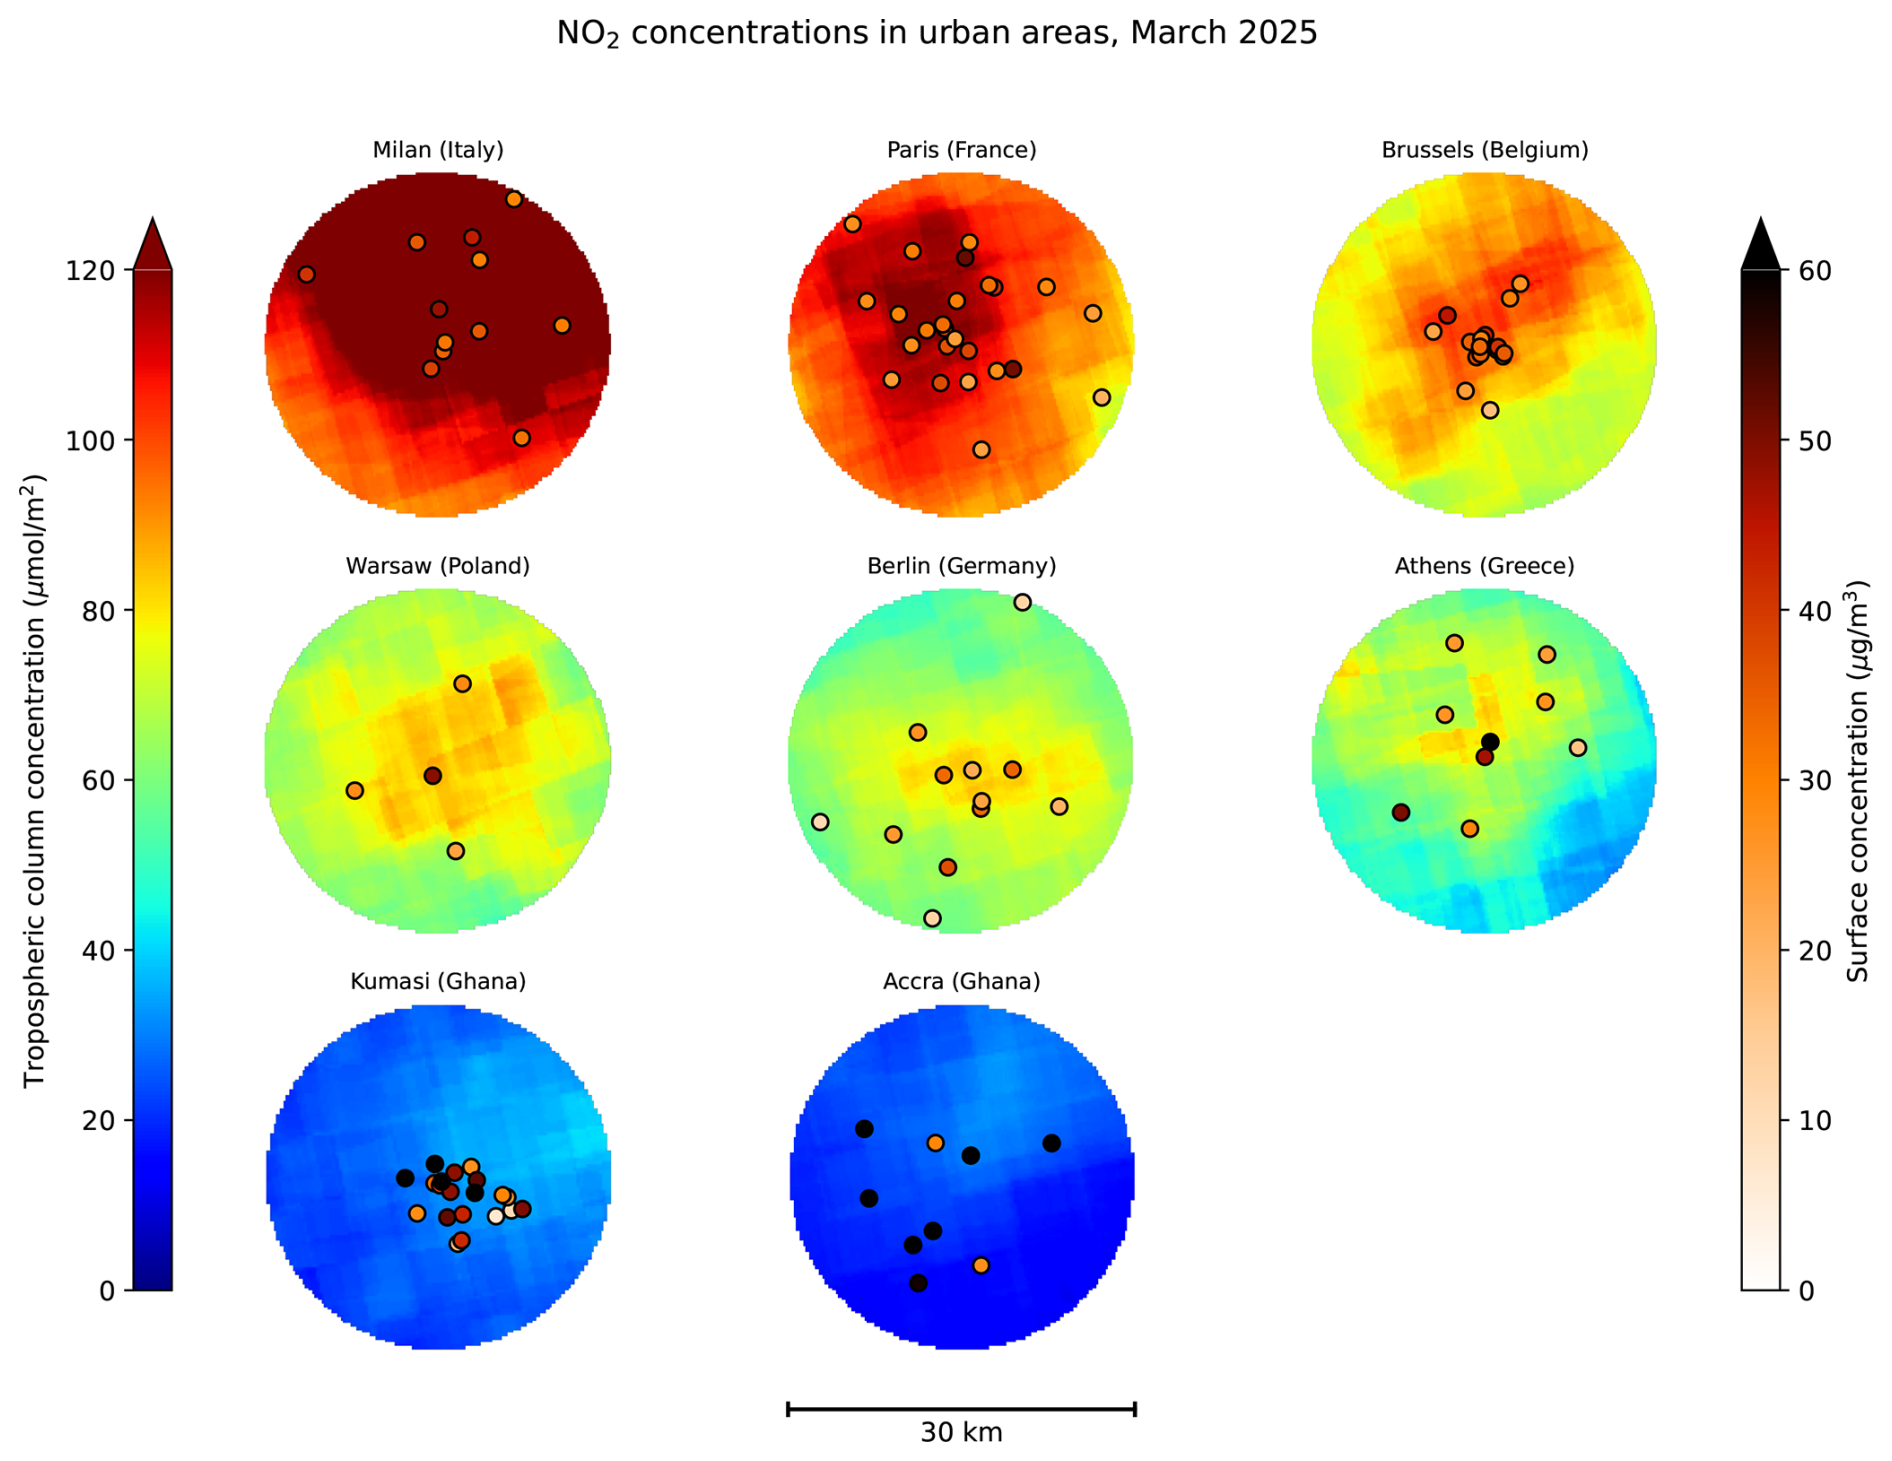
Figure 10Comparison between averaged NO2 tropospheric column retrievals by TROPOMI and surface concentration measurements for selected cities in March 2025. (Note that the Accra surface data is for March 2020.)
Surface NO2 concentrations were extracted from the European Environment Agency (EEA) database (EEA, 2025) for March 2025. Urban averages are calculated from all regulatory monitoring stations located within 10 km of each city centre, having at least 80 % completeness in its hourly measurements. To put our Kumasi measurements further in perspective, we included the average surface concentration for Accra in March 2020, measured by Ogawa passive samplers (Arku, 2021) from the study by Wang et al. (2022).
Average tropospheric column concentrations were obtained from maps of stacked tropospheric NO2 columns (as described in Eq. 7), calculated within a 10 km radius of each city centre. The background column concentration is defined as the minimum value within a 15 km radius.
Table 6 shows that the column-to-surface ratios in Kumasi and Accra are significantly lower than those in the European cities. As illustrated in Fig. 10, this is a notable finding: small columns observed by TROPOMI over West Africa do not necessarily correspond to low surface concentrations – contrary to what one might intuitively conclude from NO2 maps when presuming a fixed column-to-surface ratio.
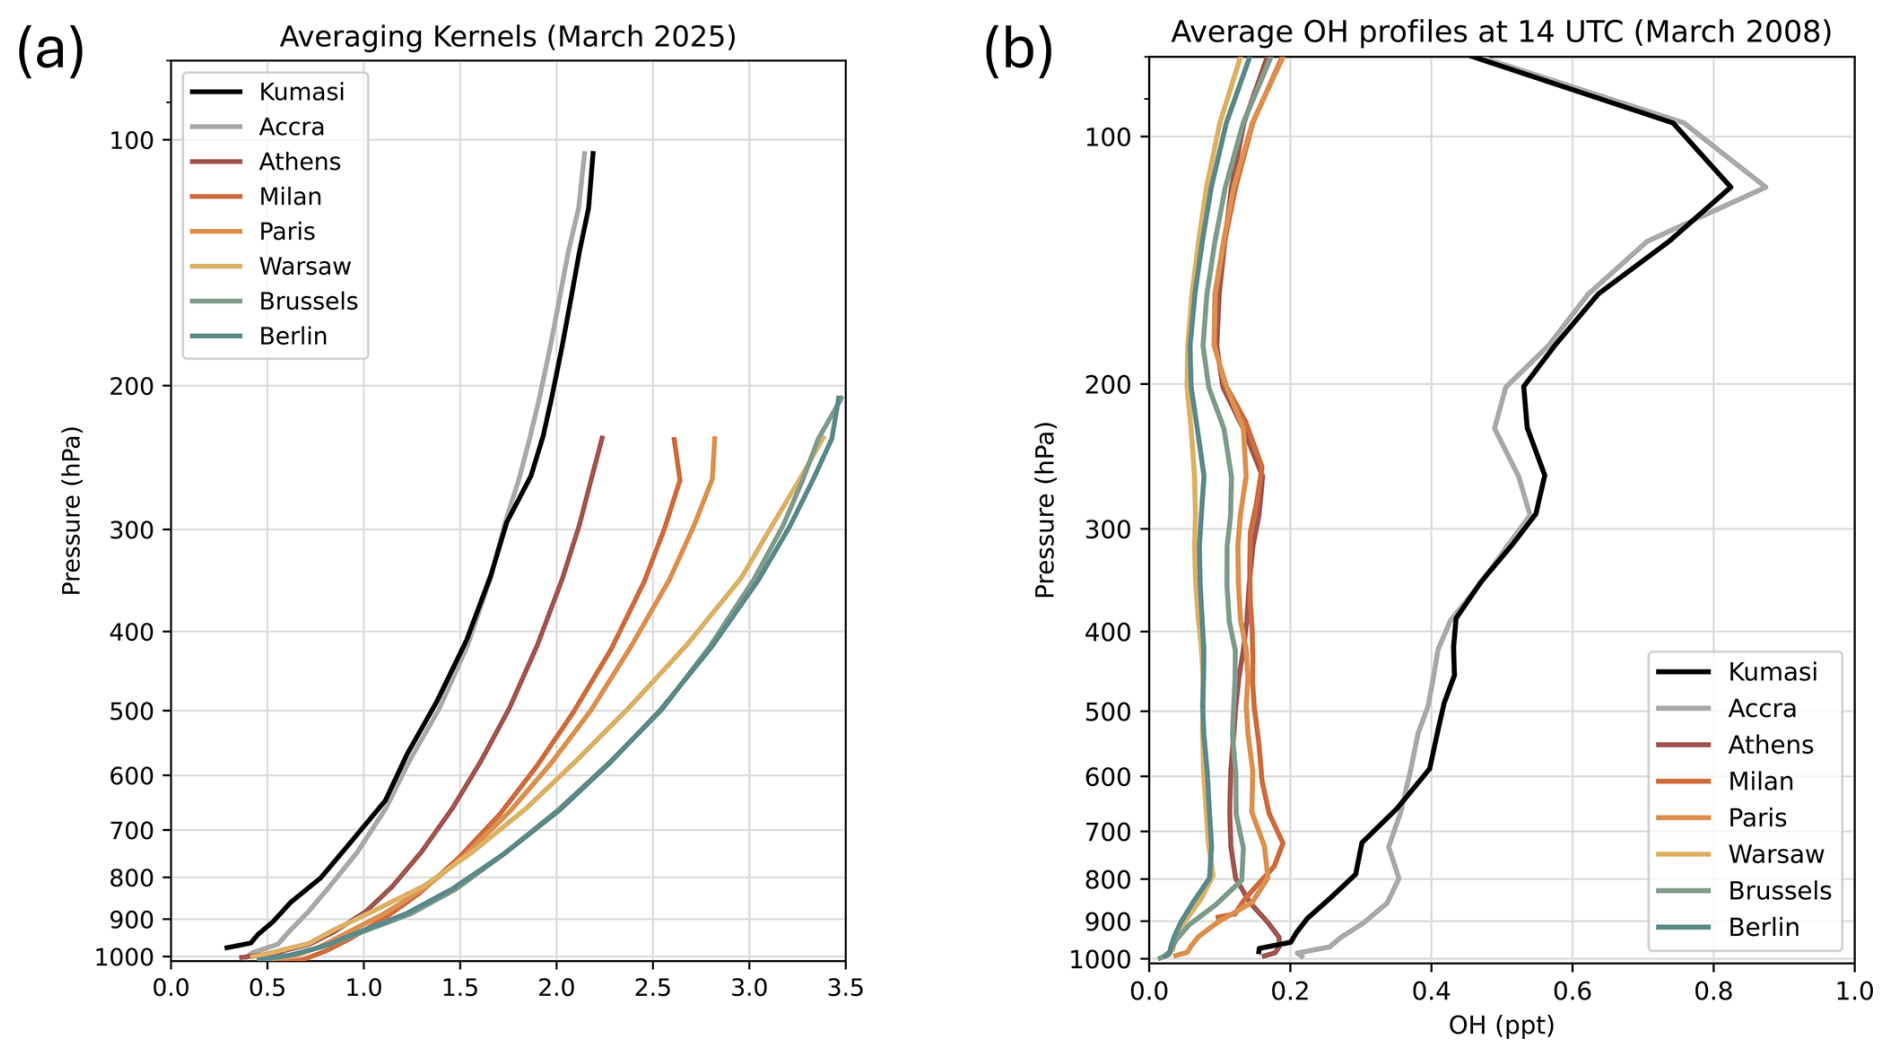
Figure 11(a) Tropospheric averaging kernels from TROPOMI over selected cities, averaged over March 2025. (b) Average OH profiles around satellite overpass time from TM5-MP simulations at 1°×1° resolution for March 2008.
4.2 Averaging kernels and NOx lifetime
The low columns over Ghanaian cities can be partly explained by the reduced sensitivity of the retrieval method near the surface in combination with coarse a priori NO2 profiles from TM5-MP. Averaging kernels over Accra and Kumasi (Fig. 11a) confirm a reduced sensitivity throughout the troposphere. This reduction is closely associated with the high aerosol loading in the region, as reflected by elevated aerosol optical depth (AOD) values.
Table 7 presents the mean TROPOMI AOD at 494 nm (KNMI et al., 2025) in March 2025 for a 30×30 km2 area centred on each city. Values well above 1 suggest the presence of substantial haze, resulting primarily from long-range dust transport from the Sahara and Sahel regions, as well as smoke from biomass burning, which remains active during March. The resulting decrease in atmospheric transparency effectively obscures near-surface urban pollution from satellite detection, thereby contributing to the decrease in vertical sensitivity towards the surface.
Another reason for the relatively low tropospheric column densities over Kumasi can be found in the NOx chemistry. During the day chemical loss of NOx is dominated by the oxidation of NO2 by the hydroxyl radical (OH):
The associated lifetime of NO2 is
where k is the reaction rate and [OH] the hydroxyl concentration, expressed in molec. m−3. The primary daytime source of OH is the photolysis of ozone (O3) followed by a reaction with water vapor:
Compared to mid-latitudes, OH production is enhanced in the tropical lower troposphere due to stronger solar radiation, more abundance of water vapor, and higher temperatures. This is confirmed by simulations of the global chemistry model TM5-MP for March 2008, conducted around the satellite overpass time at a 1°×1° spatial resolution (Fig. 11b). Average OH concentrations between 1000 and 850 hPa are shown in Table 7. The corresponding lifetime τ is estimated using Eq. (9), assuming a typical rate constant cm3 molec.−1 s−1 (Sander et al., 2006). In the lower troposphere, k is only weakly dependent on temperature within the 250–300 K range. It should also be noted that these lifetimes represent averages over a relatively large 1°×1° grid cell, whereas lifetimes within urban areas can be considerably shorter (Beirle et al., 2011; Lorente et al., 2019).
From the table, it can be seen that lifetimes found in Kumasi are 1.1–4.9 times shorter than found in European cities. This means that while NO2 concentrations found at the surface close to emissions sources can be high, NO2 column densities will be lower, as the tropospheric column contains air parcels of different origins, with more aged chemistry.
Table 7Differences in Aerosol Optical Depth (March 2025) and NO2 lifetime due to loss against OH (March 2008).
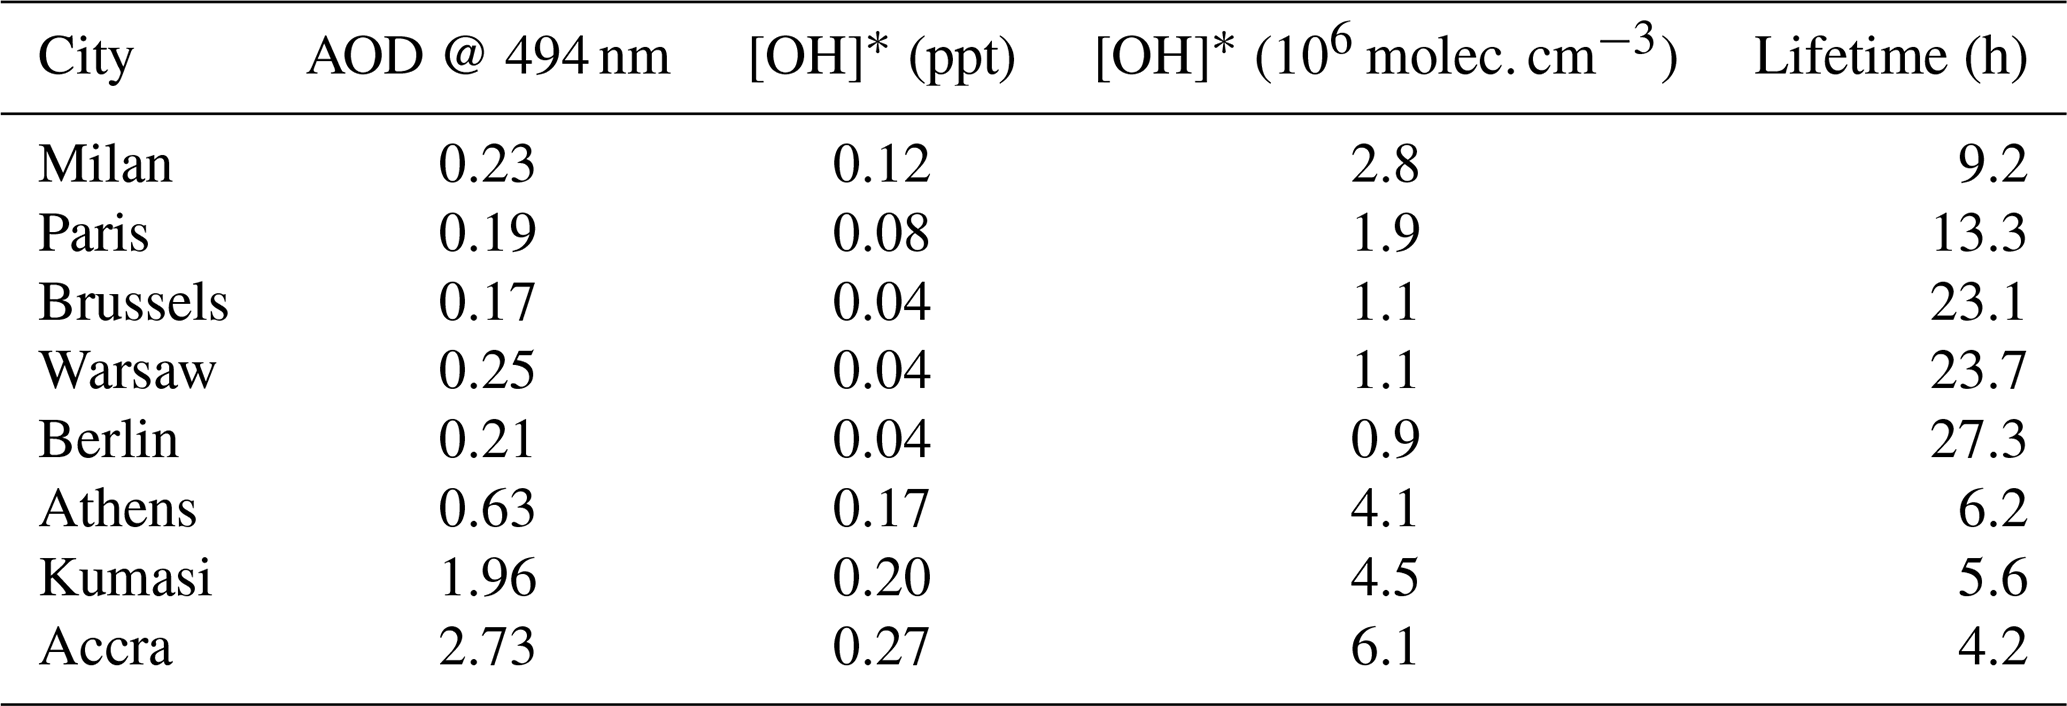
* Average concentrations between 850–1000 hPa.
4.3 NO2 height-distribution model
To better quantify the differences in column-to-surface NO2 ratios between European and Ghanaian cities, information on the vertical distribution of NO2 is required. Although this distribution is not directly known without dedicated atmospheric modelling, we can approximate it by introducing a simplified height-distribution model (Fig. 12) and fitting it to surface measurements and tropospheric column densities, explicitly incorporating their averaging kernels in the retrieval.
The model assumes that background NO2 is well-mixed within the planetary boundary layer (PBL) of height hPBL at the time of the satellite overpass, consistent with NO2 sonde observations (Sluis et al., 2010). Contributions from free-tropospheric NO2 to the tropospheric column density are considered negligible.
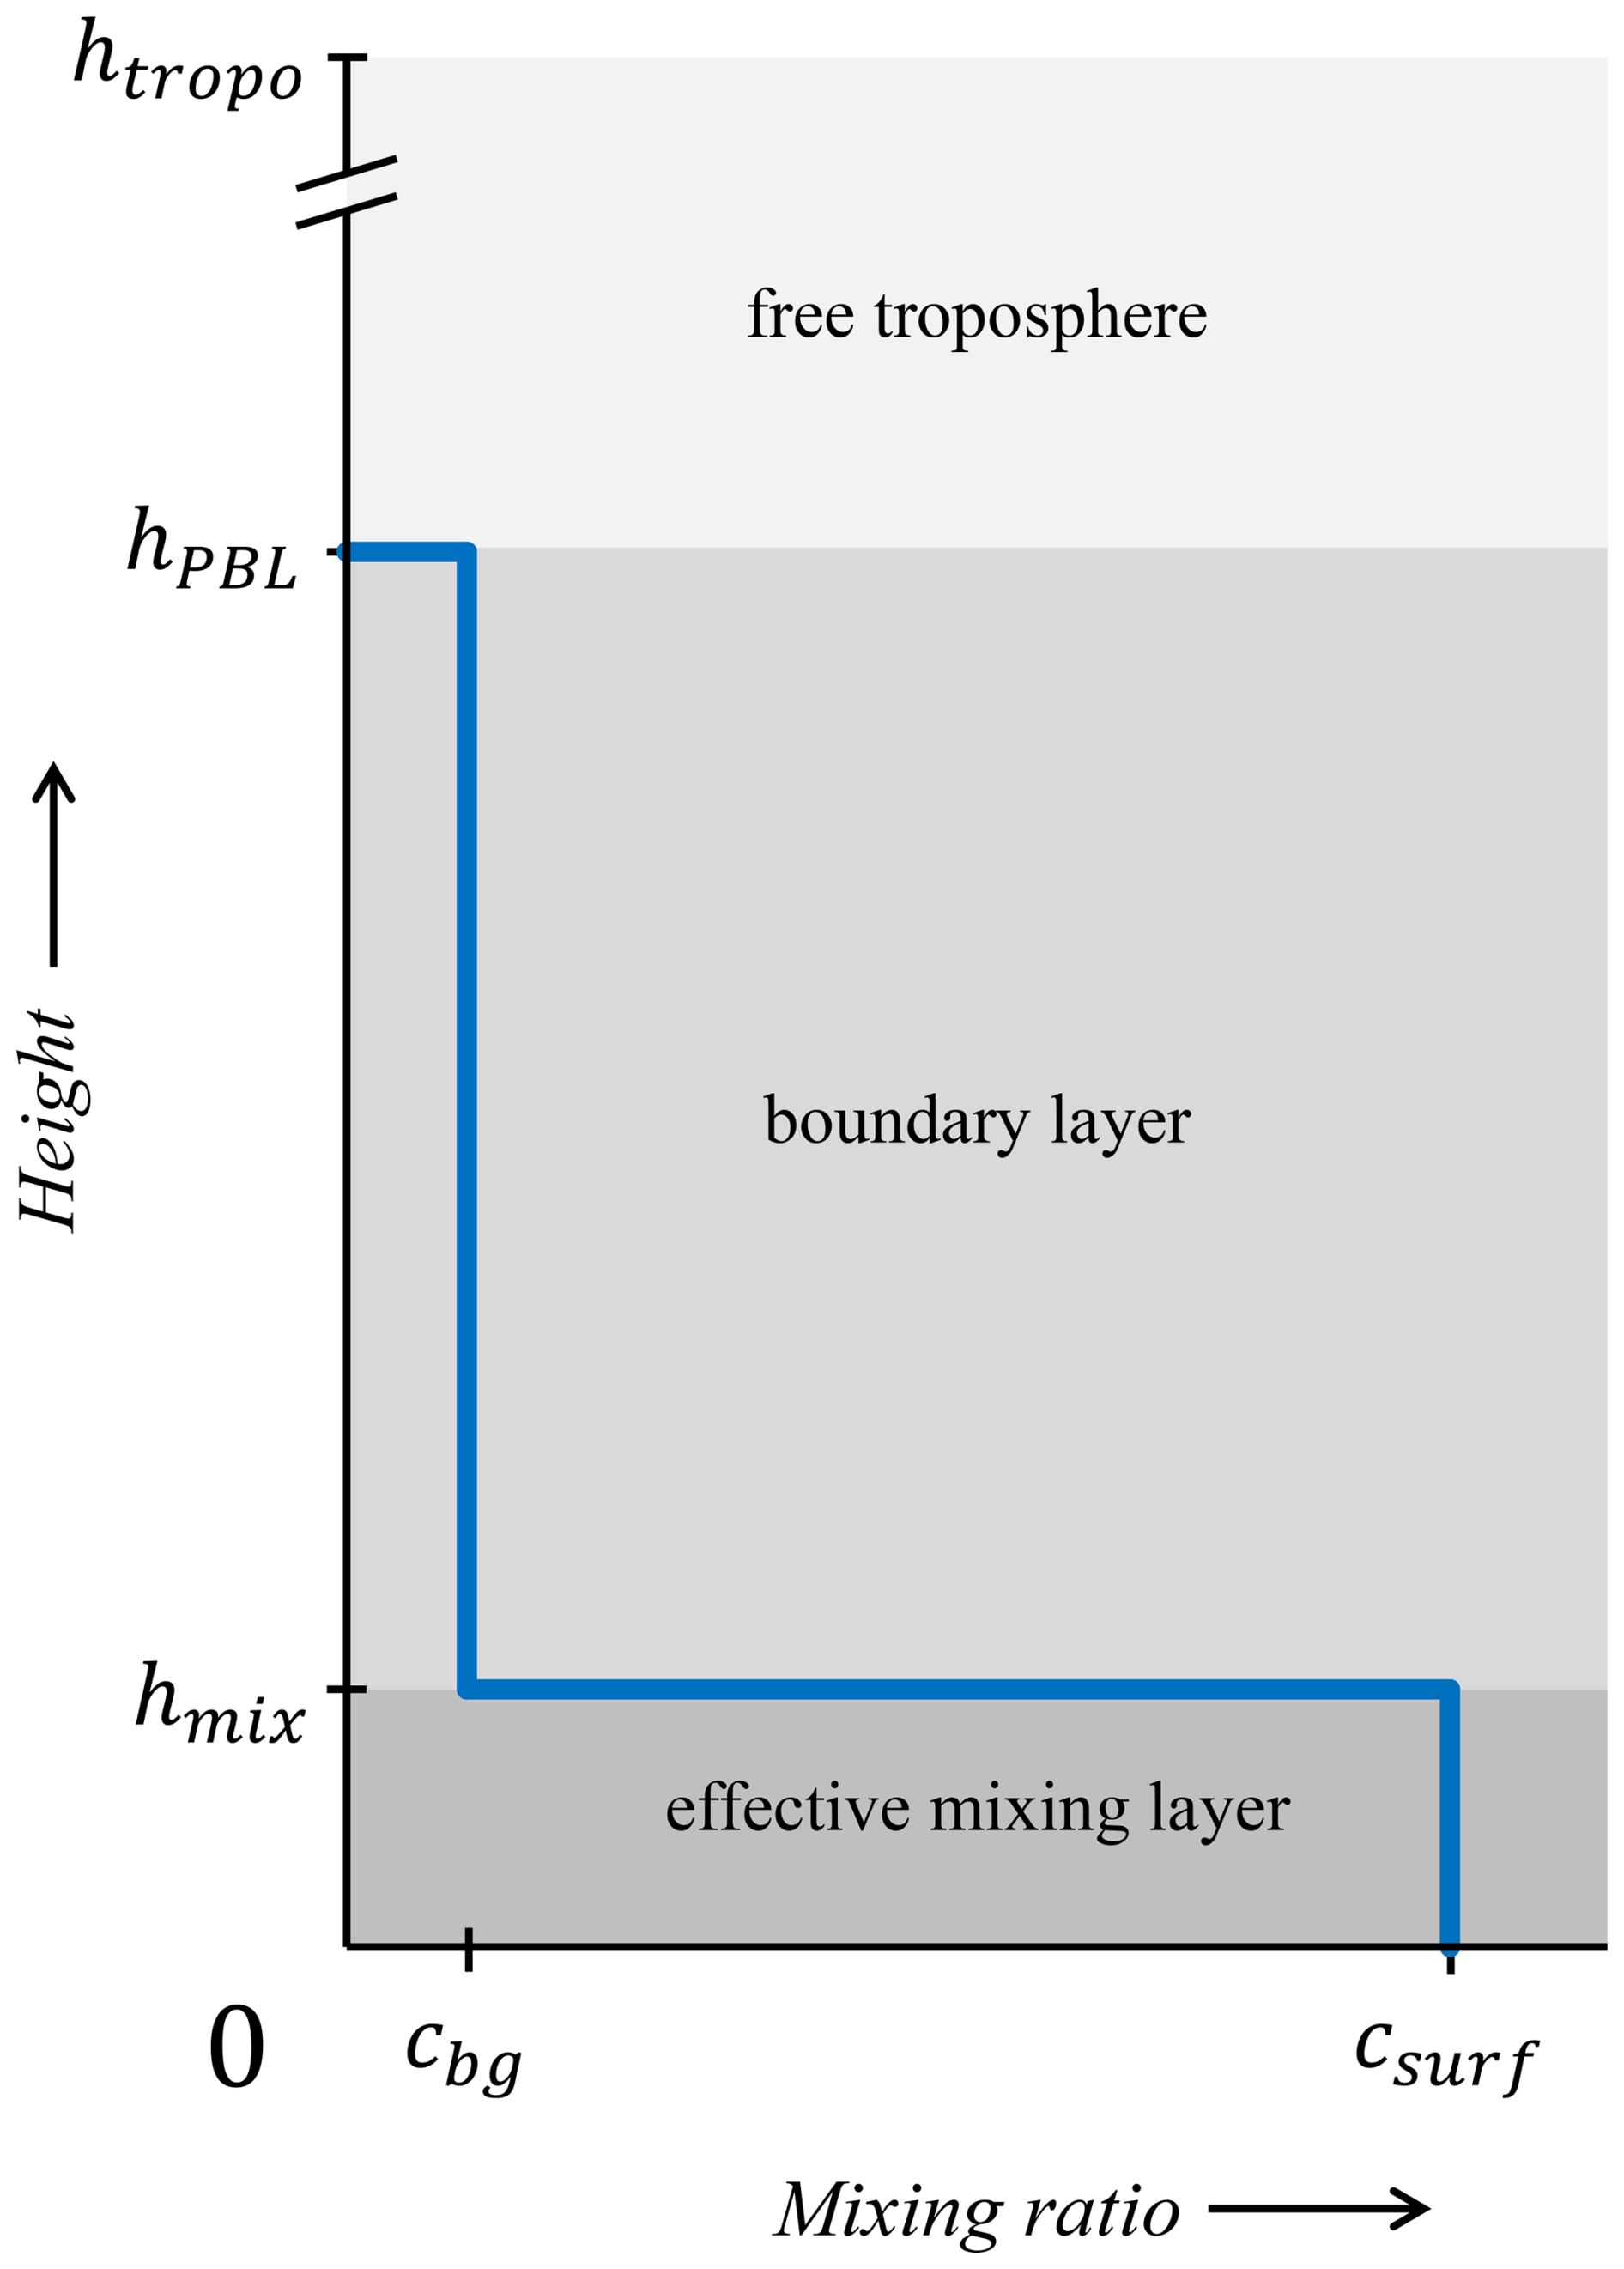
Figure 12Vertical distribution model for urban NO2 (blue line) with two fit parameters: the background is assumed to be well-mixed throughout the boundary layer with mixing ratio cbg, while the urban contribution is only well-mixed up to an effective height hmix. There is no NO2 in the free troposphere.
The urban NO2 component, originating from local emissions, is assumed not to be fully mixed vertically. Observations from the Eiffel Tower, for example, show that NO2 concentrations at 300 m height in central Paris are about 45 % lower than surface levels around the satellite overpass time (Dieudonné et al., 2013, Fig. 1b). Accordingly, we represent the urban plume as being well-mixed within an effective layer of height hmix, located below the PBL.
First, we determine the background surface concentration cbg. We estimate the background column density from the lowest TROPOMI retrieval value found within a 15 km radius around the city centre (see Fig. 10), and take hPBL taken from the ERA5 reanalysis (Hersbach et al., 2023). For a given concentration cbg (in ppb), the partial background column in an atmospheric layer l is
where NA is Avogadro's number, Mair the molar mass of dry air, and g the gravitational acceleration. The term is the pressure thickness of the layer within the PBL: for the layer containing hPBL, only the portion below the PBL top is used, and for layers entirely above the PBL, . Using Eq. (6), we find the relation between cbg, the observed , and the AK elements Al, which allows us to solve for cbg.
In the second step, we determine the mixing layer height hmix. We estimate the urban column density from the mean TROPOMI retrieval within a 10 km radius of the city centre, and take the surface concentration csurf from the in-situ measurements. For the block profile (blue curve in Fig. 12), the partial column in layer l is
where is the pressure thickness up to the mixing-layer height hmix, and zero above it. Using Eq. (6), we determine the value of hmix for which the profile matches the observed , given the averaging kernel Al.
Note that surface concentrations must correspond to the satellite overpass time. For the European cities, hourly measurements at 13:00 UTC are used; these are lower than the daily mean values by factors ranging from 0.63 (Warsaw, Berlin) to 0.76 (Milan, Paris). For Kumasi and Accra, we apply a factor of 0.69 to estimate values at overpass time from mean surface concentrations.
Table 8 presents the fit results and the recalculated column densities, derived by vertically integrating the profiles without applying the averaging kernel (Eq. 4). Comparing with the results from Table 6, the recalculated tropospheric column densities for Paris, Milan, Brussels, Berlin in March 2025 increase by 30 %–40 %. This is consistent with Douros et al. (2023), who attribute the underestimation of retrievals over emission hot spots to the coarse (1°×1°) TM5-MP profiles taken as a priori.
In contrast, the recalculated tropospheric NO2 column over Kumasi increases by a factor of 2.5. This larger correction can be attributed to a combined effect of the coarse a priori profile and a possible underestimation of the urban emissions in TM5-MP, and the reduced retrieval sensitivity caused by the high aerosol loading.
Table 8Recalculated tropospheric NO2 column densities obtained by fitting the vertical distribution model to combined column and surface observations.
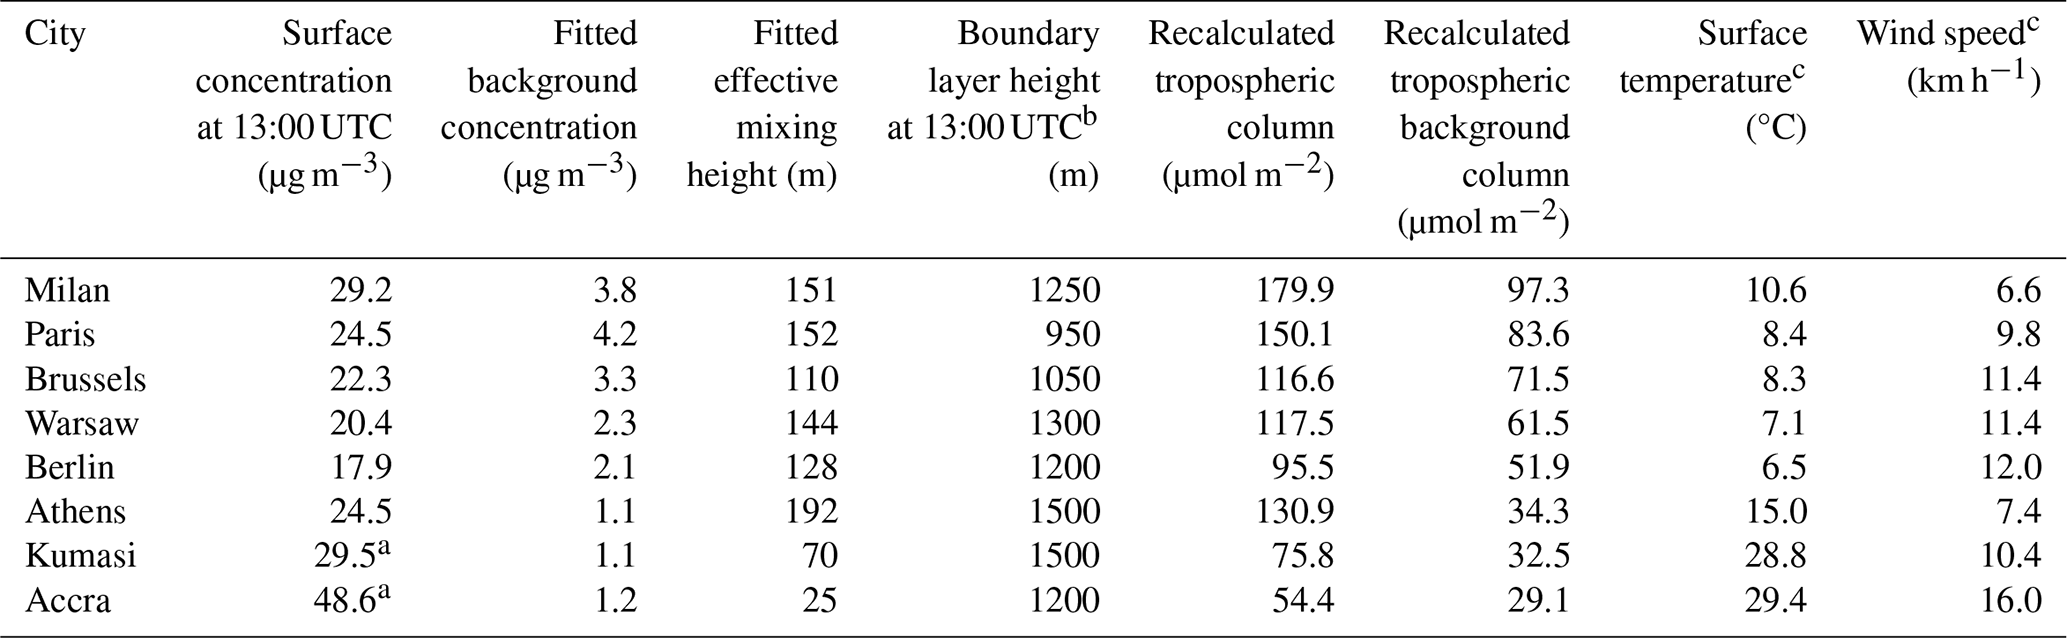
a Estimated from daily average by applying a ratio 0.69 as found on average for European cities. b Estimated from ERA5 reanalysis. c Monthly average for March 2025, taken from https://meteostat.net (last access: 13 April 2026).
Despite this increase, the recalculated NO2 columns over Kumasi (76 µmol m−2) and Accra (54 µmol m−2) remain substantially smaller than those observed over the European cities (132 µmol m−2 on average). The lower vertical mixing height hmix suggest that the shorter chemical lifetime – discussed in the previous section – is likely a contributing factor.
The resulting lower effective mixing height might seem counterintuitive, as one would expect stronger convection due to higher surface temperatures. Note that the very low value over Accra may partly result from an overestimation of the surface concentration (March 2020 may not represent March 2025) or from the reduced air mass residence time over the city due to stronger winds.
We established the first-ever Palmes diffusion tube measurement network in Kumasi, comprising 20 monitoring sites selected to reflect a diverse mix of urban environments, including traffic intersections, industrial zones, markets, hospitals, and residential areas. Tubes are replaced every month.
Blank samples revealed that PDTs are subject to degradation of triethanolamine (TEA) when exposed to ambient conditions. To account for this, a correction of 2.47 µg m−3 was uniformly applied to all measurements. From the duplo samples, we estimate the measurement precision of the method to be 3 µg m−3 for exposure times of 2 weeks. It should be noted that the minimal tube holder design does not shield the tubes from solar radiation and wind, which are the dominant sources for potential (positive) biases (Heal et al., 2019). Therefore, future measurements should ideally be done in protective housings. Other sources of offset may arise from TEA degradation under longer exposure periods in tropical conditions. To better understand and correct biases in the Kumasi network, we plan to conduct validation measurements against local reference instruments.
A wide range of ambient NO2 concentrations was recorded across Kumasi during March 2025, ranging from 7 µg m−3 in low-traffic, green areas (e.g., the KNUST campus) to 88 µg m−3 at major traffic intersections (e.g., Suame Circle). According to the World Health Organization (2021), the recommended air quality guidelines for NO2 are 25 µg m−3 for a 24 h mean and 10 µg m−3 for an annual mean. Assuming that March is reasonably representative of annual conditions, nearly all monitored sites in Kumasi exceed both WHO thresholds, highlighting a significant public health concern.
As observed in many African cities, economic activity in Kumasi is highly concentrated along major roads and highways, more so than in many cities in the Global North. The informal roadside economy is a defining urban feature, with markets, kiosks, street vendors, and transport hubs densely clustered along traffic corridors. As a result, large numbers of pedestrians and roadside workers are exposed to traffic-related air pollution on a daily basis.
Elevated NO2 levels were also detected near hospitals, raising further concern given the vulnerability of patients recovering from illness. The recorded concentrations at these healthcare facilities substantially exceeded WHO guidelines, underscoring the urgency of addressing transport-related air quality issues in densely populated and sensitive areas.
The citywide average NO2 concentration in Kumasi was 43 µg m−3, which is lower than values reported for Accra by Wang et al. (2022). Their 2019–2020 campaign using Ogawa passive samplers recorded an annual average of 68 µg m−3 (ranging from 28 to 98 µg m−3 between sites), with a seasonal variation of 60 µg m−3 during the wet season and 87 µg m−3 in the dry season. It remains unclear whether the observed difference between Kumasi and Accra reflects differences in site selection, emissions intensity, meteorological conditions, or urban structure.
Side-by-side comparisons show that PDTs prepared and analysed at the newly established KNUST laboratory yield results that closely match those from an accredited reference laboratory. The measurement uncertainty of the KNUST-processed PDTs is estimated at 5.1 µg m−3, though this estimate is based on a small sample size (n=10) and should be interpreted with caution.
The KNUST facility marks a significant advancement in regional air quality monitoring by enabling the local preparation, deployment, and analysis of NO2 diffusion tubes. This capability supports sustainable, affordable, and scalable monitoring efforts across Ghana and beyond. Beyond the technical achievement, this initiative contributes to the long-term development of local expertise, empowering institutions to independently assess spatial and temporal trends in NO2 concentrations, identify pollution hotspots (such as congested roads and industrial zones), and evaluate compliance with international air quality standards.
Ongoing monitoring is needed to assess seasonal variability, including the effects of wet and dry season meteorology and biomass burning, as background levels observed in March likely differ during the December–February burning season.
Satellite measurements over Kumasi in March reveal the presence of a downwind NO2 plume driven by dominant south-westerly winds. This plume is not clearly resolved by the existing Kumasi ground monitoring network. Expanding the network to include more urban background stations is necessary to accurately assess the impact of this urban plume on surface concentrations.
Column-to-surface ratios in Kumasi and Accra are significantly lower than those typically observed in European cities. This can only partly be attributed to shorter NOx lifetimes driven by higher OH abundances. The higher aerosol loading over Ghana reduces retrieval sensitivity in the lower troposphere, increasing the reliance on a priori profiles that are both spatially coarse and likely based on underestimated emissions in TM5-MP. This confirms earlier studies by Yombo Phaka et al. (2023), showing the large impact of the a priori profiles on NO2 retrievals over sub-Saharan tropical cities.
To address this, we introduced a simplified height distribution model that links tropospheric column observations to in-situ measurements. The resulting profiles indicate that columns in Kumasi are underestimated by a factor of 2.5 in March 2025, and that the vertical mixing layer over tropical cities is substantially shallower than in mid-latitude urban environments.
The underestimation of tropospheric NO2 columns leads to a distorted picture of surface concentrations when relying solely on satellite retrievals, potentially missing high surface pollution levels. Improving the application of satellite measurements in low-latitude urban areas therefore requires a more robust understanding of column-to-surface ratios. Long-term vertical profiling (e.g., by drones or sondes) would enable a more accurate characterisation of the urban pollution dome. Our findings also show the essential role of in-situ networks, such as the one established in Kumasi, for interpreting satellite retrievals and improving our understanding of regional air quality dynamics.
All analysis scripts were developed in Python and are available from the authors upon request. All results rely exclusively on open data sources, which are cited throughout the text. The pre-processed satellite, surface, and meteorological datasets can be accessed at https://doi.org/10.5281/zenodo.19370611 (Mijling, 2026).
BM and BA initiated the project. BA, EY, PA, PD, THE, MM, AGP designed and built the Kumasi laboratory and performed the field measurements. PJA provided the meteorological description. BM performed the data analysis and wrote the manuscript. BM and KFB developed the interpretation of the satellite retrievals. All authors discussed the results and improved the paper.
At least one of the (co-)authors is a member of the editorial board of Atmospheric Measurement Techniques. The peer-review process was guided by an independent editor, and the authors also have no other competing interests to declare.
Publisher's note: Copernicus Publications remains neutral with regard to jurisdictional claims made in the text, published maps, institutional affiliations, or any other geographical representation in this paper. The authors bear the ultimate responsibility for providing appropriate place names. Views expressed in the text are those of the authors and do not necessarily reflect the views of the publisher.
The authors thank Lindsey Schwidder (TU Delft) for connecting KNMI with KNUST, Raphael Arku for sharing the 2019–2020 Accra passive sampler data, and Matthijs Dijk (Utrecht University) for donating the Hach DR5000 spectrophotometer.
This paper was edited by Lok Lamsal and reviewed by two anonymous referees.
Arku, R. E.: Weekly integrated NO2 and NO concentrations measured at 146 locations in Accra, Ghana for 2019–2020 (Wang et al., Science of The Total Environment, 2021), Zenodo [data set], https://zenodo.org/records/11491628, 2021.
Beirle, S., Boersma, K. F., Platt, U., Lawrence, M. G., and Wagner, T.: Megacity emissions and lifetimes of nitrogen oxides probed from space, Science, 333, 1737–1739, https://doi.org/10.1126/science.1207824, 2011.
Bi, J., Stowell, J., Seto, E. Y. W., English, P. B., Al-Hamdan, M. Z., Kinney, P. L., Freedman, F. R., and Liu, Y.: Contribution of low-cost sensor measurements to the prediction of PM2.5 levels: a case study in Imperial County, California, USA, Environ. Res., 180, 108810, https://doi.org/10.1016/j.envres.2019.108810, 2020.
Cersosimo, A., Serio, C., and Masiello, G.: TROPOMI NO2 tropospheric column data: regridding to 1 km grid-resolution and assessment of their consistency with in-situ surface observations, Remote Sens., 12, 2212, https://doi.org/10.3390/rs12142212, 2020.
Chameides, W. L., Kasibhatla, P. S., Yienger, J., and Levy, H.: Growth of continental-scale metro-agro-plexes, regional ozone pollution, and world food production, Science, 264, 74–77, https://doi.org/10.1126/science.264.5155.74, 1994.
Chong, K., Wang, Y., Liu, C., Gao, Y., Boersma, K. F., Tang, J., and Wang, X.: Remote sensing measurements at a rural site in China: implications for satellite NO2 and HCHO measurement uncertainty and emissions from fires, J. Geophys. Res.-Atmos., 129, e2023JD039310, https://doi.org/10.1029/2023JD039310, 2024.
De Vries, W.: Impacts of nitrogen emissions on ecosystems and human health: a mini review, Curr. Opin. Environ. Sci. Health, 21, 100249, https://doi.org/10.1016/j.coesh.2021.100249, 2021.
Dieudonné, E., Ravetta, F., Pelon, J., Goutail, F., and Pommereau, J.-P.: Linking NO2 surface concentration and integrated content in the urban developed atmospheric boundary layer, Geophys. Res. Lett., 40, 1247–1251, https://doi.org/10.1002/grl.50242, 2013.
Dons, E., Laeremans, M., Anaya-Boig, E., Avila-Palencia, I., Brand, C., de Nazelle, A., Gaupp-Berghausen, M., Götschi, T., Nieuwenhuijsen, M., Orjuela, J. P., Raser, E., Standaert, A., and Int Panis, L.: Concern over health effects of air pollution is associated with NO2 in seven European cities, Air Qual. Atmos. Hlth., 11, 591–599, https://doi.org/10.1007/s11869-018-0567-3, 2018.
Douros, J., Eskes, H., van Geffen, J., Boersma, K. F., Compernolle, S., Pinardi, G., Blechschmidt, A.-M., Peuch, V.-H., Colette, A., and Veefkind, P.: Comparing Sentinel-5P TROPOMI NO2 column observations with the CAMS regional air quality ensemble, Geosci. Model Dev., 16, 509–534, https://doi.org/10.5194/gmd-16-509-2023, 2023.
Eckert, T., Mairhofer, M., Agueda, G. P., and Mijling, B.: Lab manual for local ambient NO2 monitoring in Kumasi using diffusion tubes, Zenodo, https://doi.org/10.5281/zenodo.17522013, 2025.
European Environment Agency (EEA): Air Quality Download Service, https://eeadmz1-downloads-webapp.azurewebsites.net (last access: 10 November 2025), 2025.
Eskes, H. J. and Boersma, K. F.: Averaging kernels for DOAS total-column satellite retrievals, Atmos. Chem. Phys., 3, 1285–1291, https://doi.org/10.5194/acp-3-1285-2003, 2003.
Eskes, H., van Geffen, J. H. G. M., Boersma, F., Eichmann, K.-U., Apituley, A., Pedergnana, M., Sneep, M., Veefkind, J. P., and Loyola, D.: Sentinel-5P/TROPOMI Level 2 Product User Manual: Nitrogen Dioxide, KNMI, https://sentinels.copernicus.eu/documents/247904/2474726/Sentinel-5P-Level-2-Product-User-Manual-Nitrogen-Dioxide.pdf (last access: 15 October 2025), 2022.
Fua, J., Tang, D., Grieneisen, M. L., Yang, F., Yang, J., Wu, G., Wang, C., and Zhan, Y.: A machine-learning approach for fusing measurements from standard sites, low-cost sensors, and satellite retrievals: application to NO2 hotspot identification, Atmos. Environ., 302, 119756, https://doi.org/10.1016/j.atmosenv.2023.119756, 2023.
Filonchyk, M. and Peterson, M. P.: Investigation of NOx emissions from coal power plants in Texas and their environmental impact, China Geology, 8, 107–116, https://doi.org/10.31035/cg20230093, 2025.
Gao, M., Cao, J., and Seto, E.: A distributed network of low-cost sensors to measure spatiotemporal variations of PM2.5 in Xi'an, China, Environ. Pollut., 199, 56–65, https://doi.org/10.1016/j.envpol.2015.01.013, 2015.
Glissenaar, I., Boersma, K. F., Anglou, I., Rijsdijk, P., Verhoelst, T., Compernolle, S., Pinardi, G., Lambert, J.-C., Van Roozendael, M., and Eskes, H.: TROPOMI Level 3 tropospheric NO2 dataset with advanced uncertainty analysis from the ESA CCI+ ECV precursor project, Earth Syst. Sci. Data, 17, 4627–4650, https://doi.org/10.5194/essd-17-4627-2025, 2025.
Goldberg, D. L., Anenberg, S. C., Kerr, G. H., Mohegh, A., Lu, Z., and Streets, D. G.: TROPOMI NO2 in the United States: A Detailed Look at the Annual Averages, Weekly Cycles, Effects of Temperature, and Correlation with Surface NO2 Concentrations, Earth's Future, 9, e2020EF001665, https://doi.org/10.1029/2020EF001665, 2021.
Gwaze, P. and Mashele, S. H.: South African Air Quality Information System (SAAQIS) mobile application tool: Bringing real time state of air quality to South Africans, Clean Air Journal, 28, https://doi.org/10.17159/2410-972X/2018/v28n1a1, 2018.
Heal, M. R., Laxen, D. P., and Marner, B. B.: Biases in the measurement of ambient nitrogen dioxide (NO2) by Palmes passive diffusion tube: a review of current understanding, Atmosphere, 10, 357, 2019.
Hersbach, H., Bell, B., Berrisford, P., Biavati, G., Horányi, A., Muñoz Sabater, J., Nicolas, J., Peubey, C., Radu, R., Rozum, I., Schepers, D., Simmons, A., Soci, C., Dee, D., and Thépaut, J.-N.: ERA5 hourly data on single levels from 1940 to present, Copernicus Climate Data Store, https://doi.org/10.24381/cds.adbb2d47, 2023.
Huang, T.-J., Chiang, D.-Y., Shih, C., Lee, C.-C., Mao, C.-W., and Wang, B.-C.: Promoted decomposition of NOx in diesel-like exhausts by electro-catalytic honeycombs, Environ. Sci. Technol., 49, 3711–3717, https://doi.org/10.1021/acs.est.5b00226, 2015.
Huang, C., Sun, K., Hu, J., Xue, T., Xu, H., and Wang, M.: Estimating 2013-2019 NO2 exposure with high spatiotemporal resolution in China using an ensemble model, Environ. Pollut., 292, 118285, https://doi.org/10.1016/j.envpol.2021.118285, 2022.
Ialongo, I., Virta, H., Eskes, H., Hovila, J., and Douros, J.: Comparison of TROPOMI/Sentinel-5 Precursor NO2 observations with ground-based measurements in Helsinki, Atmos. Meas. Tech., 13, 205–218, https://doi.org/10.5194/amt-13-205-2020, 2020.
Jeong, U. and Hong, H.: Assessment of tropospheric NO2 from TROPOMI for long-term exposure estimation in South Korea, Remote Sens., 13, 1877, https://doi.org/10.3390/rs13101877, 2021.
Jin, H., Ji, H., Wang, H., and Li, S.: Ozone detection based on nitrogen-oxide photoacoustic spectroscopy system and chemical reaction, Environ. Prot. Eng., 49, 73–87, https://doi.org/10.37190/epe230405, 2023.
Kim, C., Henneman, L. R. F., Choirat, C., and Zigler, C. M.: Health effects of power-plant emissions through ambient air quality, J. R. Stat. Soc. A, 183, 1677–1703, https://doi.org/10.1111/rssa.12547, 2020.
KNMI, ESA, and European Commission: Sentinel-5P Aerosol Optical Thickness Product v02.03.00, S5P-PAL Data Portal, https://data-portal.s5p-pal.com/products/aot.html (last access: 10 November 2025), 2025.
Koziel, S., Pietrenko-Dabrowska, A., Wojcikowski, M., and Pankiewicz, B.: High- performance machine-learning-based calibration of low-cost nitrogen dioxide sensor using environmental parameter differentials and global data scaling, Sci. Rep., 14, 26120, https://doi.org/10.1038/s41598-024-77214-y, 2024.
Li, J., Hauryliuk, A., Malings, C., Eilenberg, S. R., Subramanian, R., and Presto, A. A.: Characterizing the aging of Alphasense NO2 sensors in long-term field deployments, ACS Sens., 6, 2952–2959, https://doi.org/10.1021/acssensors.1c00729, 2021.
Ling, L., Gao, S., Wang, F., and Wang, J.: Atmospheric NO2 measurement based on dual-optical-path photoacoustic spectroscopy, Opt. Commun., 585, 131837, https://doi.org/10.1016/j.optcom.2025.131837, 2025.
Lorente, A., Boersma, K. F., Eskes, H. J., Veefkind, J. P., Van Geffen, J. H. G. M., De Zeeuw, M. B., Denier Van Der Gon, H. A. C., Beirle, S., and Krol, M. C.: Quantification of NOx emissions from build-up of pollution over Paris with TROPOMI, Sci. Rep., 9, 20033, https://doi.org/10.1038/s41598-019-56428-5, 2019.
Massman, W. J.: Review of molecular diffusivities of atmospheric gases near STP, Atmos. Environ., 32, 1111–1127, https://doi.org/10.1016/S1352-2310(97)00391-9, 1998.
Medlanda, D., Garcia, G., Gardiner, T., Martin, N. A., Ferracci, V., Wilkins, A., Fryer, D., Holmes, T., Edwards, P., Diez, S., and Butterfield, D.: Comparison of NO2 diffusion tube measurement methods and uncertainties, Atmos. Environ., 352, 121219, https://doi.org/10.1016/j.atmosenv.2025.121219, 2025.
Mijling, B., Jiang, Q., de Jonge, D., and Bocconi, S.: Field calibration of electrochemical NO2 sensors in a citizen science context, Atmos. Meas. Tech., 11, 1297–1312, https://doi.org/10.5194/amt-11-1297-2018, 2018.
Mijling, B., Eskes, H., Hofmann, S., Moreno, P., García Falin, D., and de Vega Pastor, M. E.: High-resolution mapping of urban NO2 concentrations using Retina v2: a case study on data assimilation of surface and satellite observations in Madrid, Geosci. Model Dev., 18, 6439–6460, https://doi.org/10.5194/gmd-18-6439-2025, 2025.
Mijling, B.: Pre-processed data used in the comparison between NO2 column densities and surface concentrations over selected cities (Mijling et al., 2026) (v1.0), Zenodo [data set], https://doi.org/10.5281/zenodo.19370611, 2026.
OpenAQ: Global air-quality data explorer, https://explore.openaq.org (last access: 13 June 2025), 2025.
Palmes, E. D., Gunnison, A., DiMattio, J., and Tomczyk, C.: Personal sampler for nitrogen dioxide, Am. Ind. Hyg. Assoc. J., 37, 570–577, https://doi.org/10.1080/0002889778507831, 1976.
Qi, H., Zhao, X., Xu, Y., Yang, L., Liu, J., and Chen, K.: Rapid photoacoustic exhaust gas analyzer for simultaneous measurement of nitrogen dioxide and sulfur dioxide, Anal. Chem., 96, 5258–5264, https://doi.org/10.1021/acs.analchem.3c05936, 2024.
Sander, S. P., Friedl, R. R., Golden, D. M., Kurylo, M. J., Moortgat, G. K., Wine, P. H., Ravishankara, A. R., Kolb, C. E., Molina, M. J., Finlayson-Pitts, B. J., and Huie, R. E.: Chemical kinetics and photochemical data for use in atmospheric studies evaluation number 15, JPL Publ. 06-2, https://jpldataeval.jpl.nasa.gov/previous_evaluations.html (last access: 13 April 2026), 2006.
Schneider, P., Castell, N., Vogt, M., Dauge, F. R., Lahoz, W. A., and Bartonova, A.: Mapping urban air quality in near real time using low-cost sensors and model information, Environ. Int., 106, 234–247, https://doi.org/10.1016/j.envint.2017.05.005, 2017.
Sluis, W. W., Allaart, M. A. F., Piters, A. J. M., and Gast, L. F. L.: The development of a nitrogen dioxide sonde, Atmos. Meas. Tech., 3, 1753–1762, https://doi.org/10.5194/amt-3-1753-2010, 2010.
Strížik, M., Zelinger, Z., Kubát, P., Civiš, S., Bestová, I., Nevrlý, V., Kadeřábek, P., Čadil, J., Berger, P., Černý, A., and Engst, P.: Influence of photochemical processes on traffic-related pollutants in an urban canyon, J. Atmos. Sol.-Terr. Phy., 147, 1–10, https://doi.org/10.1016/j.jastp.2016.06.009, 2016.
Takte, M. A., Ingle, N. N., Dole, B. N., Tsai, M.-L., Hianik, T., and Shirsat, M. D.: A stable and highly-sensitive flexible gas sensor based on ceria (CeO2) nano-cube decorated rGO nanosheets for selective detection of NO2 at room temperature, Synth. Met., 297, 117411, https://doi.org/10.1016/j.synthmet.2023.117411, 2023.
Targa, J. and Loader, L.: Diffusion Tubes for Ambient NO2 Monitoring: Practical Guidance for Laboratories and Users, ED48673043 Issue 1a, Feb 2008, The DEFRA Working Group on Harmonisation of Diffusion Tubes, https://laqm.defra.gov.uk/documents/0802141004_NO2_WG_PracticalGuidance_Issue1a.pdf (last access: 20 November 2025), 2008.
UN DESA: World Population Prospects 2024, https://population.un.org/wpp (last access: 14 October 2025), 2024.
Van der Eerden, L. J. and Duym, N.: Evaluation method for SO2 and NO2 effects on vegetation, Environ. Pollut., 53, 468–470, https://doi.org/10.1016/0269-7491(88)90080-2, 1988.
van Geffen, J., Eskes, H., Compernolle, S., Pinardi, G., Verhoelst, T., Lambert, J.-C., Sneep, M., ter Linden, M., Ludewig, A., Boersma, K. F., and Veefkind, J. P.: Sentinel-5P TROPOMI NO2 retrieval: impact of version v2.2 improvements and comparisons with OMI and ground-based data, Atmos. Meas. Tech., 15, 2037–2060, https://doi.org/10.5194/amt-15-2037-2022, 2022.
van Geffen, J., Boersma, K. F., Eskes, H., Sneep, M., ter Linden, M., Zara, M., and Veefkind, J. P.: S5P TROPOMI NO2 slant column retrieval: method, stability, uncertainties and comparisons with OMI, Atmos. Meas. Tech., 13, 1315–1335, https://doi.org/10.5194/amt-13-1315-2020, 2020.
Veefkind, J. P., Aben, I., McMullan, K., Förster, H., De Vries, J., Otter, G., Claas, J., Eskes, H. J., De Haan, J. F., Kleipool, Q., and Van Weele, M.: TROPOMI on Sentinel-5 Precursor: A GMES mission for global observations of the atmospheric composition for climate, air quality and ozone layer applications, Remote Sens. Environ., 120, 70–83, https://doi.org/10.1016/j.rse.2011.09.027, 2012.
Voordeckers, D., Meysman, F. J. R., Billen, P., Tytgat, T., and Van Acker, M.: The impact of street canyon morphology and traffic volume on NO2 values in the street canyons of Antwerp, Build. Environ., 197, 107825, https://doi.org/10.1016/j.buildenv.2021.107825, 2021.
Wang, J., Alli, A. S., Clark, S., Hughes, A., Ezzati, M., Beddows, A., Vallarino, J., Nimo, J., Bedford-Moses, J., Baah, S., Owusu, G., Agyemang, E., Kelly, F., Barratt, B., Beevers, S., Agyei-Mensah, S., Baumgartner, J., Brauer, M., and Arku, R. E.: Nitrogen oxides (NO and NO2) pollution in the Accra metropolis: Spatiotemporal patterns and the role of meteorology, Sci. Total Environ., 803, 149931, https://doi.org/10.1016/j.scitotenv.2021.149931, 2022.
Wang, J., Alli, A. S., Clark, S. N., Ezzati, M., Brauer, M., Hughes, A. F., Nimo,J., Moses, J. B., Baah, S., Nathvani, R., Agyei-Mensah, V. D. S., Baumgartner, J., Bennett, J. E., and Arku, R. E.: Inequalities in urban air pollution in sub-saharan africa: an empirical modeling of ambient NO and NO2 concentrations in Accra, Ghana, Environ. Res. Lett., 19, 034036, https://doi.org/10.1088/1748-9326/ad2892, 2024.
Williams, J. E., Boersma, K. F., Le Sager, P., and Verstraeten, W. W.: The high-resolution version of TM5-MP for optimized satellite retrievals: description and validation, Geosci. Model Dev., 10, 721–750, https://doi.org/10.5194/gmd-10-721-2017, 2017.
WMO: GAW Report No. 293 – Integrating low-cost sensor systems to enhance air-quality applications, https://library.wmo.int/idurl/4/68924 (last access: 14 October 2025), 2024.
World Health Organization (WHO): WHO global air-quality guidelines, https://www.who.int/publications/i/item/9789240034228 (last access: 13 April 2026), 2021.
World Health Organization (WHO): Household air pollution fact sheet, https://www.who.int/news-room/fact-sheets/detail/household-air-pollution-and-health (last access: 12 June 2025), 2023.
World Health Organization (WHO): Health data overview for Ghana, https://data.who.int/countries/288 (last access: 12 June 2025), 2025.
Yombo Phaka, R., Merlaud, A., Pinardi, G., Friedrich, M. M., Van Roozendael, M., Müller, J.-F., Stavrakou, T., De Smedt, I., Hendrick, F., Dimitropoulou, E., Bopili Mbotia Lepiba, R., Phuku Phuati, E., Djibi, B. L., Jacobs, L., Fayt, C., Mbungu Tsumbu, J.-P., and Mahieu, E.: Ground-based Multi-AXis Differential Optical Absorption Spectroscopy (MAX-DOAS) observations of NO2 and H2CO at Kinshasa and comparisons with TROPOMI observations, Atmos. Meas. Tech., 16, 5029–5050, https://doi.org/10.5194/amt-16-5029-2023, 2023.