
the Creative Commons Attribution 4.0 License.
the Creative Commons Attribution 4.0 License.
 | 26 May 2026
A methodological framework for evaluating real-time bioaerosol classification algorithms
Marie-Pierre Meurville
Bernard Clot
Sophie Erb
Maria Lbadaoui-Darvas
Fiona Tummon
Gian-Duri Lieberherr
Benoît Crouzy
Advances in automatic bioaerosol monitoring require updated approaches to evaluate particle classification algorithms. We present a training and evaluation framework based on three metrics: (1) Kendall's Tau correlation between predicted and manual concentrations, (2) scaling factor, to assess identification efficiency, and (3) off-season noise ratio, quantifying off-season false predictions. Metrics are computed per class across confidence thresholds and five stations, and visualised in graphs revealing overfitting, station-specific biases, and sensitivity–specificity trade-offs. We provide optimal ranges for each metric respectively calculated from correlations on co-located manual measurements, worst-case scenario off-season noise ratio, and physical sampling limits constraining acceptable scaling factor. The evaluation framework was applied to seven deep-learning classifiers trained on holography and fluorescence data from SwisensPoleno devices, and compared with the 2022 holography-only classifier. Classifier performances are compared through visualisation methods, helping identifying over-training, misclassification between morphologically similar taxa or between pollen and non-pollen particles. This methodology allows a transparent and reproducible comparison of classification algorithms, independent of classifier architecture and device. Its adoption could help standardise performance reporting across the research community, even more so when evaluation datasets are standardised across different regions.
- Article
(9283 KB) - Full-text XML
-
Supplement
(767 KB) - BibTeX
- EndNote


Bioaerosol, and pollen in particular, have been routinely monitored in many countries using Hirst-type manual traps (Hirst, 1952) since the mid 1950s (Hyde, 1959; Emberlin et al., 1993; Buters et al., 2018; Gehrig and Clot, 2021). This method relies on manual identification and counting of pollen grains under a microscope. It is a time-consuming process and results in a delay between data collection and delivery (Galán et al., 2014). The last decade has seen the development of numerous automatic instruments that can detect and identify bioaerosol in real- or near-real time (Tummon et al., 2021; Huffman et al., 2019), often using machine learning algorithms (Brdar et al., 2023; Erb et al., 2024).
Since 2020, SwissPollen, the Swiss national bioaerosol monitoring network operated by the Federal Office of Meteorology and Climatology MeteoSwiss (denoted MeteoSwiss hereafter), has equipped 16 sites with SwisensPoleno automatic bioaerosol monitoring systems (Sauvageat et al., 2020), which were fully operational in 2023. The SwisensPoleno uses flow cytometry to isolate single particles and measure their characteristics, which are used as input features for a classification algorithm for the identification of particles. The SwisensPoleno instrument has evolved over the last 3–4 years, from just taking holographic images to also recording standardised fluorescence spectra of each particle. As a result, classification algorithms have needed to be adapted to take into account these new data, aiming to improve classification resolution and accuracy.
The classification algorithm used for the SwissPollen network since January 2023 was based only on holographic images and hourly information about seven pollen taxa have been made available to the public since then. While considered good enough for operational use (Maya-Manzano et al., 2023), the algorithm is known to suffer from several problems. Firstly, water droplets, present in high humidity conditions (i.e, fog or rain), can be misclassified as grass pollen due to similarities in shape and size. Additionally, some genera, for example within the Betulaceae family, have been shown to be difficult to classify reliably using holographic images only (Sauvageat et al., 2020). More generally, training bioaerosol classification algorithms remains challenging, since large training datasets are required to cover the entire spectrum of diversity of the bioaerosol present in a given country or region. Additionally, the development of new deep learning classifiers is a bottleneck in the community, as it requires substantial computational, technical and human resources.
Once a new classification algorithm has been trained, it is important to evaluate whether it improves performance compared to previous algorithms, using dedicated metrics and associated visualisations, that help identify over-training and misclassification. For the SwissPollen network, this entailed assessing the performance of the algorithm for the seven pollen taxa for which accurate pollen information is of particular relevance to Swiss allergy sufferers (Wüthrich et al., 2009), i.e., Poaceae (grass), Corylus (hazel), Alnus (alder), Betula (birch), Quercus (oak), Fagus (beech) and Fraxinus (ash). Evaluation of classification algorithms is commonly carried out against manual measurements from Hirst-type method, despite the limitations related to such measurements. These include the fact that only a fraction of the sample is counted (European Committee for Standardization, 2019), the air flow can be unsteady and is not continuously measured (Triviño et al., 2023), sampling is prone to human error (Sikoparija et al., 2016), and at low particle concentrations, the measurement uncertainty is very high (Adamov et al., 2021). It is therefore important, when evaluating classification algorithms with operational manual observations, to use data from several locations and over the longest possible period. Additionally, water droplets are not identified by Hirst-type traps, meaning there is no reference available for this class of particles.
As automatic bioaerosol monitoring technologies and operational networks are still emerging, the need for transparent and reproducible evaluation frameworks is becoming increasingly critical. Here, we present a method for developing and comparing deep learning classifiers in their operationally relevant differences. The framework is demonstrated through the training and evaluation of several classifiers, leading to the identification of a new operational model for the SwissPollen network using holographic and standardised fluorescence data from the Swisens Poleno Jupiter. These new models are compared both to the long-standing operational model, which relies solely on holographic data, and among themselves when fluorescence information is included, in order to identify models that demonstrate improved performance on operational data. More generally, we aim to provide a structured protocol that supports the community in (1) training deep-learning classifiers while identifying potential biases and overtraining, (2) comparing and evaluating classifiers for use in operational networks, and (3) selecting the most suitable model based on transparent metrics and associated visualisations. The evaluation strategy involves applying different classifiers to operational data from five SwissPollen stations. To support systematic algorithm comparison, we develop evaluation metrics that identify the best-performing classifiers for real-time bioaerosol identification. These metrics provide a reproducible framework for evaluating bioaerosol classification algorithms developed across the globe for any automatic bioaerosol monitoring system.
We present a framework for comparing several bioaerosol classifiers using algorithms developed for SwisensPoleno instruments, regardless of the number of taxa of interest. The example of the operational SwissPollen network is shown to illustrate this pipeline.
2.1 Instruments and raw data
The SwisensPoleno Jupiter measures airborne particles ranging in size from 0.5 to 300 µm as they pass through the instrument in-flight. When a particle triggers the detector, two orthogonally-arranged cameras capture in-flight holograms (200 × 200 pixels, greyscale). Fluorescence is then induced sequentially using three excitation sources (280, 365, and 405 nm), and the emitted light is recorded within five spectral windows (333–381, 411–459, 465–501, 539–585, and 658–694 nm), each named according to its central wavelength (357, 435, 483, 562, and 676 nm). This yields 15 raw fluorescence intensity values. However, the first channel becomes saturated due to scattered light when the 365 nm excitation is used, and for single-photon excitation at 405 nm, no signal is expected in the same channel as this would violate energy conservation. This effectively reduces the number of usable fluorescence values to 13. The fluorescence data are further pre-processed to ensure consistency and robustness across instruments. The full set of measurements for an individual particle, including each pair of holographic images and fluorescence intensities, is referred to as an “event” (Sauvageat et al., 2020; Erb et al., 2024; Berg and Videen, 2011).
2.2 Training datasets
The classification algorithms were trained on three different datasets, composed of single-taxa datasets. Each dataset covers the same 15 classes: Alnus, Betula, Carpinus, Corylus, Cupressus, Fagus, Fraxinus, Pinaceae, Platanus, Poaceae, Populus, Quercus, Taxus, Ulmus and Raindrops. Each event includes two 200 × 200 pixel holographic images, with or without fluorescence data depending on the single-taxa dataset it is part of.
Classes in training datasets are built from single-taxa datasets that combine events from species of the same genus, apart for the Pinaceae class, which contains events of Picea, Cedrus, Pinus, and Larix genera, as well as the Poaceae family, which groups events from the Alopecurus, Arrhenatherum, Bromus, Lolium, Dactylis, Trisetum and Cynosurus genera. Further detailed information about the training datasets used can be found in Table S1 in the Supplement, on the Github repository (MeteoSwiss, 2025) and Zenodo archive (Crouzy et al., 2026).
The training single-taxa datasets were cleaned manually using the Open Source Swisens Data Explorer tool. Particles that were clearly not pollen were removed based on the holographic images, as were events for which the images included more than one particle or none at all.
2.2.1 Holographic dataset
The 2022-Operational algorithm was trained using only holographic images (i.e., no fluorescence). A total of 166 262 events were used, with the Carpinus class having the lowest number of events (2247) and the Poaceae class the maximum number of events (22 666). All holographic-only single-taxa datasets that make the training dataset were produced in Switzerland between 2020 and 2021.
2.2.2 Holographic & fluorescence dataset
The 2025-Beta-1, 2025-Gamma-1, and 2025-Omega-1 algorithms were trained on a dataset that includes events with both holographic images and fluorescence measurements. The training dataset includes a total of 563 063 events, with a minimum of 9461 for the Ulmus class and a maximum of 75 197 for the Poaceae class. The single-taxa datasets that make this training dataset are part of those produced and described in Erb et al. (2025).
2.2.3 Combined dataset
The 2025-Beta-2, 2025-Gamma-2, 2025-Gamma-3 and 2025-Omega-2 algorithms were trained on a mix of the two aforementioned datasets as well as a few additional single-taxa datasets containing both holography and fluorescence data chosen in a targeted way to compensate for the lack of diversity for certain classes. This training dataset is composed of 104 single-taxa datasets, the classes containing a minimum of 14 391 (class Populus), a maximum of 216 741 (class Corylus), and a total of 893 361 events.
Table 1Summary of the instruments used for generating training datasets for eight classes of interest (seven pollen taxa and the water droplets). The Holography and fluorescence dataset displays the least diversity in instrumentation.
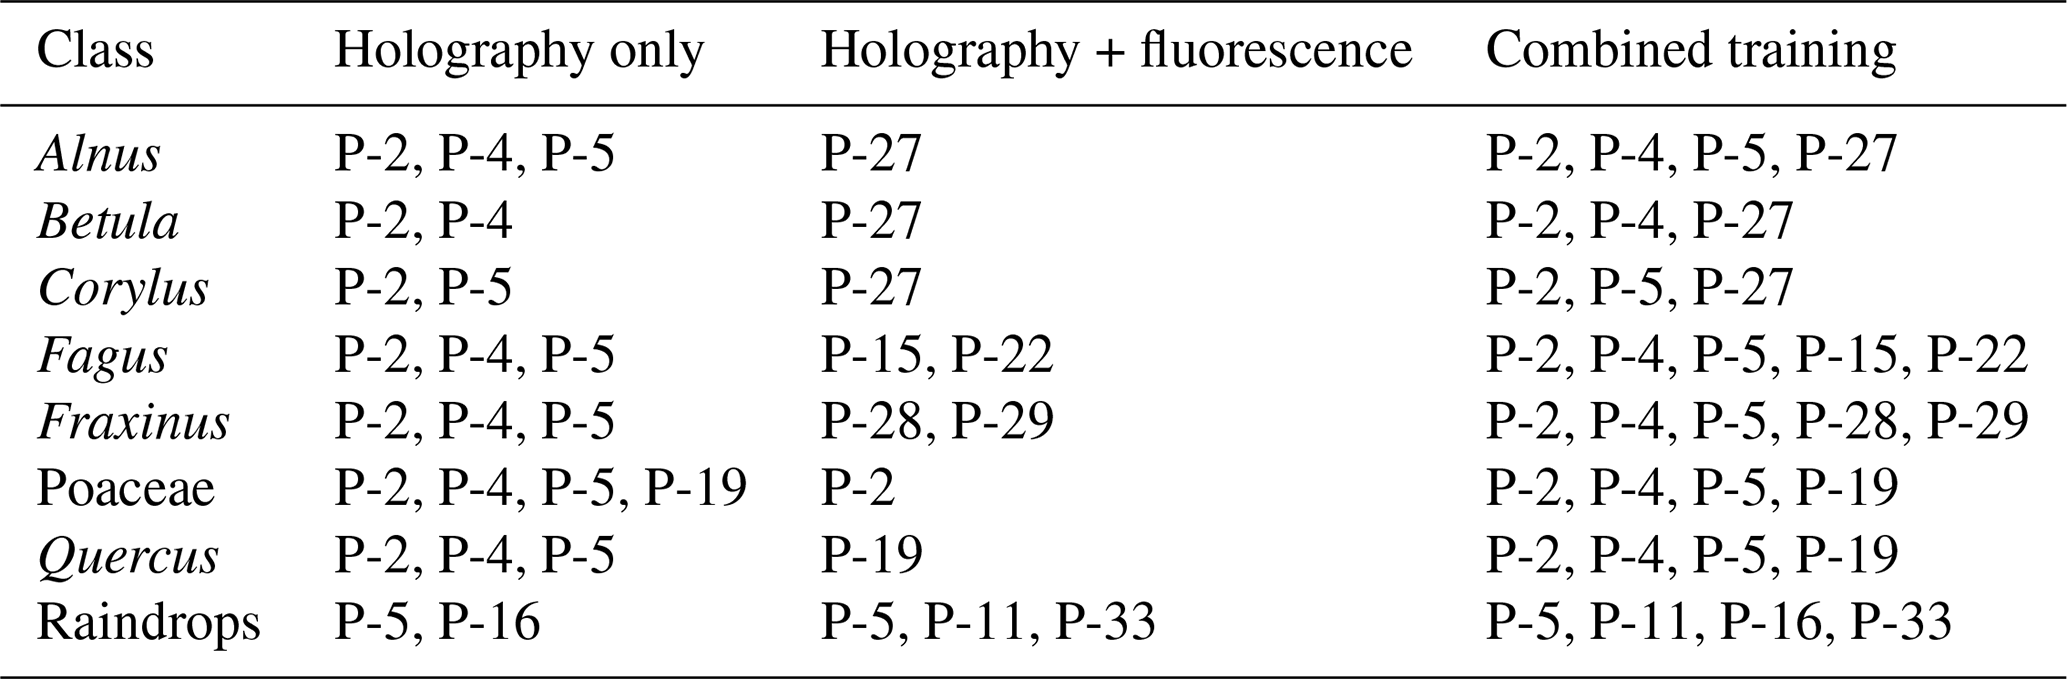
More instruments were used for producing the Combined training dataset compared to the Holography & Fluorescence dataset (Table 1). This integrates more instrument variability, especially for eight classes of interest (Alnus, Betula, Corylus, Fagus, Fraxinus, Poaceae, Quercus and Raindrops), which cover the most allergenic taxa in Switzerland, and Raindrops, which are often misclassified as Poaceae pollen. Due to the differences in the amounts of events in each class, they were weighted accordingly.
2.3 Classifier architecture and parameters
The 2022-operational algorithm is based on the VGG16 architecture (Simonyan and Zisserman, 2014), applied separately to the two orthogonal holographic images of each particle, i.e. two single matrices of grey levels. Each image is processed through convolutional layers to extract features, which are then combined in fully-connected layers. The final classification is obtained via a Softmax layer that outputs a probability distribution, from which the most likely pollen class is selected. The architecture of the 2022-operational algorithm is described in more detail in literature (Sauvageat et al., 2020). During the training process, the dataset was split into two subsets: 80 % were used to train the classifiers, while the remaining 20 % were reserved for validation on unseen data.
The 2025-Beta-1, 2025-Gamma-1, 2025-Omega-1, 2025-Beta-2, 2025-Gamma-2, 2025-Omega-2 and 2025-Gamma-3 algorithms follow a triple-branch convolutional neural network architecture designed to process two holographic images and one fluorescence input. The classifier works on events that have both kinds of data, or holography only by setting up the fluorescence input to zero. The two holography input branches independently process an holographic image as a single matrix of grey levels through a sequence of convolutional layers, followed by ReLU activation, and max pooling, ending in a size of 1024 for each branch. The fluorescence branch contains a fully-connected dense layer followed by a drop out. The extracted feature maps from both branches are flattened and concatenated before entering a fully-connected classification head composed of dense layers with ReLU activations and dropout for regularization. A final Softmax layer produces the class pseudo-probabilities for particle identification.
While the global structure remains consistent, each classifier presents various architectural differences. All classifiers share the same convolutional blocks (two convolutional layers followed by max pooling, and three convolutional layers followed by max pooling, respectively repeated two and three times) and a flatten layer. The Beta classifiers then have three fully connected dense layers, while the Omega classifiers have two, and the Gamma classifiers only one. The output from the fluorescence branch has a size of 26, apart from the 2025-Gamma-3 classifier which has a size of 13. Further details about the classifiers and a ready-to-use ONNX (Bai et al., 2019) version can be found in the following Github repository (MeteoSwiss, 2025) and corresponding Zenodo archive (Crouzy et al., 2026) . Additionally a companion short note describing the new operational SwissPollen classifier has been published (Crouzy et al., 2025).
2.4 SwissPollen operational evaluation datasets
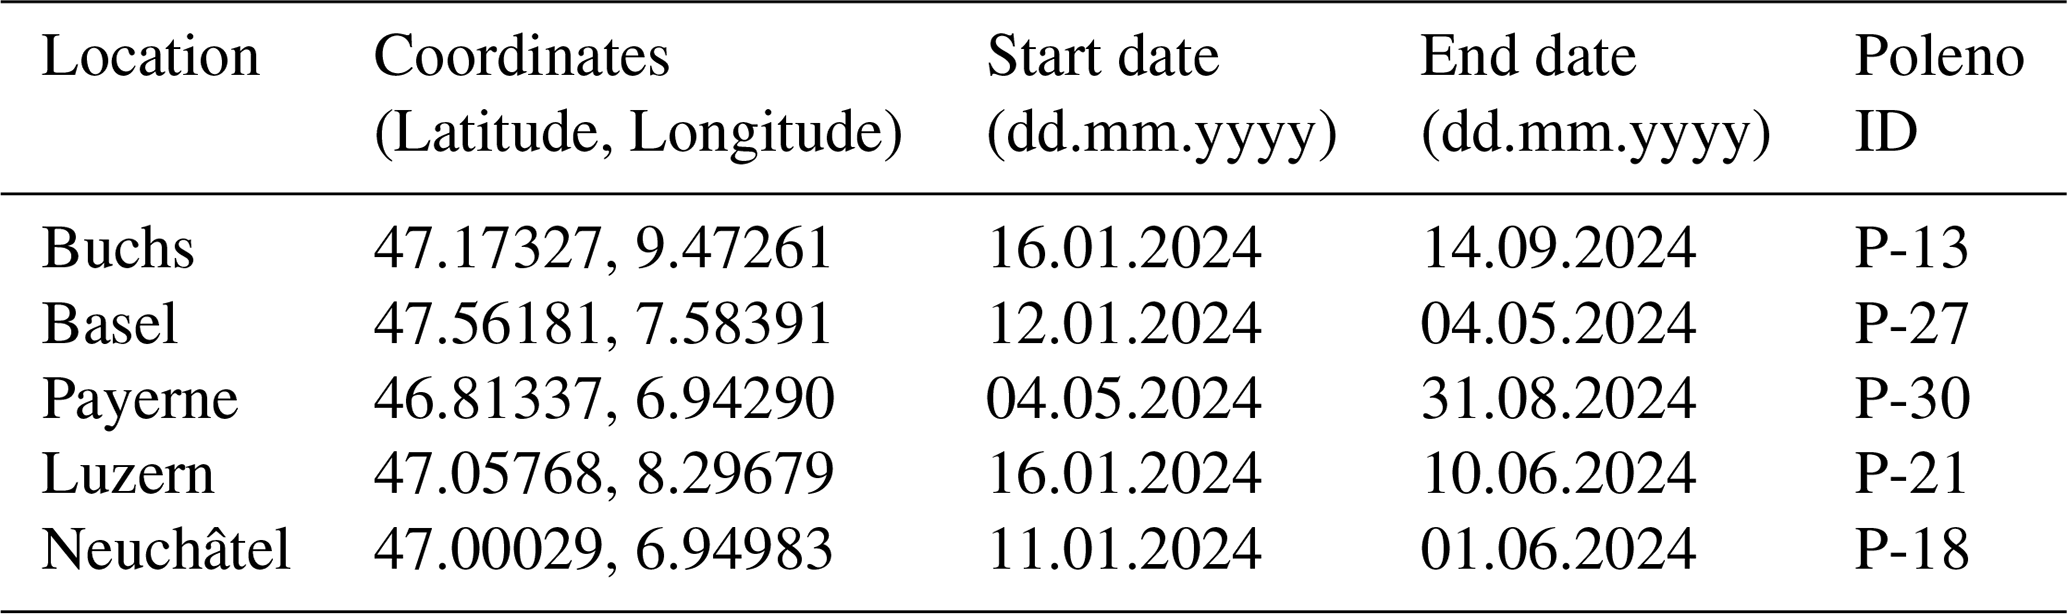
The algorithms are evaluated using operational data from the 2024 pollen season at five stations (Table 2) where manual Hirst-type instruments were run in parallel. These stations are located on the Swiss plateau at low altitude (Peel et al., 2007), where the climate is between oceanic and continental, and where a majority of the Swiss population lives (Federal Statistical Office, 2017). The start and end dates were selected to maximise overlaps between the manual and operational automatic measurements (avoiding manual instrument downtime). Note that prior to 2024, the software used to pre-process the fluorescence data was not the same, therefore the results from Erb et al. (2024) were not implemented operationally and data from earlier years cannot be used.
Table 2Location as well as start and end dates of the operational time series used to evaluate the eight classification algorithms. The pollen concentrations at each site were compared with manual measurements from the Hirst-type trap over the same period at the same location.
The predictions from the eight classifiers are aggregated into daily concentration averages. This allows easy comparison with the manual observations that cannot provide reliable data at a subdaily resolution due to limited sampling and spreading of particles on the sampling tape. Note that when the SwisensPoleno becomes saturated due to an excessive number of particles, it estimates how many particles were missed and provides a correction factor. This factor, referred to as the multiplier, is used to adjust the event count accordingly. The multiplier is an automatic mechanism on the Swisens Poleno that activates when particle concentrations become too high, to prevent the saturation of the system. To avoid artefacts and mis-detections, the instrument deliberately records only a fraction of the incoming particles (e.g., one out of n). The resulting under-sampling is corrected by multiplying the detected particles by the corresponding multiplier value. This approach allows the system to keep measuring in saturated conditions, with the trade-off of inducing a decreased sampling, which is critical for less abundant airborne taxa. The multiplier was applied to all event types to obtain accurate event counts, except for water droplets, for which the absolute concentration is unknown as there is no reference.
The pollen concentrations used as a comparison for these five stations were manually obtained from Hirst-type samplers (Burkard Manufacturing Co Ltd 7 d recording volumetric spore trap) and subsequent analysis under the 400 × magnification microscope, as routinely performed in the MeteoSwiss pollen monitoring network by professional pollen analysts participating in International assessments (Sikoparija et al., 2016). The air flow (10 L min−1) was regularly checked every week using the flowmeter provided by Burkard Manufacturing Co Ltd, which is however known to underestimate the real flow (Oteros et al., 2016). These concentration data are available on the Github repository (MeteoSwiss, 2025) and corresponding Zenodo archive (Crouzy et al., 2026). They do not provide a perfect measurement of pollen concentrations, as (1) only a small fraction (5.1 % of the sample surface) of the sample is counted, which is lower than the fraction recommended by the CEN (European Committee for Standardization, 2019), (2) the air flow of the device can vary and is not monitored continuously (Triviño et al., 2023), (3) the method can be subjected to human error (Sikoparija et al., 2016), and (4) the measurement uncertainty is high (Adamov et al., 2021). However, the method is reliable to identify what pollens are in the air and therefore identify pollen seasons. For these reasons, we diversified the validation datasets by selecting operational data from five different stations, and aim, in the future, at not relying on these manually obtained concentration data to evaluate our algorithms.
2.5 Algorithm evaluation
The performance of the classification algorithms was evaluated using the following three metrics on the operational data from five SwissPollen stations:
-
Kendall's Tau correlations (Kendall, 1938) were used to capture the correlation between the reference (here, manual) and automatic measurements. Kendall's Tau was preferred to Pearson and Spearman correlation because it provides a more robust measure of association for skewed and zero-inflated time series with frequent outliers, which are typical of pollen concentration data (Croux and Dehon, 2010). The better the classifier, the higher the Kendall's Tau value. Note that for the season considered, the Kendall correlation is markedly lower than the Pearson correlation. To provide a reference for what level of correlation can be expected between manual devices, we analysed time series from three co-located Hirst-type pollen traps operating in Payerne between 26 March and 26 July 2013 (Adamov et al., 2021). For each taxon, we computed the average of the three pairwise Kendall's Tau coefficients, which are much lower than Pearson correlations, as an estimate of attainable correlation: Alnus (0.48), Betula (0.63), Corylus (0.50), Fagus (0.66), Fraxinus (0.75), Poaceae (0.64), and Quercus (0.66).
-
The off-season noise ratio was designed to measure the out-of-season false positives, considered as noise. It is calculated as the ratio between the mean predicted pollen concentration outside the pollen season divided by the average during the season. Note that these values are sensitive to the size of the off-season, and is therefore dependant from the period and station, but comparable between two classifiers evaluated on the same period and station. The lower the ratio, the fewer false positives were detected outside of the season. To provide a reference, we computed this ratio using three manual time series for Betula taken from Adamov et al. (2021). Betula is a genus with a well-defined seasonal pattern. The average ratio was 0.009. Additionally, we estimated a worst-case scenario by artificially increasing all off-season values to 35 grains m−3 (Brito, 2010), yielding an average ratio of 0.165. Based on these results, ratios exceeding 0.165 may reflect chronically high off-season over-prediction or intermittent high over prediction and reduced classifier accuracy, while ratios close to 0.01 can be considered indicative of high-quality predictions, as they reflect only rare occurrences of significant off-season false positives. It should be noted that this metric is sensitive to the definition and duration of the pollen season, which varies across taxa and geographical locations, as well as to the size of the off-season included in the calculation. It is therefore comparable within class across models, but not across classes. Class-specific seasons for each pollen taxa were automatically identified from the manual measurements. A sliding window of seven consecutive days was applied and days were considered as belonging to the season when at least four of the seven days had average pollen concentration greater than 20 particles per cubic meter. For some stations and taxa, the automatic detection of the start and end of the season could not be automatically detected (manual data lacking at the beginning of the season, low season, or a season season occurring in multiple phases with an early rise, a temporary decline, and a later peak). For these reasons, some seasons were manually defined (Poaceae, Corylus, Quercus and Fagus for some of the stations) and the first, respectively last day with non-null, respectively null concentration counts was selected as beginning, respectively end of the season. However, start and end of seasons can be defined differently, as soon as kept the same to compare classifiers (Bastl et al., 2018). This makes this metric independent from manual concentrations, as not necessarily relying on them.
-
The scaling factor is the factor by which predicted pollen concentrations need to be multiplied to obtain values in the same range as the manual time series. Scaling factors under 24 were considered reasonable for SwissensPoleno, to avoid overestimating concentrations in the absence of reliable physical detections. This value ensures that a single detection over one hour, corresponding to 2.4 m3 of air sampled by the instrument (operating at 40 L min−1), does not exceed the commonly accepted Hirst detection threshold of 10 grains m−3 (Triviño et al., 2023). One particle detected in this volume corresponds to approximately 0.42 grains m−3, and applying a scaling factor of 24 yields a final concentration of 10 grains m−3. This constraint helps prevent artificially inflated values in low-concentration conditions, where manual measurements are known to be less reliable. The scaling factor is computed by minimizing the mean square error between the manual and automatic data over the interval [0.001, 1000] (Virtanen et al., 2020). The scaling factor is calculated for each class, confidence threshold and station individually, and averaged over all stations so it can be applied in an operational setup.
The three metrics are also used to identify the optimal confidence threshold serving as a filter to remove events with low confidence. To compare these curves, the area under each metric curve was computed using the trapezoidal rule (Burden and Faires, 2011) in R, applying the formula:
where xi are the threshold values and yi the corresponding metric values. We therefore compute the ΔAUC = AUCmax − AUCmin, corresponding to the area of the range of each metric across all stations and thresholds, that we compare across classifiers to evaluate the evolution of the range of each metrics.
Note that the confidence threshold and scaling factors are selected individually for each taxa, but are applied uniformly to all SwisensPolenos.
Beyond the choice of individual metrics, the novelty of the framework lies in the joint analysis and visualisation of these metrics across confidence thresholds and stations, enabling a transparent assessment of operationally relevant model behaviour.
We illustrate our evaluation framework through training seven classification algorithms on holography and fluorescence data and comparing them with the 2022 classifier, trained on holography data only, with the aim to improve the model used in the SwissPollen network. This comparison allows identifying the strengths and limits of each algorithm when assessed on operational data distinct from the training sets. We expect the new operational algorithm to show improvements compared to the previous operational classifier, particularly in the identification of water droplets as well as for the Betulaceae family – Alnus sp., Betula sp. and Corylus sp. Note that a 2025-Alpha-1 classifier using EfficientNet B0 pre-trained on ImageNet was trained (Tan and Le, 2020; Erb et al., 2024), but did not provide classifications that were good enough to be discussed in this paper. We decided to not use pretrained classifiers so that the classifier can be tailored to bioaerosol holographic (grayscale) images and fluorescence, but also to keep our models relatively small and light, therefore fast to train, apply and adapt.
3.1 Selection of the classifier
The three metrics (Kendall's Tau, Off-season noise ratio and Scaling factor) used to compare the classifiers on operational data, are calculated for several confidence thresholds (i.e., the output of the Softmax function of the classifier). The lower the confidence threshold, the more particles are used to calculate a metric, thus including particles that are classified with lower confidence. These metrics are used to (1) compare each model which uses fluorescence data with the 2022 operational model that does not, and (2) compare models that use fluorescence data, to identify the model that performs best on operational data.
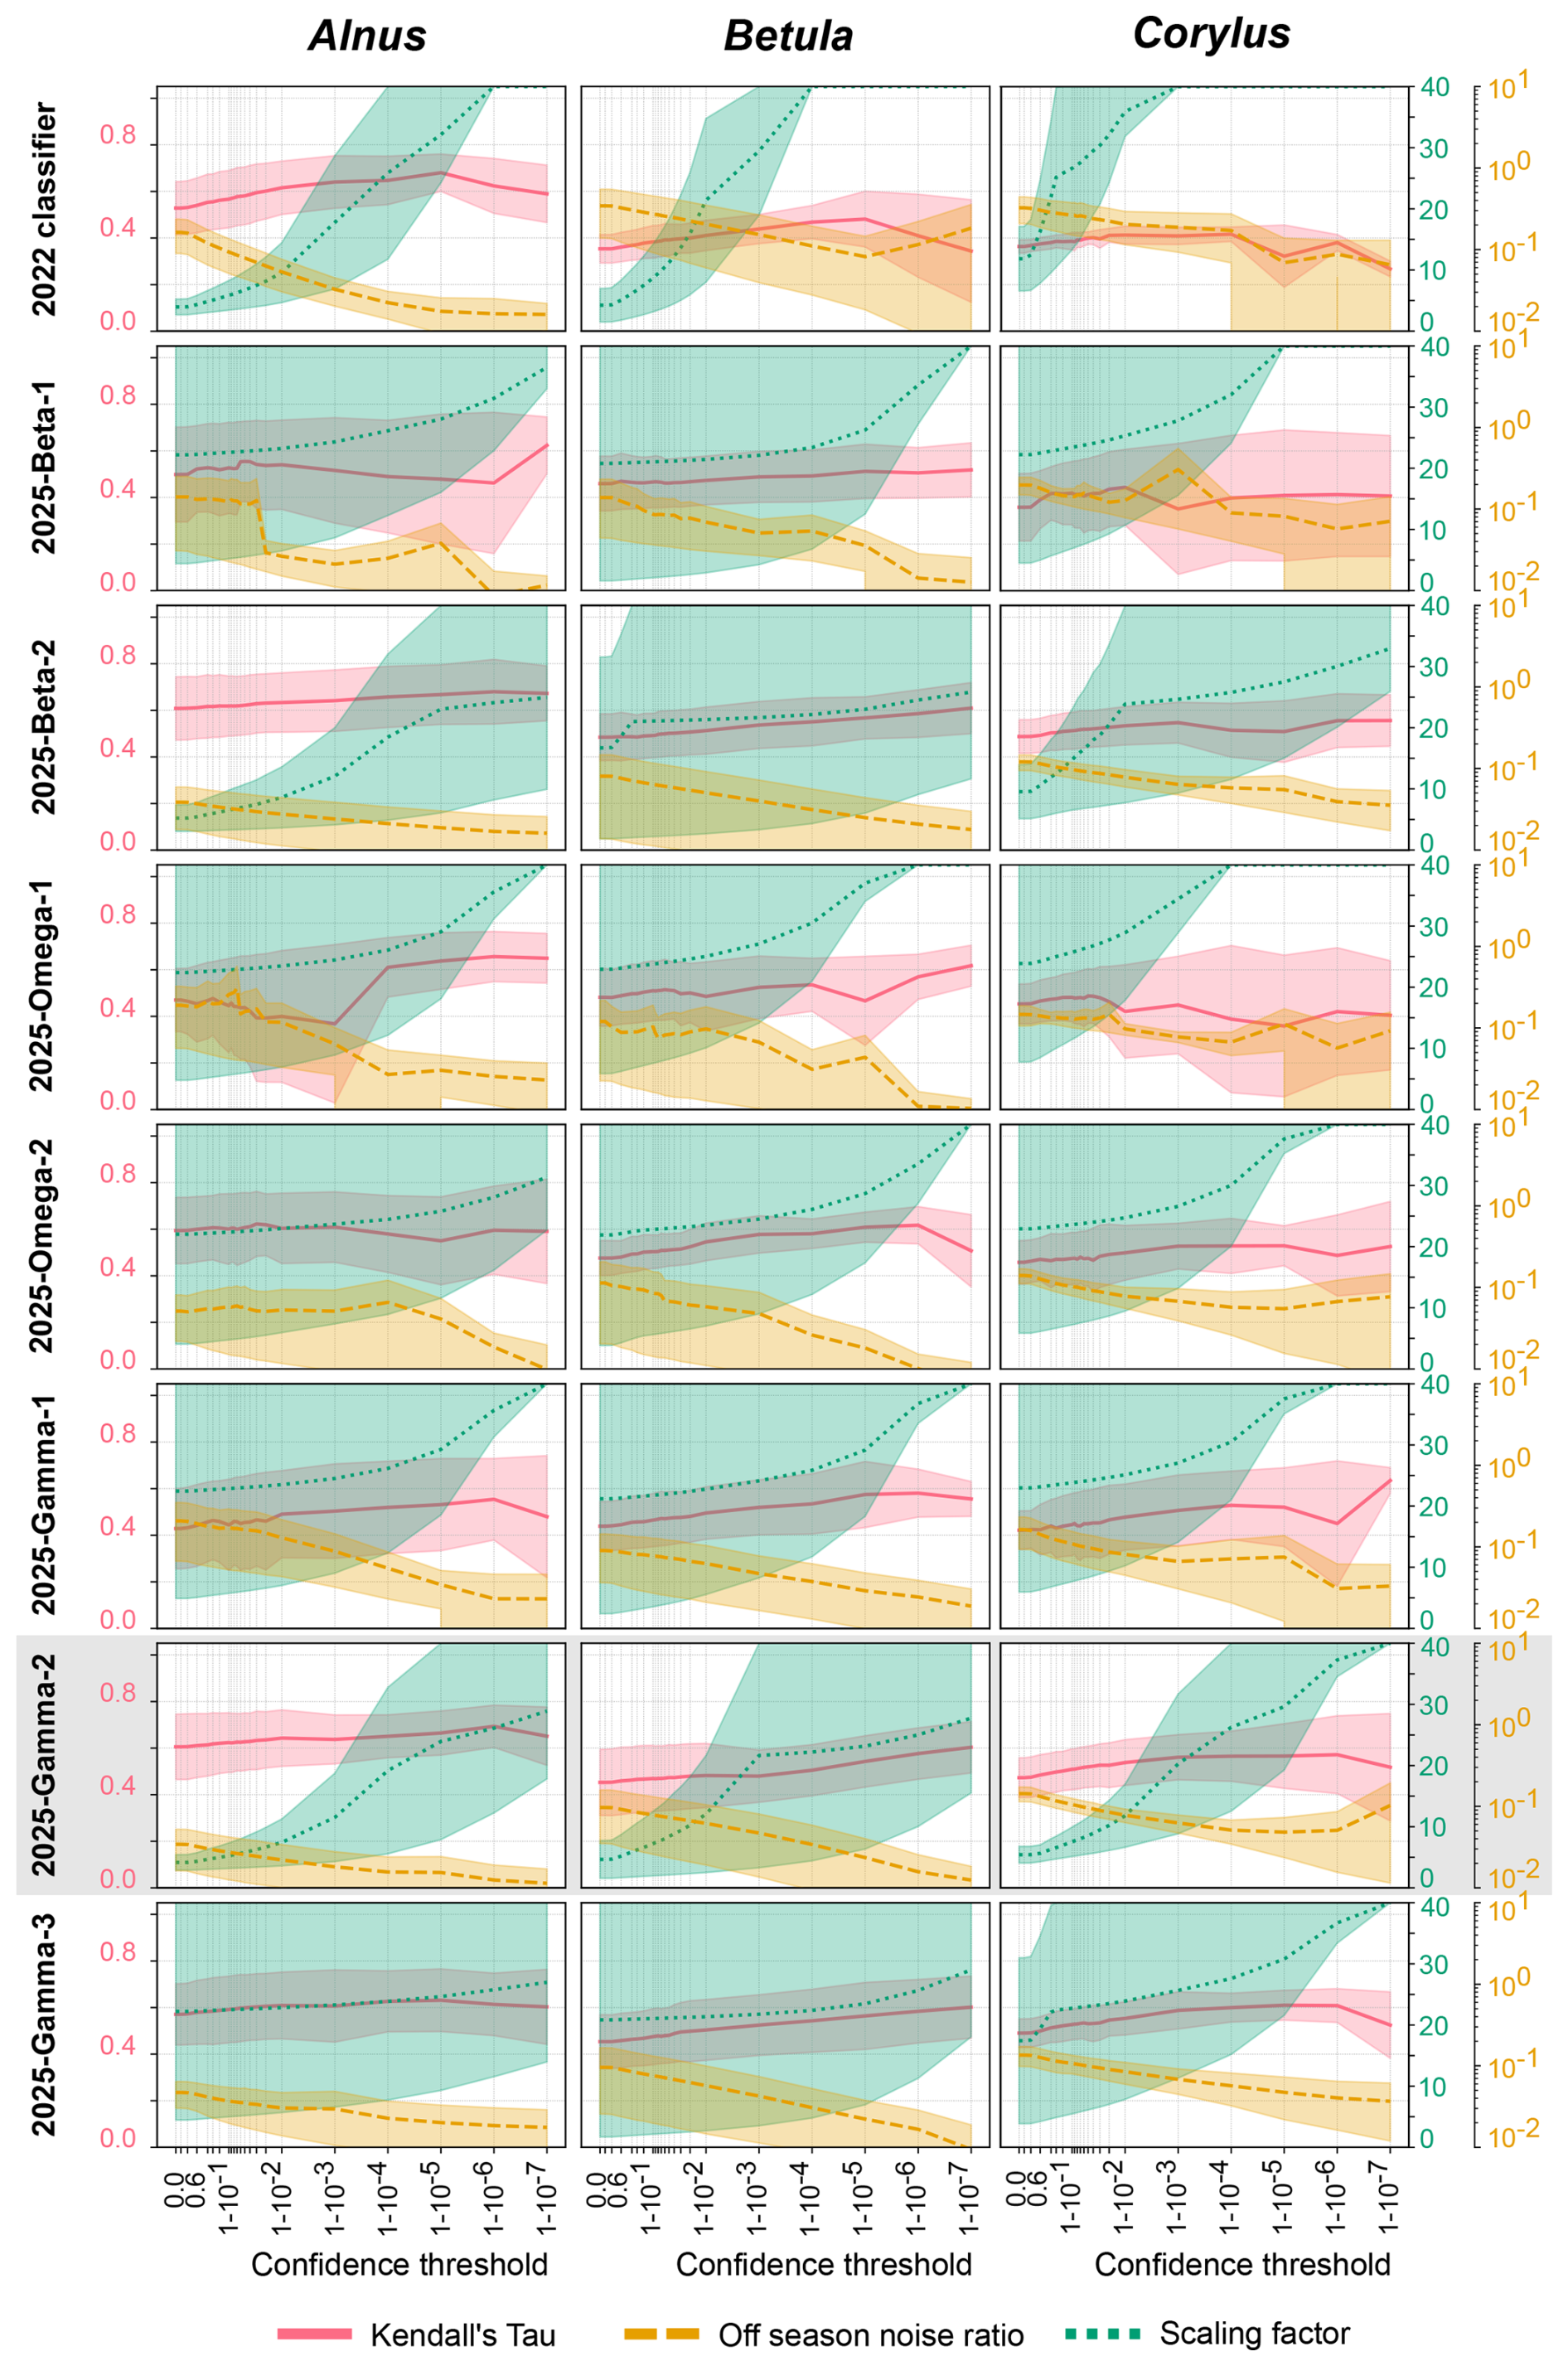
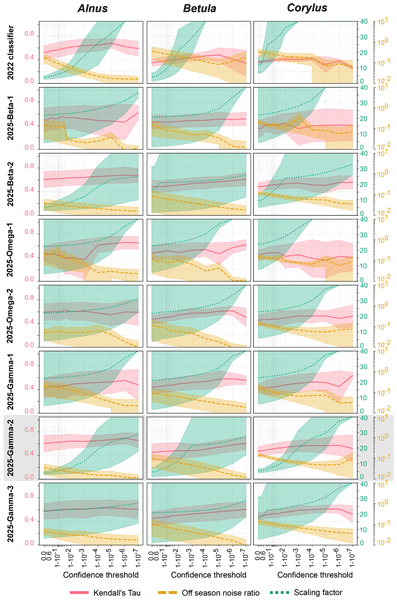
Figure 1Kendall's Tau correlation, scaling factor and off-season noise ratio as a function of the confidence threshold for Alnus, Betula and Corylus (columns) and for each classifier (rows). The yellow, green and red areas represent the spread of values across the five sites while the thick lines show the averages. Note that the axis of the scaling factor stops at 40, while values range up to 1000. The grey frame highlights the best classifier. The 2025-Gamma-2 panel is presented in a companion short note (Crouzy et al., 2025).
The comparison of the three metrics for Alnus, Betula and Corylus is shown in Fig. 1. Results for the four other classes of interest can be found in Fig. A1. Overall, there is an improvement for all three metrics at all five sites compared to the 2022 classifier (Fig. 1). The off-season noise ratio typically tends to reduce with increasing confidence thresholds, highlighting that by excluding the low confidence classifications fewer off-season false positives are observed. The Kendall's Tau values are also higher, indicating the correlation between the automatic and manual time series improved. Finally, the averaged scaling factor values are lower than for the 2022 classifier. However, for all classification algorithms, the scaling factors increase as the confidence threshold increases. This is because an increase in confidence threshold results in the exclusion of more unsure classifications, logically reducing the number of particles in the class and therefore the difference between the predictions and manual counts widens, thus increasing the scaling factor. Additionally, part of the observed variability in scaling factors reflects intrinsic uncertainties of Hirst-type reference measurements, including flow variability and consequent sampling efficiency, which cannot be fully eliminated even under EN 16868-compliant operation (Oteros et al., 2016). We therefore aim to reduce the spread of scaling factors as much as possible, rather than to achieve perfect agreement with manual measurements. Additionally, the three metrics also depend on the quality of the evaluation datasets, and one should therefore be careful when comparing metrics across classes of same or different models. The scaling factor in particular is used in operational setup, and the representativeness of the seasons it is calculated from should be assured to achieve a good robustness. For example, the metrics for the class Poaceae in our evaluation datasets is likely to be less robust than most of the other classes, as only two stations encompass Poaceae season (Table 2) compared to four for others. Similarly, very few Carpinus pollen counts were detected in the five stations, limiting the robustness of this class. In particular, scaling factors can be inflated if only low-count in-season periods are available. Finally, when evaluation windows are incomplete, as is the case for Poaceae in Luzern, Kendall's Tau can be underestimated if key peaks are missing, or occasionally overestimated if only a small, well-matched subperiod is sampled.
Interestingly, the range of each metric is larger for this first version of 2025 classifiers than for the 2022 classifier. The area difference (ΔAUC) between the maximum and minimum curves, which represents the spread in values for the five sites, is marked for the scaling factor. It indicates that the scaling factors for the 2022 classifier for Alnus, Betula and Corylus (ΔAUC respectively 3.5, 8.0 and 26.4) display a smaller range than those of the 2025-Beta-1 (ΔAUC respectively 995.3, 584.6 and 400.8), the 2025-Gamma-1 (ΔAUC respectively 269.9, 105.8 and 98.0) and the 2025-Omega-1 (ΔAUC respectively 994.5, 716.7 and 371.9) classifiers. Additionally, the range of the scaling factor increases as the confidence threshold increases. This trend is not as obvious for the two other metrics (Tables S2 and S3). The greater spread in metrics values for the 2025 classifiers indicates larger differences between predictions across the five sites. This may be a result of (1) biological diversity in pollen morphology (Hasegawa et al., 2022) which is not fully represented in the training datasets; or (2) over-training of the 2025 classifiers for a small number of specific instruments, i.e., those that were used to produce the training datasets (Table 2). Consequently, when applied to data produced by other instruments, the algorithm does not perform as well. It is possible that each instrument has a specific signal in the holographic and/or fluorescence data, resulting in the 2025 classifiers focusing on instrument-induced artifacts instead of the particle morphology and composition.
To minimise over-training, the three 2025 classifiers were retrained with the same architecture but on training data from more instruments. The resulting combined training dataset not only includes more events (893 361 versus 563 063) but also contains datasets that have only holographic images (166 262 events or 18.61 % of the entire dataset). Figure 1 further displays the metrics for the three 2025 classifiers trained on these data. The positive impact of using training datasets from a larger number of instruments is highlighted by a reduction of the range of the scaling factor. This is especially clear when comparing the 2025-Gamma-1 and 2025-Gamma-2 classifiers for Alnus (ΔAUC reduced by a factor 84.3), Betula (ΔAUC reduced by a factor 13.6) and Corylus (ΔAUC reduced by a factor 28). While some discrepancies remain, especially at higher confidence thresholds, the scaling factors are coherent at lower confidence thresholds for the five sites. These results suggest training on a very large number of events from a number of different instruments without fluorescence and restricting the complexity of fluorescence processing layers limits artifacts related to fluorescence-related over-training. Despite the overall improvement brought by the second generation of 2025 classifiers, they still exhibit a wider spread in metric values compared to the 2022 classifier. This may suggest a degree of over-fitting to the fluorescence data, which can be mitigated by selecting the right confidence threshold: although the average performance has improved, the variability across instruments indicates a residual lack of generalisation, possibly due to differences in fluorescence data quality or standardisation between devices. Additionally, our analysis is based on the operational dataset available at the time of the study. Future work should consider using multi-season and multi-region datasets, including several devices and taxa for such model evaluation. This would strengthen the investigation of the metrics stability and help disentangle algorithmic effects from site- and season-dependent sampling effects.
In a final step, the 2025-Gamma-3 classifier was trained on a similar architecture to that of 2025-Gamma-2, but with modification of the output of the fluorescence branch, reducing it from 26 to 13 features. This was to condense important information from the fluorescence data into fewer features so as not to dilute the fluorescence signal and limit overtraining. The predictions of this classifier display wider ranges for the scaling factors compared to the 2025-Gamma-2 algorithm for Alnus, Betula and Corylus (ΔAUC 70.4 > 3.2, 106.5 > 7.8 and 34.2 > 3.5 respectively). A similar increase of the range in scaling factors is also observed for the other classes (see Appendix A1, Tables S2 and S3), except for Fraxinus (ΔAUC 1.5 < 1.8). The 2025-Gamma-3 algorithm is thus less consistent across stations, denoting an over-simplification of fluorescence processing layers. Furthermore, the Kendall's Tau correlations and off-season noise ratios show little improvement compared to those of the 2025-Gamma-2 classifier. Therefore, 2025-Gamma-2 will be selected as the next operational classifier for the SwissPollen network, with proper selection of confidence threshold to keep variations between monitoring sites under control.
Among the classifiers evaluated, the 2025-Gamma-2 classifier consistently outperformed all others, showing improvements across all three metrics compared to the 2022 baseline, and exhibiting a reduced spread in scaling factors relative to the other 2025 classifiers. Notably, the Gamma-2 architecture differs from the Beta-2 and Omega-2 variants in the size of the holography branches outputs prior to concatenation, which are 1024, 64, and 128 respectively. The fact that the best-performing classifier retains the largest holography feature space (while the fluorescence branch remains fixed at 26 features) highlights the continued importance of broad holographic information for accurate classification. This finding is consistent with previous studies highlighting the challenge of avoiding over-fitting on fluorescence data in pollen classifiers (Maya-Manzano et al., 2023). Our results show that fluorescence data contribute positively to overall classification performance, despite a tendency for over-fitting, provided that appropriate confidence thresholds are applied. Over-fitting is mitigated in part by expanding the training datasets with holography data collected from a broader range of instruments. We anticipate a similar improvement if such diversity is introduced for fluorescence training data as well.
3.2 Determination of optimal parameters for the SwissPollen operational network
In practice the optimal confidence thresholds need to be set as low as possible to maximise the number of events classified within a class. However, it needs to be high enough to exclude particles that are not represented by any of the model's classes, and that are forced into existing classes; such particles are likely to display low confidence thresholds. Finally, the optimal confidence threshold should be selected to optimise the three metrics across classes and the five evaluation sites. To do so, we used Fig. 2, which directly compares the metrics for the 2022 and 2025-Gamma-2 classifiers. All metric values are also listed in Table S2.
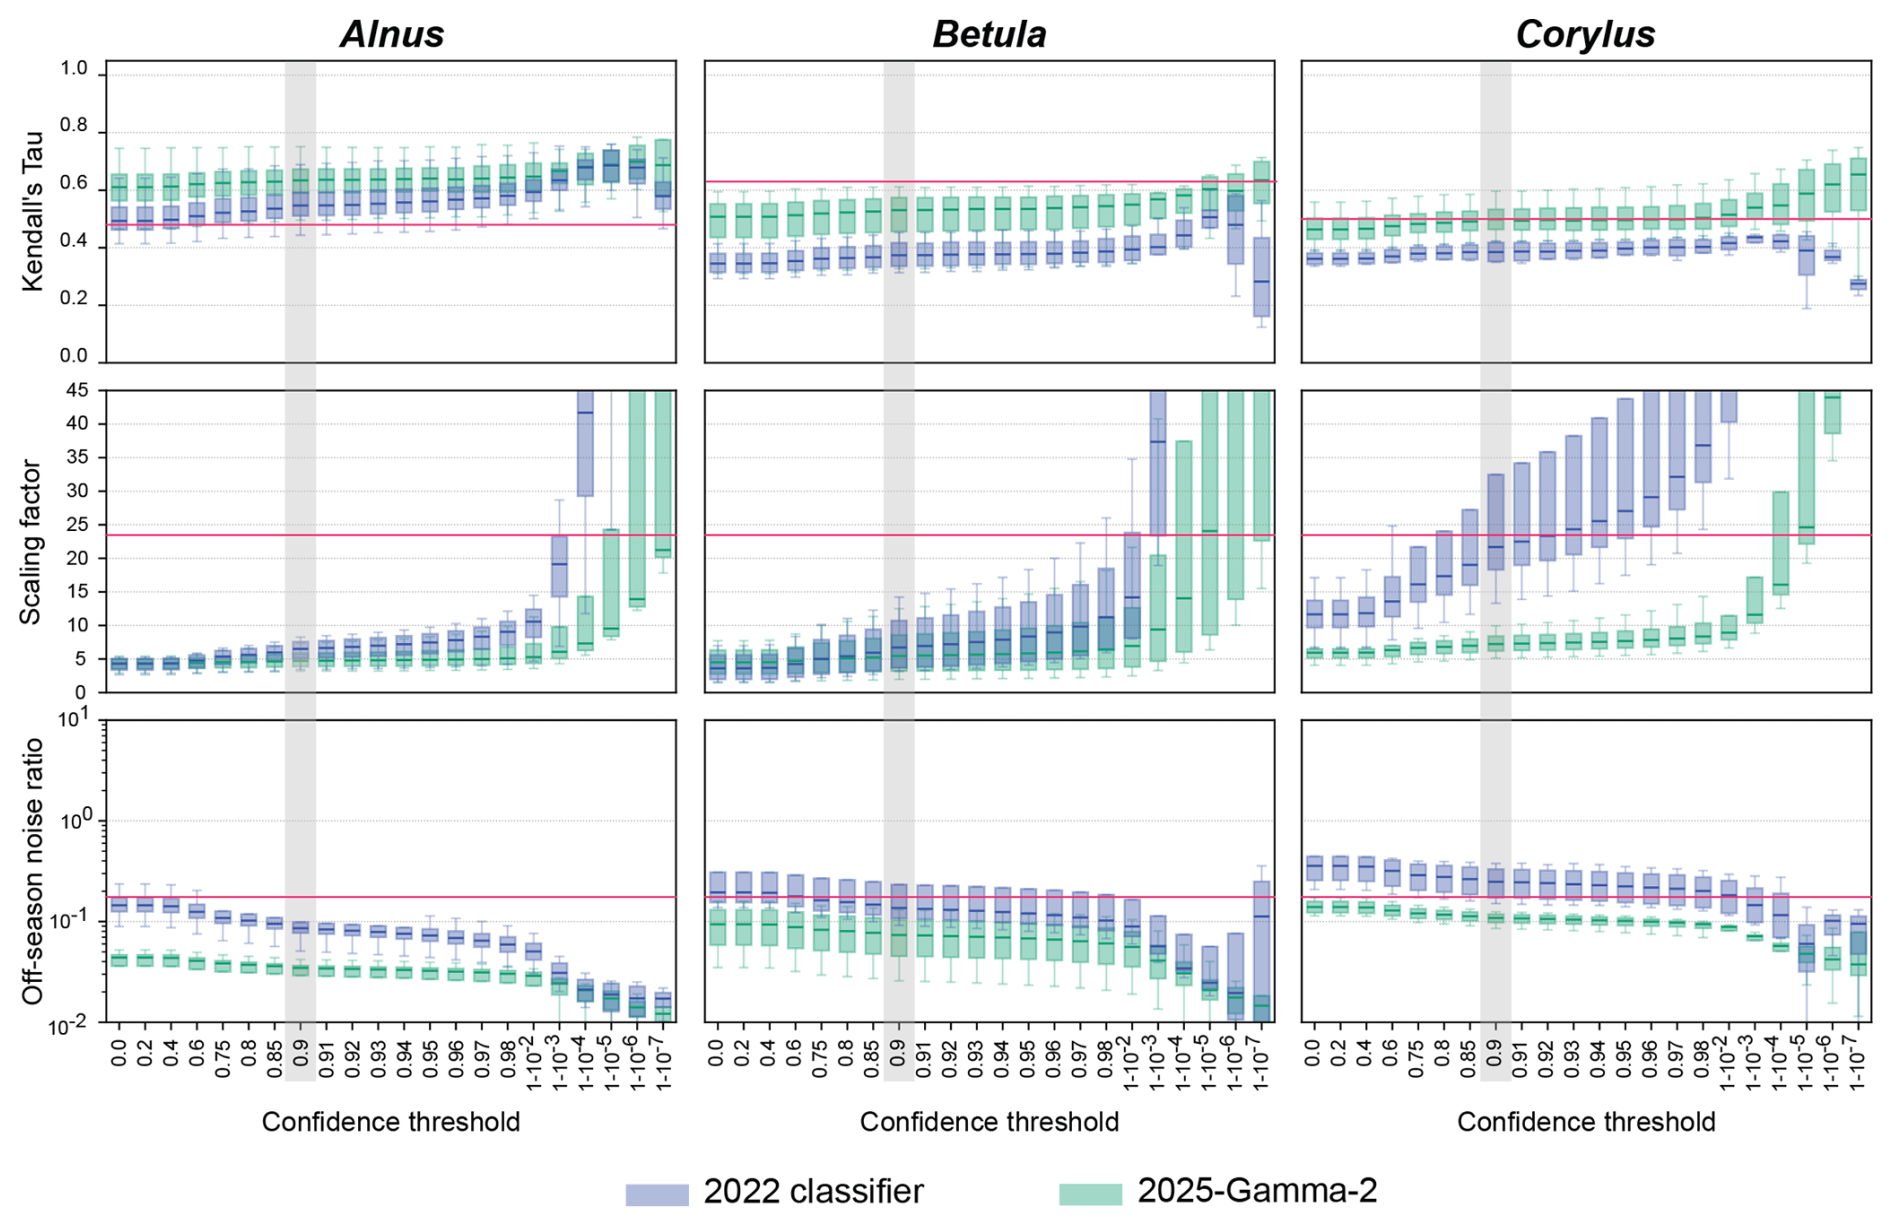
Figure 2Kendall Tau correlation, scaling factor and off-season noise ratios as a function of confidence threshold for the five stations and for the 2022 and 2025-gamma-2 classifiers. Columns show Alnus, Betula and Corylus, from left to right. Metrics are computed at each threshold, in green for the 2025-Gamma-2 classifier, in blue for the 2022 classifier. Scaling factors higher than 45 are not shown. The boxplots illustrate the values of each metric, at each confidence threshold, for all stations. Red lines indicate the acceptability threshold values for each individual metric and taxa.
Optimised parameters are selected so that:
-
The scaling factor remains low, under 24, so the detection limit of the device is taken into account.
-
The Kendall's Tau correlation between the predicted and manual pollen concentrations should be as high as possible.
-
The off-season noise ratio quantifies the mean predicted pollen concentration during the off-season relative to the in-season period. Lower values indicate better classifier specificity, as they reflect minimal pollen predictions outside the pollen season.
For Alnus, we chose a 0.9 confidence threshold. Around 0.9, the off-season noise ratio and the scaling factor reach a plateau, so raising the threshold further brings little improvement. Across the whole range of thresholds, Kendall's Tau also exceeds that of the 2022 classifier. At a confidence threshold of 0.9 for Betula, the curve of Kendall's Tau correlations begins to plateau, indicating a reduction in correlation improvement beyond this point. This threshold also effectively limits the range of scaling factors while maintaining a reasonable off-season noise ratio. The class Corylus displays a large improvement in terms of the range of scaling factors across stations with the 2025-Gamma-2 algorithm. For this class, the confidence threshold of 0.9 was selected mostly based on the off-season noise ratio, for which a plateau begins, while keeping both the scaling factor and Kendall's Tau at better levels than the 2022 classifier. Selecting a common confidence threshold for all Betulaceae also brings coherence and simplicity to our approach.
All in all, Alnus, Betula, and Corylus have optimised metrics at a confidence threshold of 0.9. It yields mean scaling factors of 5.00, 6.34, and 7.38, all well below the maximum threshold of 24 grains m−3 per detection. The corresponding Kendall's Tau values were 0.52 (above the 0.48 attainable correlation for Alnus), 0.43 (below the 0.63 for Betula), and 0.44 (below the 0.50 for Corylus). Off-season noise ratios were 0.031, 0.076, and 0.11, respectively, which are all within the acceptable range (0.01–0.165) defined by manual references and worst-case estimates (Fig. 2). Interestingly, for Alnus, the automatic predictions show a stronger correlation with the reference manual time series than the averaged correlation observed between co-located Hirst traps. This suggests that the classifier is able to consistently capture the seasonal pattern of this taxon, as far as can be evaluated from manual reference measurements.
The scaling factors for other classes range from 2.195 for Fraxinus up to 8.570 for Fagus. This relatively limited range indicates that the measurement system detects and classifies pollen grains relatively well, particularly given the known uncertainties of the manual observations. Values of optimal confidence thresholds and corresponding scaling factors for all classes can be found on the Github repository and Zenodo archive where we deposited the classifier (MeteoSwiss, 2025; Crouzy et al., 2026).
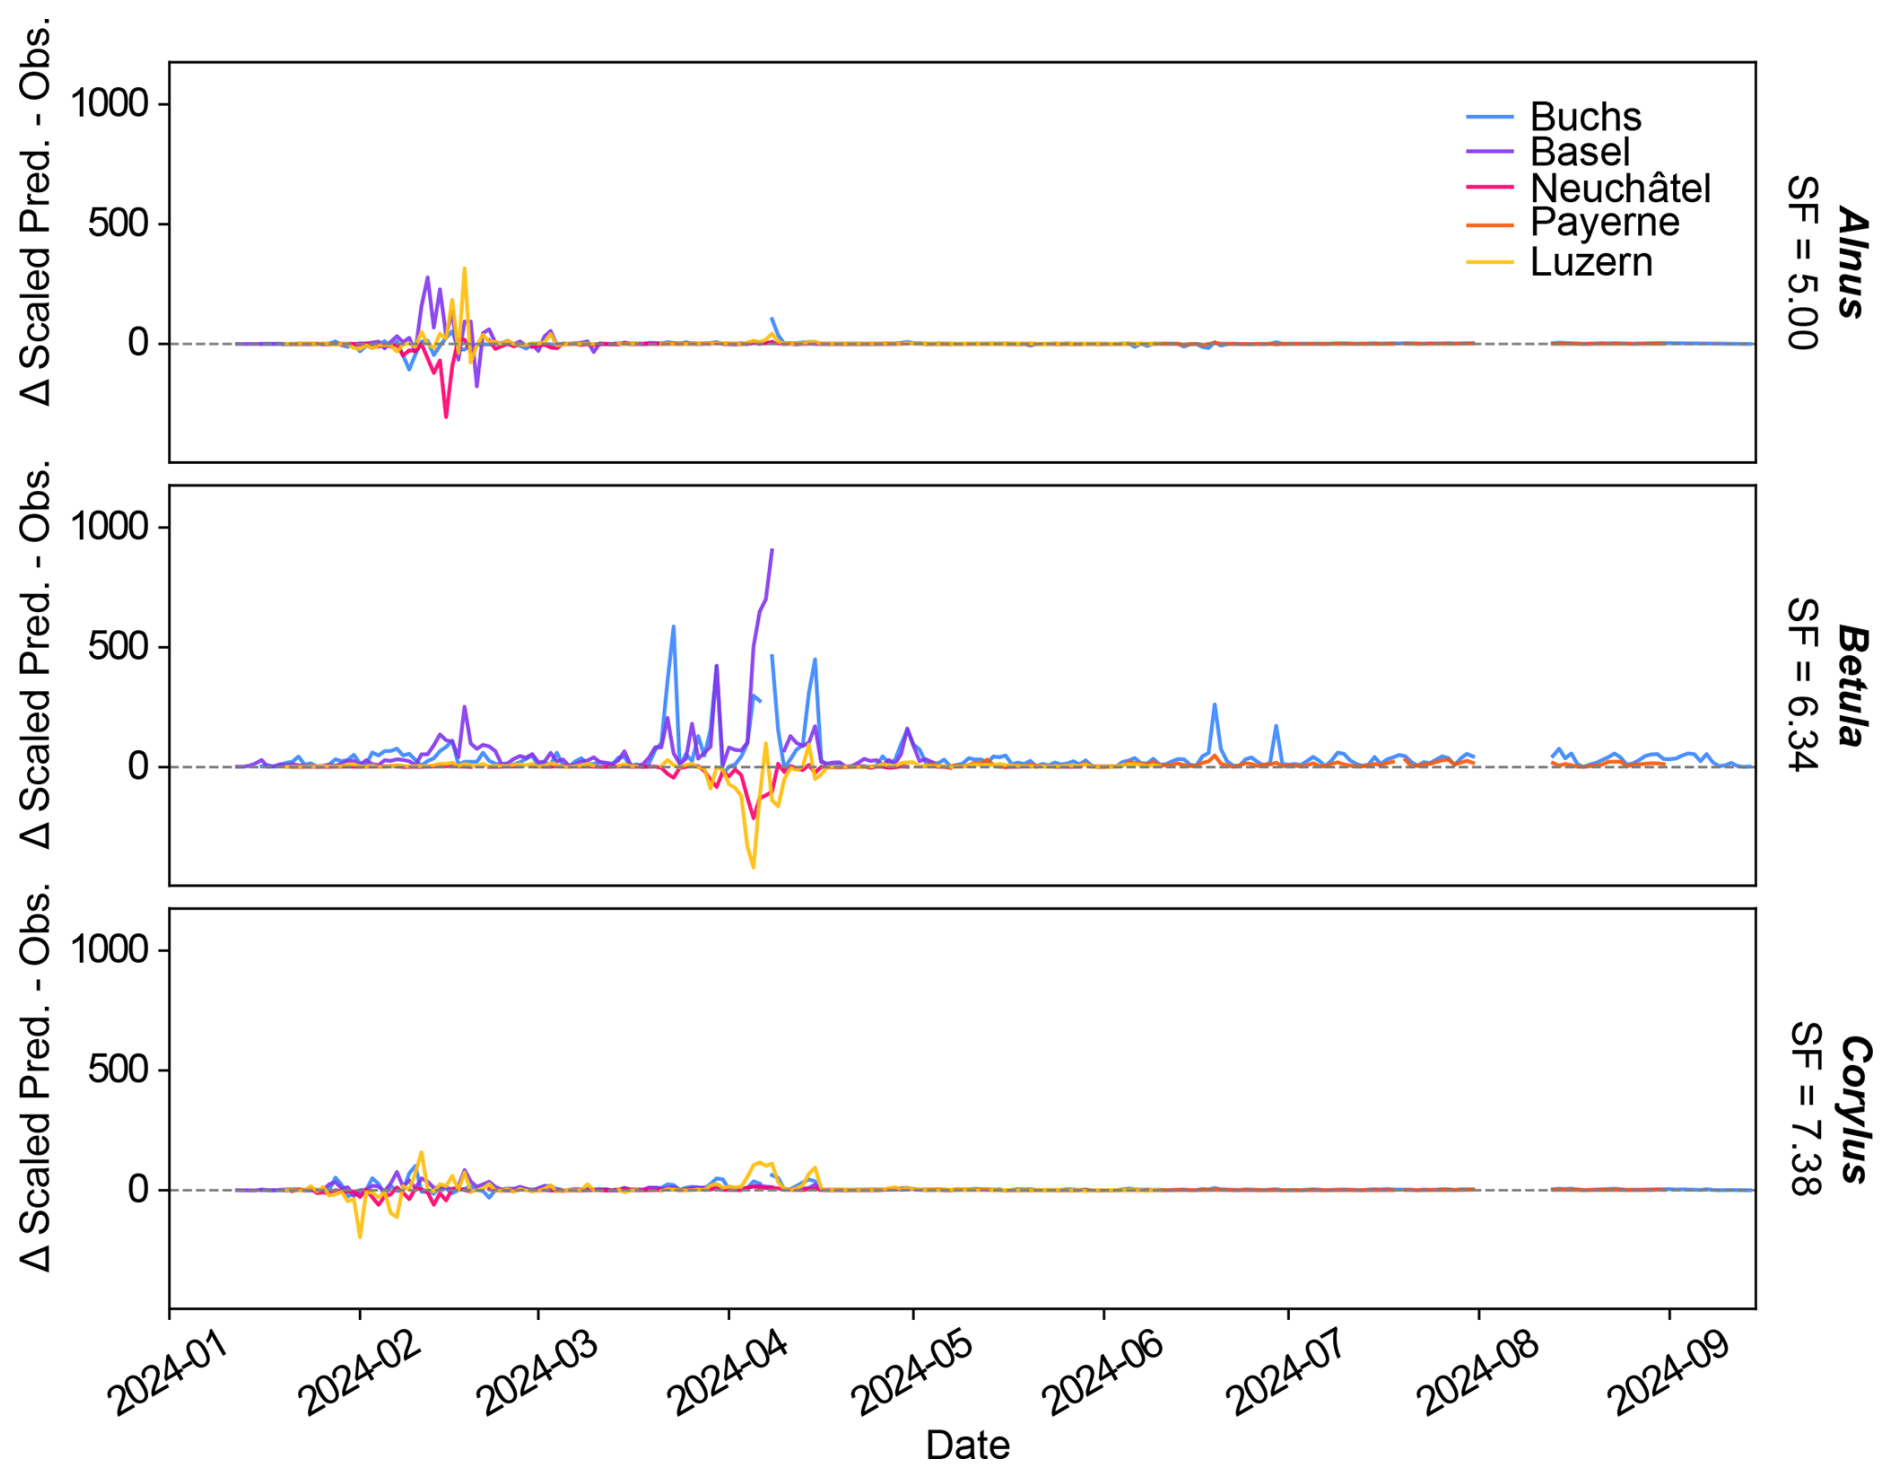
Figure 3Difference between scaled 2025-Gamma-2 predictions and the manual observations. A scaling factor (SF) is calculated for each station by minimisation of the Mean Square Error between the predictions and the manual observation timeseries. These SF are then averaged across stations to obtain a value for each class for the whole network. Each line displays the difference between the scaled daily pollen predictions from 2025-Gamma-2 and the corresponding manual observations for one of the five stations.
Figure 3 displays the difference between the scaled predictions and the manual measurements for the five evaluation sites. At Neuchâtel (Alnus, Betula and Corylus) and Luzern (Betula) the classifier predictions are too low, while for Basel and Buchs (both Betula and Corylus) they tend to be too high. Informing the Swiss public of pollen concentrations that are too high or too low is problematic, however, it is unfeasible to have individual sets of scaling factors (Table S2) for each instrument across a national network. More accurate scaling factors based on studies currently being carried out at the Swiss Federal Office for Metrology METAS may help resolve this issue, as for the moment it is impossible to tell which part of the variability comes from the automatic system or from the manual measurements (deviations from the flow up to 72 % were observed; Oteros et al., 2016). We however notice clear seasonal misclassification (false-positives), for example, pollen being classified as Corylus when Alnus or Betula seasons kick in. Operationally, these issues can be resolved using the supervisor approach (Crouzy et al., 2022).
3.3 Improvements in classification of Betulaceae family and identification of water droplets
The 2025-Gamma-2 classifier was designed to use both holography and fluorescence data, with the expectation that this would resolve some of the shortcomings identified in the 2022 classifier (Sauvageat et al., 2020). The 2025 algorithm improves the classification of the Betulaceae pollen grains, when comparing the Kendall's Tau correlations between the predicted and manual values (Fig. 4), as already illustrated in Figs. 1 and 2. We also observe a slight improvement of Kendall's Tau values between the prediction of one of the Betulaceae and the manual values for another class of the Betulaceae (e.g., comparing predicted values for Betula with the manual observations of Alnus) (Fig. 4, all values in Table S4). This suggests that the 2025-Gamma-2 classifier tends to produce fewer misclassification than the 2022 classifier. For example, the Kendall's Tau values, averaged across stations, between the 2025-Gamma-2 predictions for classes Alnus and Corylus and the manual timeseries for Betula dropped by −0.24 and −0.07, respectively. Therefore, fewer Alnus and Corylus pollen are classified as Betula. This is also the case when comparing the predictions of class Betula to the manual timeseries' of Alnus and Corylus (−0.11 and −0.12). When looking at the ranges of the Kendall's Tau across stations, we notice that this is not the case for all of them, suggesting again a possible overtraining of the classifier. Overall, the 2025 classifier tends to produce fewer misclassification for the Betulaceae family compared to the 2022 algorithm.
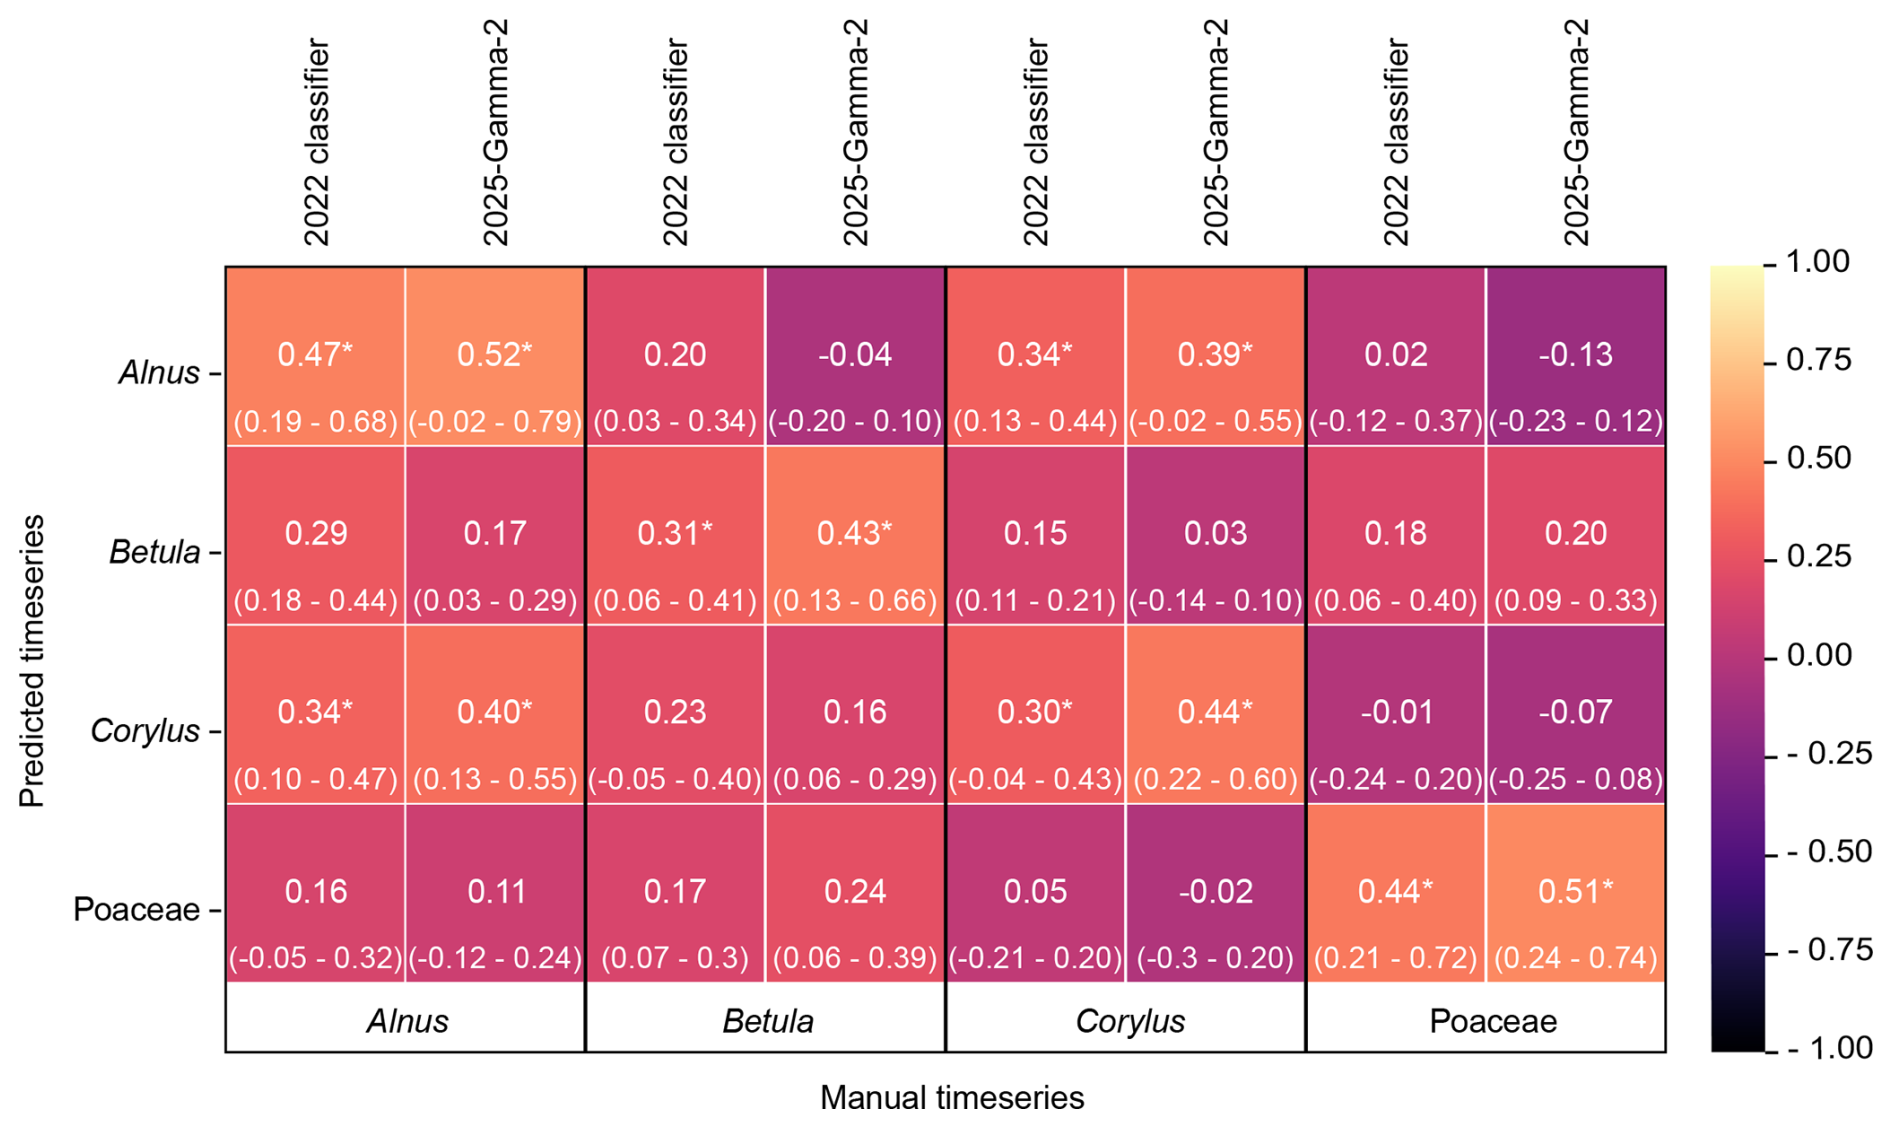
Figure 4Heatmap of the averaged Kendall Tau correlations between the predicted and manual timeseries for the 2022 and 2025-Gamma-2 classifiers. Numbers and corresponding colours indicate the Kendall's Tau values between the predicted timeseries of the class on the y axis, and the manual observation timeseries of the class on the x axis. The minimum and maximum Kendall's Tau across stations are reported in parenthesis. * indicates that the Kendall Tau value is higher than 0.5 when calculated between the manual timeseries of the two classes, indicating an expected correlation between two classes. All predicted timeseries have been produced with the optimal confidence threshold identified for the class and algorithm.
The 2022 classifier also tended to misclassify Poaceae pollen as Corylus (Sauvageat et al., 2020). The 2025 algorithm reduces this problem, with the averaged correlation between the predicted Poaceae and manual Corylus timeseries dropping from 0.05 to −0.02. Again, the Kendall's Tau ranges across stations indicate that the classifier improves on some stations but not on other, suggesting a possible overtraining. Conversely, the 2025 algorithm classifies more Poaceae as Betula than the 2022 classifier, increasing the correlation by 0.07, however, it remains low (0.24).
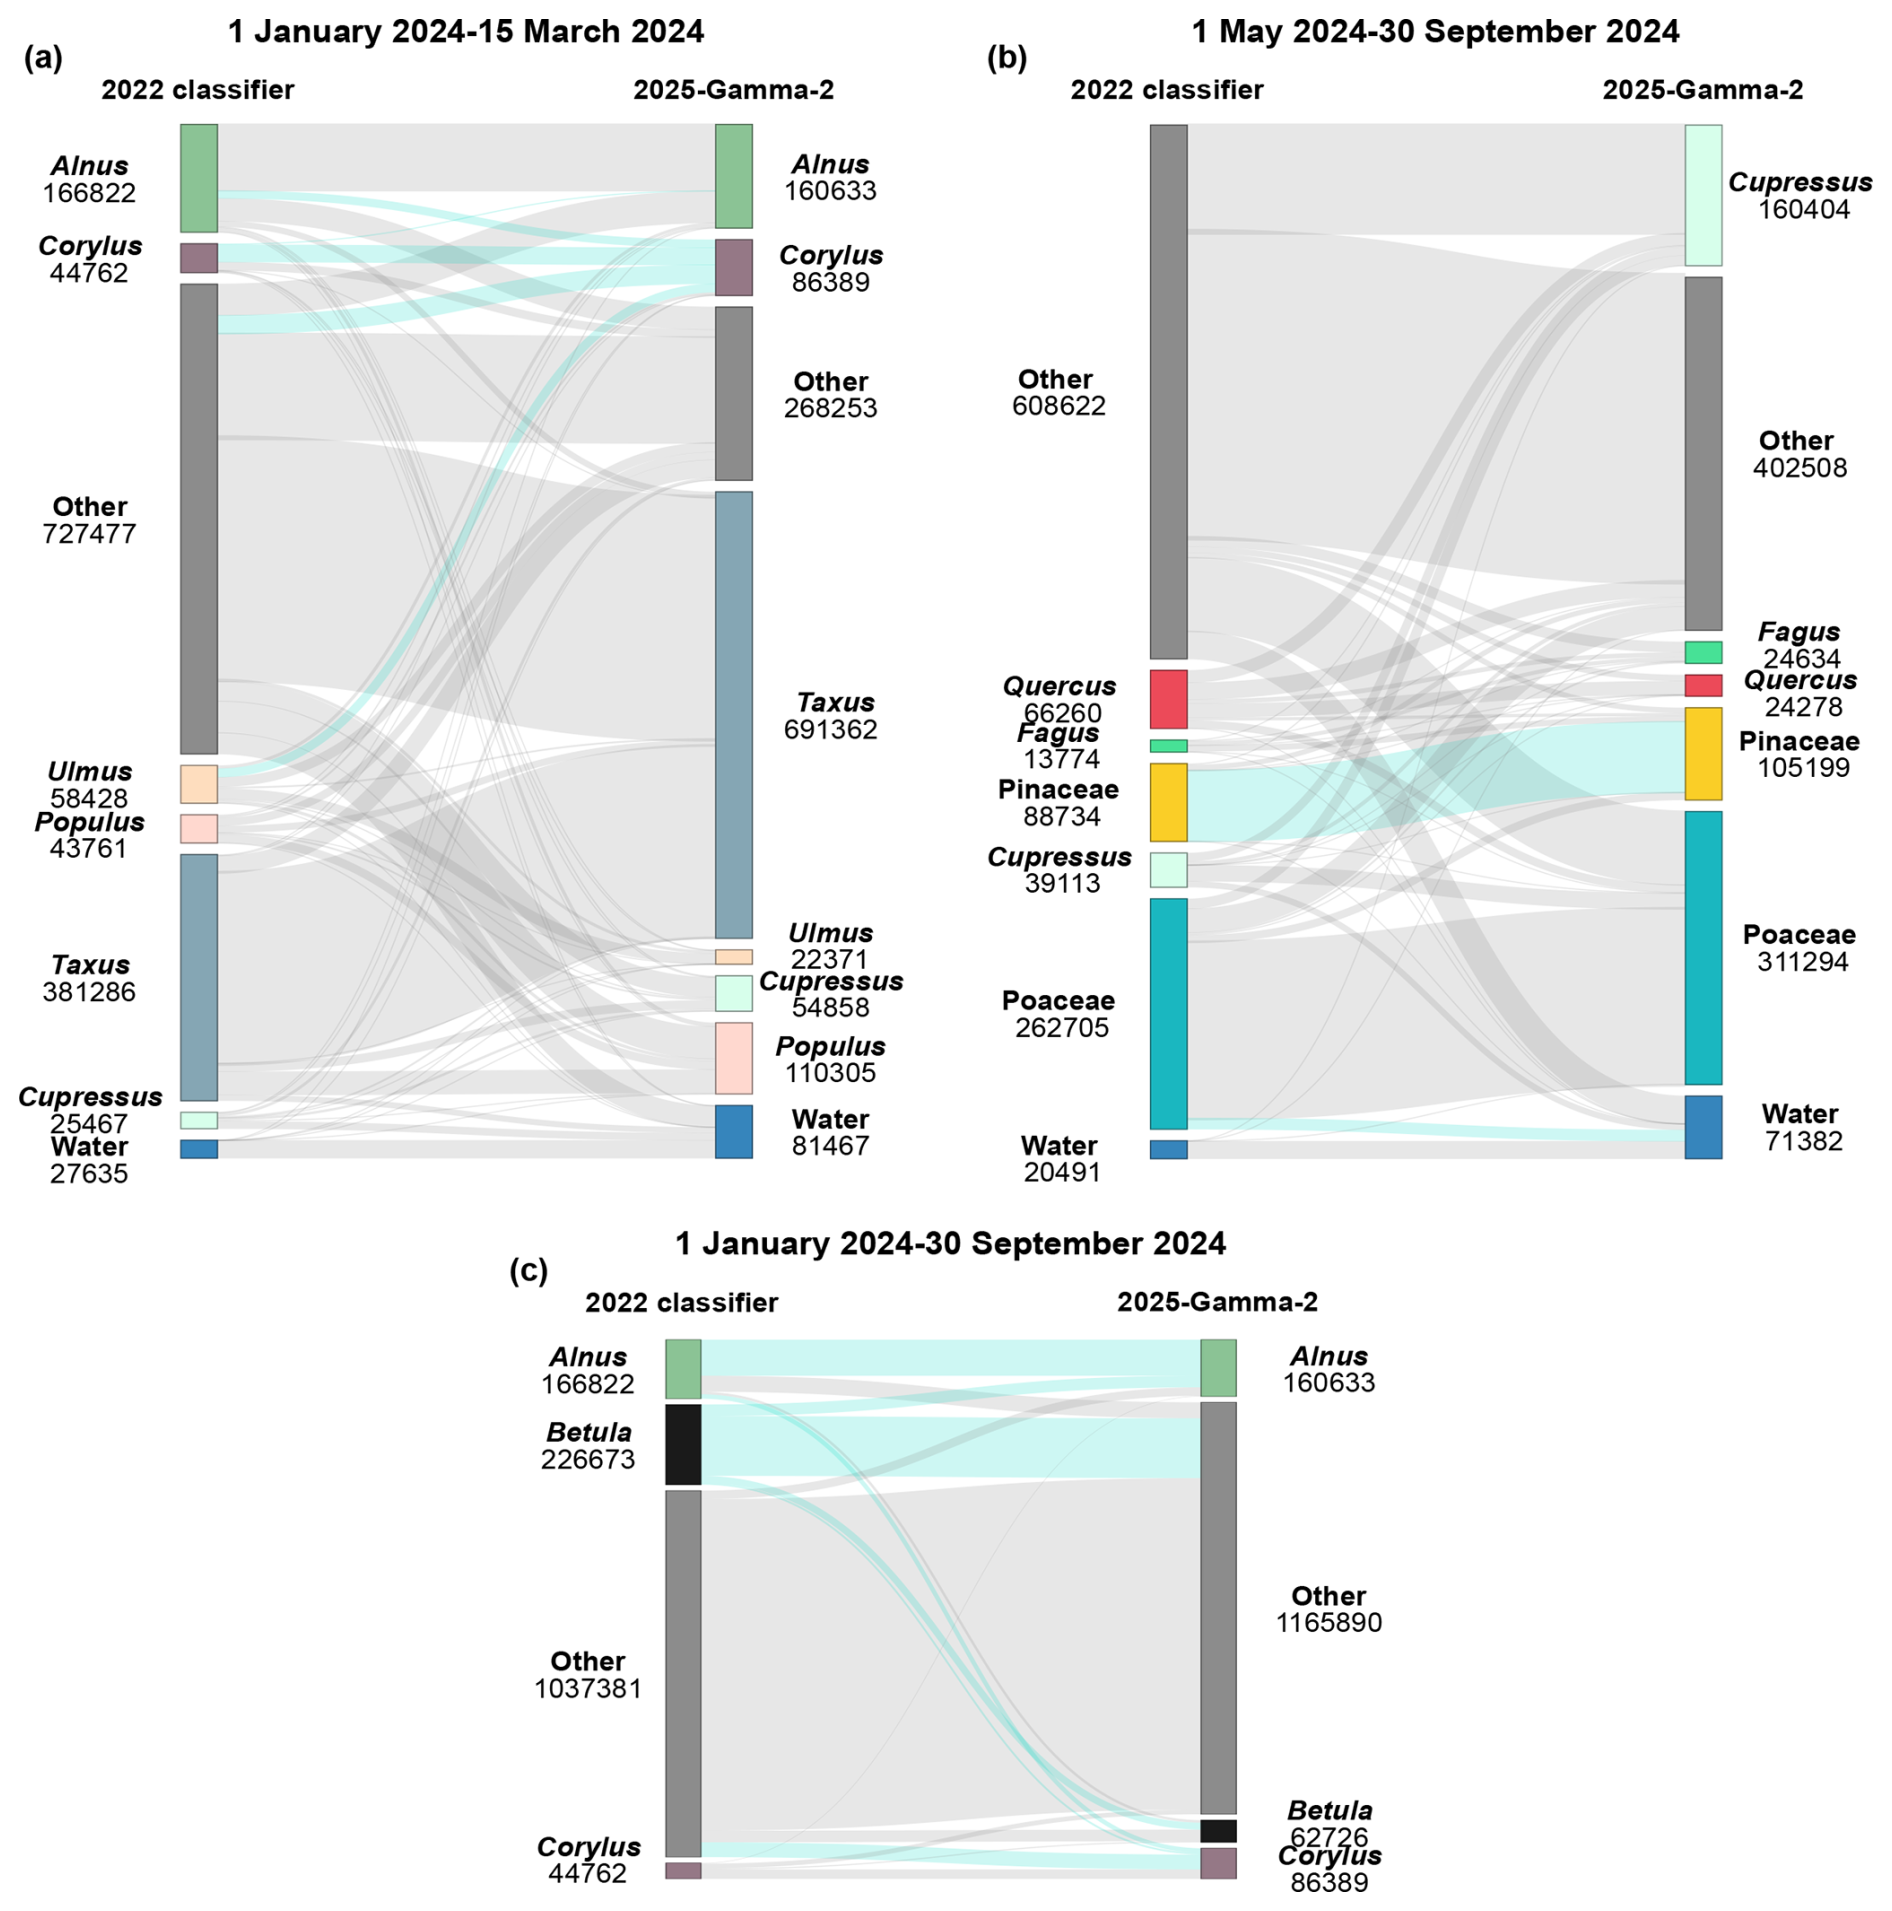
Figure 5Changes in classification of individual events between the 2022 and 2025-Gamma-2 classifiers. Three time periods are presented: (a) 1 January to 15 March 2024, and (b) 1 May to 30 September 2025 and (c) 1 January to 30 September 2024. Colours correspond to the different classes, which are consistent between the two algorithms. The 2022 classifier is shown on the left while the 2025-Gamma-2 classifier is on the right. The values under each class indicate the number of events assigned to each class. The flows highlighted in light blue are discussed specifically in the text. In panels (a) and (b) the class labelled Other contains all classes that are not in season during the two periods considered. In panel (c) we focus on the classification of Alnus, Betula and Corylus, and all other classes are grouped under Other.
To confirm the results of the timeseries correlations and more fully understand the differences between the 2022 and 2025-Gamma-2 classifiers, we selected two periods and visualised, event by event, what class each classifier allocated it to (Fig. 5). Two seasons were selected, the first from 1 January to 15 March 2024, covering the main Alnus and Corylus peaks, the second from 1 May to 30 September 2024 covering the main Poaceae season. Classes of taxa which pollen the classifier was trained to recognize but that are not releasing pollen during those periods were labelled as “Other” and any events classified as such can thus be considered as false positives. All values are in Table S5.
Figure 5 clearly highlights the improvement of the 2025 classifier when it comes to reducing the out-of-season noise. This is shown by the reduction by 63.13 % and 33.87 % of events classified as “Other” for each period respectively, between the predictions from the 2022 classifier and the 2025-Gamma-2 classifier. Importantly, 37 616 events (51.06 %) that were classified as “Other” by the 2022 algorithm are reclassified as Taxus by the 2025 algorithm. Taxus is of relatively little interest in terms of allergies in Switzerland and thus the evaluation of this class is beyond the scope of this paper. However, it is airborne during this period, so it is quite feasible that these results are accurate. Nevertheless, there is still a large proportion of particles classified as “Other”: 22.2 % of all events from the first period, and 57.7 % of all events from the second period, many of which are likely false positives. This may be a result of the restricted number of classes on which the algorithm was trained (15 in total), forcing all pollen, even other taxa not included in training data, to be allocated a class. This is one of the disadvantages of the types of algorithms used in this study. One indication that this indeed may be the case is that there are considerably more “Other” classifications in the later period. This is possibly the result of the presence of many fungal spores, for which there is no class in the algorithm but that pass the first step in the identification process (i.e., the sphericity test; Sauvageat et al., 2020). However, the portion of false positives can be reduced using more restrictive confidence thresholds. Additionally, post-processing algorithms could be applied to the predicted data, that specifically corrects false positives outside of the pollen season of a given taxa (Crouzy et al., 2022). Figure 5c focuses on the flows of classification in Alnus, Betula and Corylus between 2022 and 2025 classifiers. It shows that 74.6 % (169 025 events) of events classified as Betula by the 2022 classifier are re-classified in the 2025 classifier, probably helping in the improvement of the correlation between Betula predictions and manual timeseries (Fig. 4). We also see that 20.4 % of the events classified as Alnus by the 2025 classifier come from events previously classified as Betula, while 31.2 % events remain classified as Betula by both classifiers. Notably, few events are re-classified from Alnus (14.4 % of events classified as Corylus by 2025 classifier) and Betula (6.2 % of events classified as Corylus by 2025 classifier) as Corylus, while 48.5 % were previously classified as Other. Finally, 63.6 % of the events classified as Alnus by the 2025 classifier was already classified as Alnus by the 2022 classifier. All in all, these results highlight drastic changes in the classification of events as Betula and Corylus, while the class Alnus remains relatively stable. Additionally, there are few re-classifications from Alnus and Betula to Corylus and vice-versa, indicating that our 2025 classifier does not drastically improve discriminating Corylus pollen grains from Alnus and Betula. Number of events in each of these classes and timeframes can be found in Table S5.
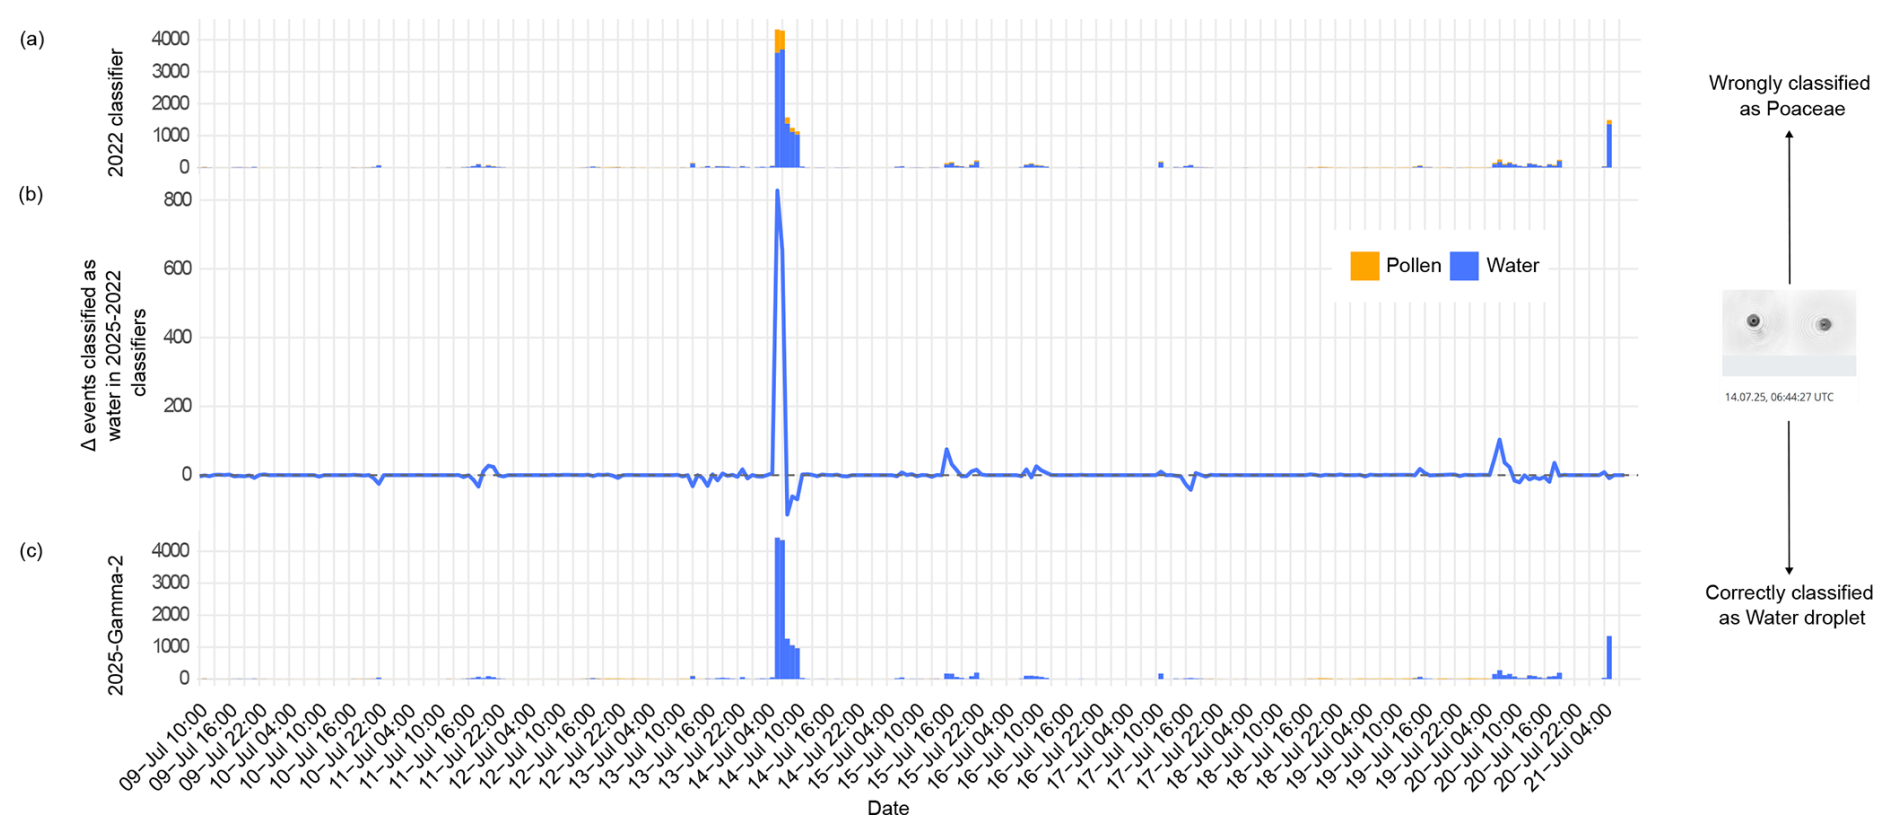
Figure 6Pollen and water droplet counts of individual events between 9–21 July 2025 at the Jungfraujoch station. Panels (a) and (c) are stacked barplots that display the hourly number of events classified as water droplets (blue) and pollen (yellow, all classes summed) for the 2022 and 2025-Gamma-2 classifiers, respectively. Panel (b) represents the difference in the number of water droplets classified by 2025-Gamma-2 minus 2022 classifier. A positive value therefore highlights an increase in the number of events classified as water by the 2025-Gamma-2 classifier. The instrument at the Jungfraujoch station typically detects mostly water droplets that are often misclassified as pollen, especially Poaceae, which is much reduced in the predictions of the 2025-Gamma-2 classifier. Note that, due to different operational pre-filtering based on size and morphology that is beyond the scope of this paper, both classifiers are not applied on exactly the same number of events, explaining negative values in panel (b).
Another improvement of the 2025 classifier is the reduction of water droplets classified as Poaceae pollen. This is clearly illustrated in Fig. 5a and b, where 2025-Gamma-2 classifies 194.96 % and 248.45 % more events as water droplets compared to the 2022 classifier for the two periods, respectively. The 2022 classifier allocates 12 895 events (18.07 % of the 2025 classifier's water droplet count) to Poaceae, which are re-classified as water by the 2025 algorithm (data can be found in Tables S6 and S7). Such confusion is particularly obvious at the High Altitude Research Station Jungfraujoch (3567 m above sea level, often located in the clouds) where long-term, year-round observations of a wide range of environmental parameters including meteorology, atmospheric composition (aerosols, trace gases), radiation, permafrost, glaciology, cosmic radiation, and human physiology are conducted. This is especially clear when a lot of water droplets are detected by the device, such as in the morning of 14 July (Fig. 6). The improvement in the 2025-Gamma-2 classifier is likely the result of the inclusion of fluorescence, since most water droplets are not expected to fluoresce.
There is also an improvement in the correlation between Corylus predictions and the manual measurements (Fig. 5a). Notably, 29 083 events (33.64 % of the 2025 Corylus events) are reclassified from “Other” in the 2022 algorithm, as are 13 333 events (15.44 % of the 2025 Corylus event) from Ulmus, and 12 411 events (14.37 % of the 2025 Corylus events) from Alnus. These additional classifications as Corylus by the 2025 algorithm result in the improved correlation with the manual data. Interestingly, just 26 621 events (30.82 % of the 2025 Corylus events) are classified as Corylus by both the 2022 and 2025 algorithms. In contrast, just 1698 events (1.06 % of the 2025 Alnus events) are reclassified from Corylus to Alnus, indicating there are considerably more Alnus events misclassified as Corylus by the 2022 algorithm rather than the other way around. Figure 5b also highlights the stability in the classification of Pinaceae (+18.55 %), which are easily identifiable because of their size and shape. This period was extended after the grass season to include times when few pollens but many water droplets are in the air.
3.4 Potential for future improvements
Despite the considerable improvements in the 2025 algorithm, the classifiers still suffers certain limitations. The correlations between the Corylus predictions and the Alnus manual timeseries, as well as the correlation between the Alnus predictions and the Corylus values slightly increase by +0.06 (0.34 and 0.40) and +0.05 (0.34 and 0.39), respectively (Fig. 3). However, these correlations remain lower or equal to the averaged Kendall's Tau between co-located manual timeseries for Alnus and Corylus (0.40). The evaluation of these classes faces intrinsic confounding factors given that their seasons overlap (indicated by * on Fig. 4) and that the genuine correlations between the manual Alnus and Corylus timeseries are thus high (0.4). It is therefore difficult to discern using correlations alone, if there is any improvement. Nevertheless, figures such as Fig. 5 can be used to help visualise how the classification of individual events change and how this may impact false positive classifications.
Another limit of the 2025 classifier is the reduction in the classification of Quercus, which, for an unknown reason, are better classified by the 2022 algorithm than the 2025 classifier (see Fig. A2). For this reason, in the operational SwissPollen setup, we will keep relying on the 2022 classifier for the classification of Quercus. Additionally, the 2025-Gamma-2 model could be evaluated for other classes that were not considered in this analysis. This could allow to operationalise more taxa and provide a wider service to the Swiss population.
Overall, the evaluation framework would benefit from richer and more diverse evaluation datasets, while keeping in mind that this analysis can be computationally intensive and that data quality should be prioritised over quantity. Extending the analysis to operational data representing multiple seasons over years would help capture inter-annual variability in pollen production and meteorological conditions (Gehrig and Clot, 2021; Emberlin et al., 2002). Consequently, broader datasets spanning several biogeographical regions and multiple seasons, devices, taxa and years would improve the robustness and generalisability of the evaluation protocol. Such extensions are a necessary step toward moving toward more harmonised, long-term operational evaluations.
In this study, we introduce a structured and reproducible framework for developing and evaluating deep-learning classifiers based on their operationally relevant behaviour. Applied to operational data from five SwissPollen stations, the framework enabled a systematic comparison between classifiers, both new models trained on holography and fluorescence data and a long-standing operational reference model based solely on holography, as well as among classifiers incorporating fluorescence information. The proposed metrics and visualisations clearly highlighted cases of overtraining linked to insufficient diversity in the training datasets, demonstrating how the framework can actively support the tuning and improvement of classifier training strategies. The evaluation further showed that the inclusion of fluorescence data leads to tangible performance gains for several taxa, most notably Poaceae, for which false positives caused by misclassified water droplets were substantially reduced compared to the 2022 operational algorithm. Improvements were also observed for the discrimination of Betulaceae genera (Alnus, Corylus, Betula), as well as for Fagus and Fraxinus, while Quercus remained the only taxon among the fifteen considered for which no clear improvement was identified. Despite a marked reduction in false positives in the 2025 classifier, a non-negligible fraction of events remains misclassified, underscoring the intrinsic complexity of real-time bioaerosol classification.
Although the 2025 classifier has been developed and evaluated specifically for Switzerland, the proposed methodology is readily adaptable to other biogeographical regions, provided that suitable training and/or evaluation datasets are available. Beyond this case study, the framework is intended to support the community by enabling transparent and robust comparisons of bioaerosol classifiers, including across different instrument types, and by guiding model development through the identification of impactful and operationally relevant performance differences. The robustness of such evaluations ultimately depends on the representativeness of the evaluation dataset, and future extensions should therefore include multi-season, multi-year, and multi-region datasets to better capture inter-annual variability and regional specificities. Ultimately, this approach should support the selection of the most appropriate algorithm for each operational context and to strengthen the reliability and harmonisation of automatic bioaerosol monitoring worldwide.
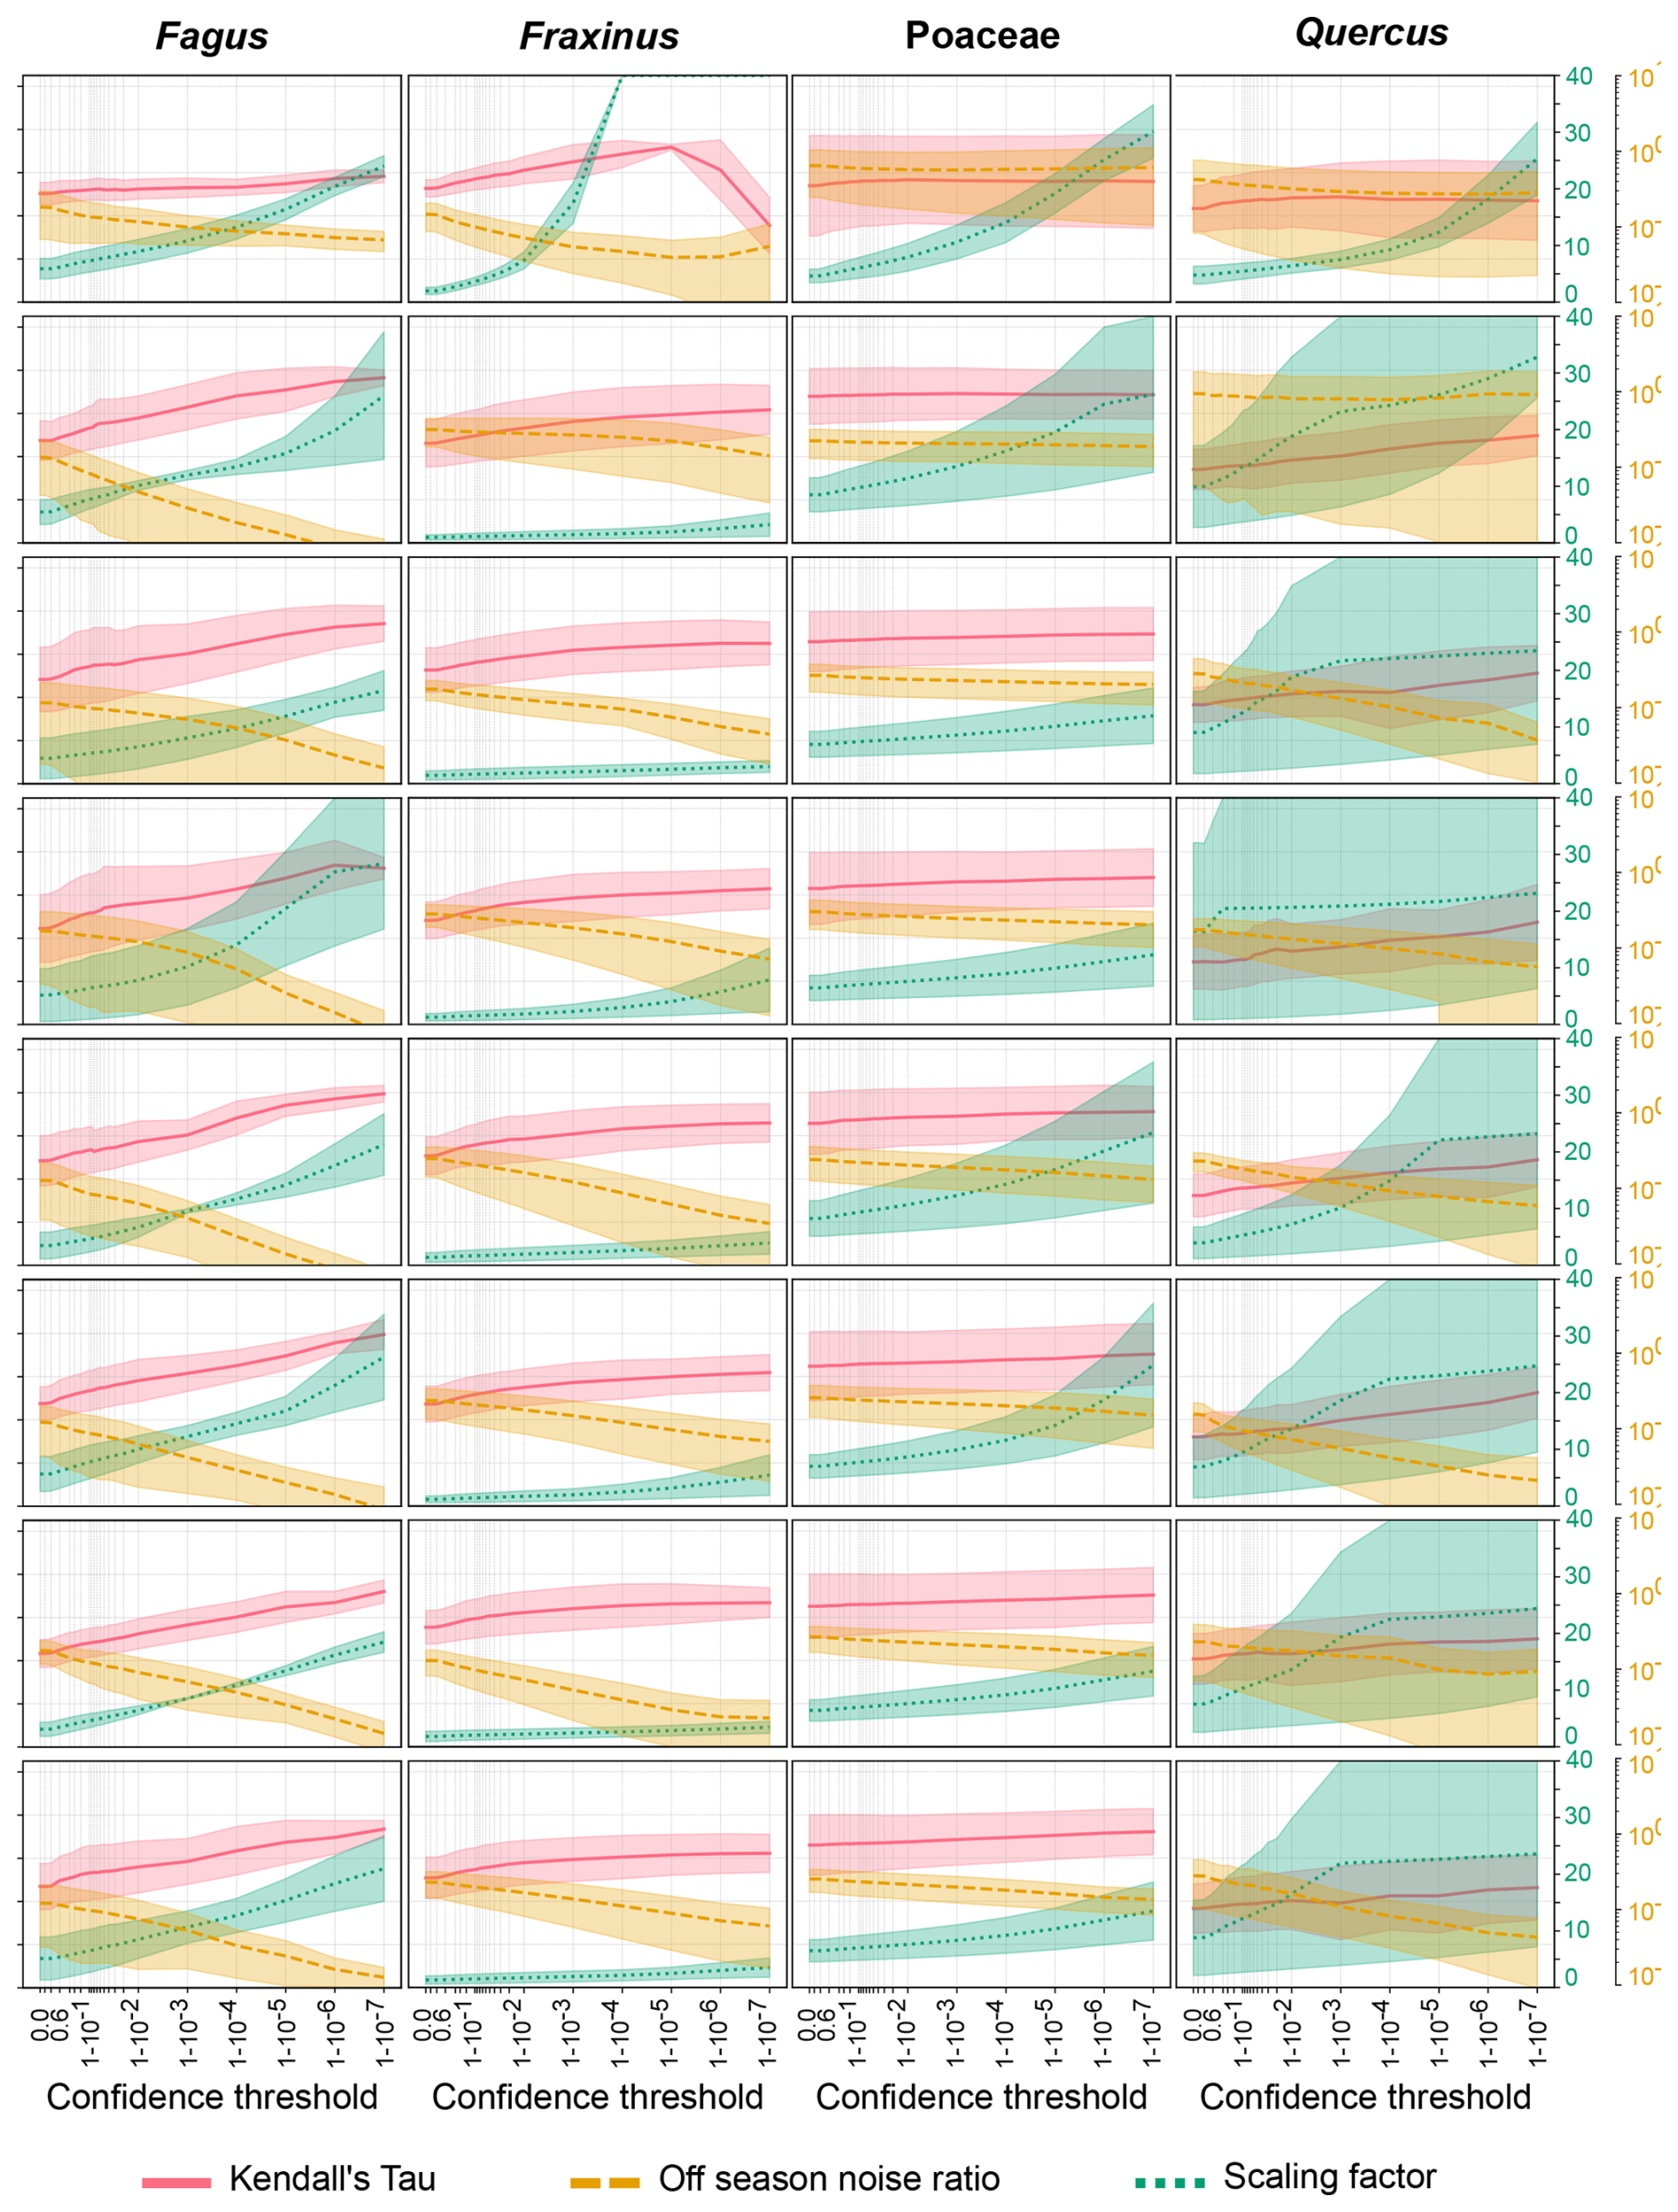
Figure A1Kendall Tau correlation, scaling factor and Off-season noise ratio as a function of the confidence threshold for Fagus, Fraxinus, Poaceae and Quercus for the five sites and eight classifiers. The yellow, green and red areas illustrate the spread of the Kendall Tau, scaling factor and off-season noise ratio. respectively. Lines represent the averaged metrics across the five sites. Note that the axis of the scaling factor stops at 40, while values can be as high as 1000.
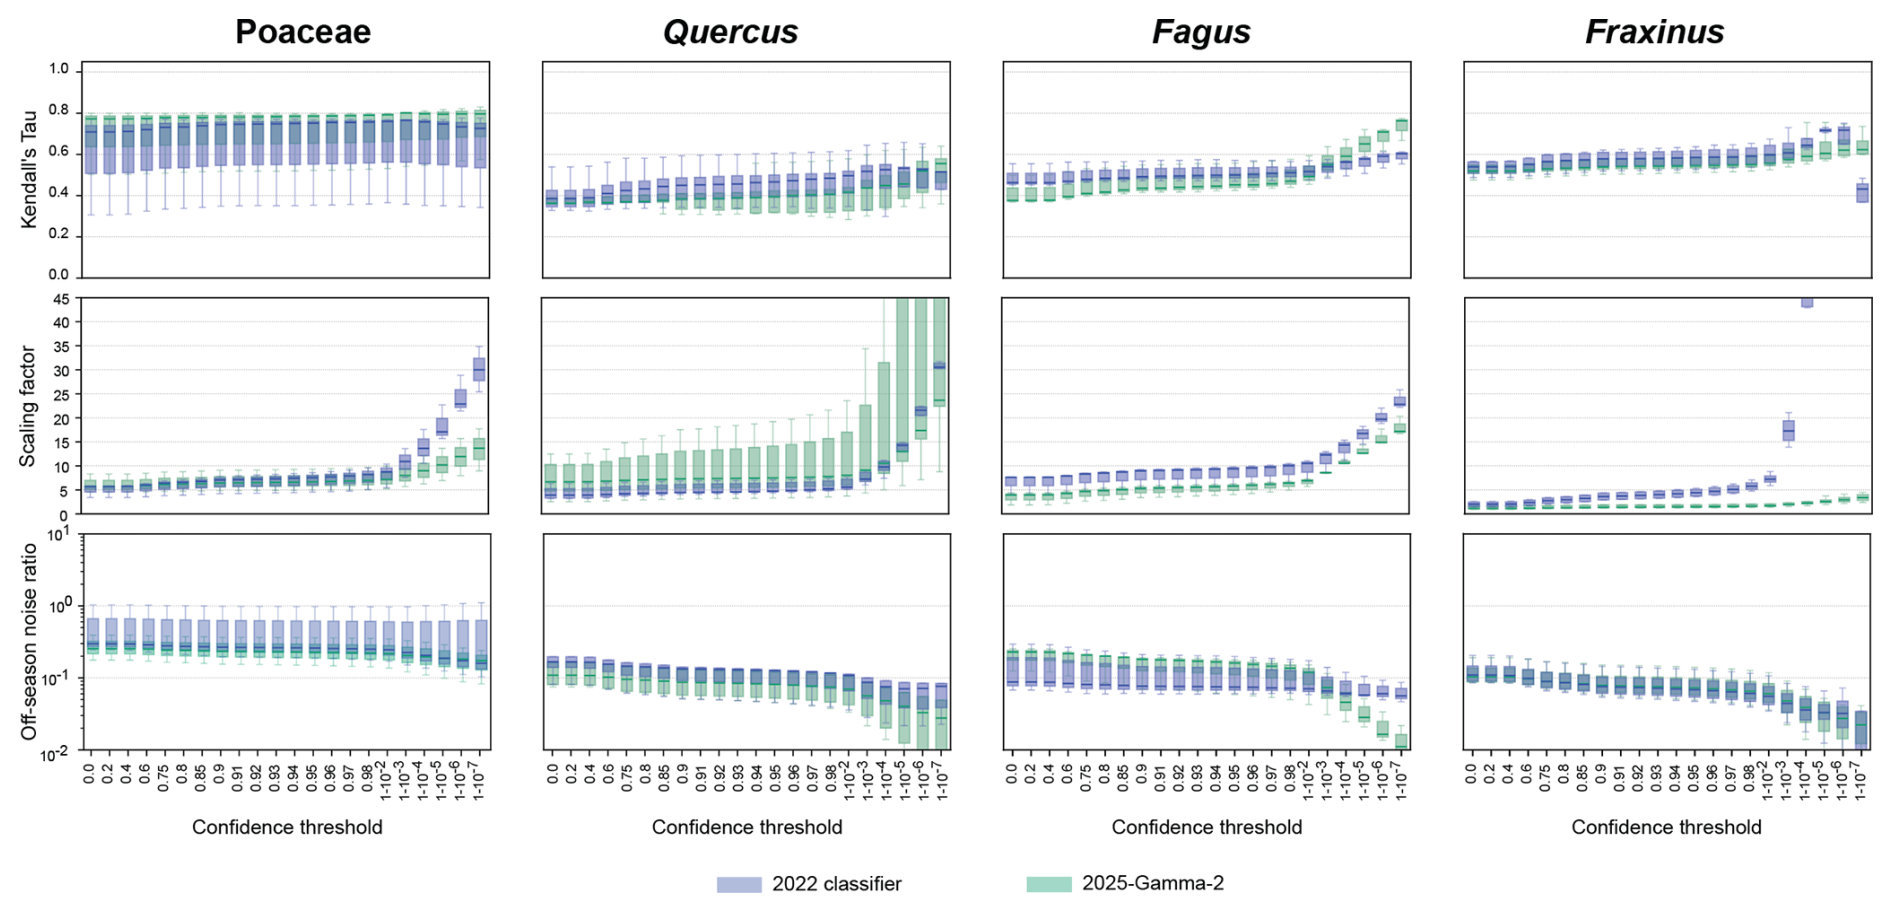
Figure A2Kendall Tau correlation, scaling factor and off-season noise ratio as a function of the confidence threshold for Poaceae, Quercus, Fagus and Fraxinus. Values are shown for the 2022 (green) and 2025 (blue) classifiers and for the five sites. Scaling factors greater than 40 are not shown.
All the code and level-1 data used for this study can be found on the public GitHub repository MeteoSwiss/swisspollen-models (https://github.com/MeteoSwiss/swisspollen-models, last access: 4 May 2026) and on the Zenodo archive (https://doi.org/10.5281/zenodo.20020542, Crouzy et al., 2026). Due to technical limitations, level-0 can only be provided upon request.
The supplement related to this article is available online at https://doi.org/10.5194/amt-19-3427-2026-supplement.
Marie-Pierre Meurville: Conceptualization, Data curation, Formal analysis, Investigation, Methodology, Classifier, Validation, Visualisation, Writing – original draft; Bernard Clot: Conceptualization, Data curation, Methodology, Project administration, Supervision, Writing – review and editing; Sophie Erb: Data curation; Maria Lbadaoui: Data curation; Fiona Tummon: Conceptualization, Formal analysis, Investigation, Methodology, Writing – review and editing; Gian Lieberherr: Conceptualization, Formal analysis, Investigation, Methodology, Classifier, Validation, Writing – review and editing; Benoît Crouzy: Conceptualization, Formal analysis, Investigation, Methodology, Classifier, Validation, Writing – review and editing.
The contact author has declared that none of the authors has any competing interests.
Publisher's note: Copernicus Publications remains neutral with regard to jurisdictional claims made in the text, published maps, institutional affiliations, or any other geographical representation in this paper. The authors bear the ultimate responsibility for providing appropriate place names. Views expressed in the text are those of the authors and do not necessarily reflect the views of the publisher.
We thank Julia Burkard for providing Fagus pollen data recorded with the SwisensPoleno Jupiter of the University of Vienna, as well as Swisens AG for providing their classifier training and inference pipeline.
This work contributes to the EUMETNET AutoPollen Programme. This research has been supported by the HORIZON EUROPE Food, Bioeconomy, Natural Resources, Agriculture and Environment (grant no. 101086109, SYLVA project), the Schweizerischer Nationalfonds zur Förderung der Wissenschaftlichen Forschung (grant no. IZCOZ0_198117), and the European Association of National Metrology Institutes (grant no. 23NRM03). The project 23NRM03 BioAirMet has received funding from the European Partnership on Metrology, co-financed from the European Union’s Horizon Europe Research and Innovation Programme and by the Participating States.
This paper was edited by Cuiqi Zhang and reviewed by two anonymous referees.
Adamov, S., Lemonis, N., Clot, B., Crouzy, B., Gehrig, R., Graber, M.-J., Sallin, C., and Tummon, F.: On the measurement uncertainty of Hirst-type volumetric pollen and spore samplers, Aerobiologia, 40, 77–91, https://doi.org/10.1007/s10453-021-09724-5, 2021. a, b, c, d
Bai, J., Lu, F., Zhang, K., et al.: ONNX: Open Neural Network Exchange, GitHub [code], https://github.com/onnx/onnx (last access: 5 August 2025), 2019. a
Bastl, K., Kmenta, M., and Berger, U. E.: Defining pollen seasons: Background and recommendations, Curr. Allergy Asthma Rep., 18, 73, https://doi.org/10.1007/s11882-018-0829-z, 2018. a
Berg, M. J. and Videen, G.: Digital holographic imaging of aerosol particles in flight, Journal of Quantitative Spectroscopy and Radiative Transfer, 112, 1776–1783, https://doi.org/10.1016/j.jqsrt.2011.01.013, 2011. a
Brdar, S., Panić, M., Matavulj, P., Stanković, M., Bartolić, D., and Šikoparija, B.: Explainable AI for unveiling deep learning pollen classification model based on fusion of scattered light patterns and fluorescence spectroscopy, Sci. Rep., 13, https://doi.org/10.1038/s41598-023-30064-6, 2023. a
Brito, F. F.: Grass pollen, aeroallergens, and clinical symptoms in Ciudad Real, Spain, J. Invest. Allerg. Clin., 20, 603, PMID: 20815307, 2010. a
Burden, R. L. and Faires, J. D.: Numerical Analysis, 9th edn., Chapter 4: Numerical Differentiation and Integration, Section: The Trapezoidal Rule, Brooks/Cole, Cengage Learning, Boston, MA, ISBN-13 978-0-538-73351-9, ISBN-10 0-538-73351-9, 2011. a
Buters, J. T. M., Antunes, C., Galveias, A., Bergmann, K. C., Thibaudon, M., Galán, C., Schmidt-Weber, C., and Oteros, J.: Pollen and spore monitoring in the world, Clinical and Translational Allergy, 8, https://doi.org/10.1186/s13601-018-0197-8, 2018. a
Croux, C. and Dehon, C.: Influence functions of the Spearman and Kendall correlation measures, Stat. Method. Appl., 19, 497–515, https://doi.org/10.1007/s10260-010-0142-z, 2010. a
Crouzy, B., Lieberherr, G., Tummon, F., and Clot, B.: False positives: handling them operationally for automatic pollen monitoring, Aerobiologia, 38, 429–432, https://doi.org/10.1007/s10453-022-09757-4, 2022. a, b
Crouzy, B., Meurville, M.-P., Clot, B., Erb, S., Lbadaoui-Darvas, M., Tummon, F., and Lieberherr, G.: Operational pollen classification using digital holography and fluorescence, Aerobiologia, https://doi.org/10.1007/s10453-025-09882-w, 2025. a, b
Crouzy, B., Meurville, M.-P., and Lieberherr, G.: MeteoSwiss/swisspollen-models: Zenodo Archive (Zenodo), Zenodo [code], https://doi.org/10.5281/zenodo.20020542, 2026. a, b, c, d, e
Emberlin, J., Savage, M., and Jones, S.: Annual variations in grass pollen seasons in London 1961–1990: trends and forecast models, Clin. Exp. Allergy, 23, 911–918, https://doi.org/10.1111/j.1365-2222.1993.tb00275.x, 1993. a
Emberlin, J., Detandt, M., Gehrig, R., Jaeger, S., Nolard, N., and Rantio-Lehtimäki, A.: Responses in the start of Betula (birch) pollen seasons to recent changes in spring temperatures across Europe, Int. J. Biometeorol., 46, 159–170, 2002. a
Erb, S., Graf, E., Zeder, Y., Lionetti, S., Berne, A., Clot, B., Lieberherr, G., Tummon, F., Wullschleger, P., and Crouzy, B.: Real-time pollen identification using holographic imaging and fluorescence measurements, Atmos. Meas. Tech., 17, 441–451, https://doi.org/10.5194/amt-17-441-2024, 2024. a, b, c, d
Erb, S., Berne, A., Clot, B., Lbadaoui-Darvas, M., Lieberherr, G.-D., Meurville, M.-P., Tummon, F., and Crouzy, B.: Pollen holographic images and light-induced fluorescence measurements at the species level, Sci. Data, 12, https://doi.org/10.1038/s41597-025-05139-w, 2025. a
European Committee for Standardization (CEN): Ambient air – Sampling and analysis of airborne pollen grains and fungal spores for networks related to allergy – Volumetric Hirst method, CEN, Brussels, standard no. EN 16868:2019, https://www.en-standard.eu/csn-en-16868-ambient-air-sampling-and-analysis-of-airborne-pollen-grains-for-allergy-networks-volumetric-hirst-method/ (last access: 4 May 2026), 2019. a, b
Federal Statistical Office (Switzerland): Densité de la population (surface totale), BFS-Nummer mx-f-01-01.02.01-003, Asset 3262709, Office fédéral de la statistique (Switzerland), https://www.bfs.admin.ch/bfs/fr/home/statistiken/bevoelkerung/stand-entwicklung.assetdetail.3262709.html (last access: 4 May 2026), 2017. a
Galán, C., Smith, M., Thibaudon, M., Frenguelli, G., Oteros, J., Gehrig, R., Berger, U., Clot, B., and Brandao, R.: Pollen monitoring: minimum requirements and reproducibility of analysis, Aerobiologia, 30, 385–395, https://doi.org/10.1007/s10453-014-9335-5, 2014. a
Gehrig, R. and Clot, B.: 50 Years of Pollen Monitoring in Basel (Switzerland) Demonstrate the Influence of Climate Change on Airborne Pollen, Frontiers in Allergy, 2, https://doi.org/10.3389/falgy.2021.677159, 2021. a, b
Hasegawa, T. M., Itagaki, T., and Sakai, S.: Intraspecific variation in morphology of spiny pollen grains along an altitudinal gradient in an insect‐pollinated shrub, Plant Biol., 25, 287–295, https://doi.org/10.1111/plb.13493, 2022. a
Hirst, J. M.: An automatic volumetric spore trap, Ann. Appl. Biol., 39, 257–265, https://doi.org/10.1111/j.1744-7348.1952.tb00904.x, 1952. a
Huffman, J. A., Perring, A. E., Savage, N. J., Clot, B., Crouzy, B., Tummon, F., Shoshanim, O., Damit, B., Schneider, J., Sivaprakasam, V., Zawadowicz, M. A., Crawford, I., Gallagher, M., Topping, D., Doughty, D. C., Hill, S. C., and Pan, Y.: Real-time sensing of bioaerosols: Review and current perspectives, Aerosol Sci. Tech., 54, 465–495, https://doi.org/10.1080/02786826.2019.1664724, 2019. a
Hyde, H.: Volumetric counts of pollen grains at Cardiff, 1954–1957, J. Allergy, 30, 219–234, https://doi.org/10.1016/0021-8707(59)90069-3, 1959. a
Kendall, M. G.: A new measure of rank correlation, Biometrika, 30, 81–93, https://doi.org/10.1093/biomet/30.1-2.81, 1938. a
Maya-Manzano, J. M., Tummon, F., Abt, R., Allan, N., Bunderson, L., Clot, B., Crouzy, B., Daunys, G., Erb, S., Gonzalez-Alonso, M., Graf, E., Grewling, L., Haus, J., Kadantsev, E., Kawashima, S., Martinez-Bracero, M., Matavulj, P., Mills, S., Niederberger, E., Lieberherr, G., Lucas, R. W., O'Connor, D. J., Oteros, J., Palamarchuk, J., Pope, F. D., Rojo, J., Šaulienė, I., Schäfer, S., Schmidt-Weber, C. B., Schnitzler, M., Šikoparija, B., Skjøth, C. A., Sofiev, M., Stemmler, T., Triviño, M., Zeder, Y., and Buters, J.: Towards European automatic bioaerosol monitoring: Comparison of 9 automatic pollen observational instruments with classic Hirst-type traps, Sci. Total Environ., 866, 161220, https://doi.org/10.1016/j.scitotenv.2022.161220, 2023. a, b
MeteoSwiss: SwissPollen Identification Models, GitHub [code], https://github.com/MeteoSwiss/swisspollen-models (last access: 4 May 2026), 2025. a, b, c, d
Oteros, J., Buters, J., Laven, G., Röseler, S., Wachter, R., Schmidt-Weber, C., and Hofmann, F.: Errors in determining the flow rate of Hirst-type pollen traps, Aerobiologia, 33, 201–210, https://doi.org/10.1007/s10453-016-9467-x, 2016. a, b, c
Peel, M. C., Finlayson, B. L., and McMahon, T. A.: Updated world map of the Köppen-Geiger climate classification, Hydrol. Earth Syst. Sci., 11, 1633–1644, https://doi.org/10.5194/hess-11-1633-2007, 2007. a
Sauvageat, E., Zeder, Y., Auderset, K., Calpini, B., Clot, B., Crouzy, B., Konzelmann, T., Lieberherr, G., Tummon, F., and Vasilatou, K.: Real-time pollen monitoring using digital holography, Atmos. Meas. Tech., 13, 1539–1550, https://doi.org/10.5194/amt-13-1539-2020, 2020. a, b, c, d, e, f, g
Sikoparija, B., Galán, C., and Smith, M.: Pollen-monitoring: between analyst proficiency testing, Aerobiologia, 33, 191–199, https://doi.org/10.1007/s10453-016-9461-3, 2016. a, b, c
Simonyan, K. and Zisserman, A.: Very Deep Convolutional Networks for Large-Scale Image Recognition, arXiv [preprint], https://doi.org/10.48550/arXiv.1409.1556, 2014. a
Tan, M. and Le, Q. V.: EfficientNet: Rethinking Model Scaling for Convolutional Neural Networks, arXiv [preprint], https://doi.org/10.48550/arXiv.1905.11946, 2020. a
Triviño, M. M., Maya-Manzano, J. M., Tummon, F., Clot, B., Grewling, L., Schmidt-Weber, C., and Buters, J.: Variability between Hirst-type pollen traps is reduced by resistance-free flow adjustment, Aerobiologia, 39, 257–273, https://doi.org/10.1007/s10453-023-09790-x, 2023. a, b, c
Tummon, F., Adamov, S., Clot, B., Crouzy, B., Gysel-Beer, M., Kawashima, S., Lieberherr, G., Manzano, J., Markey, E., Moallemi, A., and O'Connor, D.: A first evaluation of multiple automatic pollen monitors run in parallel, Aerobiologia, 40, 93–108, https://doi.org/10.1007/s10453-021-09729-0, 2021. a
Virtanen, P., Gommers, R., Oliphant, T. E., Haberland, M., Reddy, T., Cournapeau, D., Burovski, E., Peterson, P., Weckesser, W., Bright, J., van der Walt, S. J., Brett, M., Wilson, J., Millman, K. J., Mayorov, N., Nelson, A. R. J., Jones, E., Kern, R., Larson, E., Carey, C. J., Polat, I., Feng, Y., Moore, E. W., VanderPlas, J., Laxalde, D., Perktold, J., Cimrman, R., Henriksen, I., Quintero, E. A., Harris, C. R., Archibald, A. M., Ribeiro, A. H., Pedregosa, F., van Mulbregt, P., Vijaykumar, A., Bardelli, A. P., Rothberg, A., Hilboll, A., Kloeckner, A., Scopatz, A., Lee, A., Rokem, A., Woods, C. N., Fulton, C., Masson, C., Häggström, C., Fitzgerald, C., Nicholson, D. A., Hagen, D. R., Pasechnik, D. V., Olivetti, E., Martin, E., Wieser, E., Silva, F., Lenders, F., Wilhelm, F., Young, G., Price, G. A., Ingold, G.-L., Allen, G. E., Lee, G. R., Audren, H., Probst, I., Dietrich, J. P., Silterra, J., Webber, J. T., Slavič, J., Nothman, J., Buchner, J., Kulick, J., Schönberger, J. L., de Miranda Cardoso, J. V., Reimer, J., Harrington, J., Rodríguez, J. L. C., Nunez-Iglesias, J., Kuczynski, J., Tritz, K., Thoma, M., Newville, M., Kümmerer, M., Bolingbroke, M., Tartre, M., Pak, M., Smith, N. J., Nowaczyk, N., Shebanov, N., Pavlyk, O., Brodtkorb, P. A., Lee, P., McGibbon, R. T., Feldbauer, R., Lewis, S., Tygier, S., Sievert, S., Vigna, S., Peterson, S., More, S., Pudlik, T., Oshima, T., Pingel, T. J., Robitaille, T. P., Spura, T., Jones, T. R., Cera, T., Leslie, T., Zito, T., Krauss, T., Upadhyay, U., Halchenko, Y. O., and Vázquez-Baeza, Y.: SciPy 1.0: fundamental algorithms for scientific computing in Python, Nat. Methods, 17, 261–272, https://doi.org/10.1038/s41592-019-0686-2, 2020. a
Wüthrich, B., Schindler, C., Leuenberger, P., and Ackermann-Liebrich, U.: Prevalence of Atopy and Pollinosis in the Adult Population of Switzerland (SAPALDIA Study), Int. Arch. Allergy Imm., 106, 149–156, https://doi.org/10.1159/000236836, 2009. a