the Creative Commons Attribution 4.0 License.
the Creative Commons Attribution 4.0 License.
 | 04 Jun 2026
Direct-sun versus sky-scan Pandora formaldehyde retrievals: implications for satellite validation and sampling representativeness in Tropical Southeast Asia
Santanasawry A. L. David Arul
Jackson Hian-Wui Chang
Yong Jie Wong
Maggie Chel-Gee Ooi
Juneng Liew
Fuei Pien Chee
Jedol Dayou
Justin Sentian
Putu Aryastana
Neng-Huei Lin
Ground-based Pandora spectrometers are widely used for validating satellite formaldehyde (HCHO) retrievals, yet the roles of retrieval geometry and sampling representativeness remain poorly constrained in tropical environments. This study evaluates Pandora Level-2 HCHO columns from five Southeast Asian stations (2021–2024), distinguishing between direct-sun (DS) and sky-scan (SS) observations and comparing them with satellite products from Ozone Monitoring Instrument (OMI), TROPOspheric Monitoring Instrument (TROPOMI), and Geostationary Environment Monitoring Spectrometer (GEMS) following uncertainty-based quality control. DS and SS retrievals show strong internal consistency under high-quality conditions (r > 0.7). Besides, DS generally exhibits greater variability and, at several sites, stronger sensitivity to localized variability, whereas SS often yields lower RMSE/MAE and more spatially representative agreement with satellite observations. Satellite comparisons reveal a clear performance hierarchy: OMI shows weak correlations (r < 0.4) and large errors, TROPOMI improves agreement (r ≈ 0.3–0.5), and GEMS further enhances performance in urban environments (r ≈ 0.58–0.65 at Bangkok) with reduced error magnitudes due to higher temporal sampling. However, discrepancies persist even under near-synchronous conditions, indicating that improved temporal resolution – within current satellite capabilities – does not fully resolve satellite–ground differences. These residual differences are consistent with sampling scale mismatches between localized Pandora measurements and spatially averaged satellite footprints. Overall, the results demonstrate that satellite validation in tropical regions is governed by the combined effects of retrieval geometry, spatial sampling, and temporal resolution, providing a framework for interpreting satellite–ground HCHO comparisons and guiding future validation strategies.
- Article
(7130 KB) - Full-text XML
-
Supplement
(2013 KB) - BibTeX
- EndNote


Formaldehyde (HCHO) is a key intermediate in tropospheric photochemistry and one of the most important carbonyl compounds in the atmosphere. It is produced primarily through the oxidation of volatile organic compounds (VOCs) from both biogenic and anthropogenic sources and serves as an effective proxy for VOC emissions at local to regional scales. Through photolysis, HCHO represents a major source of hydroperoxy (HO2) radicals, thereby enhancing ozone (O3) production in the presence of nitrogen oxides (NOx) and contributing to secondary organic aerosol formation. Owing to its short atmospheric lifetime, typically on the order of hours (Lim et al., 2019), HCHO exhibits strong spatial and temporal variability and is highly sensitive to changes in emissions, meteorology, and photochemical activity (Fang et al., 2017; Liao et al., 2021; Lim et al., 2019). Accurate characterization of HCHO is therefore essential for understanding air quality, constraining chemical transport models, and evaluating emission control strategies, particularly in regions with intense photochemistry and episodic pollution.
A range of techniques exists for measuring atmospheric HCHO, including in situ sensors and ground-based remote sensing methods such as differential optical absorption spectroscopy (DOAS) (Liu et al., 2020; Pinardi et al., 2013), Fourier transform infrared spectroscopy (FTIR) (Jones et al., 2009; Vigouroux et al., 2018), and cavity-enhanced absorption spectrometers (Glowania et al., 2021). While these instruments can provide high-precision observations, their deployment is limited by cost, logistical complexity, and maintenance requirements (Lee et al., 2024; Tian et al., 2019). As a result, routine HCHO measurements are rarely included in national air quality monitoring networks, leading to substantial observational gaps, especially in rapidly developing regions such as Southeast Asia. Satellite remote sensing has therefore become a critical tool for monitoring HCHO, offering consistent spatial coverage and long-term observations that enable the identification of emission hotspots, seasonal variability, and regional trends.
Among satellite instruments, the Ozone Monitoring Instrument (OMI) onboard NASA's Aura satellite has provided global HCHO observations since 2004 (Tanskanen et al., 2006), with near-daily coverage and a nadir footprint of approximately 13 × 24 km2 (Ahn et al., 2008). OMI HCHO products have been widely used for air quality and atmospheric chemistry studies (Zhu et al., 2017); however, their accuracy is affected by cloud contamination, aerosol loading, surface reflectance, and viewing geometry. Consequently, robust validation using independent ground-based measurements remains essential (Harkey et al., 2021). In recent years, the Pandonia Global Network (PGN) of Pandora spectrometers has emerged as a key resource for satellite validation. Pandora instruments retrieve total vertical columns of trace gases using high-resolution UV–visible spectroscopy and offer standardized, long-term observations across a growing global network.
For HCHO, Pandora spectrometers provide two physically distinct retrieval modes – Direct-sun and Sky-scan – yet their differing sensitivities and implications for satellite validation remain insufficiently quantified (Herman et al., 2015). Direct-sun retrievals sample the atmospheric column along a narrow solar beam, while sky-scan observations integrate scattered radiation across multiple viewing angles. Differences between direct-sun and sky-scan retrievals are primarily associated with sampling characteristics and spatial representativeness. While the two retrieval modes may differ in their effective sensitivity to atmospheric structure, this study focuses on their observational behaviour and consistency rather than explicit vertical sensitivity differences. Direct-sun (DS) and sky-scan (SS) retrievals are often analyzed separately in validation studies due to their differing measurement characteristics. Recent work has proposed approaches to combine DS and SS observations by accounting for systematic differences in bias and sampling (Rawat et al., 2025). However, the extent to which these retrieval geometries influence satellite–ground agreement, particularly in terms of spatial-temporal representativeness, remains insufficiently quantified. This lack of distinction is particularly consequential in tropical environments, where strong emission heterogeneity, biomass burning, and rapid photochemical production amplify sub-pixel variability (Herman et al., 2015). A systematic evaluation of Direct-sun versus Sky-scan Pandora HCHO, and their respective consistency with satellite observations, therefore, represents a critical but largely unexplored gap in current validation frameworks.
Validation efforts for satellite HCHO products have largely focused on mid-latitude regions in North America, Europe, and East Asia (Palmer et al., 2003; Spinei et al., 2018; Zhu et al., 2016), often leveraging intensive field campaigns. Comparatively few studies have examined tropical environments, where high solar irradiance, frequent convection, complex cloud fields, and recurrent biomass burning introduce additional challenges for both satellite and ground-based retrievals (Hansen et al., 2019). Southeast Asia is a particularly critical yet underexplored region, characterized by dense urban emissions, seasonal agricultural burning, and persistent transboundary haze, all of which drive strong variability in HCHO (Cheong et al., 2019; Fu et al., 2007). These conditions amplify the importance of understanding how ground-based sampling geometry interacts with satellite spatial resolution.
Recent satellite instruments such as the TROPOspheric Monitoring Instrument (TROPOMI) provide substantially higher spatial resolution than OMI and enable improved detection of localized HCHO enhancements under favorable conditions (Lee et al., 2024; Su et al., 2020). However, higher spatial resolution alone does not eliminate representativeness errors when comparing satellite and ground-based observations, particularly in heterogeneous tropical environments (Boersma et al., 2016). TROPOMI retrievals remain sensitive to cloud fraction, aerosol loading, and surface reflectance, and their smaller pixel size can increase sensitivity to localized plumes that may not be representative of broader atmospheric columns (Boersma et al., 2016; De Smedt et al., 2018). In addition, OMI's coarser spatial footprint provides a stable reference for diagnosing first-order effects related to spatial representativeness. Complementing these polar-orbiting sensors, the Geostationary Environment Monitoring Spectrometer (GEMS) offers hourly observations over East and Southeast Asia, enabling improved characterization of diurnal variability and reducing temporal sampling mismatches in satellite–ground comparisons (Bak et al., 2019). The combined use of OMI, TROPOMI, and GEMS therefore provides a comprehensive framework to disentangle the relative roles of spatial resolution, temporal sampling, and retrieval geometry in satellite validation. In this context, differences between Pandora Direct-sun and Sky-scan observations can be evaluated more robustly across multiple observational scales, providing improved insight into the factors governing satellite–ground consistency in tropical environments.
In this study, we present a comprehensive evaluation of Pandora HCHO observations across Southeast Asia, explicitly distinguishing between direct-sun and sky-scan retrievals and assessing their consistency with multiple satellite products (OMI, TROPOMI, and GEMS). By applying an uncertainty-based quality-control framework and a unified temporal collocation strategy, this work aims to quantify how retrieval geometry, temporal sampling, and spatial representativeness jointly influence satellite–ground agreement in tropical environments.
2.1 Ground-based Pandora formaldehyde observations
This study utilizes formaldehyde (HCHO) measurements from five Pandora spectrometer systems located across Southeast Asia (Fig. 1), a region characterized by a tropical climate and high atmospheric variability. Table 1 summarizes the Pandora monitoring stations used in this study, including its location, altitude, product status, and data availability. While previous validation studies have extensively focused on Pandora stations situated in mid-latitude regions (e.g., North America, Europe, Korea) (Lee et al., 2024; Spinei et al., 2018; Tzortziou et al., 2012), relatively few have addressed stations in low-latitude, equatorial zones. This gap is particularly relevant, as the tropics play a critical role in global atmospheric chemistry, with intense photochemical activity and biomass burning events influencing trace gas distributions.
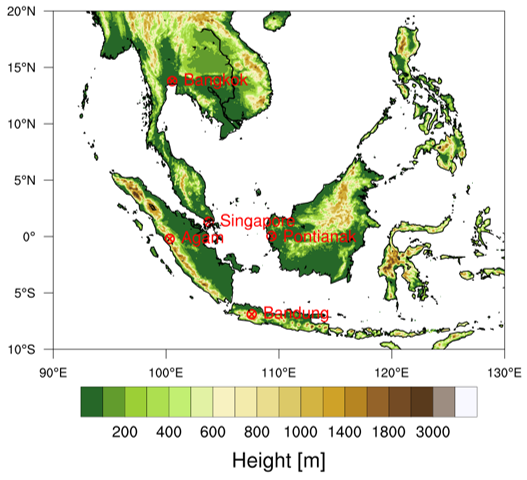
Figure 1Geographic distribution of the Pandora observation sites used in this study, including Bangkok (a), Bandung (b), Agam (c), Pontianak (d), and Singapore-NUS (e). All sites utilize Pandora data version rfus5p1-8 (Direct-sun) and rfuh5p1-8 (Sky-scan).
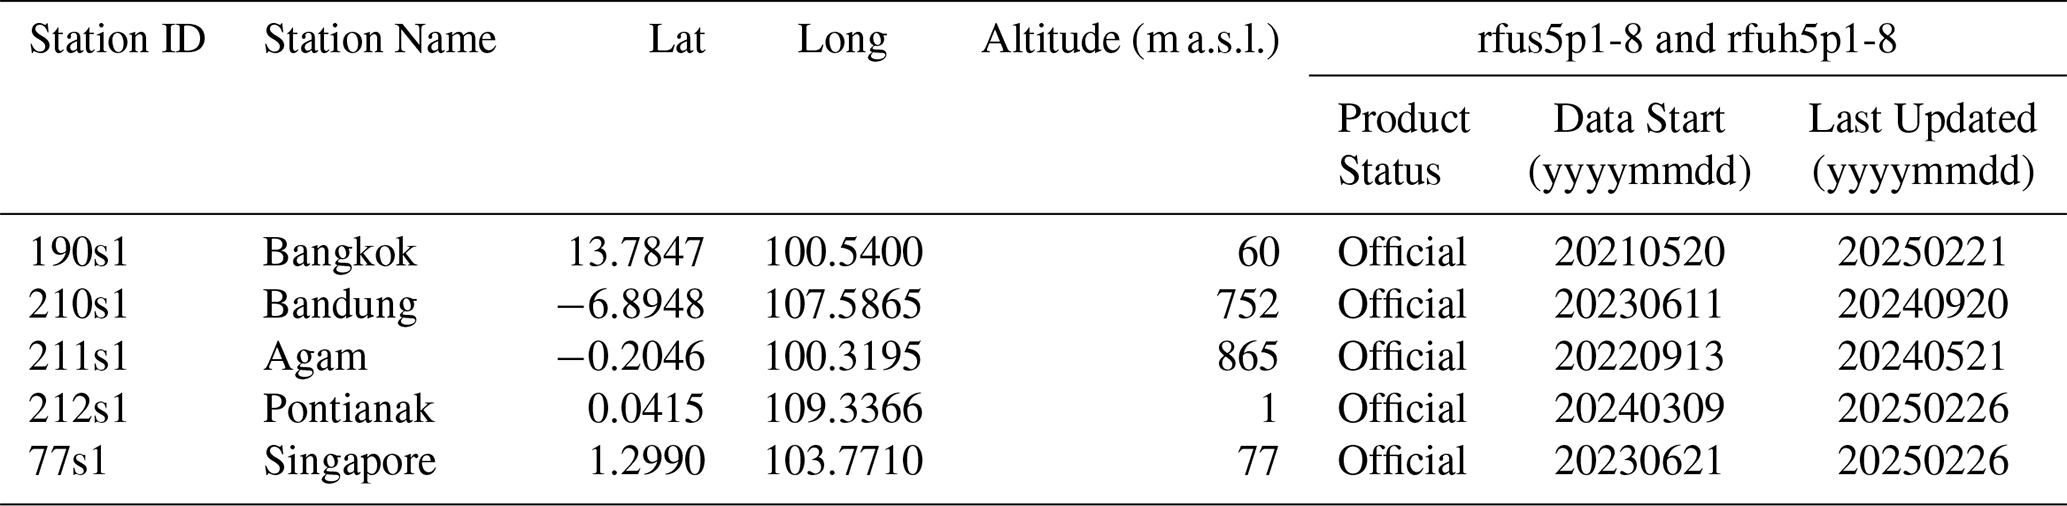
Table 1Summary of Pandora monitoring stations used in this study, including location, altitude, product status, and data availability. Data description: Formaldehyde (HCHO) Level 2, Version: rfus5p1-8 and rfuh5p1-8 (http://data.pandonia-global-network.org, last access: 27 February 2025).
All Pandora instruments analyzed in this study operate using both Direct-sun and Sky-scan viewing geometries, enabling a systematic assessment of geometry-dependent retrieval behavior (Herman et al., 2015). We use Level 2 HCHO products from the rfus5p1-8 and rfuh5p1-8 processing version (http://data.pandonia-global-network.org), which provides HCHO columns derived from direct-Sun and diffuse-sky measurements. Direct-sun (DS) retrievals provide total column HCHO along the solar beam, whereas sky-scan (SS) retrievals represent a tropospheric column derived from multi-angle scattered radiation measurements, with sensitivity that depends on retrieval configuration and atmospheric conditions. The rfus5p1-8 product is selected for its improved numerical stability and reduced noise relative to the rfuh5p1-8 product, which incorporates horizon scans and is more susceptible to variability under heterogeneous cloud and aerosol conditions. The inclusion of both Direct-sun and Sky-scan retrievals allows for a robust evaluation of retrieval performance under varying solar geometries and atmospheric conditions, particularly relevant in tropical environments.
The selected stations include Bangkok (190s1, 13.78° N, 100.54° E, 60 m a.s.l.), an urban megacity with heavy traffic and industrial emissions; Bandung (210s1, −6.89° S, 107.59° E, 752 m a.s.l.), a highland city in Indonesia surrounded by volcanic mountains and agricultural activity; Agam (211s1, −0.20° S, 100.32° E, 865 m a.s.l.), a remote and elevated background site in West Sumatra with limited anthropogenic influence; Pontianak (212s1, 0.04° N, 109.34° E, 1 m a.s.l.), a coastal equatorial station in West Kalimantan, Indonesia, known for frequent cloud cover and convective activity; and Singapore-NUS (77s1, 1.30° N, 103.77° E, 77 m a.s.l.), an urban tropical island site with a dense population and significant marine and urban air interactions. All Pandora instruments used in this study are part of the Pandora Global Network; however, data quality is not assumed a priori and is evaluated using uncertainty-based quality control criteria applied in this work. Collectively, this network offers a valuable opportunity to evaluate satellite HCHO products in complex tropical environments that are typically underrepresented in validation studies.
Uncertainty-based quality control protocol
To improve the robustness of ground-based HCHO observations used for intercomparison and satellite validation, an uncertainty-based quality control (QC) protocol following the methodological framework of Rawat et al. (2025) was applied to contemporaneous Pandora direct-sun (DS) and sky-scan (SS) observations. DS and SS retrievals were first paired within a 5 min tolerance window. A high-quality reference subset was then defined using Pandora quality flags QF = 0 or 10 for both DS and SS retrievals, and dynamic absolute uncertainty thresholds were calculated separately for DS and SS as the mean plus three standard deviations of the uncertainty in this subset. Matched observations were retained when both DS and SS absolute uncertainties were below the dynamic thresholds. In addition, observations exceeding the absolute uncertainty thresholds were retained if both relative uncertainties were ≤ 10 %. Additional filters required WRMS < 0.01 for both DS and SS retrievals and, for sky-scan observations, maximum horizontal distance (MHxD) < 20 km when available. Pandora quality flags were subsequently used to classify observations into high-quality (QF = 0, 10), medium-quality (QF = 1, 11), low-quality (QF = 2, 12), and unusable (QF ≥ 20) categories for diagnostic analysis. This procedure reduces the influence of retrieval noise, poor spectral fits, and unfavorable viewing geometry prior to satellite collocation.
Application of this uncertainty-based QC protocol serves two primary purposes. First, it removes retrievals affected by elevated noise, poor spectral fits, or unfavorable viewing geometry, thereby improving internal consistency between DS and SS datasets. Second, it reduces the impact of retrieval artefacts that may otherwise propagate into satellite validation analyses. In this way, the assured/not-assured classification within the Pandora Global Network does not directly determine data usability for this study. Instead, data quality is evaluated using uncertainty-based criteria, including relative uncertainty, spectral fitting residual (WRMS), and additional screening parameters, ensuring consistent selection of physically reliable observations. Importantly, the QC filtering was applied prior to temporal collocation with satellite observations, ensuring that validation statistics reflect physically meaningful retrieval differences rather than artefacts associated with measurement uncertainty. Although the QC procedure reduces the number of available observations, particularly for sky-scan retrievals under heterogeneous atmospheric conditions, it improves the reliability of ground-based reference data used for satellite validation. This is especially critical in tropical regions, where strong variability in cloud cover, boundary-layer dynamics, and photochemical production can introduce substantial retrieval uncertainty if not appropriately constrained.
2.2 Satellite HCHO retrievals from OMI, TROPOMI and GEMS
The OMI HCHO product (OMHCHO Version 003) provides tropospheric vertical column densities at a nominal nadir spatial resolution of approximately 13 × 24 km2 (Herman et al., 2018; Lamsal et al., 2014). OMI has a fixed local overpass time near 13:30, enabling comparison with ground-based measurements during the early afternoon photochemical period. Station-level OMI HCHO values were extracted from swath pixels within a 10 km radius of each Pandora site. Standard quality screening included cross-track quality flag XtrackQualityFlags = 0, solar zenith angle SZA < 60°, and cloud fraction AMFCloudFraction < 0.3 (Johnson et al., 2024). Although OMI retrievals are limited by pixel-level noise and susceptibility to cloud contamination, their long-term continuity and global coverage provide valuable insight into atmospheric HCHO variability (Harkey et al., 2021), especially in tropical regions where ground-based observations are scarce.
TROPOMI, launched in 2017, provides substantially finer spatial sampling than OMI and improved signal-to-noise performance. For the product version used here, the nominal pixel size is approximately 5.5 × 3.5 km2 (De Smedt et al., 2021). The TROPOMI HCHO product (S5P OFFL HCHO) is derived using a similar DOAS framework but includes updated air-mass factor calculations and surface reflectance treatment (Su et al., 2020). Station-level TROPOMI HCHO values were extracted from pixels within a 10 km radius of each Pandora site. Quality screening followed recommended criteria, including qa_value ≥ 0.5, cloud fraction cloud_fraction_crb < 0.3, and SZA < 60° (De Smedt et al., 2021; Dimitropoulou et al., 2021). TROPOMI can be regarded as the next-generation continuation of the UV–visible trace-gas observing capability established by OMI, providing improved spatial resolution and signal-to-noise performance while maintaining similar measurement principles and orbital sampling. The temporal overlap between OMI and TROPOMI enables consistent long-term validation of satellite HCHO retrievals and facilitates assessment of algorithm evolution across successive instrument generations. The inclusion of both OMI and TROPOMI allows evaluation of retrieval consistency across successive satellite generations. While OMI provides a long-term observational baseline beginning in 2004, TROPOMI extends this record with enhanced spatial resolution and improved sensitivity to sub-pixel variability. The overlap period between the two sensors enables assessment of temporal continuity in satellite HCHO products and supports robust validation of long-term atmospheric composition trends.
Satellite observations from the Geostationary Environment Monitoring Spectrometer (GEMS) onboard the GEO-KOMPSAT-2B platform were additionally used to complement polar-orbiting measurements. GEMS provides hourly hyperspectral observations over East and Southeast Asia, enabling improved characterization of diurnal variability in tropospheric formaldehyde (HCHO) (Lee et al., 2024). In this study, Level-2 HCHO data (GEMS L2 HCHO) from January 2021 to December 2024 were obtained via the National Institute of Environmental Research (NIER) API, with only forward-calculated (FC) retrievals retained to ensure algorithmic consistency and data reliability. Station-level GEMS HCHO values were derived by averaging pixels within a 10 km radius of each Pandora site. Quality control followed conservative filtering criteria, including FinalAlgorithmFlags = 0, cloud radiance fraction < 0.4, and solar zenith angle SZA < 60° (Lee et al., 2024). The inclusion of GEMS provides enhanced temporal sampling relative to polar-orbiting sensors, allowing improved assessment of sub-daily variability and reducing temporal representativeness errors in satellite–ground validation over Southeast Asia.
2.3 Pandora–satellite collocation strategy and validation diagnostics
To evaluate the consistency between ground-based and satellite-derived HCHO columns, filtered Pandora observations were collocated with station-level OMI, TROPOMI and GEMS retrievals using a time-based matching framework designed to account for differences in temporal sampling. The analysis includes observations from OMI, TROPOMI, and GEMS over the period 2021–2024, allowing a more robust and statistically consistent evaluation of satellite–ground agreement across multiple observational platforms. The overall methodology of the study is illustrated in Fig. 2. Two complementary approaches were applied. First, a nearest-time matching method paired each satellite observation with the closest Pandora measurement within a ±2 h tolerance window. Second, an overpass-window averaging method was used, in which all Pandora observations within symmetric windows centered on the satellite overpass time were averaged to form representative ground-based column estimates. Three temporal windows were tested (±30 min, ±1 h, and ±2 h) to assess sensitivity to temporal smoothing. Satellite HCHO columns were calculated by averaging all valid pixels within a 10 km radius of each Pandora site, providing a spatially representative estimate consistent with the effective sampling scale of ground-based observations. For each collocation configuration, mean bias, mean absolute error (MAE), root-mean-square error (RMSE), Pearson correlation coefficient (r), and linear regression parameters were calculated. Time-series and scatter-plot analyses were used to examine temporal consistency and structural agreement across stations and viewing geometries. To further investigate the origin of satellite–ground discrepancies, the relationship between absolute bias and short-timescale Pandora variability was also examined, where Pandora variability was quantified as the range (maximum minus minimum) of Pandora HCHO observations within the nearest-time matching of ±2 h tolerance window.
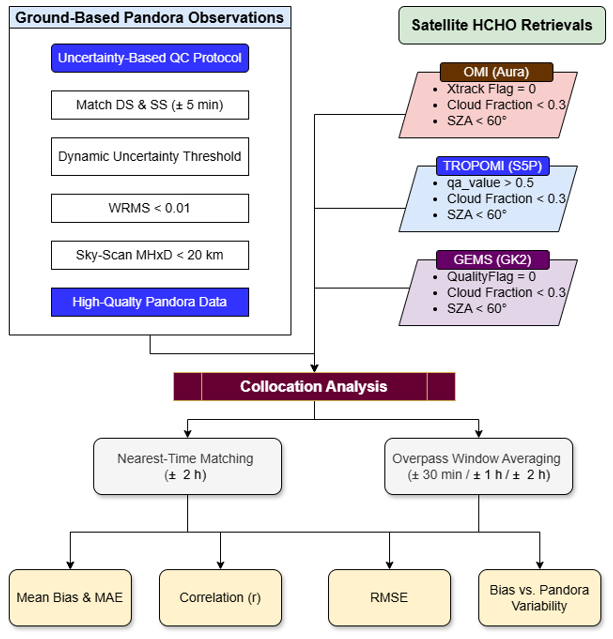
Figure 2Flowchart illustrating the satellite–Pandora HCHO validation framework applied in this study. The methodology includes uncertainty-based quality control of Pandora observations following Rawat et al. (2025), standard quality screening of OMI, TROPOMI and GEMS retrievals, temporal collocation using multiple overpass windows, and statistical evaluation of bias, error metrics, and representativeness effects in tropical environments.
3.1 Impact of uncertainty-based quality control on Pandora HCHO retrievals
The application of the uncertainty-based quality-control (QC) protocol following Rawat et al. (2025) substantially improves the statistical robustness and physical representativeness of Pandora Level-2 HCHO retrievals across the Southeast Asian network. The QC procedure integrates formal quality flags with independent uncertainty metrics, including relative uncertainty (< 10 %), spectral fitting residual (WRMS < 0.01), and spatial representativeness constraints for sky-scan (SS) observations. The filtering primarily targets retrieval artefacts associated with viewing-geometry sensitivity and low signal-to-noise conditions, while preserving the underlying atmospheric variability.
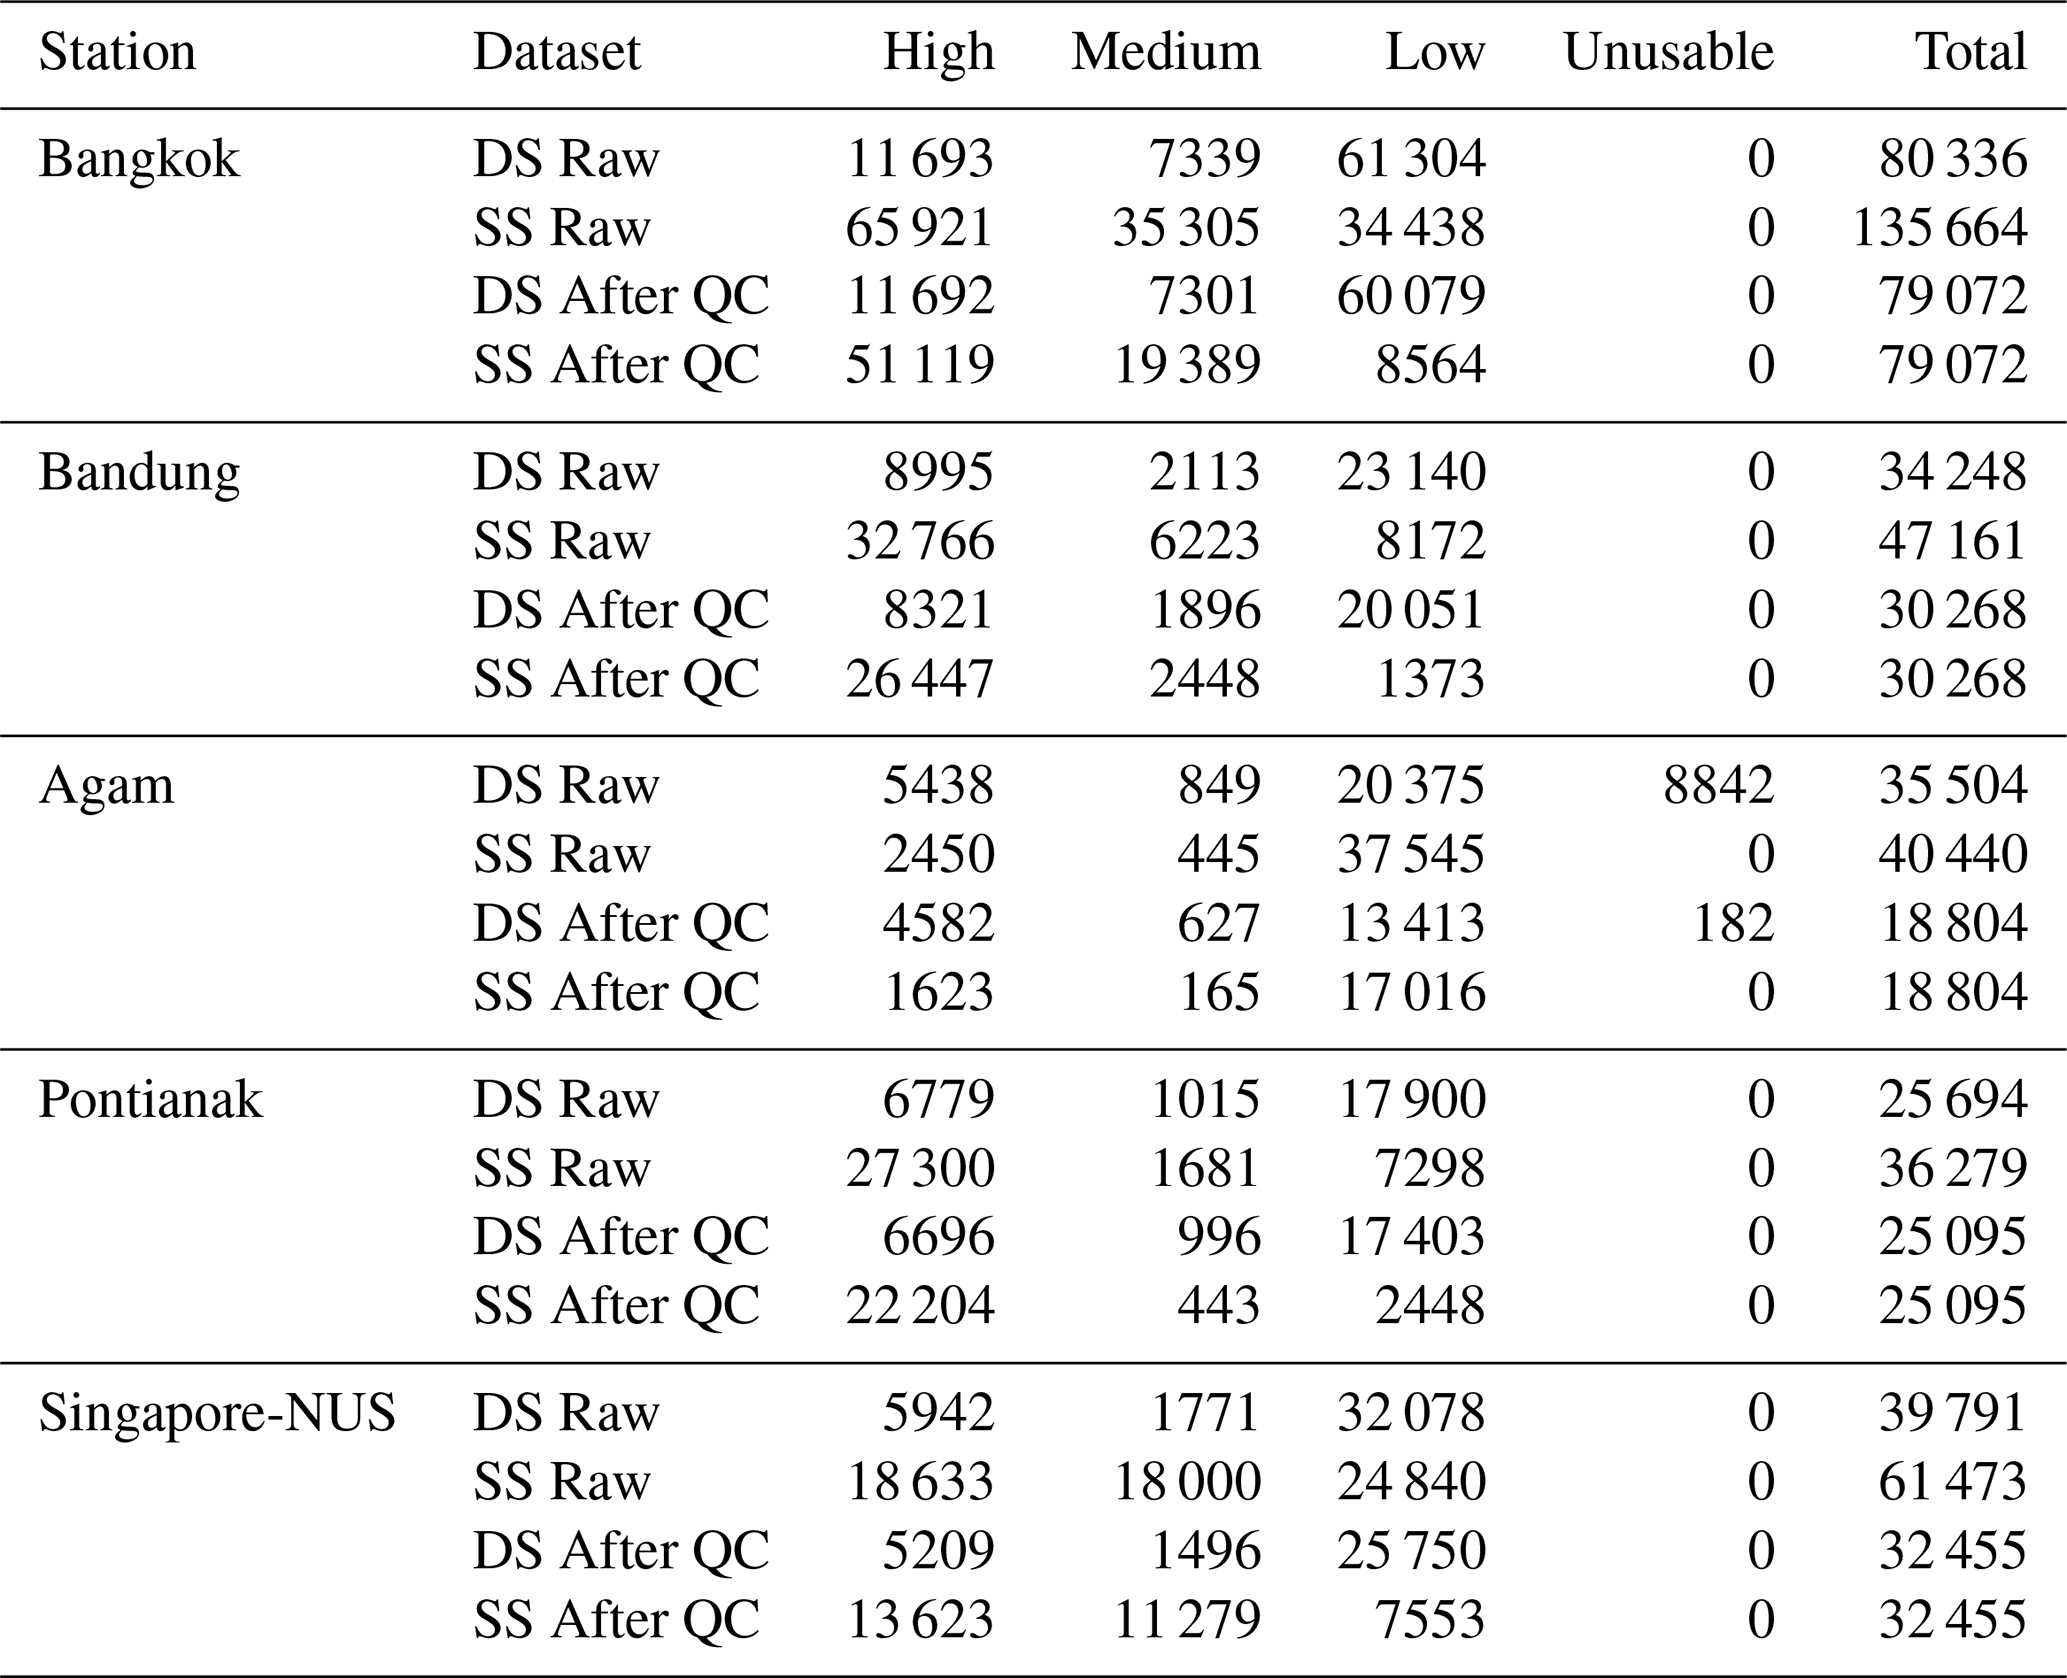
As summarised in Table 2, the QC protocol affects direct-sun (DS) and sky-scan (SS) retrievals differently. DS observations generally exhibit higher intrinsic stability, with only modest reductions in retained measurements at most stations (≤ 3 % at Bangkok and Pontianak). However, more substantial reductions are observed at Bandung (11.6 %) and Singapore-NUS (18.4 %), indicating that DS retrieval quality is also influenced by local atmospheric conditions and instrumental geometry. In contrast, SS retrievals show a pronounced sensitivity to QC filtering, with reductions of 31 %–53 % across the network. This strong filtering impact reflects the increased susceptibility of multi-angle observations to retrieval noise, aerosol-induced radiative transfer effects, and horizontal heterogeneity in tropical environments. The most striking response to QC filtering occurs at Agam, where the number of matched DS–SS observation pairs decreases by nearly half. The large fraction of rejected measurements highlights the presence of significant retrieval artefacts in the raw dataset, likely associated with low HCHO signal levels, strong humidity-dependent scattering, and complex biogenic emission variability characteristic of tropical rainforest environments at the Agam station. The substantial reduction in unusable DS retrievals at Agam further demonstrates the importance of uncertainty-based filtering for ensuring dataset reliability in low-signal regimes. The application of uncertainty-based QC substantially reduces extreme outliers, particularly at sites such as Agam, where high-uncertainty retrievals can otherwise produce unrealistically large column values.
Table 2Summary of Pandora Level-2 formaldehyde (HCHO) observations from Direct-sun (DS) and Sky-scan (SS) retrievals at selected Southeast Asian stations. Data are categorized by quality flags into High (0,10), Medium (1,11), Low (2,12), and Unusable (≥ 20). The Rawat quality control (QC) protocol was applied to filter observations based on independent uncertainty thresholds, relative uncertainty (< 10 %), WRMS (<0.01), and maximum horizontal distance (MHxD < 20 km for SS). Totals represent the number of valid matched DS–SS observation pairs used in the analysis.
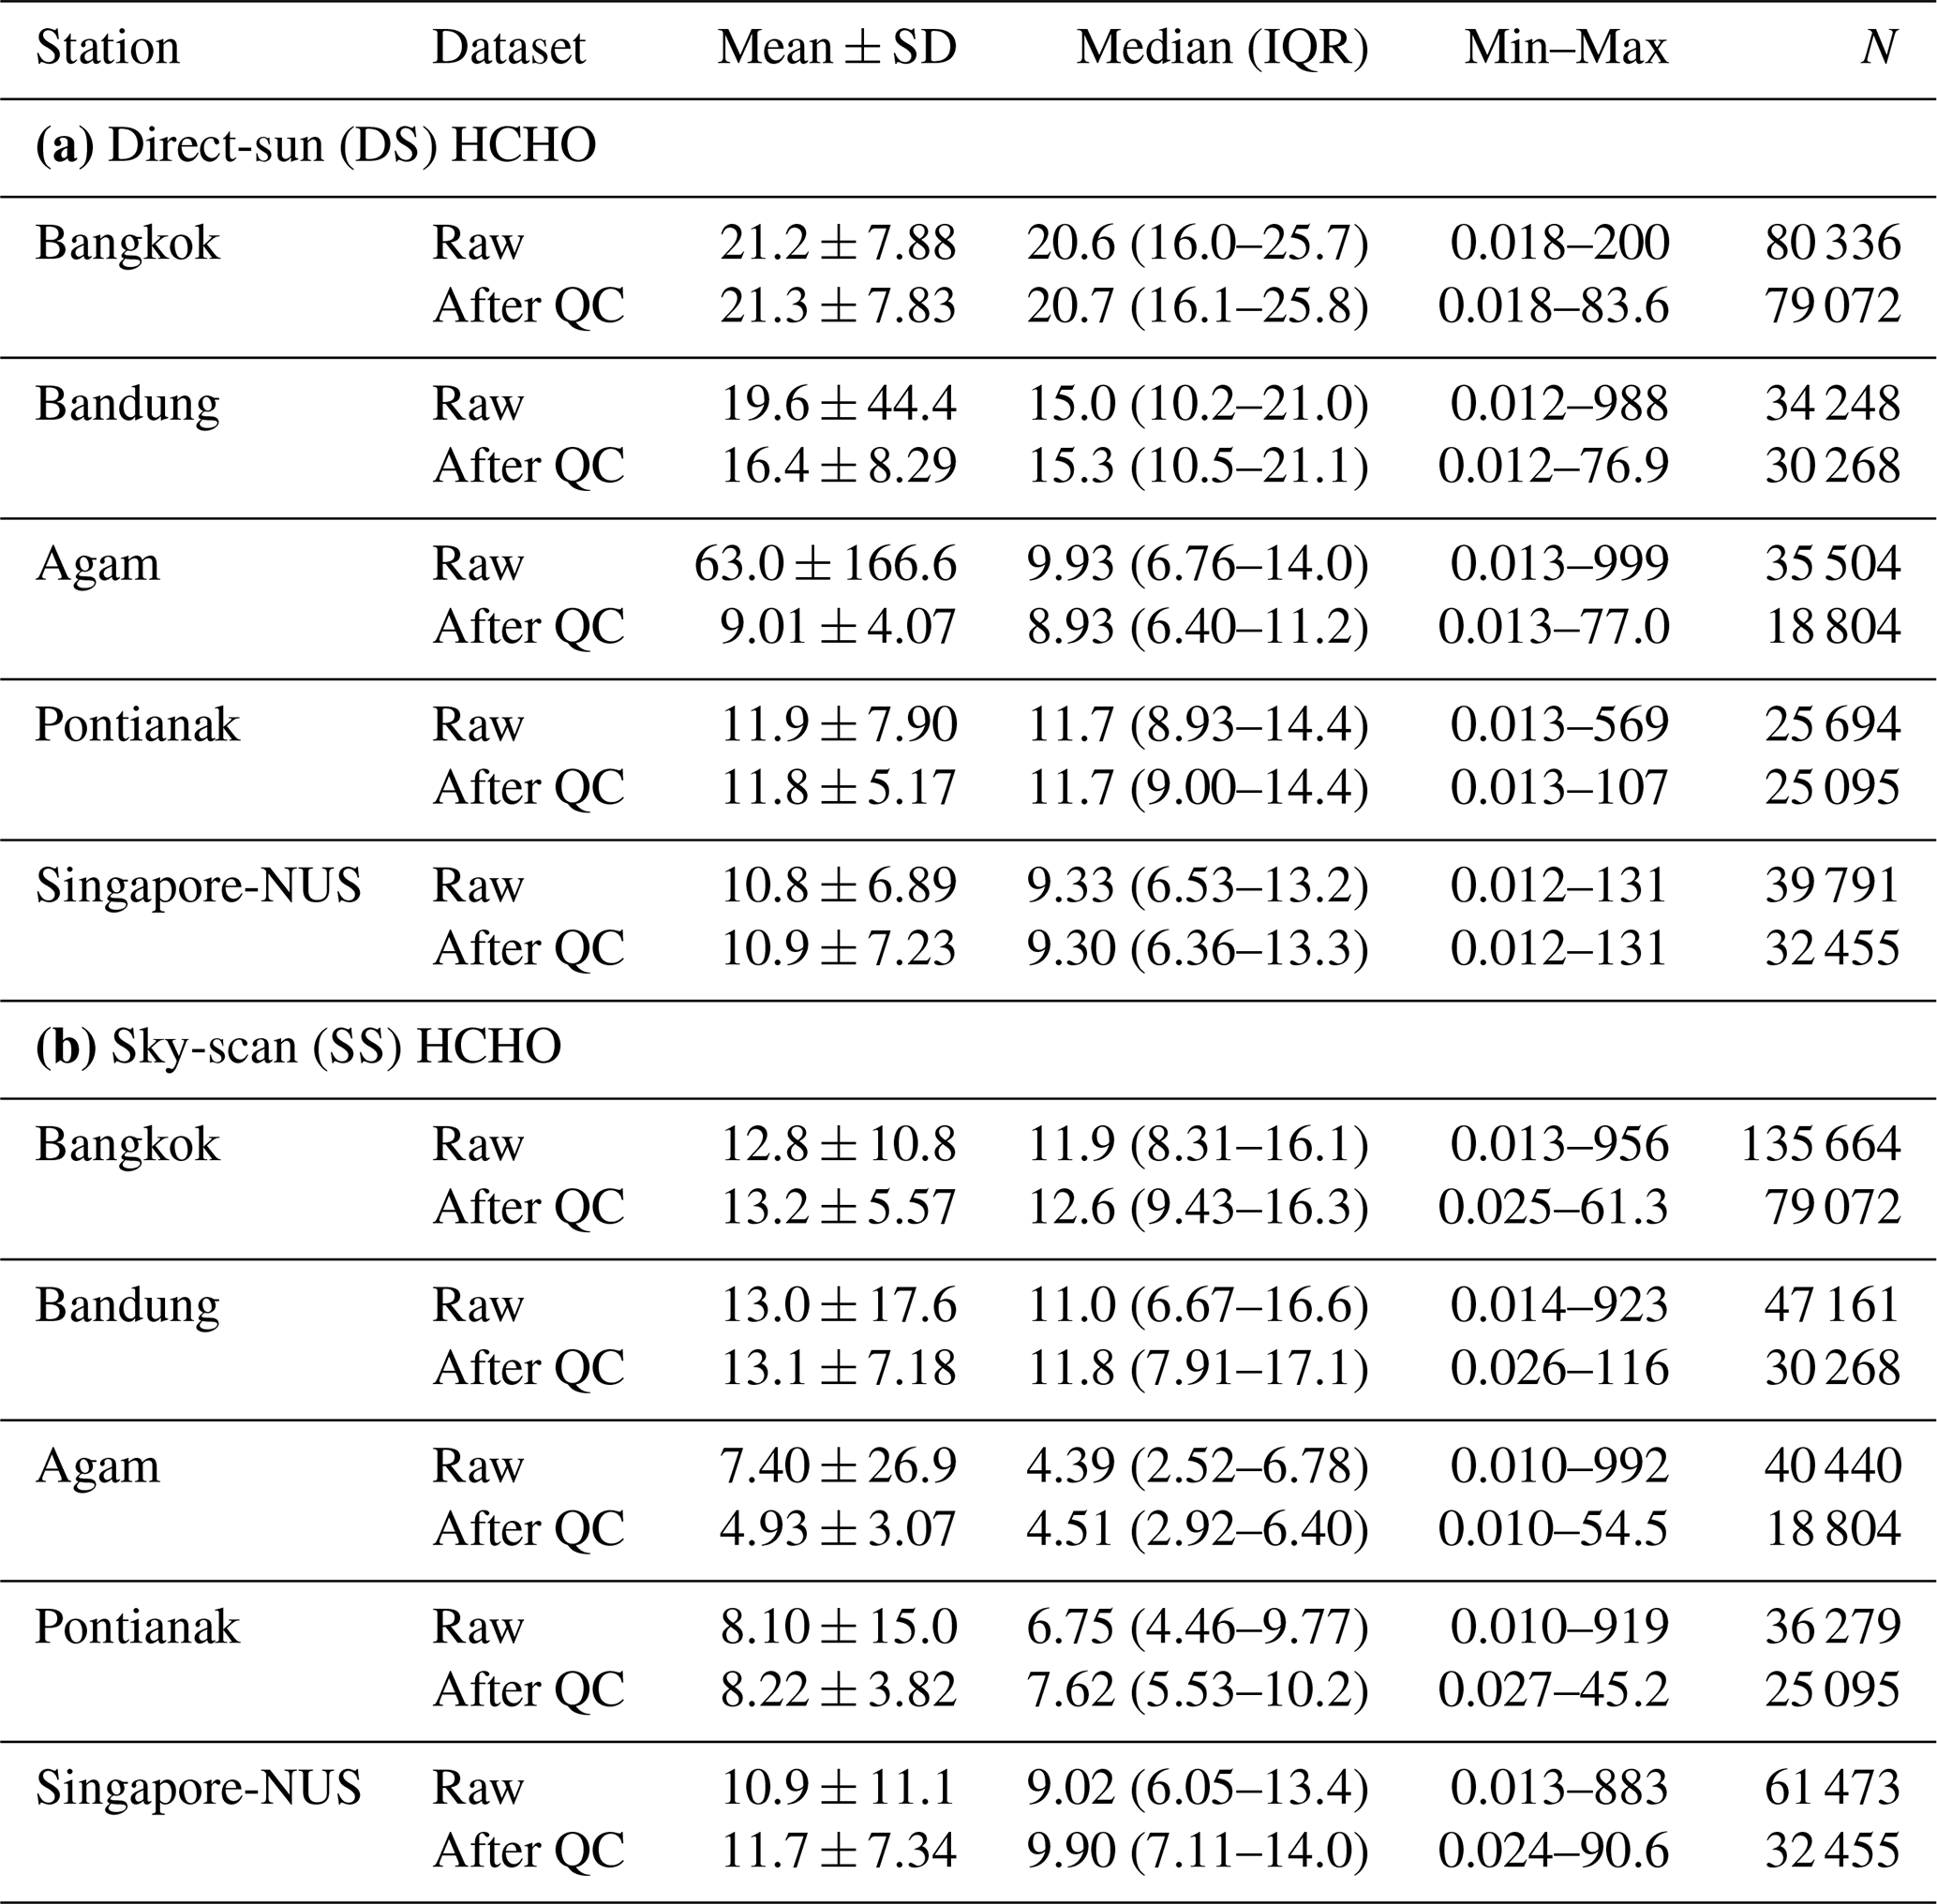
The statistical distributions of HCHO columns before and after QC filtering (Table 3) confirm that the protocol primarily removes extreme outliers while preserving the central tendency of the observations. At most stations, mean and median HCHO values remain nearly unchanged following QC application, indicating that the filtering does not introduce systematic bias. For example, Bangkok DS observations exhibit identical mean values before and after QC (21.3 × 10¹⁵ molec. cm−2), while the maximum column value decreases substantially from 200 to 83.6 × 10¹⁵ molec. cm−2. Similar behaviour is observed at Bandung and Pontianak, where reductions in standard deviation and maximum values reflect improved statistical homogeneity without altering the underlying distribution shape. Agam again exhibits the strongest correction, with the DS mean decreasing from 54.5 to 9.01 × 10¹⁵ molec. cm−2 after QC filtering. The large discrepancy between mean and median in the raw dataset indicates a highly skewed distribution dominated by retrieval artefacts. Following QC application, the mean and median converge, and the variability is substantially reduced, demonstrating that the filtering effectively restores a physically plausible statistical distribution. A comparable stabilisation is observed in SS retrievals at Agam, where both the variance and upper range of HCHO columns are markedly reduced. Overall, the uncertainty-based QC protocol enhances the internal consistency of Pandora HCHO datasets by selectively removing retrieval artefacts associated with geometric sensitivity and low signal conditions. The resulting datasets exhibit improved statistical homogeneity while retaining the essential atmospheric variability required for subsequent analyses of retrieval geometry effects and satellite validation.
Table 3Descriptive statistics of Pandora Level-2 formaldehyde (HCHO) retrieved from Direct-sun (DS) and Sky-scan (SS) observations at selected Southeast Asian stations. Statistics are shown for contemporaneous matched DS–SS pairs before and after applying the Rawat quality control (QC) protocol. Values are reported as mean ± standard deviation (SD), median with interquartile range (IQR; Q1–Q3), and minimum–maximum. All HCHO columns are expressed in units of × 105 molec. cm−2.
3.2 Consistency between direct-sun and sky-scan HCHO retrievals after quality control
The nine-panel correlation analyses (Fig. 3) reveal that DS–SS agreement depends strongly on retrieval quality category, with the highest correlations observed when both measurements fall within the high-quality regime (QF = 0, 10). Across all stations, high-quality DS–SS pairs exhibit correlation coefficients typically exceeding 0.70, indicating strong agreement between retrieval geometries under well-constrained uncertainty conditions. Bangkok demonstrates the most robust behaviour, with correlations reaching approximately r ≈ 0.78 in the high-quality category. Similar consistency is observed at Singapore-NUS and Pontianak, despite differences in observational sampling and atmospheric conditions. These results confirm that, once uncertainty-related artefacts are removed, DS and SS retrievals provide comparable representations of columnar HCHO. The time-series analysis (Fig. 4) indicates that QC filtering preferentially removes extreme positive outliers, particularly in SS retrievals, resulting in substantially lower retention rates (∼ 46 %–64 %) compared to DS measurements (∼ 82 %–98 %). This behaviour is most evident at Agam and Bandung, where clusters of anomalously high HCHO columns (> 1018 molec. cm−2) are largely eliminated after QC, consistent with their pronounced reduction in retained observations. In contrast, the consistently high retention of DS retrievals across all stations reflects their greater intrinsic stability and lower susceptibility to retrieval artefacts.
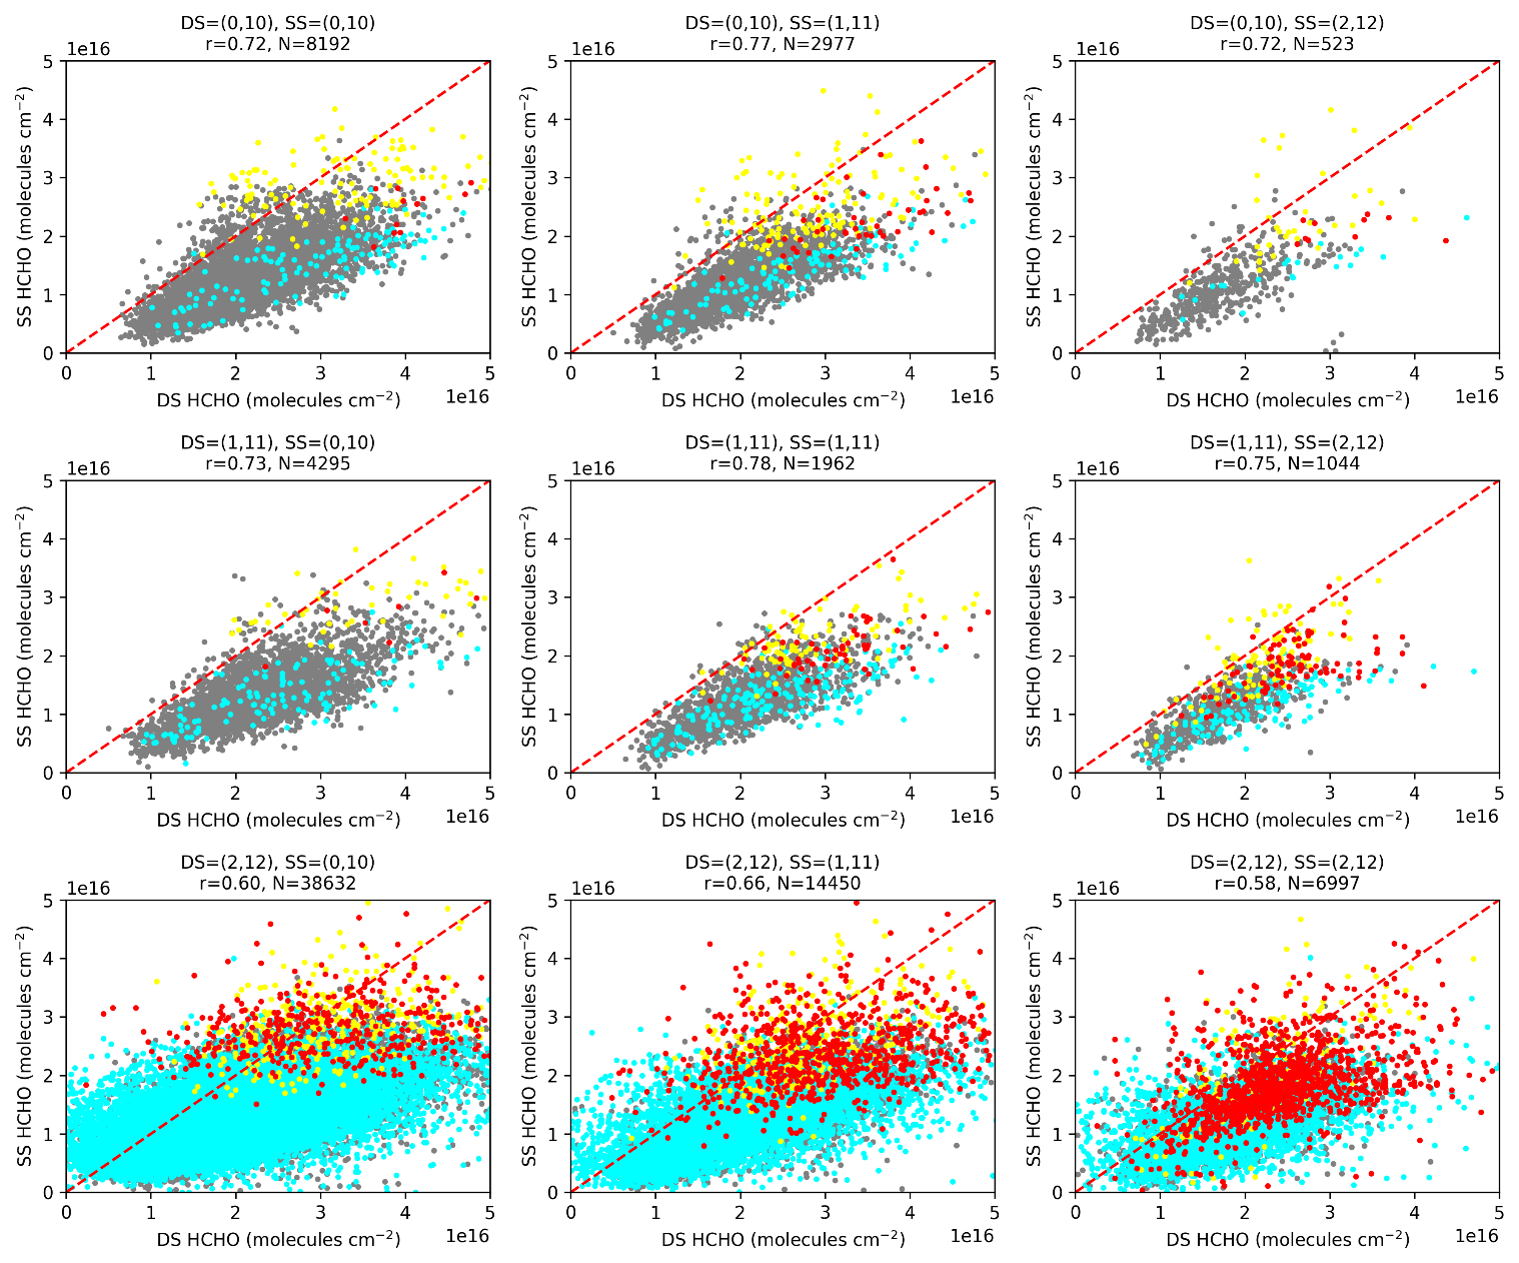
Figure 3Nine-panel plot of correlation between contemporaneous Pandora HCHO column amounts: direct-sun (DS) vs. sky-scan (SS) for each quality category, following the Rawat et al. (2025, AMT) QC method at Bangkok station. Panels are organized according to grouped Pandora quality-flag (QF) categories: high-quality [QF = (0,10)], medium-quality [QF = (1,11)], and low-quality [QF = (2,12)] retrievals for both DS and SS observations. Each panel shows the scatter of DS vs. SS HCHO (molec. cm−2), with points color-coded by uncertainty thresholds: gray = both below cutoff, cyan = DS above cutoff, yellow = SS above cutoff, red = both above cutoff. The red dashed line represents the 1:1 relationship, and the correlation coefficient (r) and number of matched observations (N) are indicated in each panel. Corresponding nine-panel correlation analysis for the other stations are provided in Figs. S1–S4 in the Supplement.
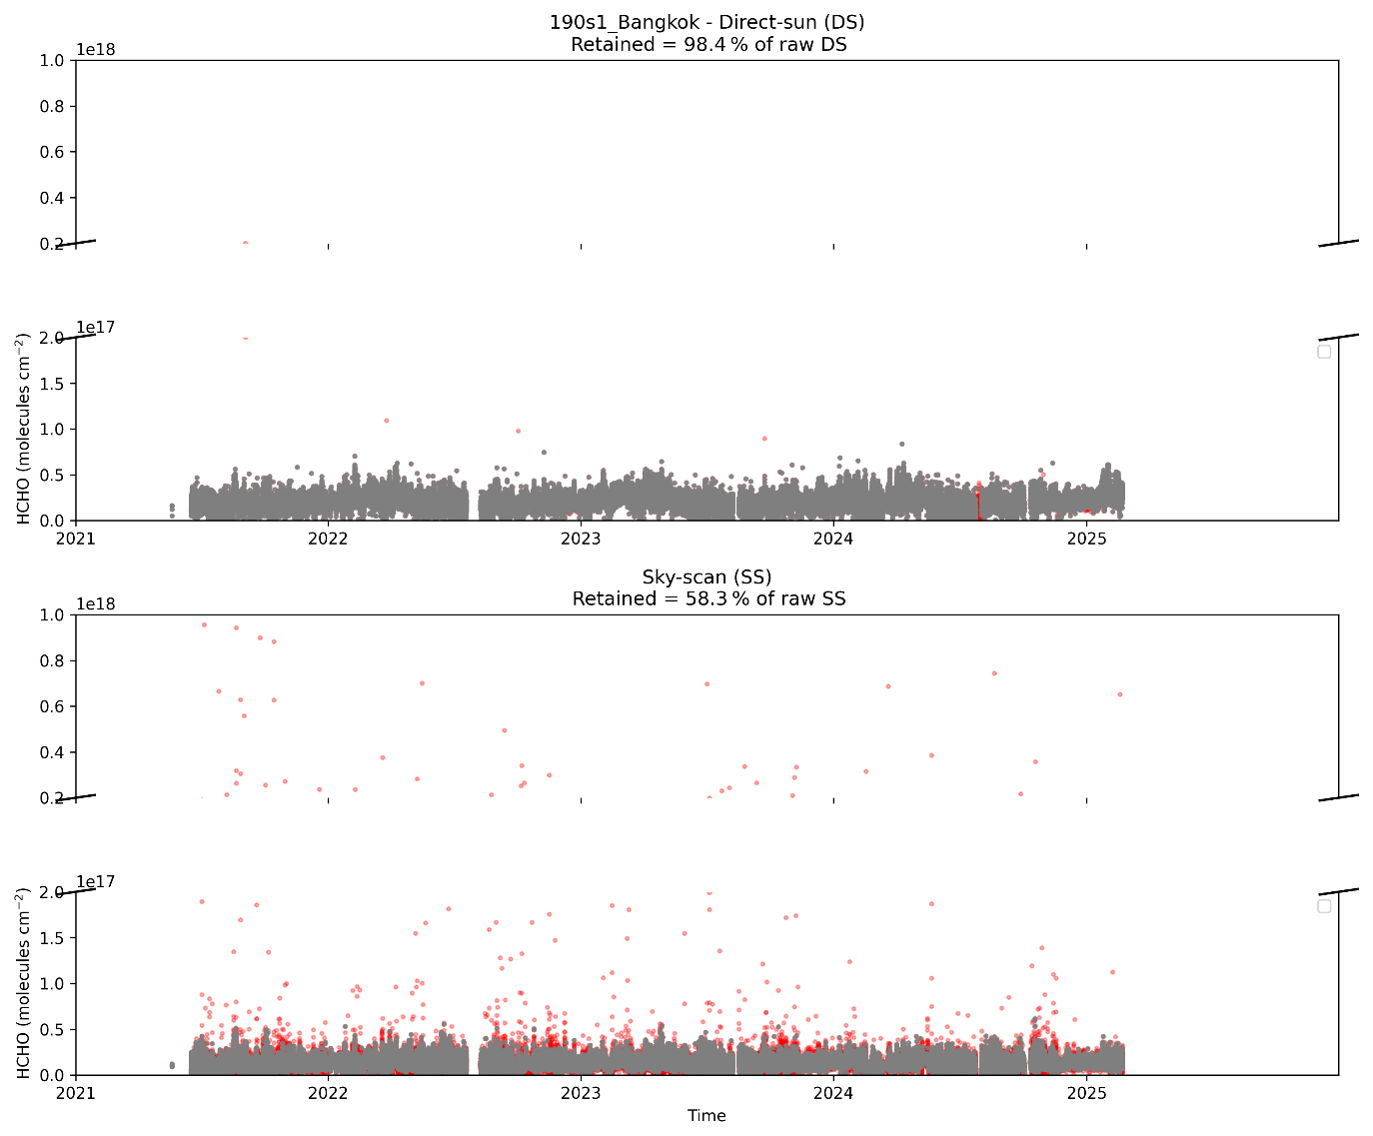
Figure 4Time series of Pandora HCHO column amounts for direct-sun (DS) and sky-scan (SS) measurements following the Rawat et al. (2025, AMT) QC method at the Pandora Bangkok station. The upper panels show DS HCHO, and the lower panels show SS HCHO. Removed data points failing quality control (QC) are highlighted in red, while retained measurements are shown in gray. Broken y axes are used to display both low and high concentration ranges. The percentage of removed points due to QC is indicated in the DS panel titles. Corresponding time series for the other stations are provided in Figs. S5–S8.
In contrast, DS–SS correlations decrease progressively as retrieval quality deteriorates. When one or both observations fall into the medium- or low-quality categories (QF = 1–2), increased scatter and reduced correlation coefficients are observed, particularly at Agam and Bandung. At Agam, correlations in the low-quality regime fall below 0.40, reflecting the influence of residual retrieval noise even after QC filtering. Bandung exhibits moderate correlations in mixed-quality regimes, suggesting that atmospheric variability remains partially captured despite increased retrieval uncertainty. The spatial variability in DS–SS consistency corresponds closely to the statistical behaviour of the datasets described in Sect. 3.1. Stations with stable statistical distributions before and after QC filtering, such as Bangkok and Singapore-NUS, exhibit consistently high DS–SS correlations. In contrast, stations with substantial reductions in variability following QC, particularly Agam, show more pronounced differences in correlation behaviour across quality categories. This relationship highlights the role of site-specific atmospheric conditions and observational geometry in determining retrieval performance.
The colour-coded uncertainty thresholds in the scatter plots further illustrate the impact of retrieval precision on DS–SS agreement. Observations in which both DS and SS retrievals fall below the uncertainty threshold cluster near the 1:1 relationship, confirming that the QC protocol successfully isolates physically consistent measurements. Points exceeding uncertainty thresholds contribute disproportionately to scatter in lower-quality regimes, emphasizing the importance of combining formal quality flags with independent uncertainty metrics. Taken together, these results demonstrate that retrieval quality exerts a stronger influence on DS–SS consistency than viewing geometry itself. Differences between DS and SS retrievals arise primarily from sampling characteristics rather than systematic bias, with DS observations showing greater short-timescale variability and SS retrievals providing more spatially integrated column estimates. The larger variability observed in DS retrievals and the smoother behaviour of SS observations is consistent with differences in sampling geometry and sensitivity to localized atmospheric variability, rather than systematic differences in vertical sensitivity. High-quality observations yield robust agreement across all stations, while lower-quality measurements introduce increased variability and reduced correlation. The application of uncertainty-based QC therefore represents a critical step in ensuring the reliability of Pandora HCHO datasets for atmospheric analysis and satellite validation.
3.3 Distributional characteristics and quality-flag behaviour of Pandora HCHO retrievals
The statistical structure of Pandora HCHO retrievals after uncertainty-based quality control can be further examined through the distribution of quality flags (Fig. 5) and the corresponding frequency distributions of filtered column values (Fig. 6). The quality flag (QF) distributions reveal a clear contrast between DS and SS retrieval characteristics across all stations. Prior to QC, DS observations are already dominated by low-quality flags but retain a consistent fraction of high-quality retrievals (∼ 15 %–30 %) across sites. After QC, the DS datasets exhibit only modest changes, with a slight increase in the proportion of high-quality observations, confirming the relatively stable and well-constrained nature of direct-sun retrievals. In contrast, SS observations show a much stronger response to QC filtering. The proportion of high-quality SS retrievals increases substantially at most stations (e.g. from ∼ 30 %–50 % to ∼ 65 %–90 % at Singapore, Bangkok, Bandung, and Pontianak), while low-quality contributions are sharply reduced. Agam remains an exception, where low-quality SS observations continue to dominate even after QC, indicating persistent retrieval challenges; additionally, the total percentage does not sum to 100 % due to the presence of unusable QF categories that are excluded from the plotted distributions.
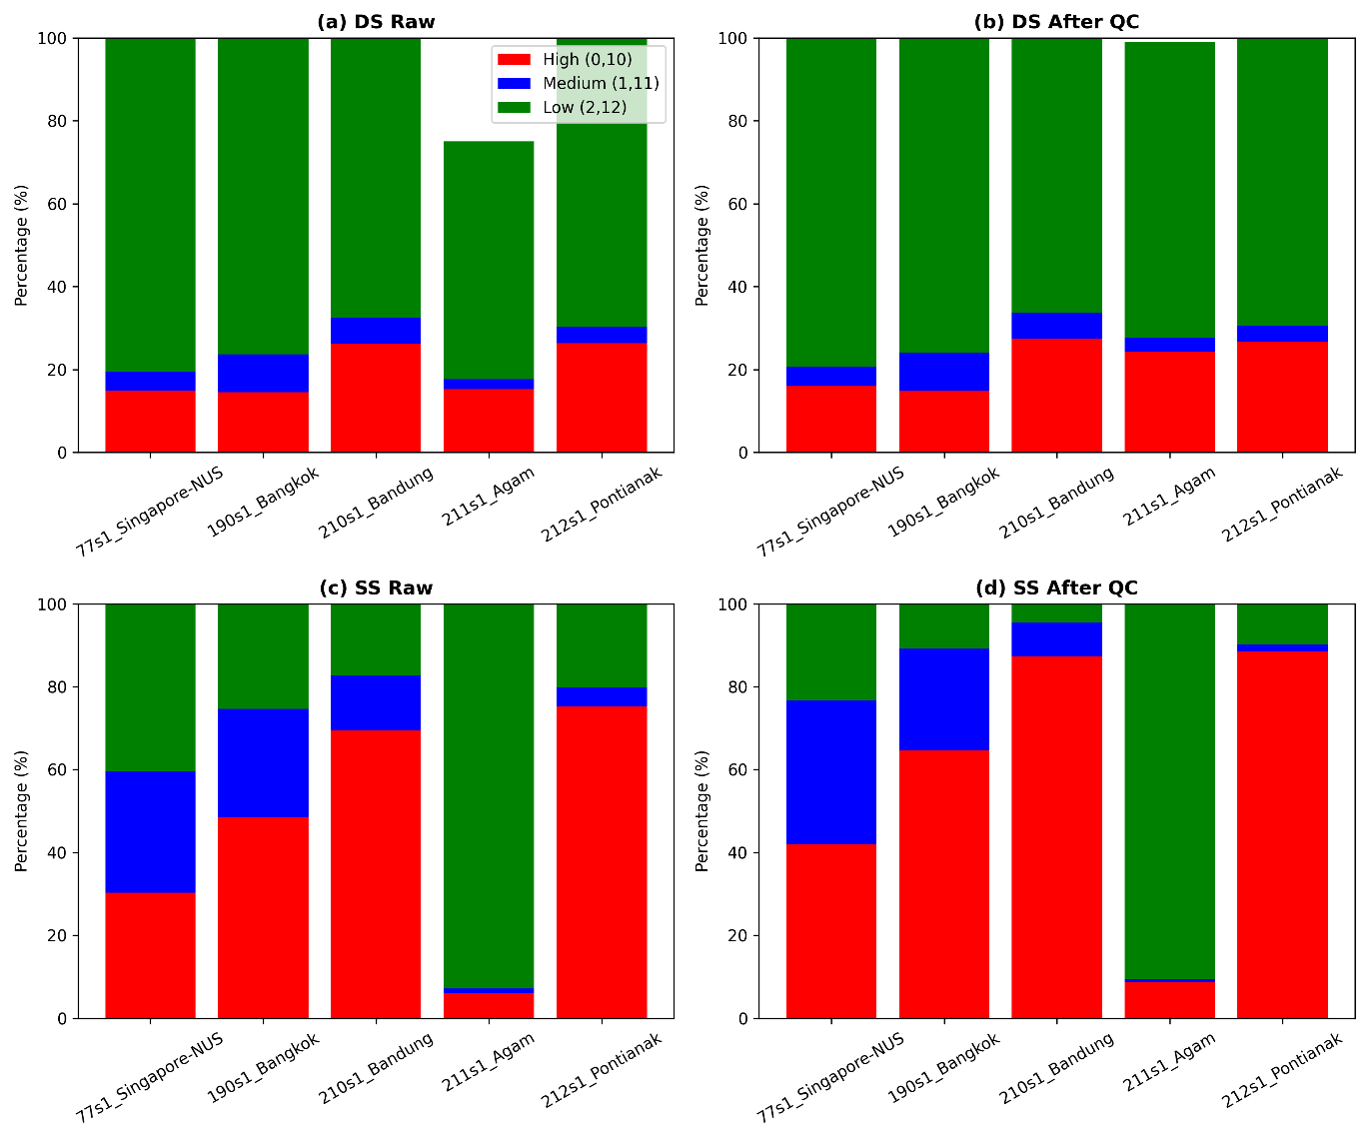
Figure 5Percentage distribution of quality flags (QF) for Pandora HCHO observations at five Southeast Asian stations (Singapore, Bangkok, Bandung, Agam, and Pontianak). The stacked bar charts show the relative contributions of high-quality (QF = 0, 10), medium-quality (QF = 1, 11), and low-quality (QF = 2, 12) retrievals for both direct-sun (DS) and sky-scan (SS) measurements, before and after quality control (QC). Each panel represents a different dataset: (a) DS before QC, (b) DS after QC, (c) SS before QC, and (d) SS after QC. Percentages are calculated relative to the total number of observations for each station. Although all observations shown after QC satisfy the uncertainty-based filtering criteria and are considered usable for analysis, the retained QF categories are presented to illustrate the composition and retrieval characteristics of the filtered datasets across different stations and viewing geometries.
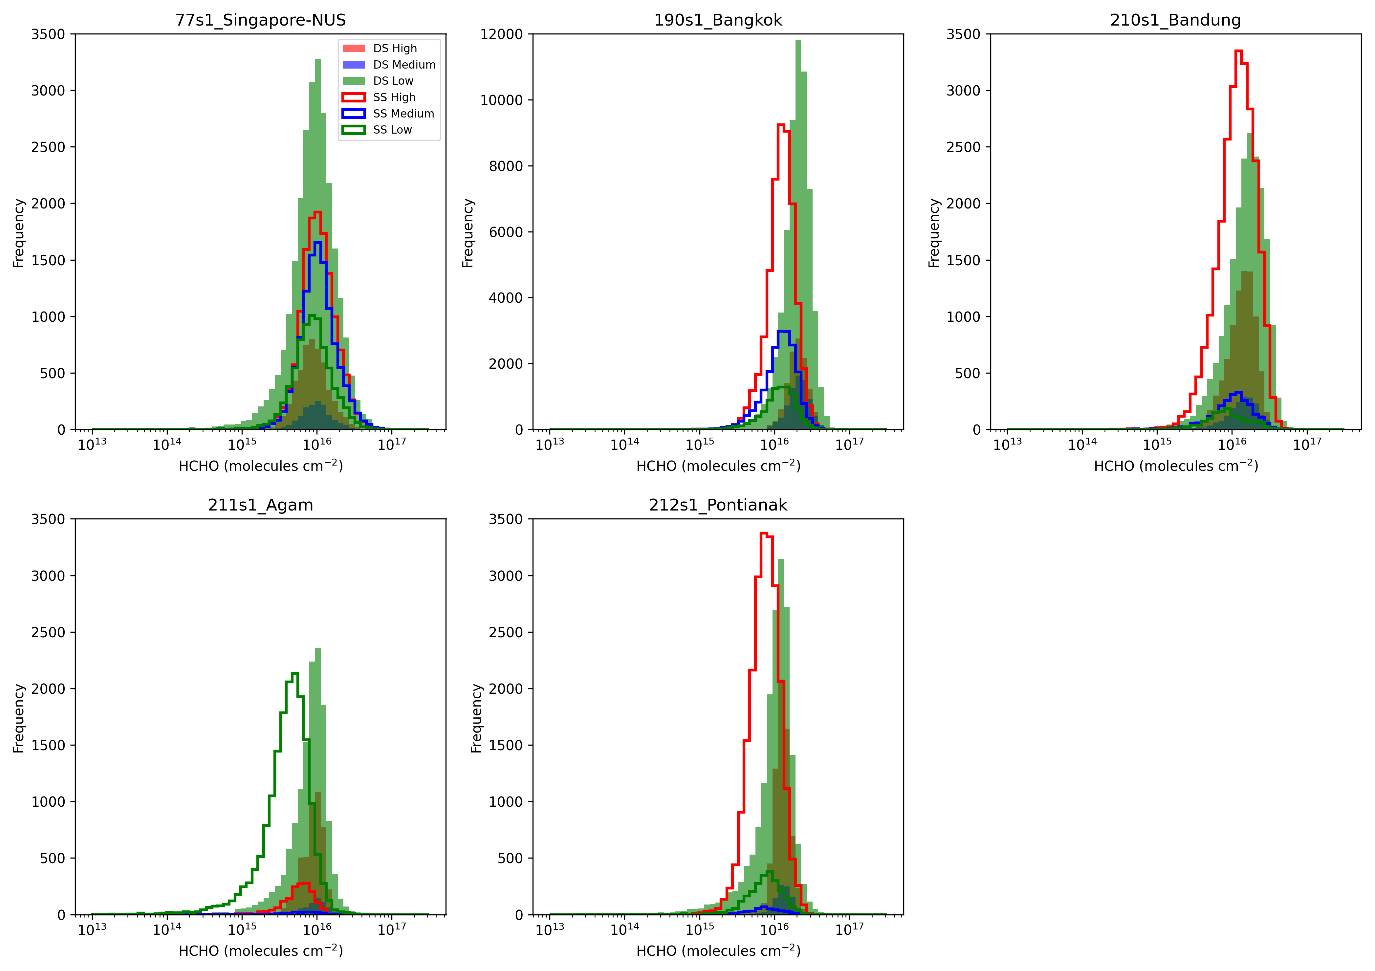
Figure 6Frequency distributions of filtered HCHO vertical column densities (molec. cm−2) for direct-sun (DS; shaded histograms) and sky-scan (SS; solid line histograms) observations across five stations. Each panel corresponds to a station, with HCHO data grouped by quality flag: high quality (red; QF = 0, 10), medium quality (blue; QF = 1, 11), and low quality (green; QF = 2, 12). The x axis is shown on a logarithmic scale to capture the wide dynamic range of HCHO values. The y axis represents the frequency of observations, with consistent limits applied across stations except for Bangkok, which has a higher observation count.
The frequency distributions highlight important station-dependent differences in DS–SS consistency. At the Pandora Singapore-NUS station, DS and SS distributions largely overlap across all QF categories, indicating strong consistency between retrieval geometries irrespective of quality classification. However, this behaviour is not observed at the other stations. At Bangkok, Bandung, Pontianak, and Agam, SS retrievals are systematically skewed towards lower HCHO values compared to DS, particularly in the medium- and low-quality regimes. This systematic shift suggests a geometry-dependent bias, where SS measurements tend to underestimate column HCHO relative to DS under less favourable retrieval conditions. Such discrepancies are reduced in the high-quality category but remain evident overall, highlighting the importance of quality filtering when combining DS and SS observations for quantitative analysis.
3.4 Impact of temporal collocation and sub-pixel variability on OMI and TROPOMI validation
The time-series comparisons (Figs. 7 and 10) demonstrate that both OMI and TROPOMI broadly capture the temporal variability of Pandora HCHO across all stations; however, clear differences in data coverage and consistency are evident. OMI collocations are relatively sparse and irregular, particularly at Agam and Bandung, whereas TROPOMI provides substantially denser and more continuous sampling due to its higher spatial resolution and wider swath. This improved sampling enhances the ability of TROPOMI to represent short-timescale variability observed by Pandora, especially in regions with strong local emission variability. The scatter plot analyses (Figs. 8 and 11) further highlight the systematic performance differences between the two satellite products. OMI exhibits generally weak correlations with Pandora (r typically < 0.4, and in some cases near zero or negative), with large scatter and consistent underestimation relative to the 1:1 line. In contrast, TROPOMI shows markedly improved agreement across all stations, with higher correlation coefficients (commonly r ≈ 0.3–0.5 and up to ∼ 0.46 at Singapore) and reduced spread. The improvement is particularly evident at urban-influenced sites such as Bangkok and Singapore, where TROPOMI more effectively captures variability in HCHO columns.
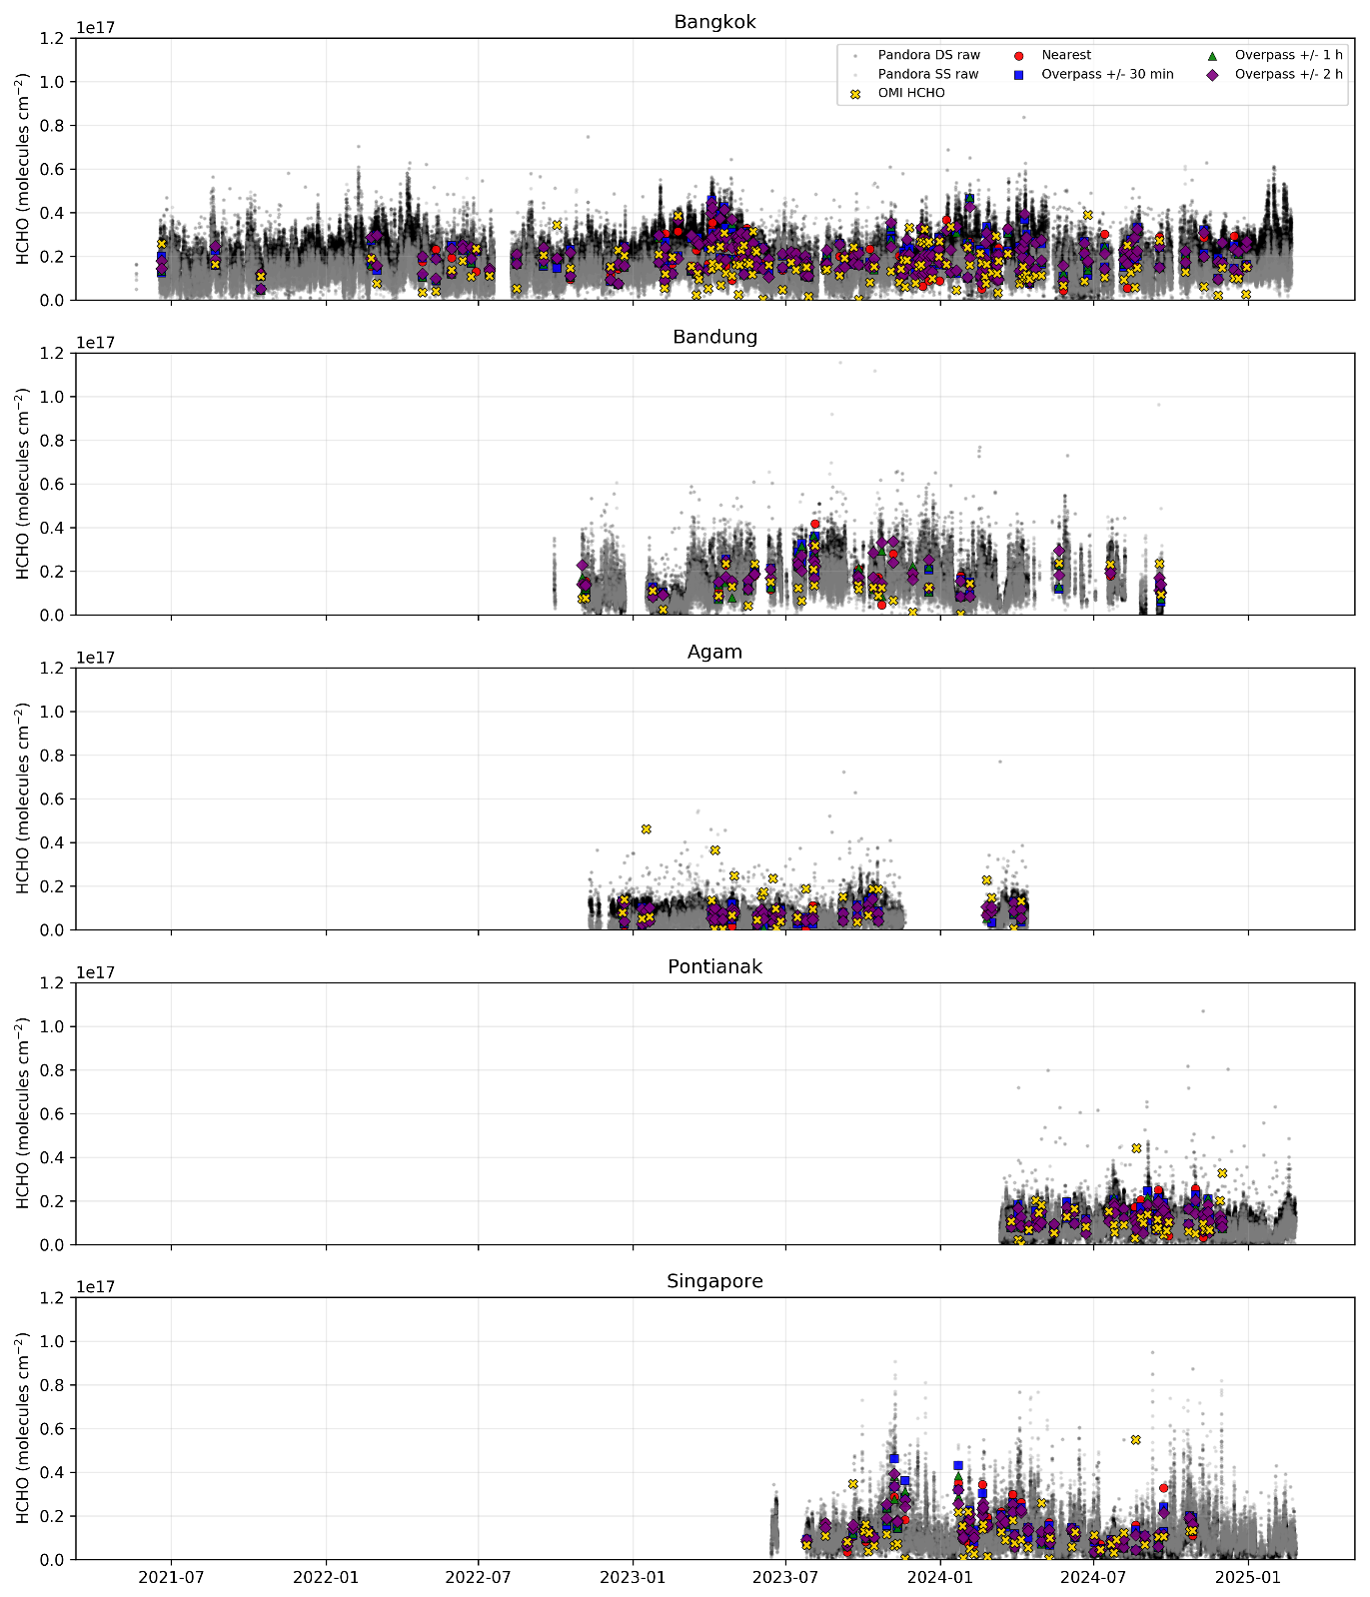
Figure 7Time series of Pandora HCHO column measurements (DS and SS) and temporally collocated OMI observations at five Southeast Asian stations. OMI-Pandora data are shown for four collocation approaches: nearest-time matching and overpass-centred averaging windows of ±30 min, ±1 h, and ±2 h.
The impact of temporal collocation strategy differs markedly between OMI and TROPOMI. For OMI (Fig. 8), expanding the collocation window from nearest to ±2 h results in only marginal changes in correlation and error metrics, indicating limited sensitivity to temporal averaging. For instance, at Bangkok, correlation remains nearly unchanged (r = 0.11–0.12), while RMSE (∼ 1.13–1.16 × 10¹⁶ molec. cm−2) and MAE (∼ 9.0–9.9 × 10¹⁵ molec. cm−2) show minimal improvement. In contrast, TROPOMI (Fig. 11) demonstrates clearer benefits from temporal averaging. At Bangkok, the correlation increases from r = 0.23 (nearest) to r = 0.32 (±2 h), accompanied by a reduction in RMSE from 9.35 × 10¹⁵ to 8.80 × 10¹⁵ molec. cm−2 and a decrease in MAE from 7.47 × 10¹⁵ to 7.07 × 10¹⁵ molec. cm−2. A similar but more subtle improvement is observed at Singapore, where the correlation remains consistently high (r ≈ 0.46–0.47), while RMSE decreases from 8.34 × 10¹⁵ to 6.47 × 10¹⁵ molec. cm−2 and MAE from 5.42 × 10¹⁵ to 4.81 × 10¹⁵ molec. cm−2 when applying a ±2 h window. These results indicate that TROPOMI retrievals benefit from temporal averaging while maintaining strong correlation, reflecting improved representation of short-timescale variability compared to OMI.
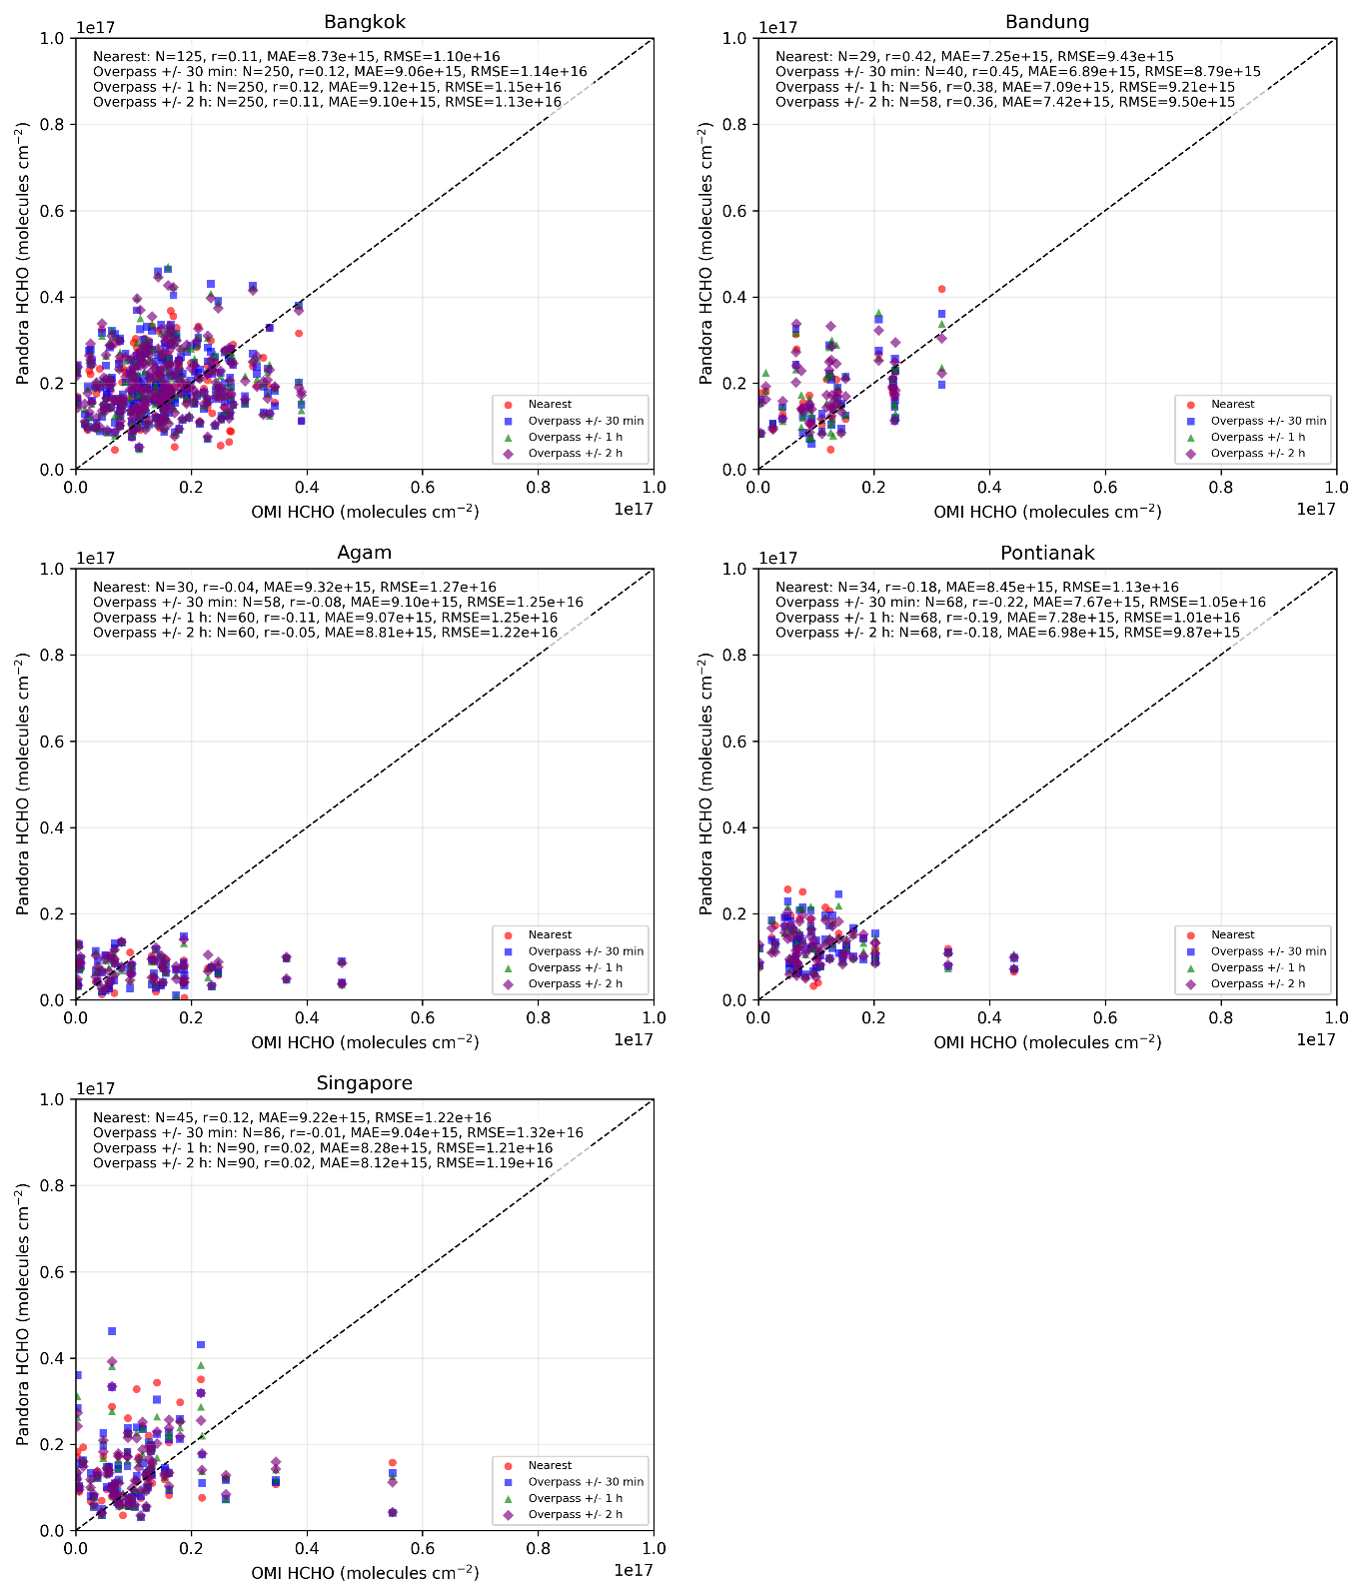
Figure 8Scatter plots comparing Pandora and OMI HCHO column retrievals for different temporal collocation strategies. Each panel corresponds to a measurement station and includes the 1:1 reference line. Reported statistics include sample size (N), mean absolute error (MAE), root-mean-square error (RMSE), and Pearson correlation coefficient (r).
The bias–variability relationships (Figs. 9 and 12) further highlight fundamental differences in retrieval behaviour. For OMI, correlations between Pandora sub-daily variability and absolute bias are generally weak or inconsistent (e.g. r = −0.07 to 0.08 at Bangkok, r = −0.34 to −0.19 at Agam), indicating that OMI errors are not strongly linked to local temporal heterogeneity. In contrast, TROPOMI exhibits clearer and more physically consistent relationships, particularly at Singapore (DS: r = 0.33; SS: r = 0.63) and Pontianak (DS: r = 0.35; SS: r = 0.27), where increased short-timescale variability leads to larger satellite–ground discrepancies. Moreover, TROPOMI maintains lower overall error magnitudes compared to OMI, with RMSE typically below ∼ 9 × 10¹⁵ molec. cm−2 and MAE below ∼ 5 × 10¹⁵ molec. cm−2 at most sites. These results indicate that while TROPOMI remains sensitive to sub-pixel variability, its errors are more physically interpretable and systematically linked to atmospheric heterogeneity, whereas OMI discrepancies are dominated by coarse spatial resolution and representativeness limitations.
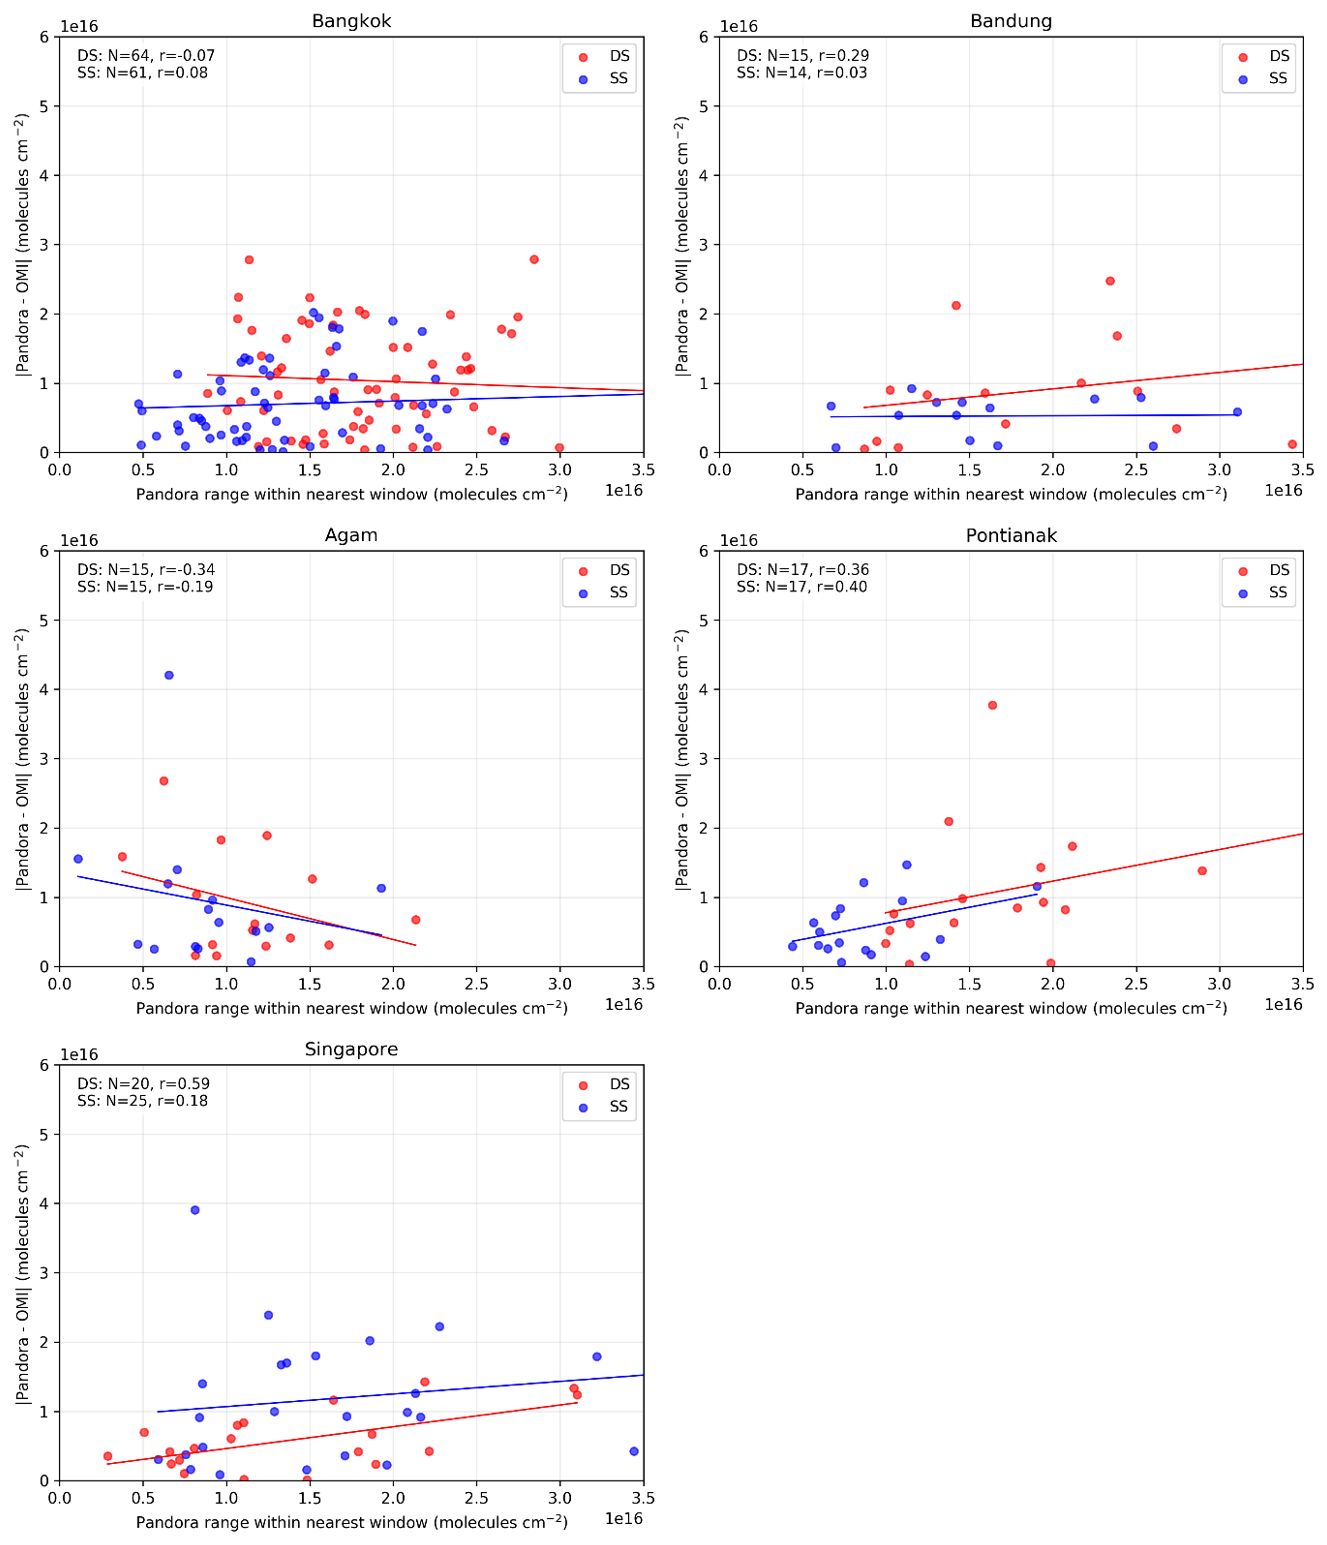
Figure 9Relationship between absolute OMI–Pandora HCHO bias and short-timescale Pandora variability within nearest-time matching at five Southeast Asian stations. The x axis represents the range of Pandora HCHO columns observed within the collocation window as a proxy for local temporal heterogeneity, while the y axis shows the magnitude of the satellite–ground bias. Red and blue markers denote direct-sun (DS) and sky-scan (SS) retrieval geometries, respectively. Linear regression lines and corresponding correlation coefficients are shown for each retrieval mode.
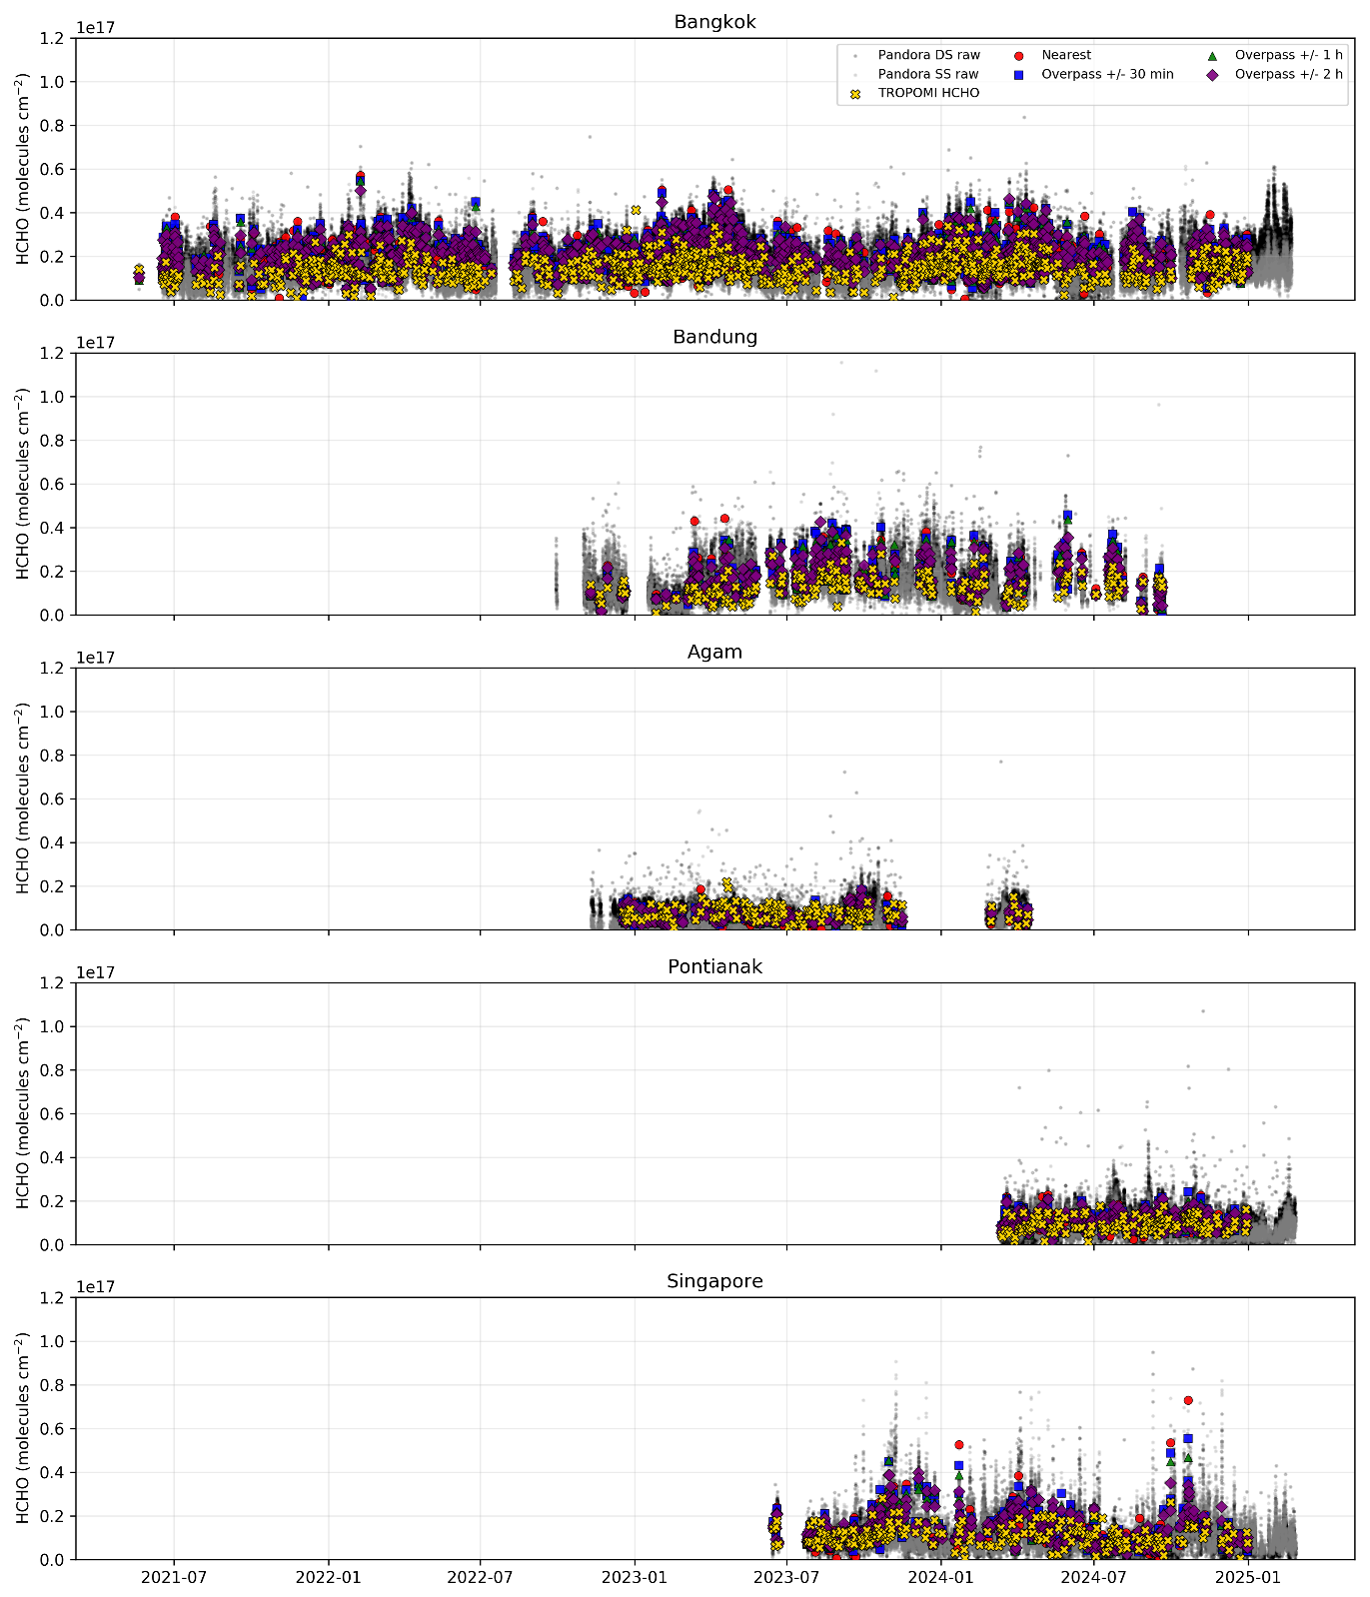
Figure 10Time series of Pandora HCHO column measurements (DS and SS) and temporally collocated TROPOMI observations at five Southeast Asian stations. TROPOMI-Pandora data are shown for four collocation approaches: nearest-time matching and overpass-centred averaging windows of ±30 min, ±1 h, and ±2 h.
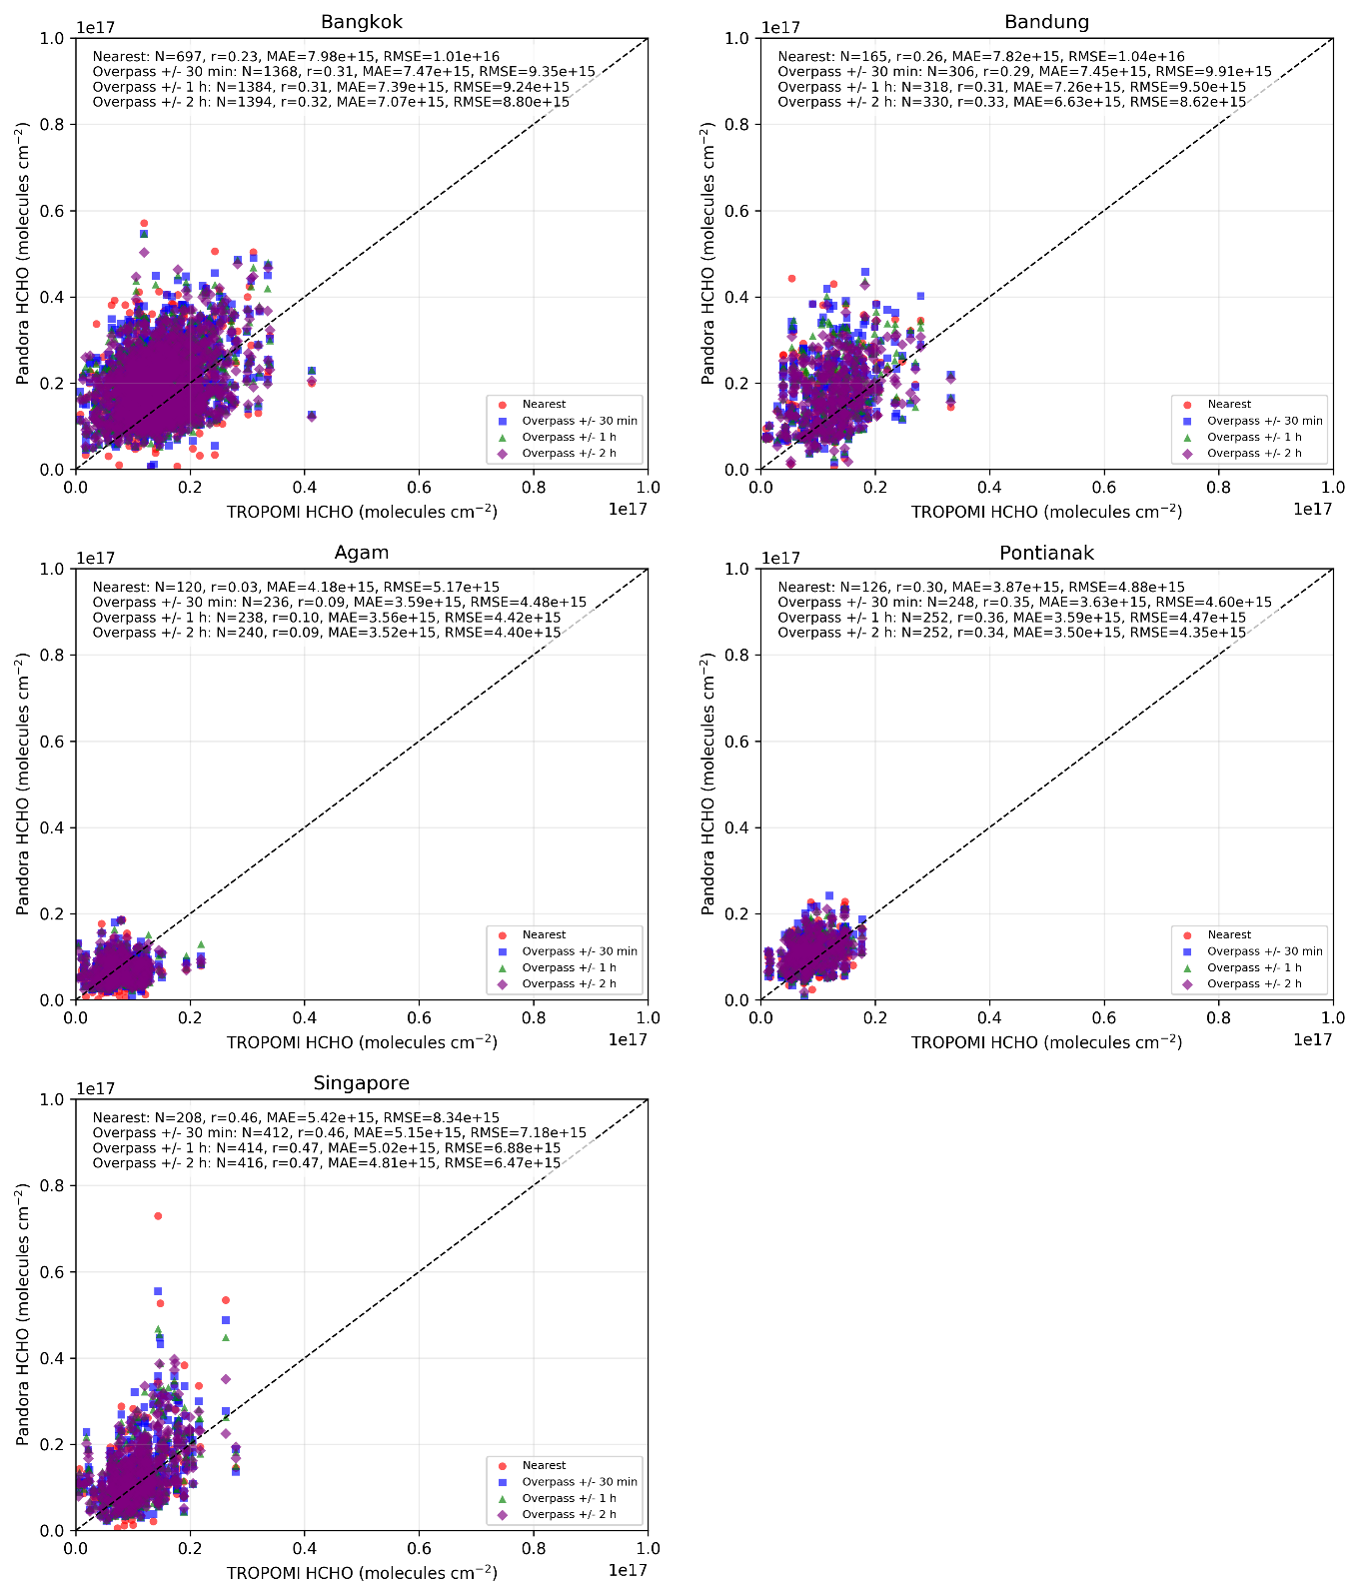
Figure 11Scatter plots comparing Pandora and TROPOMI HCHO column retrievals for different temporal collocation strategies. Each panel corresponds to a measurement station and includes the 1:1 reference line. Reported statistics include sample size (N), mean absolute error (MAE), root-mean-square error (RMSE), and Pearson correlation coefficient (r).
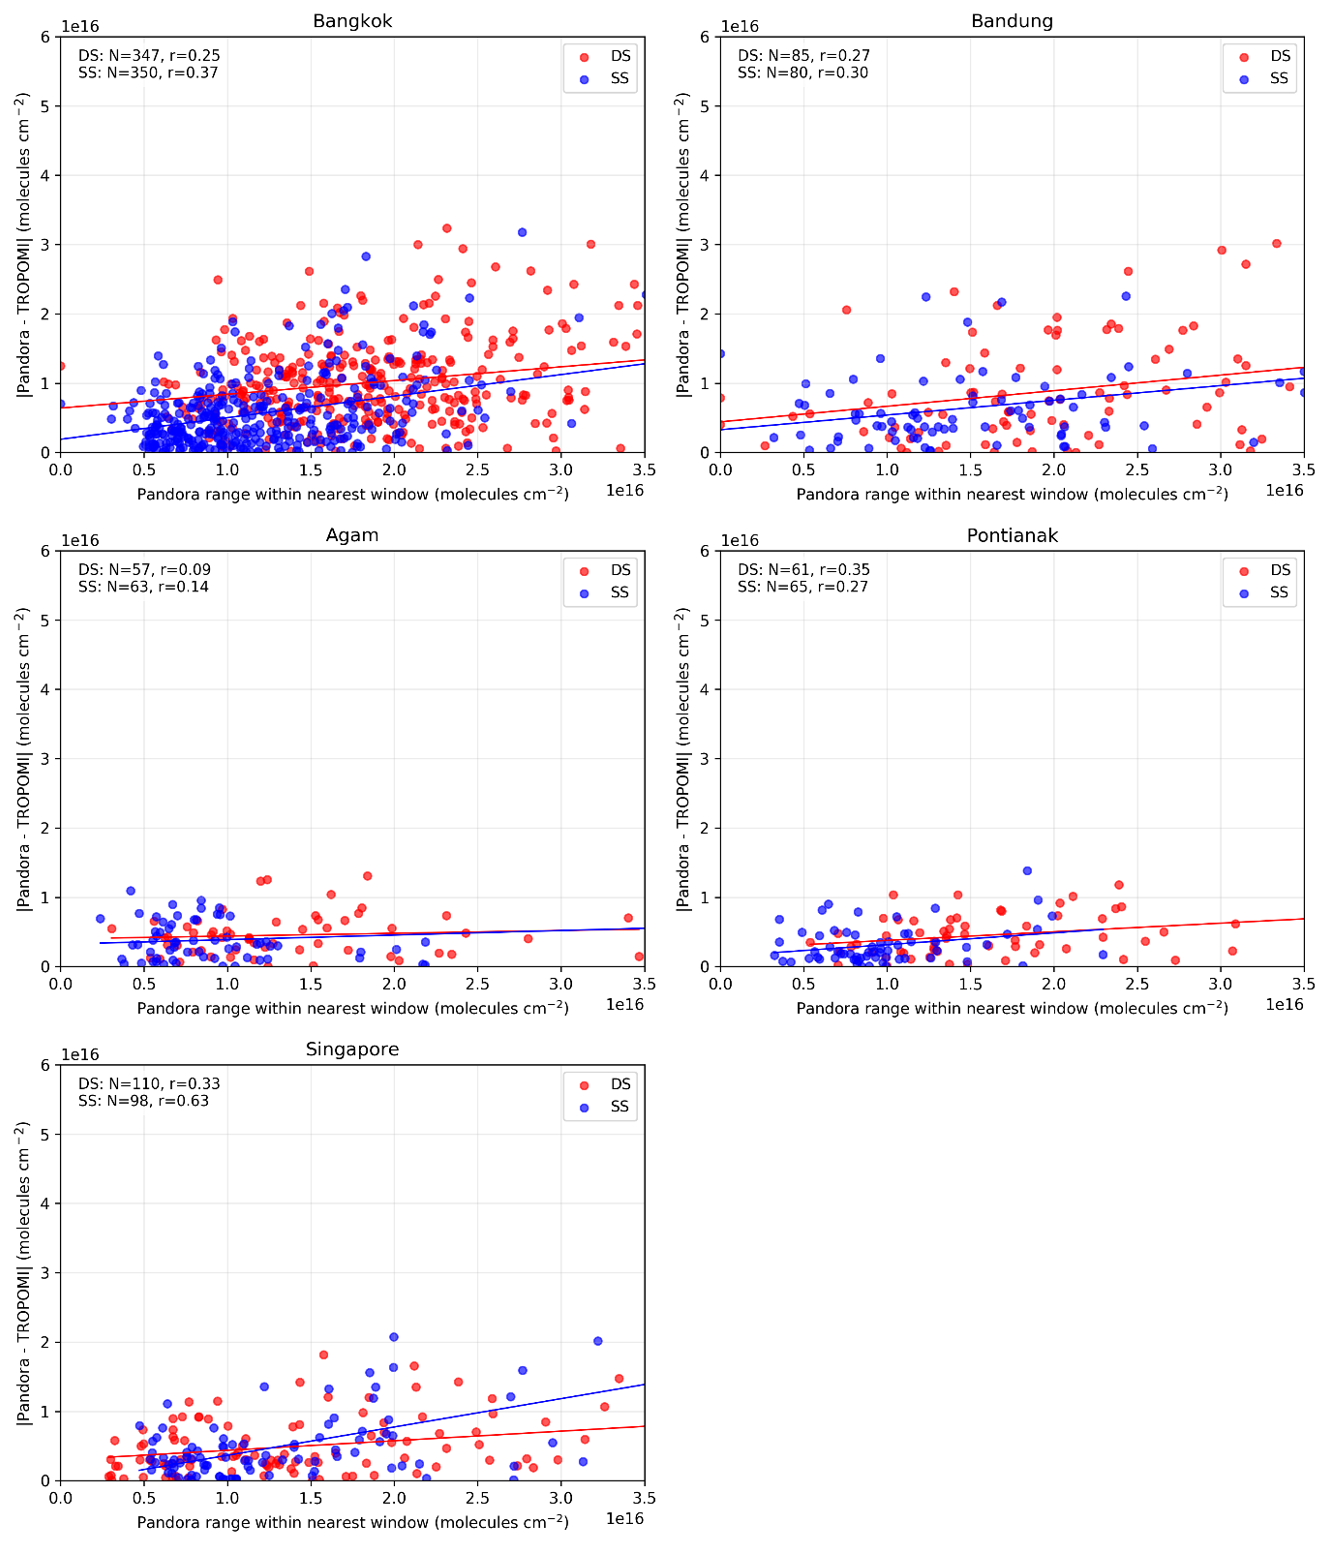
Figure 12Relationship between absolute TROPOMI–Pandora HCHO bias and short-timescale Pandora variability within nearest-time matching at five Southeast Asian stations. The x axis represents the range of Pandora HCHO columns observed within the collocation window as a proxy for local temporal heterogeneity, while the y axis shows the magnitude of the satellite–ground bias. Red and blue markers denote direct-sun (DS) and sky-scan (SS) retrieval geometries, respectively. Linear regression lines and corresponding correlation coefficients are shown for each retrieval mode.
A refined comparison between direct-sun (DS) and sky-scan (SS) retrieval geometries (Figs. 13–14) indicates that their relative performance depends strongly on the statistical metric considered. DS retrievals consistently exhibit higher correlation with TROPOMI, particularly at urban-influenced sites (e.g. Singapore: DS r ≈ 0.50–0.52 vs. SS r ≈ 0.43–0.44; Bangkok: DS r up to ≈ 0.51 vs. SS r up to ≈ 0.32), reflecting their stronger sensitivity to short-term variability and finer-scale variability. However, SS retrievals can simultaneously achieve lower error magnitudes, as demonstrated at Bangkok where SS exhibits reduced RMSE and MAE compared to DS despite slightly lower correlation. Quantitatively, this improvement is substantial, with RMSE reduced by ∼ 10 %–30 % and MAE by ∼ 5 %–20 % in SS relative to DS depending on the collocation window, indicating a more consistent agreement in absolute column magnitude. This apparent inconsistency arises from differences in spatial representativeness: DS measurements sample a narrow atmospheric column and therefore capture fine-scale variability that enhances correlation but increases mismatch with the spatially averaged satellite pixel, whereas SS retrievals integrate multiple viewing directions and better approximate the satellite footprint, leading to reduced RMSE and MAE. This behaviour is most pronounced in urban environments with strong spatial gradients, while in low-HCHO regions such as Agam and Pontianak, SS retrievals show comparable or slightly improved agreement across both correlation and error metrics (e.g. Pontianak: SS r ≈ 0.40 vs. DS r ≈ 0.39, with RMSE ∼ 3.4 × 10¹⁵ vs. ∼ 5.1 × 10¹⁵ molec. cm−2). Overall, these results demonstrate that DS retrievals are not universally superior; rather, DS and SS provide complementary strengths, with DS better capturing temporal variability and SS offering improved spatial representativeness for satellite validation in heterogeneous tropical environments.
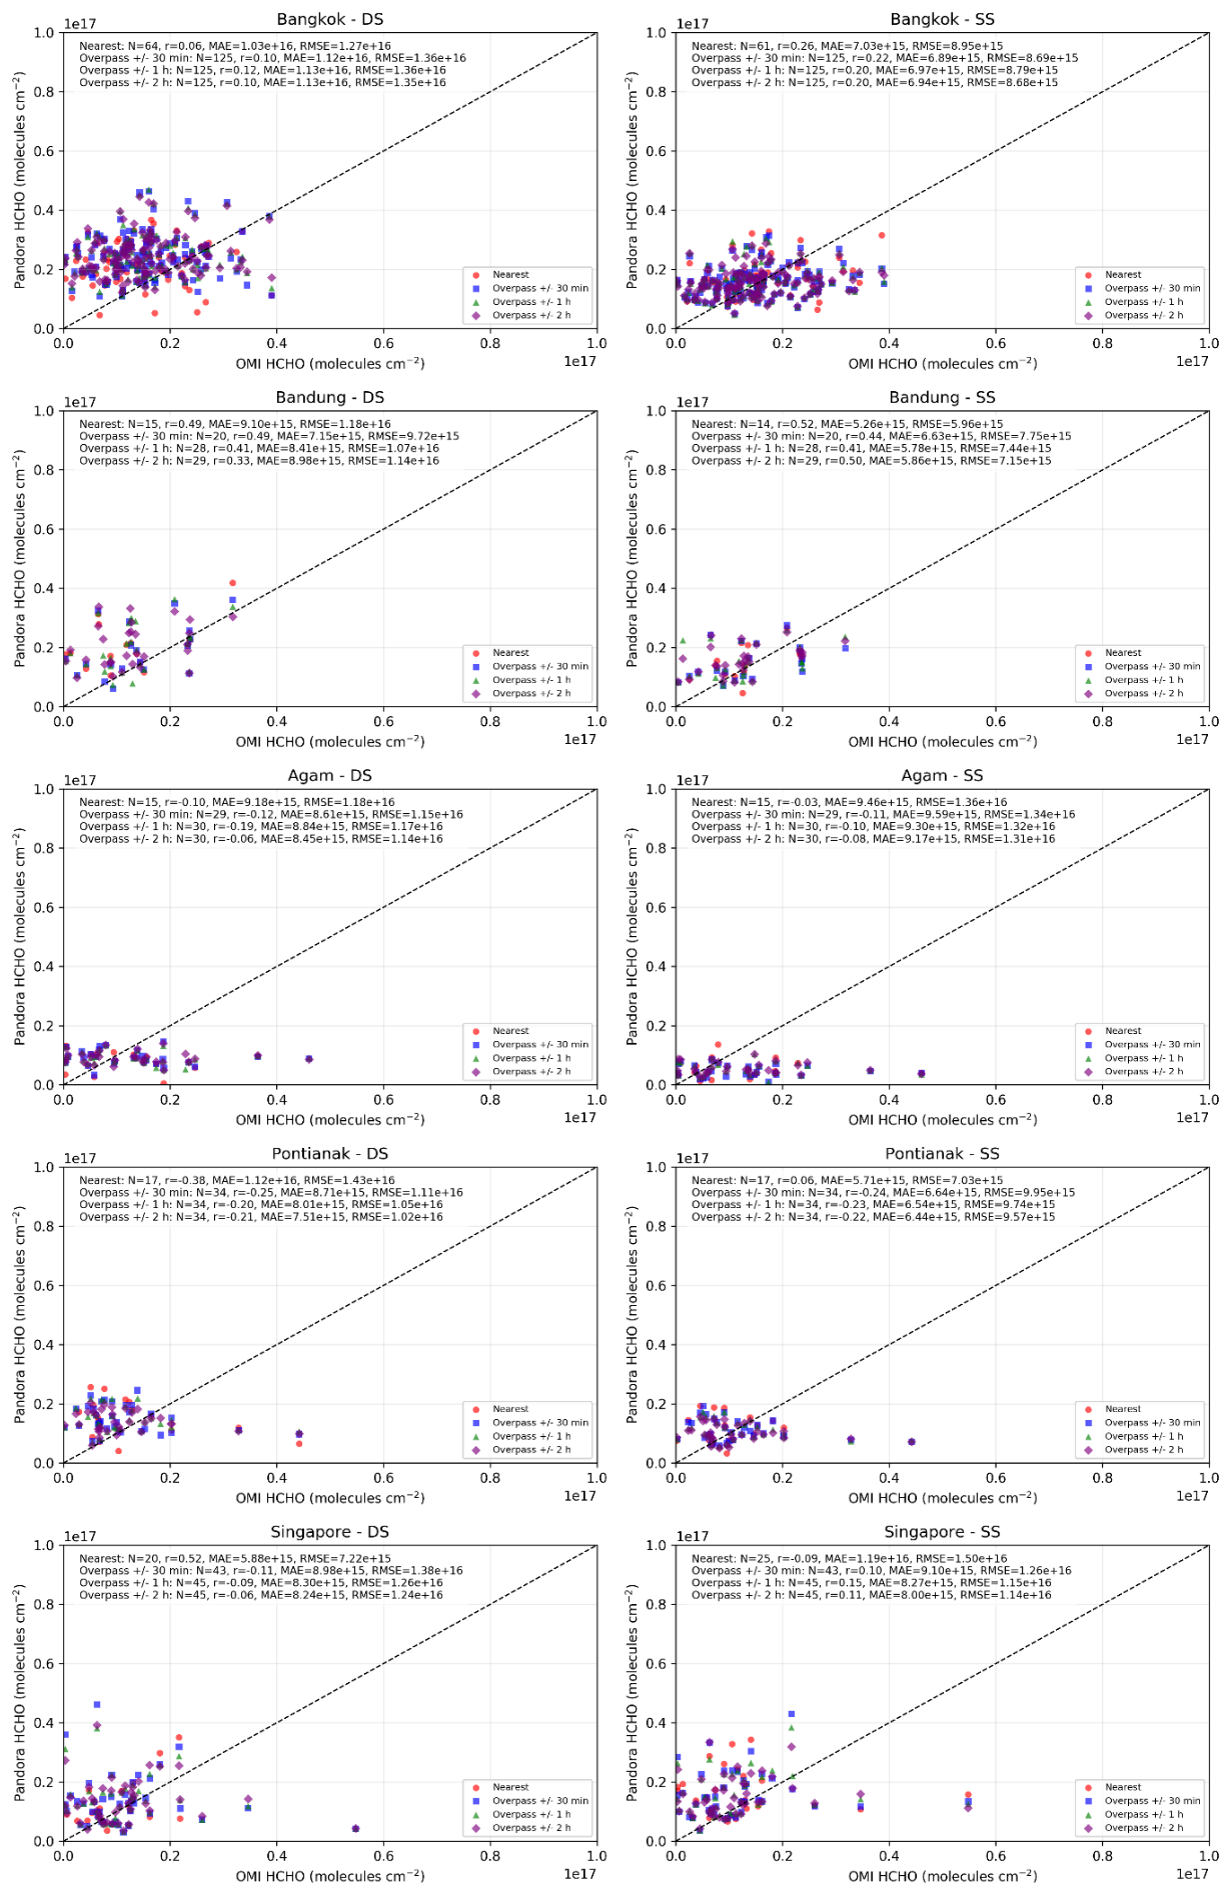
Figure 13Scatter plots comparing Pandora direct-sun (DS; left column) and sky-scan (SS; right column) HCHO column retrievals with OMI observations at five Southeast Asian stations. Each panel shows results for different temporal collocation strategies (nearest, ±30 min, ±1 h, ±2 h), along with the 1:1 reference line. Reported statistics include sample size (N), Pearson correlation coefficient (r), mean absolute error (MAE), and root-mean-square error (RMSE).
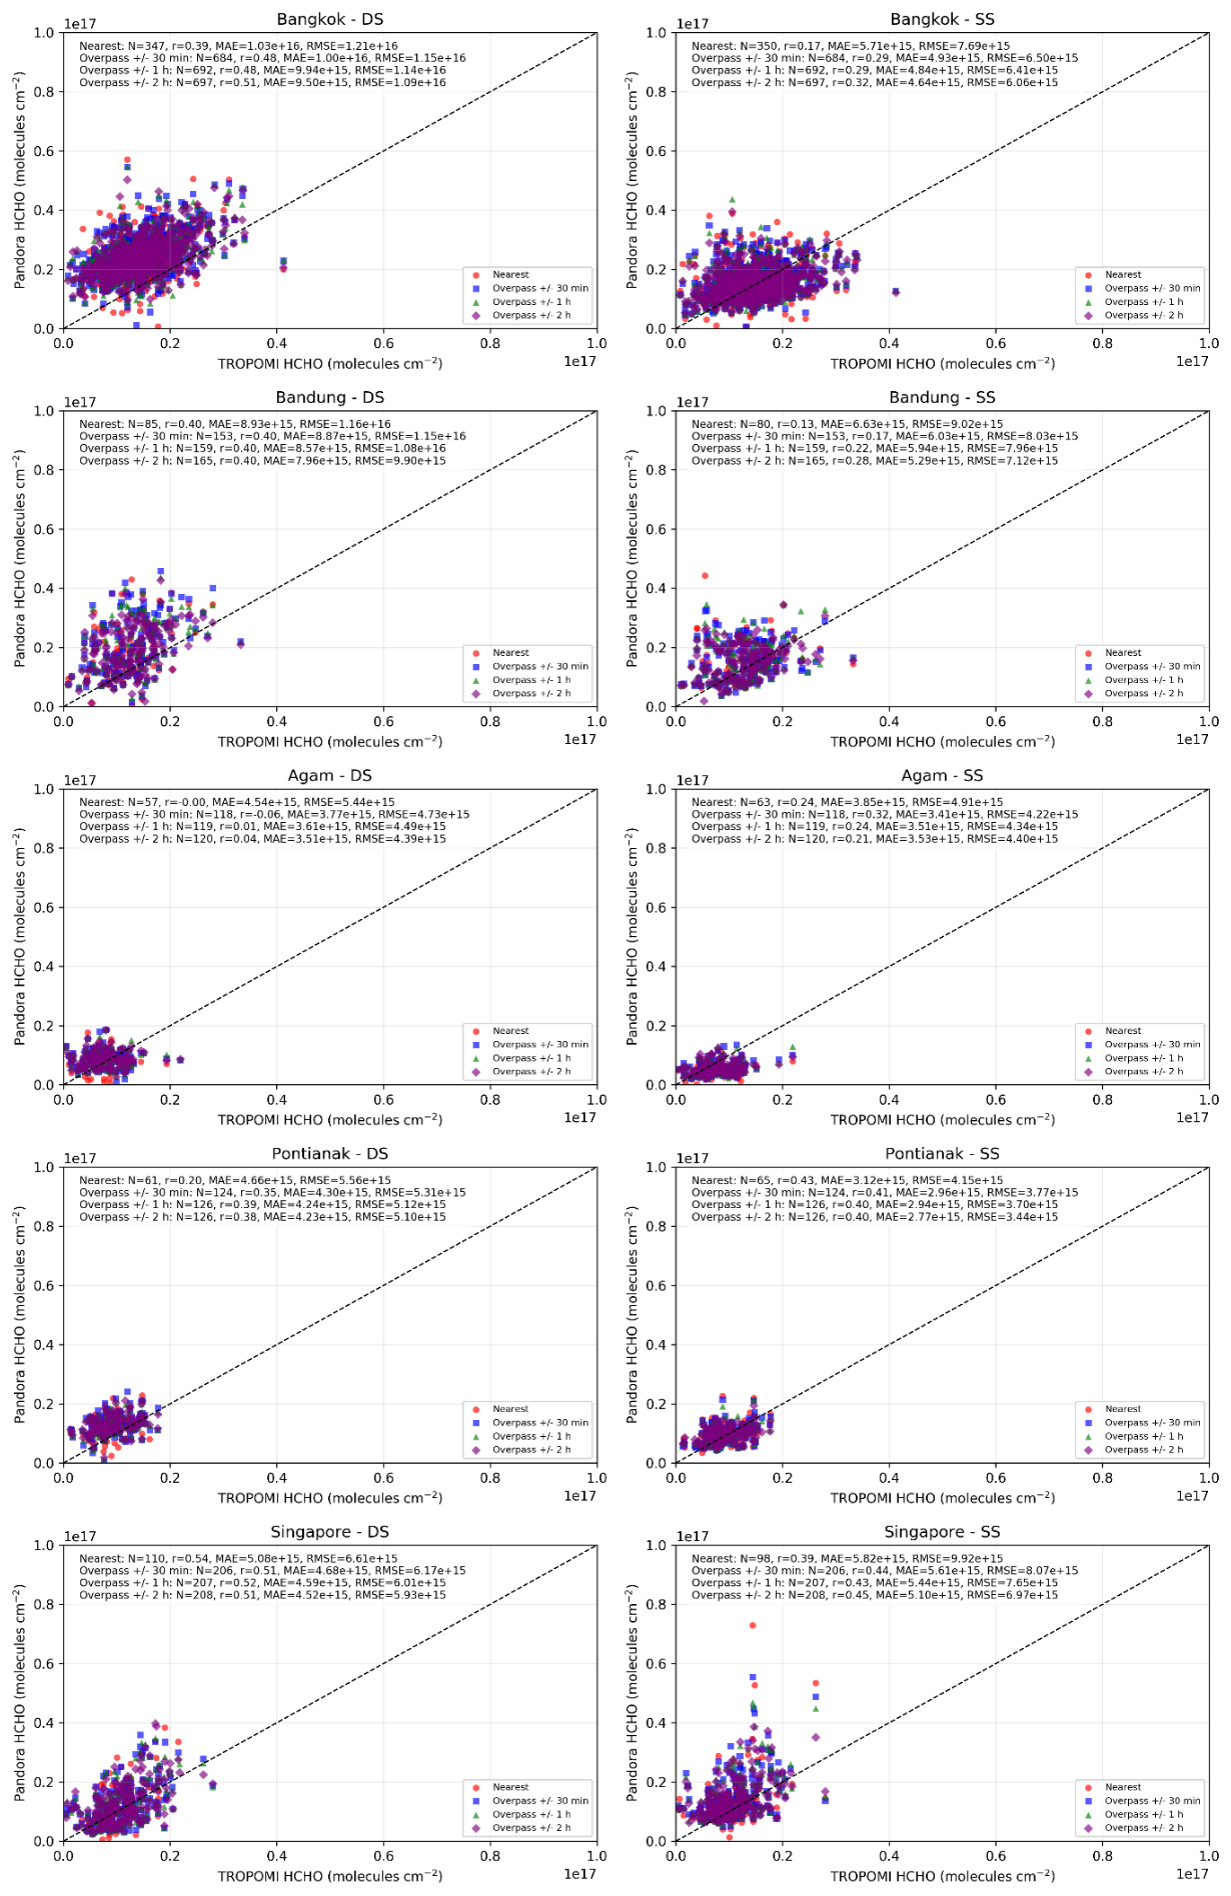
Figure 14Scatter plots comparing Pandora direct-sun (DS; left column) and sky-scan (SS; right column) HCHO column retrievals with TROPOMI observations at five Southeast Asian stations. Each panel shows results for different temporal collocation strategies (nearest, ±30 min, ±1 h, ±2 h), along with the 1:1 reference line. Reported statistics include sample size (N), Pearson correlation coefficient (r), mean absolute error (MAE), and root-mean-square error (RMSE).
3.5 Role of High-Temporal-Resolution Observations: Insights from GEMS HCHO Retrievals
The inclusion of geostationary GEMS observations demonstrates that increased temporal sampling can significantly improve satellite–ground agreement, particularly in urban environments characterized by strong variability. It should be noted that the spatial coverage of GEMS does not extend to the Bandung station; therefore, GEMS-based evaluation is limited to the remaining four Pandora sites. Compared to TROPOMI, GEMS achieves consistently lower error magnitudes at high-HCHO sites such as Bangkok and Singapore while maintaining comparable or stronger correlations (Fig. 15). At Bangkok, correlations reach r ≈ 0.58–0.65 (DS) and r ≈ 0.57–0.59 (SS), exceeding typical TROPOMI performance, while RMSE is further reduced to ≈ (4.1–9.9) × 1015 molec. cm−2 and MAE to ≈ (3.1–8.7) × 1015 molec. cm−2, with the SS configuration exhibiting the lowest errors. A similar pattern is observed at Singapore, where GEMS maintains moderate correlations (r ≈ 0.30–0.38) but achieves lower RMSE and MAE relative to TROPOMI, indicating improved representation of urban-scale variability through high-frequency sampling. In contrast, at low-HCHO environments such as Agam and Pontianak, GEMS performance becomes comparable to TROPOMI (r ≈ 0.09–0.24) with similar error magnitudes, reflecting the reduced influence of temporal variability under relatively homogeneous conditions. These results indicate that the advantage of GEMS is most evident in variability-rich environments, whereas in cleaner regions its performance converges toward that of polar-orbiting sensors.
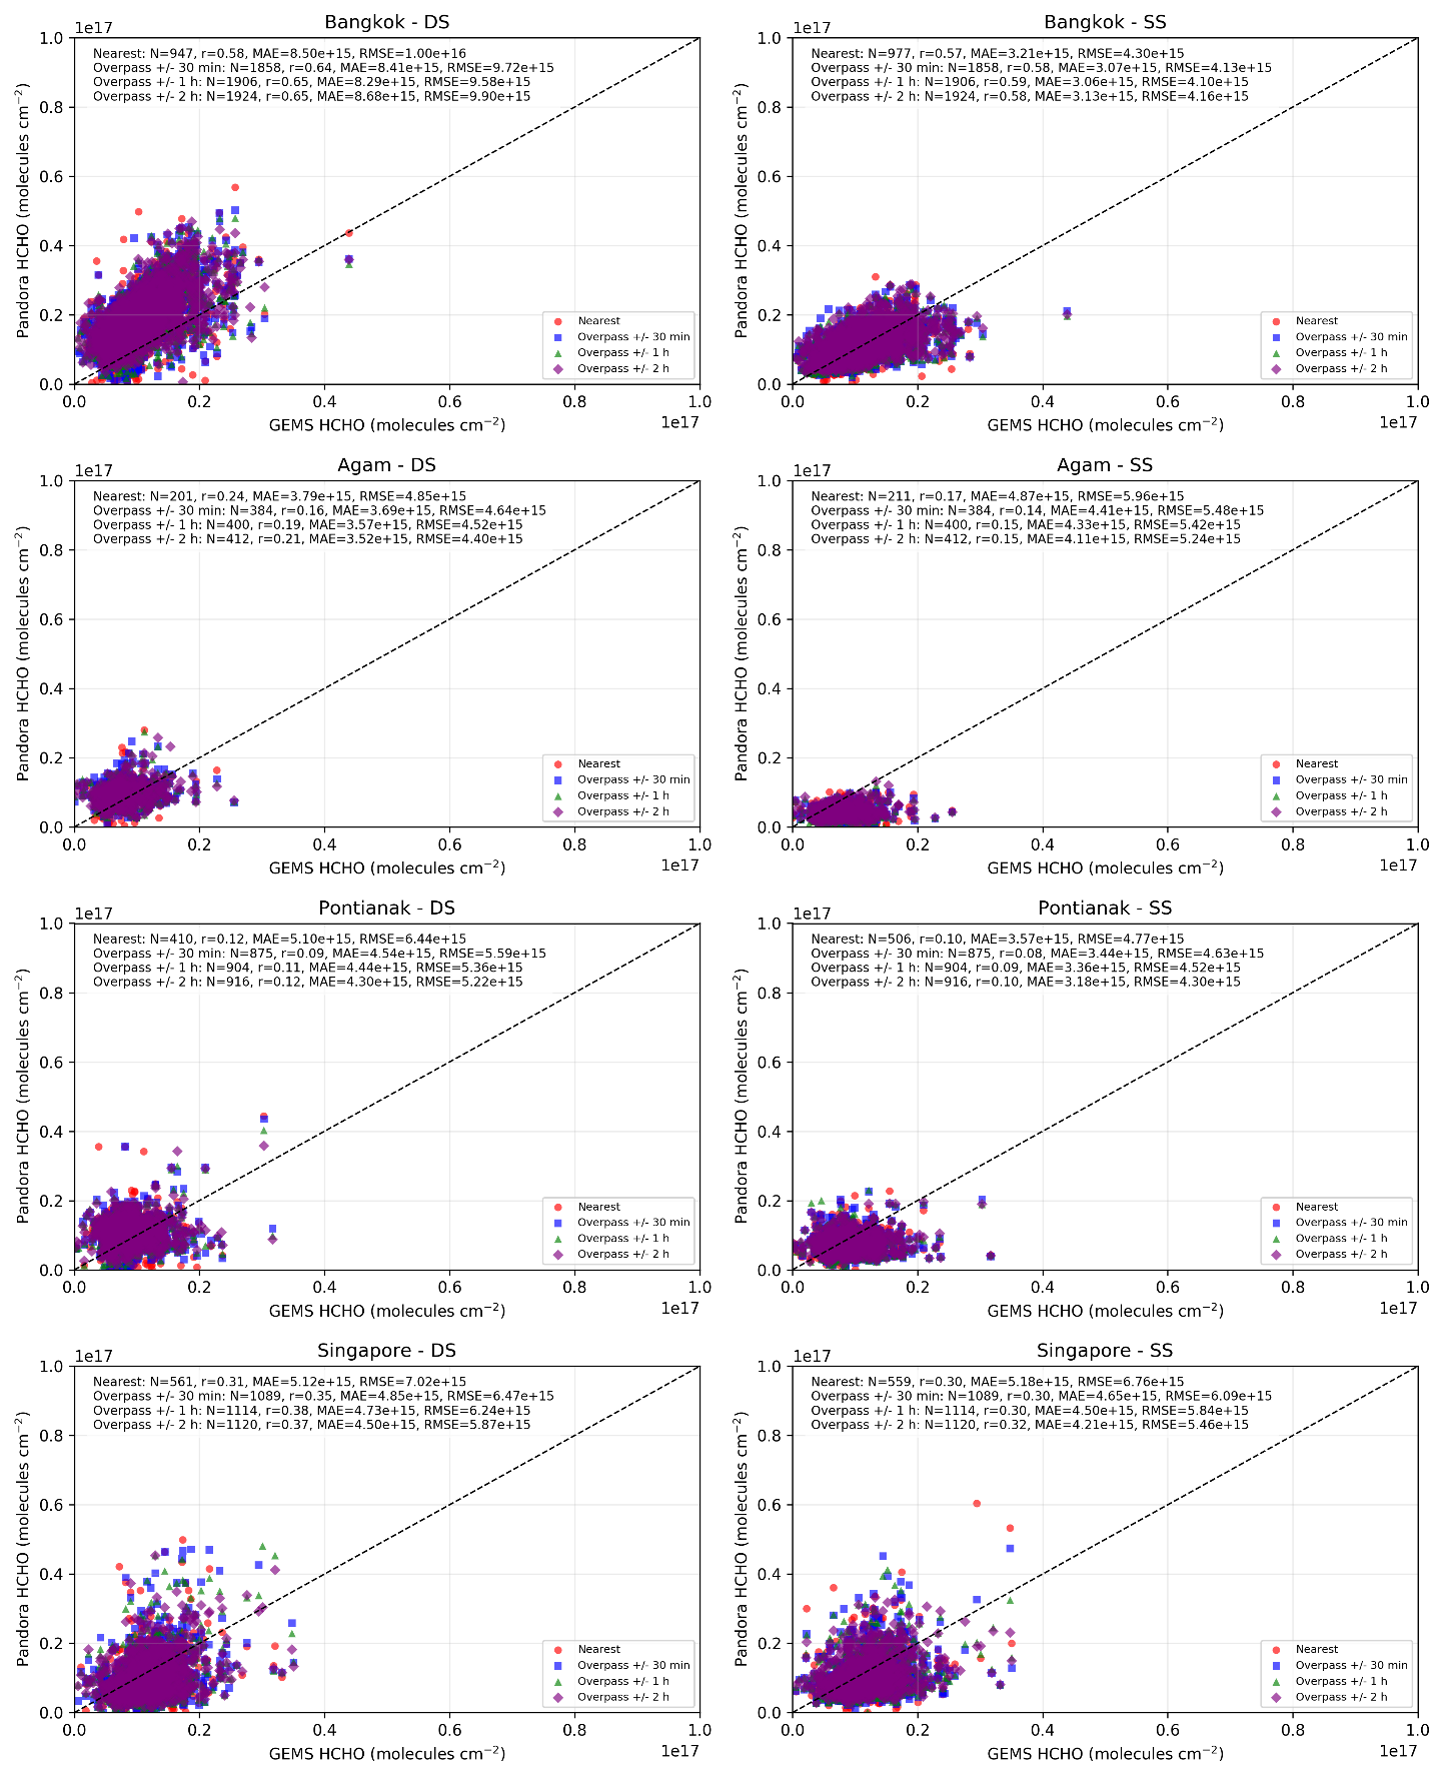
Figure 15Scatter plots comparing Pandora and GEMS HCHO column retrievals for different temporal collocation strategies. Each panel corresponds to a measurement station and includes the 1:1 reference line. Reported statistics include sample size (N), mean absolute error (MAE), root-mean-square error (RMSE), and Pearson correlation coefficient (r).
The role of temporal mismatch is further examined using the bias–temporal offset relationship (Fig. 16), which shows no systematic increase in absolute bias with increasing | Δt | across all stations. Median bias values remain relatively stable from near-synchronous conditions (0–0.25 h) to larger offsets (1–2 h), indicating that substantial discrepancies persist even when temporal mismatch is minimal. This suggests that improving temporal sampling – within the range of current satellite observations (e.g. hourly resolution from geostationary platforms) – does not fully resolve satellite–ground differences. The remaining discrepancies likely reflect differences in spatial sampling, particularly the contrast between the localized column measured by Pandora direct-sun observations and the spatially averaged satellite footprint. Sky-scan retrievals, which integrate over multiple viewing directions, generally exhibit reduced variability and improved consistency with satellite observations, supporting this interpretation.
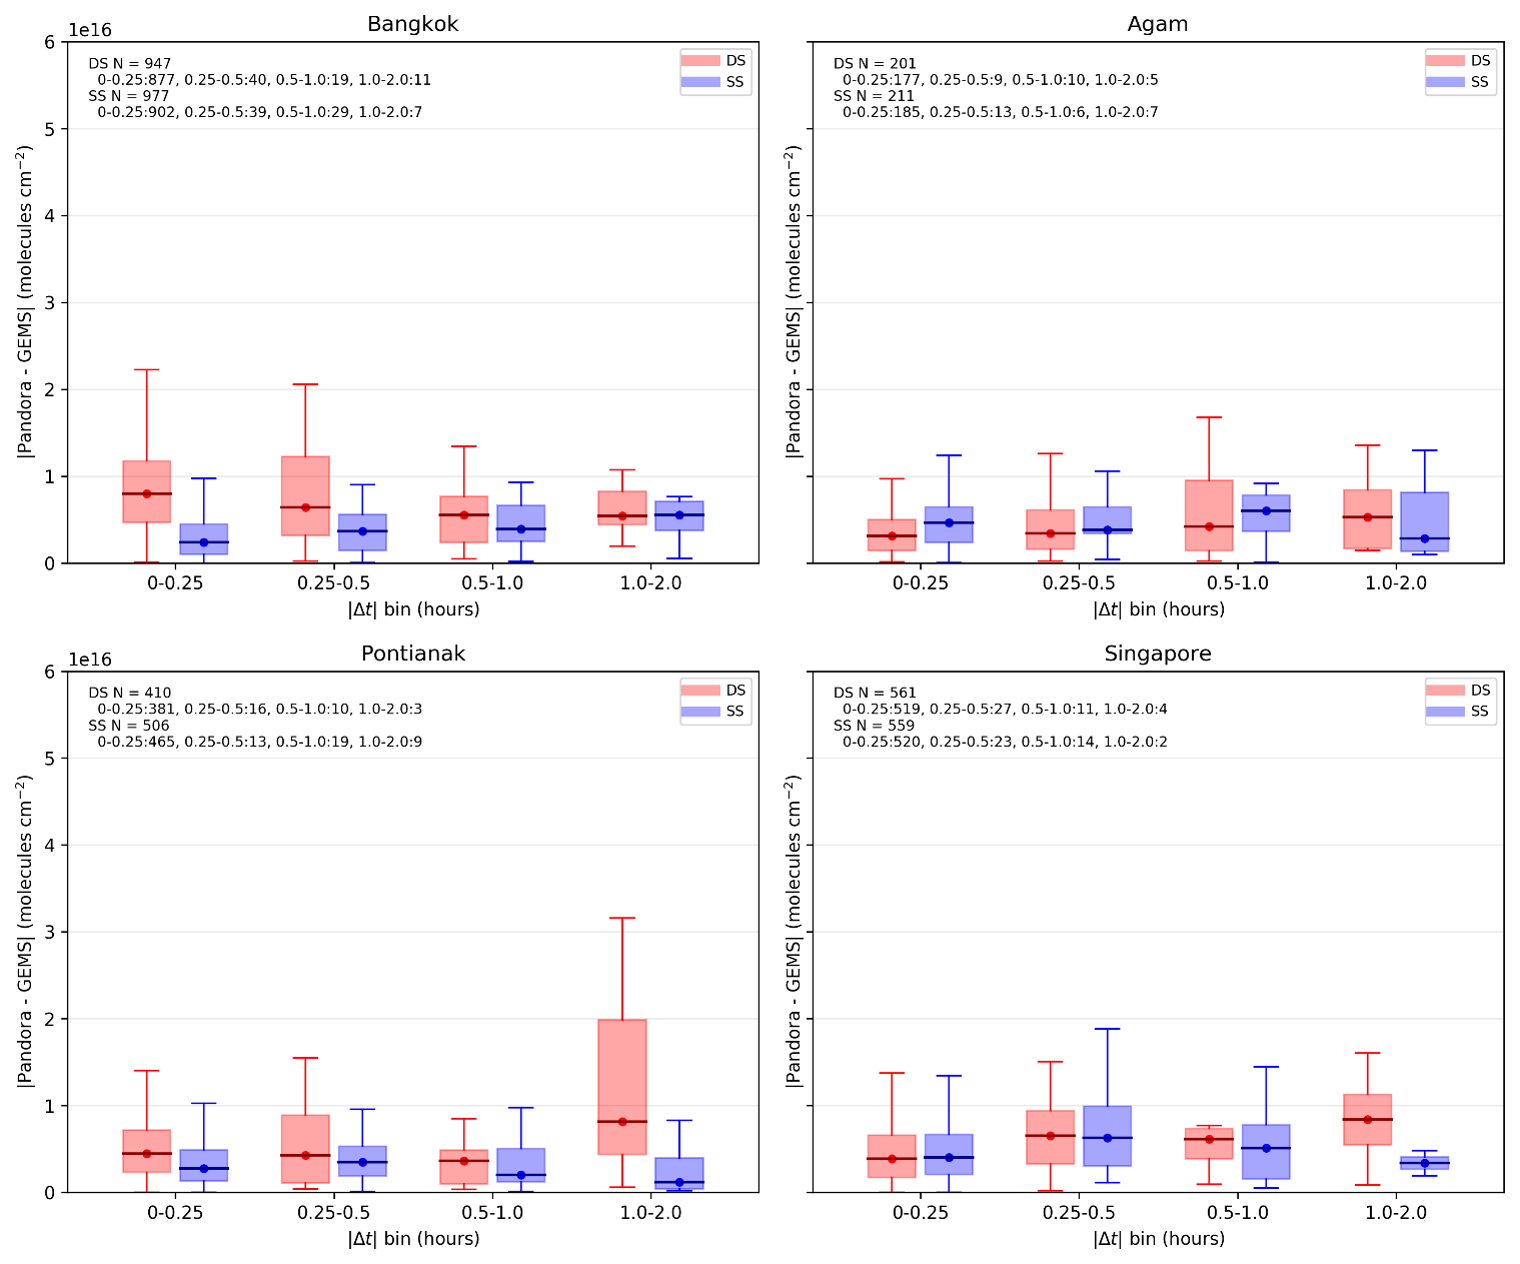
Figure 16Relationship between absolute GEMS–Pandora HCHO bias and temporal mismatch (| Δt |) at four Southeast Asian stations. Absolute bias is grouped into temporal offset bins (e.g. 0–0.25, 0.25–0.5, 0.5–1, and 1–2 h), with boxplots showing the median, interquartile range (IQR), and variability within each bin. Results are presented separately for direct-sun (DS) and sky-scan (SS) retrieval geometries.
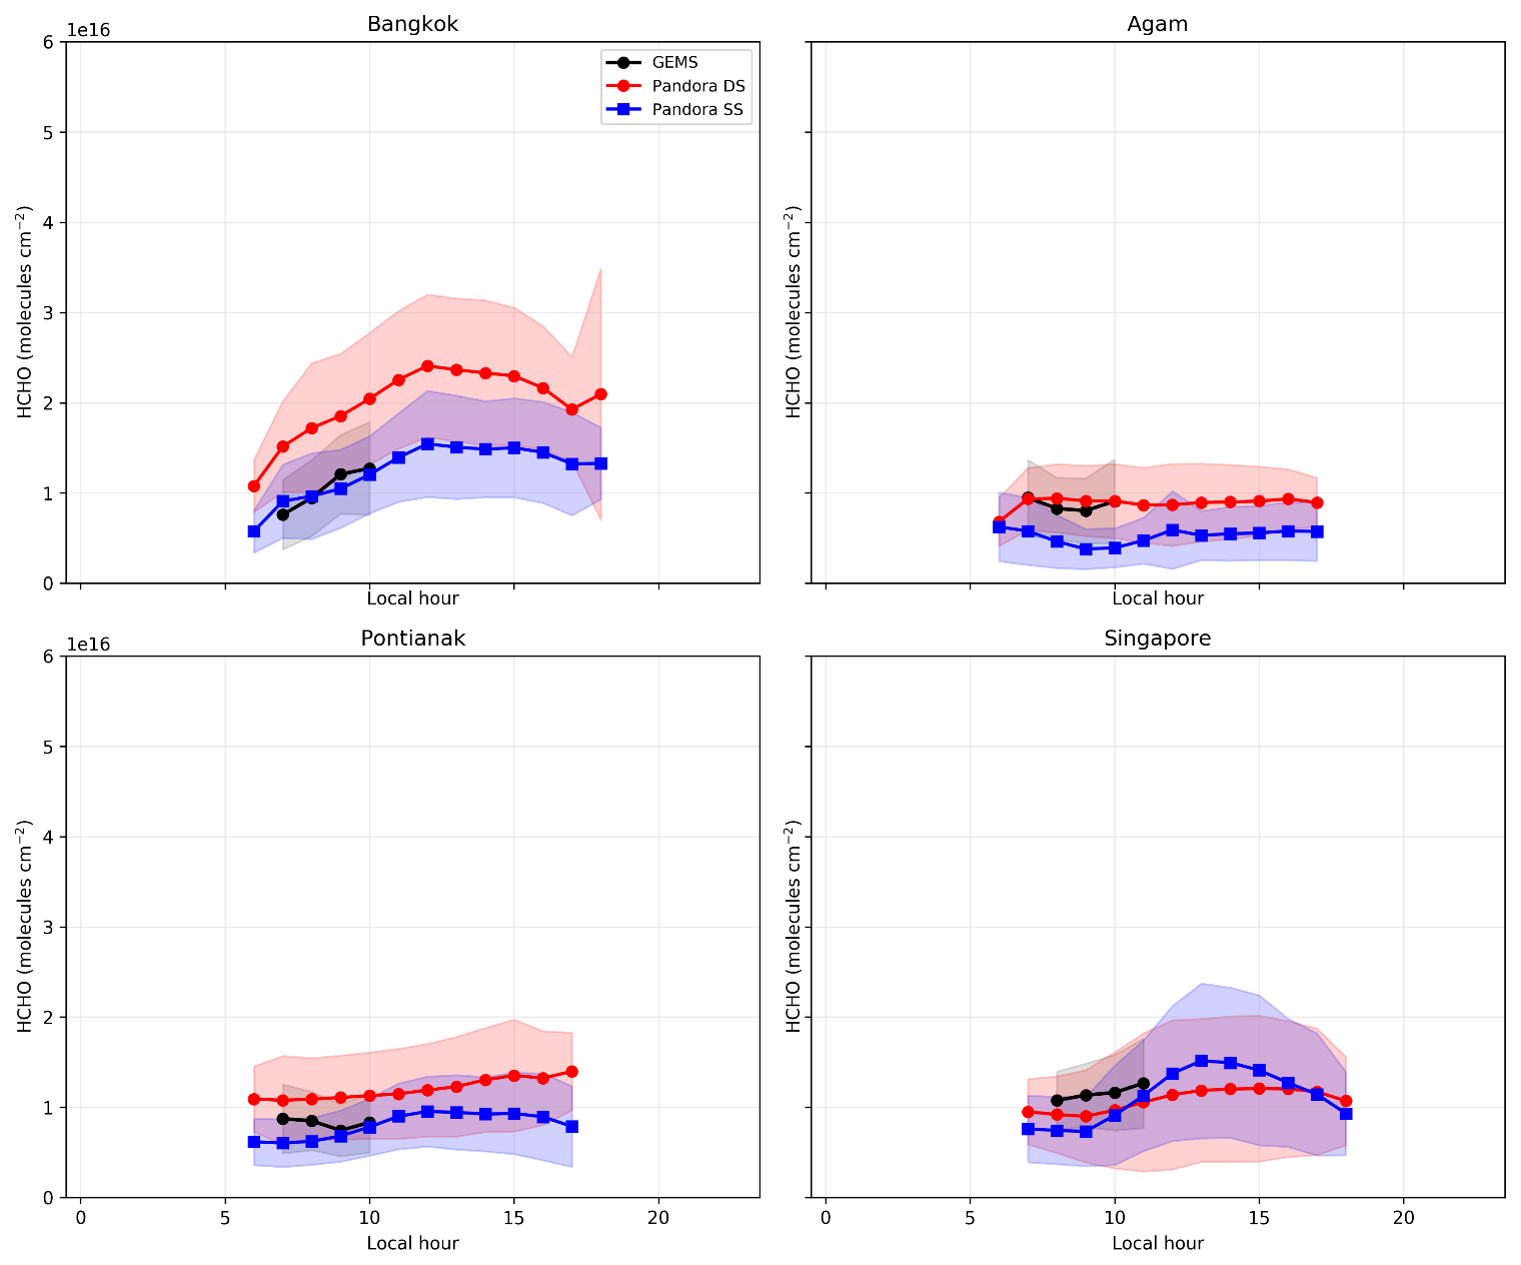
Figure 17Diurnal composite of HCHO column concentrations from GEMS and Pandora observations at four Southeast Asian stations. GEMS observations are compared with Pandora direct-sun (DS) and sky-scan (SS) retrievals, averaged into local time bins to illustrate the daytime evolution of HCHO.
This interpretation is further supported by the diurnal composite analysis (Fig. 17). GEMS captures the overall daytime evolution of HCHO, including the late-morning to afternoon enhancement associated with photochemical production, but exhibits smoother variability compared to Pandora observations. At urban-influenced sites such as Bangkok and Singapore, GEMS more closely follows the sky-scan (SS) retrievals, while direct-sun (DS) measurements display higher peak values and larger amplitudes due to sensitivity to localized emission sources. In cleaner environments such as Agam, where spatial gradients are weaker, differences between DS and SS are reduced, yet GEMS still represents a smoothed column relative to ground-based observations. Together with the bias–temporal offset analysis, these results indicate that while higher-frequency sampling improves the representation of temporal variability and reduces error magnitudes, it does not fully eliminate discrepancies within current satellite capabilities, with residual differences likely associated with sub-pixel variability and scale mismatches between satellite and ground-based observations.
This study provides a process-based evaluation of satellite–ground HCHO consistency in tropical Southeast Asia by integrating uncertainty-based quality control (Rawat et al., 2025), retrieval geometry separation (Pandora DS vs. SS), and multi-satellite comparison (OMI, TROPOMI, and GEMS). Satellite observations are not treated as a reference standard in this study; instead, they provide an independent observational framework to evaluate how differences in retrieval geometry and sampling characteristics influence satellite–ground agreement. The results demonstrate that discrepancies between satellite and Pandora observations arise from the combined influence of retrieval precision, sampling scale, and temporal coverage. Direct-sun (DS) retrievals exhibit higher correlations with satellite observations (r up to ∼ 0.5) due to their sensitivity to short-term variability, whereas sky-scan (SS) retrievals consistently achieve lower RMSE and MAE (reduced by ∼ 10 %–30 % and ∼ 5 %–20 %) by better approximating the spatial averaging inherent in satellite measurements. These findings highlight that correlation and error metrics reflect different aspects of agreement and should be interpreted in the context of sampling characteristics. This behavior is consistent with previous studies demonstrating that measurement geometry influences the spatial representativeness of trace gas observations, with multi-axis viewing configurations sampling broader horizontal domains compared to narrow line-of-sight measurements (Dimitropoulou et al., 2022).
The comparison across satellite platforms reveals a consistent improvement from OMI to TROPOMI and further to GEMS. OMI shows weak agreement due to coarse spatial resolution, while TROPOMI improves the representation of variability through finer spatial sampling. GEMS provides additional improvement, particularly in urban environments, where higher temporal resolution enhances agreement (e.g. r ≈ 0.58–0.65 at Bangkok) and reduces RMSE and MAE relative to TROPOMI. However, the persistence of discrepancies even under near-synchronous conditions indicates that improvements in temporal sampling – within current satellite capabilities – do not fully resolve satellite–ground differences. The remaining differences likely reflect mismatches in spatial sampling between localized ground-based observations and spatially averaged satellite pixels, particularly in heterogeneous tropical environments characterized by strong emission gradients and rapid photochemical processes. This interpretation is consistent with recent global analyses showing that increasing the collocation radius generally improves the agreement between Pandora and TROPOMI for HCHO due to its smoother spatial distribution, whereas the opposite behavior is often observed for NO2 because of its stronger spatial heterogeneity (Park et al., 2026).
Overall, the agreement between Pandora and satellite HCHO retrievals in tropical Southeast Asia is governed by the interplay between retrieval geometry, spatial sampling, and temporal resolution. The application of uncertainty-based quality control improves the robustness of Pandora observations, while the separation of DS and SS retrievals reveals complementary strengths in capturing variability and spatially representative column structure. The observed differences between DS and SS retrievals reflect the interplay between measurement geometry and atmospheric heterogeneity, with DS often reflecting more localized variability and SS providing a more spatially integrated representation of the atmospheric column. Although advances in satellite design – such as higher spatial resolution (TROPOMI) and increased temporal sampling (GEMS) – substantially improve agreement, residual discrepancies remain. These results provide a coherent framework for interpreting satellite–ground HCHO comparisons in tropical regions and highlight the need for integrated spatial–temporal strategies in future satellite missions and validation efforts.
The datasets used and/or analyzed in the current study are available from the corresponding author on reasonable request.
The supplement related to this article is available online at https://doi.org/10.5194/amt-19-3713-2026-supplement.
Conception of the work: Jackson HW Chang. Acquisition of the data: Putu Aryastana. Interpretation of the data: Yong Jie Wong, Chee Fuei Pien. Supervision: Justin Sentian, Juneng Liew, Neng-Huei Lin. Writing – original draft: Jackson HW Chang, Maggie Chel-Gee Ooi. Writing – review and editing: Justin Sentian, Juneng Liew, Neng-Huei Lin.
The contact author has declared that none of the authors has any competing interests.
This research did not involve human participants and/or animals, and informed consent was not required for this study.
Publisher's note: Copernicus Publications remains neutral with regard to jurisdictional claims made in the text, published maps, institutional affiliations, or any other geographical representation in this paper. The authors bear the ultimate responsibility for providing appropriate place names. Views expressed in the text are those of the authors and do not necessarily reflect the views of the publisher.
The authors gratefully acknowledge the Pandonia Global Network (PGN) and the teams responsible for maintaining the Pandora spectrometer systems in Bangkok, Bandung, Agam, Pontianak, and Singapore. We also thank the NASA Goddard Earth Sciences Data and Information Services Center (GES DISC) for providing OMI formaldehyde (OMHCHOG v003) data and TROPOMI formaldehyde (S5P L2 data Swath). This study was conducted using the GEMS (Geostationary Environment Monitoring Spectrometer) data provided by the Environmental Satellite Center of the National Institute of Environmental Research (NIER) NIER-2025-01-03-003 (Operation of the Geostationary Environmental Satellite Ground Station and Satellite Data Service). Their efforts in ensuring the quality, accessibility, and continuity of these datasets were essential to the success of this study.
This paper was edited by Glenn Wolfe and reviewed by three anonymous referees.
Ahn, C., Torres, O., and Bhartia, P. K.: Comparison of Ozone Monitoring Instrument UV Aerosol Products with Aqua/Moderate Resolution Imaging Spectroradiometer and Multiangle Imaging Spectroradiometer observations in 2006, J. Geophys. Res., 113, https://doi.org/10.1029/2007jd008832, 2008.
Bak, J., Baek, K.-H., Kim, J.-H., Liu, X., Kim, J., and Chance, K.: Cross-evaluation of GEMS tropospheric ozone retrieval performance using OMI data and the use of an ozonesonde dataset over East Asia for validation, Atmos. Meas. Tech., 12, 5201–5215, https://doi.org/10.5194/amt-12-5201-2019, 2019.
Boersma, K. F., Vinken, G. C. M., and Eskes, H. J.: Representativeness errors in comparing chemistry transport and chemistry climate models with satellite UV–Vis tropospheric column retrievals, Geosci. Model Dev., 9, 875–898, https://doi.org/10.5194/gmd-9-875-2016, 2016.
Cheong, K. H., Ngiam, N. J., Morgan, G. G., Pek, P. P., Tan, B. Y.-Q., Lai, J. W., Koh, J. M., Ong, M. E. H., and Ho, A. F. W.: Acute Health Impacts of the Southeast Asian Transboundary Haze Problem – A Review, Int. J. Env. Res. Pub. He., 16, 3286, https://doi.org/10.3390/ijerph16183286, 2019.
De Smedt, I., Theys, N., Yu, H., Danckaert, T., Lerot, C., Compernolle, S., Van Roozendael, M., Richter, A., Hilboll, A., Peters, E., Pedergnana, M., Loyola, D., Beirle, S., Wagner, T., Eskes, H., van Geffen, J., Boersma, K. F., and Veefkind, P.: Algorithm theoretical baseline for formaldehyde retrievals from S5P TROPOMI and from the QA4ECV project, Atmos. Meas. Tech., 11, 2395–2426, https://doi.org/10.5194/amt-11-2395-2018, 2018.
De Smedt, I., Pinardi, G., Vigouroux, C., Compernolle, S., Bais, A., Benavent, N., Boersma, F., Chan, K.-L., Donner, S., Eichmann, K.-U., Hedelt, P., Hendrick, F., Irie, H., Kumar, V., Lambert, J.-C., Langerock, B., Lerot, C., Liu, C., Loyola, D., Piters, A., Richter, A., Rivera Cárdenas, C., Romahn, F., Ryan, R. G., Sinha, V., Theys, N., Vlietinck, J., Wagner, T., Wang, T., Yu, H., and Van Roozendael, M.: Comparative assessment of TROPOMI and OMI formaldehyde observations and validation against MAX-DOAS network column measurements, Atmos. Chem. Phys., 21, 12561–12593, https://doi.org/10.5194/acp-21-12561-2021, 2021.
Dimitropoulou, E., Hendrick, F., Friedrich, M. M., Tack, F., Pinardi, G., Merlaud, A., Fayt, C., Hermans, C., and Van Roozendael, M.: Improved TROPOMI HCHO Column Validation Using Dual-Scan MAX-DOAS Retrievals, in: 2021 IEEE International Geoscience and Remote Sensing Symposium IGARSS, Brussels, Belgium, 11–16 July 2021, IEEE, 8026–8029, https://doi.org/10.1109/igarss47720.2021.9553326, 2021.
Dimitropoulou, E., Hendrick, F., Friedrich, M. M., Tack, F., Pinardi, G., Merlaud, A., Fayt, C., Hermans, C., Fierens, F., and Van Roozendael, M.: Horizontal distribution of tropospheric NO2 and aerosols derived by dual-scan multi-wavelength multi-axis differential optical absorption spectroscopy (MAX-DOAS) measurements in Uccle, Belgium, Atmos. Meas. Tech., 15, 4503–4529, https://doi.org/10.5194/amt-15-4503-2022, 2022.
Fang, Z., Deng, W., Zhang, Y., Ding, X., Tang, M., Liu, T., Hu, Q., Zhu, M., Wang, Z., Yang, W., Huang, Z., Song, W., Bi, X., Chen, J., Sun, Y., George, C., and Wang, X.: Open burning of rice, corn and wheat straws: primary emissions, photochemical aging, and secondary organic aerosol formation, Atmos. Chem. Phys., 17, 14821–14839, https://doi.org/10.5194/acp-17-14821-2017, 2017.
Fu, T., Jacob, D. J., Palmer, P. I., Chance, K., Wang, Y. X., Barletta, B., Blake, D. R., Stanton, J. C., and Pilling, M. J.: Space-based formaldehyde measurements as constraints on volatile organic compound emissions in east and south Asia and implications for ozone, J. Geophys. Res., 112, https://doi.org/10.1029/2006jd007853, 2007.
Glowania, M., Rohrer, F., Dorn, H.-P., Hofzumahaus, A., Holland, F., Kiendler-Scharr, A., Wahner, A., and Fuchs, H.: Comparison of formaldehyde measurements by Hantzsch, CRDS and DOAS in the SAPHIR chamber, Atmos. Meas. Tech., 14, 4239–4253, https://doi.org/10.5194/amt-14-4239-2021, 2021.
Hansen, A. B., Witham, C. S., Chong, W. M., Kendall, E., Chew, B. N., Gan, C., Hort, M. C., and Lee, S.-Y.: Haze in Singapore – source attribution of biomass burning PM10 from Southeast Asia, Atmos. Chem. Phys., 19, 5363–5385, https://doi.org/10.5194/acp-19-5363-2019, 2019.
Harkey, M., Holloway, T., Kim, E. J., Baker, K. R., and Henderson, B.: Satellite Formaldehyde to Support Model Evaluation, J. Geophys. Res.-Atmos., 126, https://doi.org/10.1029/2020jd032881, 2021.
Herman, J., Evans, R., Cede, A., Abuhassan, N., Petropavlovskikh, I., and McConville, G.: Comparison of ozone retrievals from the Pandora spectrometer system and Dobson spectrophotometer in Boulder, Colorado, Atmos. Meas. Tech., 8, 3407–3418, https://doi.org/10.5194/amt-8-3407-2015, 2015.
Herman, J., Spinei, E., Fried, A., Kim, J., Kim, J., Kim, W., Cede, A., Abuhassan, N., and Segal-Rozenhaimer, M.: NO2 and HCHO measurements in Korea from 2012 to 2016 from Pandora spectrometer instruments compared with OMI retrievals and with aircraft measurements during the KORUS-AQ campaign, Atmos. Meas. Tech., 11, 4583–4603, https://doi.org/10.5194/amt-11-4583-2018, 2018.
Johnson, M. S., Philip, S., Meech, S., Kumar, R., Sorek-Hamer, M., Shiga, Y. P., and Jung, J.: Insights into the long-term (2005–2021) spatiotemporal evolution of summer ozone production sensitivity in the Northern Hemisphere derived with the Ozone Monitoring Instrument (OMI), Atmos. Chem. Phys., 24, 10363–10384, https://doi.org/10.5194/acp-24-10363-2024, 2024.
Jones, N. B., Riedel, K., Allan, W., Wood, S., Palmer, P. I., Chance, K., and Notholt, J.: Long-term tropospheric formaldehyde concentrations deduced from ground-based fourier transform solar infrared measurements, Atmos. Chem. Phys., 9, 7131–7142, https://doi.org/10.5194/acp-9-7131-2009, 2009.
Lamsal, L. N., Krotkov, N. A., Celarier, E. A., Swartz, W. H., Pickering, K. E., Bucsela, E. J., Gleason, J. F., Martin, R. V., Philip, S., Irie, H., Cede, A., Herman, J., Weinheimer, A., Szykman, J. J., and Knepp, T. N.: Evaluation of OMI operational standard NO2 column retrievals using in situ and surface-based NO2 observations, Atmos. Chem. Phys., 14, 11587–11609, https://doi.org/10.5194/acp-14-11587-2014, 2014.
Lee, G. T., Park, R. J., Kwon, H.-A., Ha, E. S., Lee, S. D., Shin, S., Ahn, M.-H., Kang, M., Choi, Y.-S., Kim, G., Lee, D.-W., Kim, D.-R., Hong, H., Langerock, B., Vigouroux, C., Lerot, C., Hendrick, F., Pinardi, G., De Smedt, I., Van Roozendael, M., Wang, P., Chong, H., Cho, Y., and Kim, J.: First evaluation of the GEMS formaldehyde product against TROPOMI and ground-based column measurements during the in-orbit test period, Atmos. Chem. Phys., 24, 4733–4749, https://doi.org/10.5194/acp-24-4733-2024, 2024.
Liao, K., Chen, Q., Liu, Y., Li, Y. J., Lambe, A. T., Zhu, T., Huang, R.-J., Zheng, Y., Cheng, X., Miao, R., Huang, G., Khuzestani, R. B., and Jia, T.: Secondary Organic Aerosol Formation of Fleet Vehicle Emissions in China: Potential Seasonality of Spatial Distributions, Environ. Sci. Technol., 55, 7276–7286, https://doi.org/10.1021/acs.est.0c08591, 2021.
Lim, C. Y., Hagan, D. H., Coggon, M. M., Koss, A. R., Sekimoto, K., de Gouw, J., Warneke, C., Cappa, C. D., and Kroll, J. H.: Secondary organic aerosol formation from the laboratory oxidation of biomass burning emissions, Atmos. Chem. Phys., 19, 12797–12809, https://doi.org/10.5194/acp-19-12797-2019, 2019.
Liu, J., Li, X., Yang, Y., Wang, H., Kuang, C., Zhu, Y., Chen, M., Hu, J., Zeng, L., and Zhang, Y.: Sensitive Detection of Ambient Formaldehyde by Incoherent Broadband Cavity Enhanced Absorption Spectroscopy, Anal. Chem., 92, 2697–2705, https://doi.org/10.1021/acs.analchem.9b04821, 2020.
Palmer, P. I., Jacob, D. J., Fiore, A. M., Martin, R. V., Chance, K., and Kurosu, T. P.: Mapping isoprene emissions over North America using formaldehyde column observations from space, J. Geophys. Res., 108, https://doi.org/10.1029/2002jd002153, 2003.
Park, J.-U., Lim, S., Hanisco, T. F., Abuhassan, N., Place, B. K., Pandey, A., Cede, A., Tiefengraber, M., Gebetsberger, M., Park, J., Choi, J., Crawford, J. H., Song, C.-K., and Kim, S.-W.: Global analysis of nitrogen dioxide and formaldehyde column densities from the Pandora global network: Variability and implications for satellite validation, Remote Sens. Environ., 335, 115249, https://doi.org/10.1016/j.rse.2026.115249, 2026.
Pinardi, G., Van Roozendael, M., Abuhassan, N., Adams, C., Cede, A., Clémer, K., Fayt, C., Frieß, U., Gil, M., Herman, J., Hermans, C., Hendrick, F., Irie, H., Merlaud, A., Navarro Comas, M., Peters, E., Piters, A. J. M., Puentedura, O., Richter, A., Schönhardt, A., Shaiganfar, R., Spinei, E., Strong, K., Takashima, H., Vrekoussis, M., Wagner, T., Wittrock, F., and Yilmaz, S.: MAX-DOAS formaldehyde slant column measurements during CINDI: intercomparison and analysis improvement, Atmos. Meas. Tech., 6, 167–185, https://doi.org/10.5194/amt-6-167-2013, 2013.
Rawat, P., Crawford, J. H., Travis, K. R., Judd, L. M., Demetillo, M. A. G., Valin, L. C., Szykman, J. J., Whitehill, A., Baumann, E., and Hanisco, T. F.: Maximizing the scientific application of Pandora column observations of HCHO and NO2, Atmos. Meas. Tech., 18, 2899–2917, https://doi.org/10.5194/amt-18-2899-2025, 2025.
Spinei, E., Whitehill, A., Fried, A., Tiefengraber, M., Knepp, T. N., Herndon, S., Herman, J. R., Müller, M., Abuhassan, N., Cede, A., Richter, D., Walega, J., Crawford, J., Szykman, J., Valin, L., Williams, D. J., Long, R., Swap, R. J., Lee, Y., Nowak, N., and Poche, B.: The first evaluation of formaldehyde column observations by improved Pandora spectrometers during the KORUS-AQ field study, Atmos. Meas. Tech., 11, 4943–4961, https://doi.org/10.5194/amt-11-4943-2018, 2018.
Su, W., Liu, C., Chan, K. L., Hu, Q., Liu, H., Ji, X., Zhu, Y., Liu, T., Zhang, C., Chen, Y., and Liu, J.: An improved TROPOMI tropospheric HCHO retrieval over China, Atmos. Meas. Tech., 13, 6271–6292, https://doi.org/10.5194/amt-13-6271-2020, 2020.
Tanskanen, A., Krotkov, N. A., Herman, J. R., and Arola, A.: Surface ultraviolet irradiance from OMI, IEEE T. Geosci. Remote, 44, 1267–1271, https://doi.org/10.1109/tgrs.2005.862203, 2006.
Tian, X., Xie, P., Xu, J., Wang, Y., Li, A., Wu, F., Hu, Z., Liu, C., and Zhang, Q.: Ground-based MAX-DOAS observations of tropospheric formaldehyde VCDs and comparisons with the CAMS model at a rural site near Beijing during APEC 2014, Atmos. Chem. Phys., 19, 3375–3393, https://doi.org/10.5194/acp-19-3375-2019, 2019.
Tzortziou, M., Herman, J. R., Cede, A., and Abuhassan, N.: High precision, absolute total column ozone measurements from the Pandora spectrometer system: Comparisons with data from a Brewer double monochromator and Aura OMI, J. Geophys. Res., 117, D16303, https://doi.org/10.1029/2012jd017814, 2012.
Vigouroux, C., Bauer Aquino, C. A., Bauwens, M., Becker, C., Blumenstock, T., De Mazière, M., García, O., Grutter, M., Guarin, C., Hannigan, J., Hase, F., Jones, N., Kivi, R., Koshelev, D., Langerock, B., Lutsch, E., Makarova, M., Metzger, J.-M., Müller, J.-F., Notholt, J., Ortega, I., Palm, M., Paton-Walsh, C., Poberovskii, A., Rettinger, M., Robinson, J., Smale, D., Stavrakou, T., Stremme, W., Strong, K., Sussmann, R., Té, Y., and Toon, G.: NDACC harmonized formaldehyde time series from 21 FTIR stations covering a wide range of column abundances, Atmos. Meas. Tech., 11, 5049–5073, https://doi.org/10.5194/amt-11-5049-2018, 2018.
Zhu, L., Jacob, D. J., Kim, P. S., Fisher, J. A., Yu, K., Travis, K. R., Mickley, L. J., Yantosca, R. M., Sulprizio, M. P., De Smedt, I., González Abad, G., Chance, K., Li, C., Ferrare, R., Fried, A., Hair, J. W., Hanisco, T. F., Richter, D., Jo Scarino, A., Walega, J., Weibring, P., and Wolfe, G. M.: Observing atmospheric formaldehyde (HCHO) from space: validation and intercomparison of six retrievals from four satellites (OMI, GOME2A, GOME2B, OMPS) with SEAC4RS aircraft observations over the southeast US, Atmos. Chem. Phys., 16, 13477–13490, https://doi.org/10.5194/acp-16-13477-2016, 2016.
Zhu, L., Jacob, D. J., Keutsch, F. N., Mickley, L. J., Scheffe, R., Strum, M., González Abad, G., Chance, K., Yang, K., Rappenglück, B., Millet, D. B., Baasandorj, M., Jaeglé, L., and Shah, V.: Formaldehyde (HCHO) As a Hazardous Air Pollutant: Mapping Surface Air Concentrations from Satellite and Inferring Cancer Risks in the United States, Environ. Sci. Technol., 51, 5650–5657, https://doi.org/10.1021/acs.est.7b01356, 2017.