the Creative Commons Attribution 4.0 License.
the Creative Commons Attribution 4.0 License.
 | 01 Jul 2026
An ensemble machine-learning first-guess approach for physics-based retrieval of ice particle size distributions from multi-frequency radar, validated with CCREST-M aircraft observations
Anthony J. Baran
Stuart Fox
Richard Cotton
Julien Delanoë
Christopher J. Walden
Karina McCusker
Christopher D. Westbrook
Peter G. Huggard
The Characterising CiRrus and icE cloud acrosS the specTrum-Microwave (CCREST-M) aircraft campaign (February–March 2024) was based around the Chilbolton Observatory, UK, using the Facility for Airborne Atmospheric Measurements (FAAM) BAe-146 aircraft together with ground-based multi-frequency radars to provide a testbed for ice-cloud scattering and radiative transfer models across the microwave and sub-millimetre spectrum. Ice particle size distributions (PSDs) are retrieved from the ground-based zenith-pointing radars at the time of the radiometric overpasses, and the aircraft in-situ PSDs are used as an independent validation dataset.
We present a novel hybrid retrieval framework for mid-latitude ice PSD parameters (slope λ, intercept No, and shape μ of the gamma size distribution) that combines a machine-learning (ML) ensemble with physics-based multi-frequency radar retrievals using 3, 35, and 94 GHz reflectivities. An ensemble of ML models is trained on observations from the Parameterising Ice Clouds using Airborne ObServationS and triple-frequency dOppler radar (PICASSO) campaign, also centred on Chilbolton Observatory. These models predict PSD moments from temperature, pressure, 3 GHz-retrieved ice water content (IWC), and the mean mass-weighted dimension. The ML predictions are converted into first guess gamma-PSD parameters at each height. A subsequent deterministic optimisation then adjusts No and λ, using a randomly oriented rosette-aggregate scattering model, to enforce simultaneous agreement with the observed 35 and 94 GHz reflectivities.
Application of the above method to three CCREST-M cases show that the ML ensemble reproduces PSD moments well for two cases but fails when extrapolating beyond its trained temperature range in the third case. Retrieved IWCs from the 3 GHz radar compare favourably with in-situ measurements of IWC, and exponential (μ=0) and gamma PSD assumptions show comparable performance overall. Retrieved mean PSDs show generally good agreement with in-situ PSDs as a function of temperature for two of the cases, with IWCs within about 50 % of the in-situ measured IWCs over much of the −50 to −10 °C temperature range. The systematic biases seen in one case are attributed to temporal cloud evolution between radar and in-situ sampling. Independent validation using 200 GHz radar reflectivity profiles shows good agreement between the forward-modelled refllectivities and measurements above about 4.5 km. Below 4.5 km the agreement is more sparse owing to the likely presence of dendritic particles, which depart from the rosette-aggregate scattering assumption.
- Article
(9649 KB) - Full-text XML
- BibTeX
- EndNote


Accurate representation of ice crystal scattering properties and PSDs in cirrus and ice clouds is fundamental to improving numerical weather prediction and climate modelling (Liou, 1986; Baran, 2009, 2012; Yang et al., 2015; Liou and Yang, 2016; Krämer et al., 2025), and data assimilation (Geer and Baordo, 2014; Geer et al., 2017; Geer et al., 2021). Moreover, satellite missions such as EarthCARE (Earth, Clouds, Aerosols and Radiation Explorer; Illingworth et al., 2015; Mason et al., 2024; Barker et al., 2025) and the forthcoming Ice Cloud Imager (ICI; Eriksson et al., 2020; May et al., 2024) further heighten the need for realistic forward operators linking cloud microphysics to radar and radiometric observables.
The assimilation of radar reflectivity into weather prediction models has become increasingly important for improving convective precipitation forecasts, as radar reflectivity provides information on the vertical structure of hydrometeors, IWC and on cloud development. However, this requires accurate forward operators that link model state variables to radar observations (Janisková, 2015; Liu et al., 2024), placing stringent demands on ice crystal scattering representations. Earlier work by Baran et al. (2011) demonstrated that ensemble models of ice crystals could be used to simulate equivalent radar reflectivity at 94 GHz with forward model errors generally within ±2 dBZ. Subsequent studies have demonstrated that spheroidal approximations can bias retrieved water contents (Fontaine et al., 2017; Schrom and Kumjian, 2019), and studies that directly assimilate radar reflectivity from both rainwater and ice-phase species (i.e., snow and graupel) have shown that the ice species significantly improves the analysis of the vertical hydrometeor spatial distributions (Wang and Liu, 2019). Moreover, a study by Hong et al. (2025), building on the findings of Baran et al. (2011) and Wu et al. (2024), demonstrated that incorporating multiple ice habits in the retrieval of snowfall rate from passive microwave radiometers significantly improved retrieval accuracy compared to assuming single ice crystal habits. Polarimetric observations above 100 GHz have suggested that mixtures of random and oriented ice crystals may be needed to represent natural variability within the ice cloud (Brath et al., 2020; McCusker et al., 2024).
A further uncertainty in retrievals of ice cloud properties is the functional form of the PSD. Recent studies have shown contrasting results, with Bartolomé García et al. (2024) suggesting that bimodal PSDs may offer improved realism over monomodal representations, especially in complex cloud scenes. However, for larger particles – such as those found in snow, where radar reflectivity becomes more sensitive to the upper end of the size distribution – exponential forms are still widely used. For instance, Wood and L'Ecuyer (2021) argue for the adequacy of exponential PSDs in their W-band retrievals of snow properties based on observational evidence. Similarly, McCusker et al. (2024) adopted an exponential PSD assumption to retrieve the slope parameter while holding the intercept parameter fixed, to characterise PSDs in a frontal mid-latitude system using airborne 35 GHz radar measurements. Their retrievals were able to replicate the polarisation dependent brightness temperature depressions observed at 243 GHz using the International Sub-Millimetre Airborne Radiometer (ISMAR; Fox et al., 2017). Conversely, gamma distributions have been preferred in other studies. For instance, Heymsfield et al. (2023), analysing quadruple-frequency radar observations from the Investigation of Microphysics and Precipitation for Atlantic Coast-Threatening Snowstorms (IMPACTS) field campaign data, prefer gamma PSDs to characterise snowstorms. Using the same dataset, Duffy and Posselt (2022) found that a gamma distribution with best represented the mass- and reflectivity-related moments of the observed PSDs. These differences highlight the need for retrieval frameworks that can flexibly accommodate both exponential and gamma PSDs while remaining physically constrained by realistic scattering models.
Closure tests between ice-cloud scattering models and radiometric observations require a near one-to-one relationship between the PSDs used as input to the radiative transfer model and the radiometric measurements. Since a single research aircraft cannot simultaneously perform above-cloud radiometric measurements and in-situ microphysics sampling within the same cloud volume, we must retrieve the PSDs from ground-based multi-frequency radars that are co-incident with the radiometric overpasses. The CCREST-M campaign was designed to address this challenge by combining the FAAM BAe-146 aircraft measurements with co-located ground-based multi-frequency radars. The PSDs are then retrieved from the zenith-pointing radars at the same time as the radiometric overpasses, and the in-situ measured PSDs serve as an independent validation dataset. In this paper, we present a novel retrieval framework that combines an ensemble of machine learning models with physical radar retrievals to estimate PSD gamma parameters and IWC from 3, 35 and 94 GHz radar observations. The ML ensemble provides first-guess estimates of the PSD parameters from inputs of temperature, pressure, 3 GHz-retrieved IWC and the mean mass-weighted dimension, where the latter is estimated from a temperature-dependent second order polynomial obtained from the PICASSO climatology. A physical optimisation, using the scattering properties of randomly oriented rosette aggregates, is then used to modify λ and No, with μ kept as its first-guess profile values, at each height level so that simulated 35 and 94 GHz reflectivities match the observed values.
The retrieved PSDs are compared with the in-situ PSDs measured by the FAAM BAe-146 aircraft for three case studies, and the retrieval methodology is further evaluated using the G-band 200 GHz radar reflectivity observations from the Chilbolton Observatory GRaCE radar (Courtier et al., 2022). The G-band radar has recently been used by McCusker et al. (2025) to demonstrate the usefulness of such high-frequency radars to directly retrieve the IWC and snow rate of deep frontal mid-latitude cloud. This paper is the first demonstration of an ML-ensemble-assisted, physics-based radar retrieval of ice cloud PSDs validated with aircraft data. Although the same PICASSO climatology could in principle be used to define Bayesian priors in a classical optimal-estimation framework, we instead employ a machine-learning-based first guess. This approach implicitly captures the joint distribution of the local climatology without requiring an explicit multivariate error covariance and vertical correlation structure for (No, λ, μ) and keeps the subsequent physics-based optimisation computationally straightforward.
The paper is organised as follows: Section 2 describes the CCREST-M campaign, radars, and aircraft data. Section 3 outlines the ice crystal scattering model used in the forward operator, which is also formally defined in this section. Section 4 details the retrieval methodology, including the ML-ensemble approach developed using the PICASSO dataset, and the optimisation method applied to retrieve the PSD parameters and IWC from the radar reflectivity observations. Section 5 presents the retrieval results for the PSDs using three CCREST-M case studies, with detailed comparisons against in-situ aircraft measurements and forward-modelled radar reflectivities, including their residuals. Section 6 summarises the main findings and provides the conclusions.
The CCREST-M campaign combined coordinated FAAM BAe-146 aircraft measurements with ground-based radars at the Chilbolton Observatory, UK (51.15° N, 1.44° W; 84 m above mean sea level), to study the microphysical and mm-wave and sub-mm-wave radiative properties of mid-latitude ice clouds. Three radars operated near-synchronously: the 3 GHz CAMRa (Naud et al., 2005), the 35 GHz Kepler, and the 94 GHz mini-BASTA (Delanoë et al., 2016), providing complementary sensitivity across the particle-size spectrum. Detailed specifications for the 35 GHz Kepler radar are provided on the National Centre for Atmospheric Science Atmospheric Measurement and Observation Facility website: https://amof.ac.uk/instruments/mobile-cloud-radar/ (last access: 26 June 2026).
This campaign was explicitly designed to deliver multi-frequency active measurements together with near-simultaneous passive measurements extending into the sub-millimetre. In particular, Chilbolton Observatory hosted the multi-frequency radars, and for one of the cases the 200 GHz G-band GRaCE radar, while the FAAM aircraft carried the mm-wave and sub-mm-wave radiometers as well as the in-situ instrumentation. This combination enables the probing of the bulk microphysics with the lower-frequency radars and tests ice crystal scattering and radiative transfer models using the higher frequency radiometers. Since only one aircraft platform was available, CCREST-M could not obtain in-situ microphysical sampling at the same time and location as the radiometric overpasses. High-level radiometric legs and in-situ sampling had to be flown sequentially, so by the time the aircraft descended into the cloud the cloud volume sampled had evolved. In CCREST-M, the strategy is therefore to retrieve the PSDs from the ground-based multi-frequency radars at the time of the radiometric overpasses, and to use the in-situ PSDs from dedicated sampling legs as an independent validation dataset for the retrieved PSDs. This design, with a near one-to-one relationship between the retrieved PSDs and radiometric measurements makes CCREST-M a particularly stringent testbed for ice crystal scattering and radiative transfer models.
The CCREST-M strategy therefore differs from earlier campaigns such as the Cirrus Coupled Cloud-Radiation Experiment (CIRCCREX), the North Atlantic Waveguide and Downstream Impact Experiment (NAWDEX), and PIKNMIX-F, which have provided useful active and/or passive observations of ice cloud but suffered from inexact passive/active collocation or lacked in-situ observations. CCREST-M also builds upon the PICASSO campaign (Sephton, 2022), which collected in-situ bulk and microphysical properties of ice clouds using the FAAM BAe-146 aircraft, alongside co-located ground-based radar observations at 3, 35 and 94 GHz from Chilbolton Observatory, but lacked radiometric mm-wave and sub-mm-wave measurements to complement the multi-frequency radar measurements.
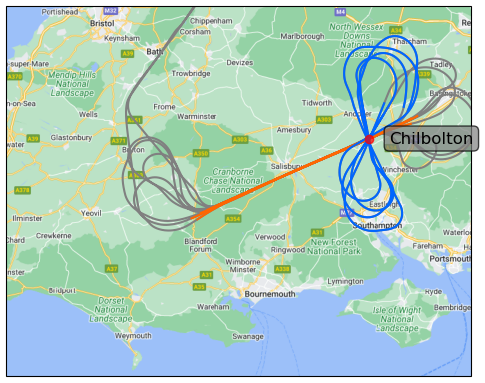
Figure 1A typical CCREST-M flight track (shown as the grey, orange and blue colours) towards and over the Chilbolton-based triple-frequency radars. The figure-of-eight patterns (blue) were flown over Chilbolton when all the radars were pointing at zenith. The aircraft flew along a specific flight path, known as the Chilbolton radial (orange), which is set at an angle of 246 or 270°. Figure created by Stuart Fox.
CCREST-M took place between the 6 February and 25 March 2024. Twelve science flights were conducted, three of which – C374 (28 February), C379 (19 March), and C382 (25 March) – included in-situ sampling of the bulk and microphysical properties of the cloud. The duration of each science flight was approximately 4 h and each followed a common flight pattern designed to link the ground-based radars and the radiometers in a repeatable way. Figure 1 shows a typical flight pattern; these consisted of straight and level runs along a radial (270 or 246°) to and from the Chilbolton-based radars, followed by figure-of-eight patterns centred on the Chilbolton Observatory. The decision on which radial to fly along was made in real time as the aircraft approached the Chilbolton area, in coordination with the radar operator. Range Height-Indicator (RHI) scans from mainly the 3 GHz CAMRa radar were used to identify the azimuth containing the deepest and most strongly reflecting ice cloud to ensure a good radiometric signal, and this information was augmented by 15 min 10 µm geostationary satellite imagery. During the radial legs the ground-based radars operated in RHI scanning mode, providing vertical profiles of cloud structure along the aircraft's flight path for radiometer sampling. During the figure-of-eight patterns the aircraft repeatedly flew over the Observatory while the radars were zenith pointing, yielding time–height reflectivity profiles directly beneath the aircraft, while the radiometers sampled the cloud in nadir pointing mode. During the high-level radiometric runs there were dropsonde releases from the aircraft above the cloud to obtain pressure and temperature profiles for use in the retrieval of the PSDs.
After the high-level radiometric overpasses and figure-of-eight loiter, the aircraft descended into the cloud for in-situ microphysics and bulk IWC sampling. For C379 and C382 this took the form of stepped descents with straight-and-level runs of several minutes at successive levels, whereas for C374 the aircraft performed a continuous profiling descent through the depth of the cloud. In all three cases, these in-situ legs act as an independent validation data set for the retrieved PSDs, although they are not strictly co-located with the ground-based radar observations.
2.1 Aircraft instrumentation, data summary, in-situ cases and ice crystal habit descriptions
The instrumentation on board the FAAM aircraft that is utilised in this paper is summarised below in Table 1. All the aircraft FAAM data listed in Table 1 is available on the Centre for Environmental Data Analysis (CEDA) website given here: https://www.ceda.ac.uk/ (last access: 26 June 2026). For a description of the microphysics and bulk probes shown in Table 1, the CIP-15, CIP-100 and the Nevzorov probe see McFarquhar et al. (2017) and Cotton et al. (2013), respectively. For each flight, the in-situ measurements are composited from the CIP-15 and CIP-100 instruments following Cotton et al. (2013), yielding size distributions from approximately 15 µm to 6.4 mm. The microphysics data processing done here is not different to that applied to the PICASSO campaign. However, here ice crystals smaller than 100 µm were omitted since they contribute negligibly to radar reflectivity and brightness temperature depressions at mm-wave and sub-mm-wave frequencies as shown by McCusker et al. (2024). Some PSDs were excluded if the Nevzorov probe measured IWCs below 0.002 gm−3, which is the estimated sensitivity of the Nevzorov probe as determined by Abel et al. (2014). Probe shattering effects were minimised through modified inlet arms of the CIP probes and inter-arrival time filtering when compositing the PSDs.
Table 1A summary of instrumentation on board the FAAM aircraft during the CCREST-M flights.
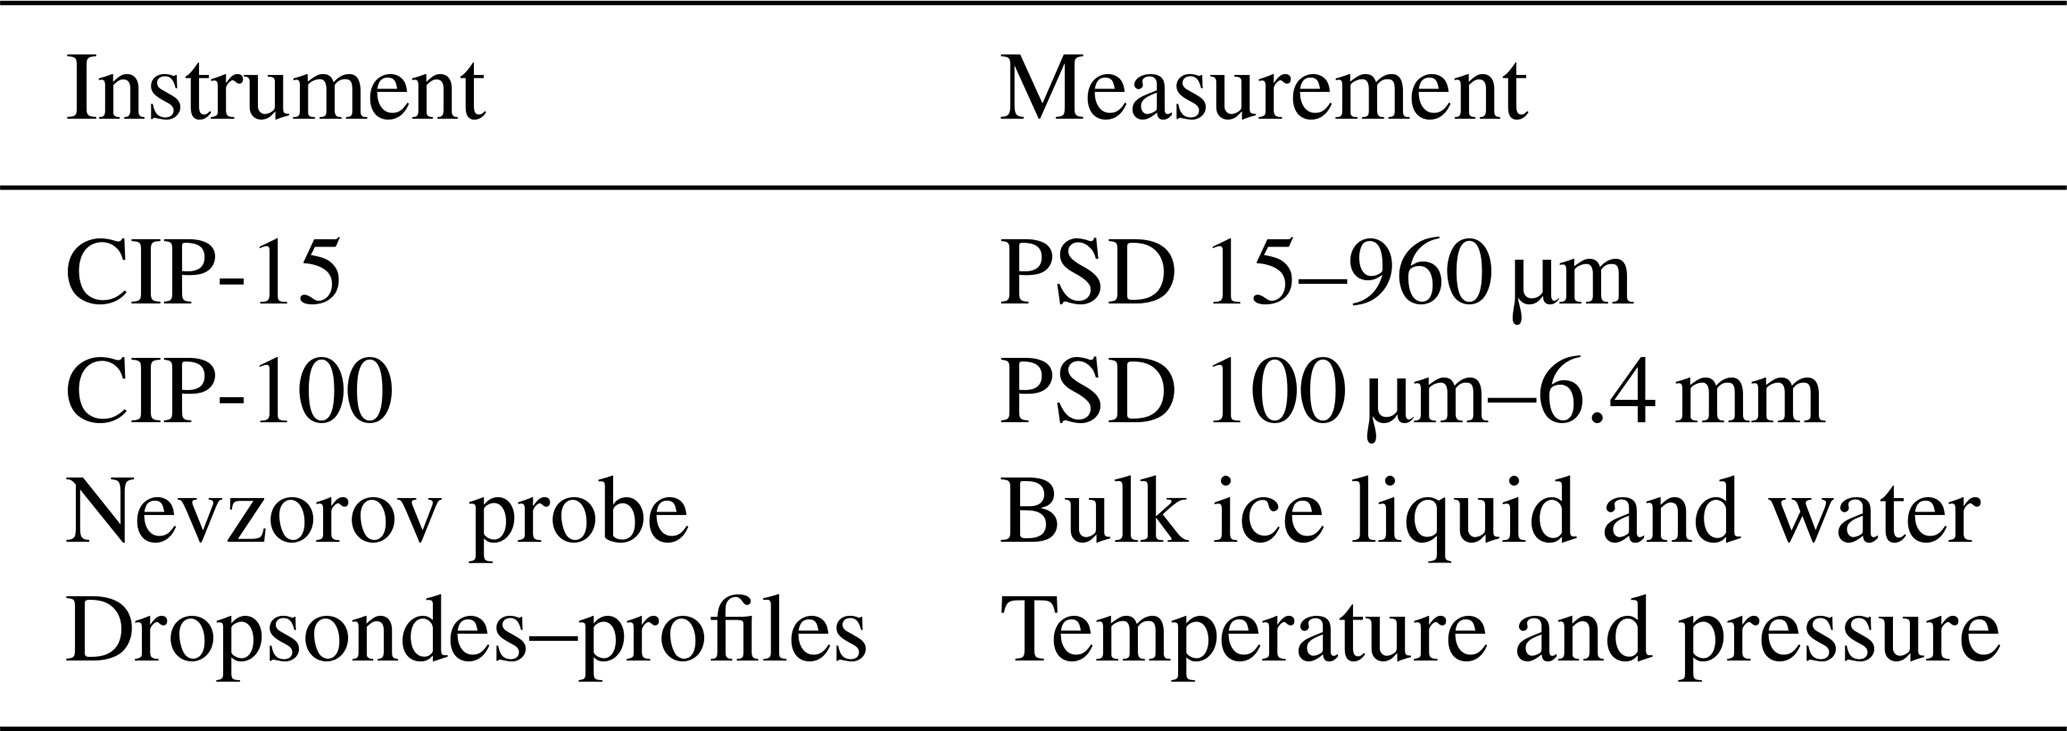
In this paper, the roles of the aircraft measurements are as follows. The composite in-situ PSDs are used as a validation dataset for the PSDs retrieved from the multi-frequency radars. The Nevzorov probe provides bulk IWC, which we compare directly to the IWCs derived from the retrieved PSDs. The dropsonde profiles provide temperature and pressure, which are both used as inputs to the machine-learning first-guess, together with the 3 GHz-retrieved IWC and mean mass-weighted dimension. Typically, two to four dropsondes were released from the aircraft above the cloud tops during each case, while the aircraft flew along one of the Chilbolton radials.
2.1.1 A data summary of the radar and atmospheric data
The processing of the radar data used here was done by the Chilbolton Observatory staff for the CAMRa and Kepler radar data. The CAMRa and Kepler radar data used in this paper are also available on the CEDA website referenced above. The mini-BASTA and 200 GHz GRaCE radar data were processed by the Laboratoire Atmosphère, Milieux, Observations, Spatiales (LATMOS) and the University of Reading, respectively. During the CCREST-M campaign, the radar measurements coincided with near-direct FAAM aircraft overpasses. The CAMRa, Kepler and mini-BASTA radars were operated in either zenith mode or Range-Height Indicator (RHI) scan mode during the aircraft overpass. The core overpass dataset was constructed from figure-of-eight aircraft flight patterns, with the radars pointing vertically, and extended datasets which includes the RHI scans. In this paper, we consider only the zenith-pointing radar data.
The data from the three main radars (CAMRa, Kepler and mini-BASTA) were interpolated to a common 25 m grid extending to an altitude of 13 km, matching the resolution of the Kepler radar. Reflectivity, Doppler velocity, and spectral width were extracted from each radar system, with signal quality control based on native instrument masks and angular thresholds (e.g. within 0.1° for Kepler, 0.4° for mini-BASTA) to exclude off-zenith and edge-of-beam artefacts. To characterise the radar reflectivity statistics for each of the case studies, the mean, median and the standard deviation were computed within a 40 s window (±20 s) centred on the aircraft nadir time for each of the radar frequencies. In the context of this study, these processed time–height fields provide the reflectivity profiles from which we retrieve the PSDs at the times of the aircraft radiometric overpasses for forthcoming radiative transfer studies that will be presented in a later paper. The 40 s window is a pragmatic choice that balances the need for enough radar samples to obtain robust statistics and to accommodate small timing differences between aircraft and radar data. In a few instances where no valid radar profiles were available during the 40 s window, we instead use the nearest available profiles in time, selected by visual inspection to ensure that the reflectivity structure was sufficiently similar to that during the overpass, and we only retained profiles with valid in-cloud returns.
Atmospheric temperature, pressure, humidity, and ozone profiles were provided using a combination of Vaisala RD41 dropsondes (for altitudes below aircraft level) and a mid-latitude winter climatology (for levels above the aircraft and ozone). Temperature and pressure were linearly interpolated onto the radar grid, and relative humidity was computed with respect to liquid or ice depending on the ambient temperature.
To account for liquid water cloud attenuation, cloud liquid water path (LWP) was retrieved from the Chilbolton HATPRO microwave radiometer (Walden, 2026a), with missing data interpolated over short time gaps. The HATPRO LWP provides a column integrated value and does not constrain the vertical distribution of liquid water. We therefore assume the liquid cloud to be a single layer, with a representative in-cloud temperature taken from the interpolated atmospheric profile, where the cloud top height was manually defined using the ceilometer (Walden, 2026b), lidar, and radar backscatter profiles. The specific liquid water absorption at each radar frequency was computed from the Ellison (2007) absorption model at this representative temperature and multiplied by the HATPRO LWP to give the one-way attenuation. Two-way attenuation by ice crystals at 35 and 94 GHz is not accounted for in this paper. It was previously found by McCusker et al. (2024) that for similar frontal iced-cloud conditions the two-way path integrated ice attenuation at these frequencies to be well below 1 dBZ. This is consistent with the recent multi-campaign comparison by Li et al. (2026), who reported a median W-band path-integrated snow attenuation of 0.3 dB and a sub-dB spread between parametrisations. Therefore, ice attenuation is not corrected for explicitly in this paper. To account for gaseous attenuation by oxygen and water vapour on the radar reflectivities at 35 and 94 GHz, we computed the two-way partial-column gaseous attenuation from near-surface to each in-cloud retrieval gate using the aircraft dropsonde-derived profiles of temperature, pressure and water vapour volume mixing ratio released near the Chilbolton Observatory. A simplified gas absorption parametrisation was used, consisting of pressure-scaled oxygen absorption and humidity-scaled water vapour absorption, with coefficients providing representative specific attenuation values of 0.02, and 0.1 dB km−1 for oxygen, and 0.01, and 0.08 dB km−1 for water vapour at 35 and 94 GHz, respectively, under standard atmospheric conditions as recommended by ITU-R P676.13 (2022). The mean partial-column two-way attenuation at 94 GHz reaches approximately 1.5 dB at 94 GHz for C374, this is consistent with Hogan et al. (2000), who using co-located 35 and 94 GHz radars at Chilbolton Observatory reported a two-way gaseous attenuation at 94 GHz of approximately 2 dB from near-surface to 10 km. At 3 GHz, gaseous attenuation is negligible (specific attenuation values of order 0.001 dB km−1 for oxygen and zero for water vapour) and is not considered further.
This dataset enables the construction of well-collocated multi-frequency radar reflectivity profiles, corrected for atmospheric and liquid water attenuation, with matched atmospheric profiles needed for the retrievals and radiative transfer. Here, we utilise only the mean radar reflectivity radar profiles.
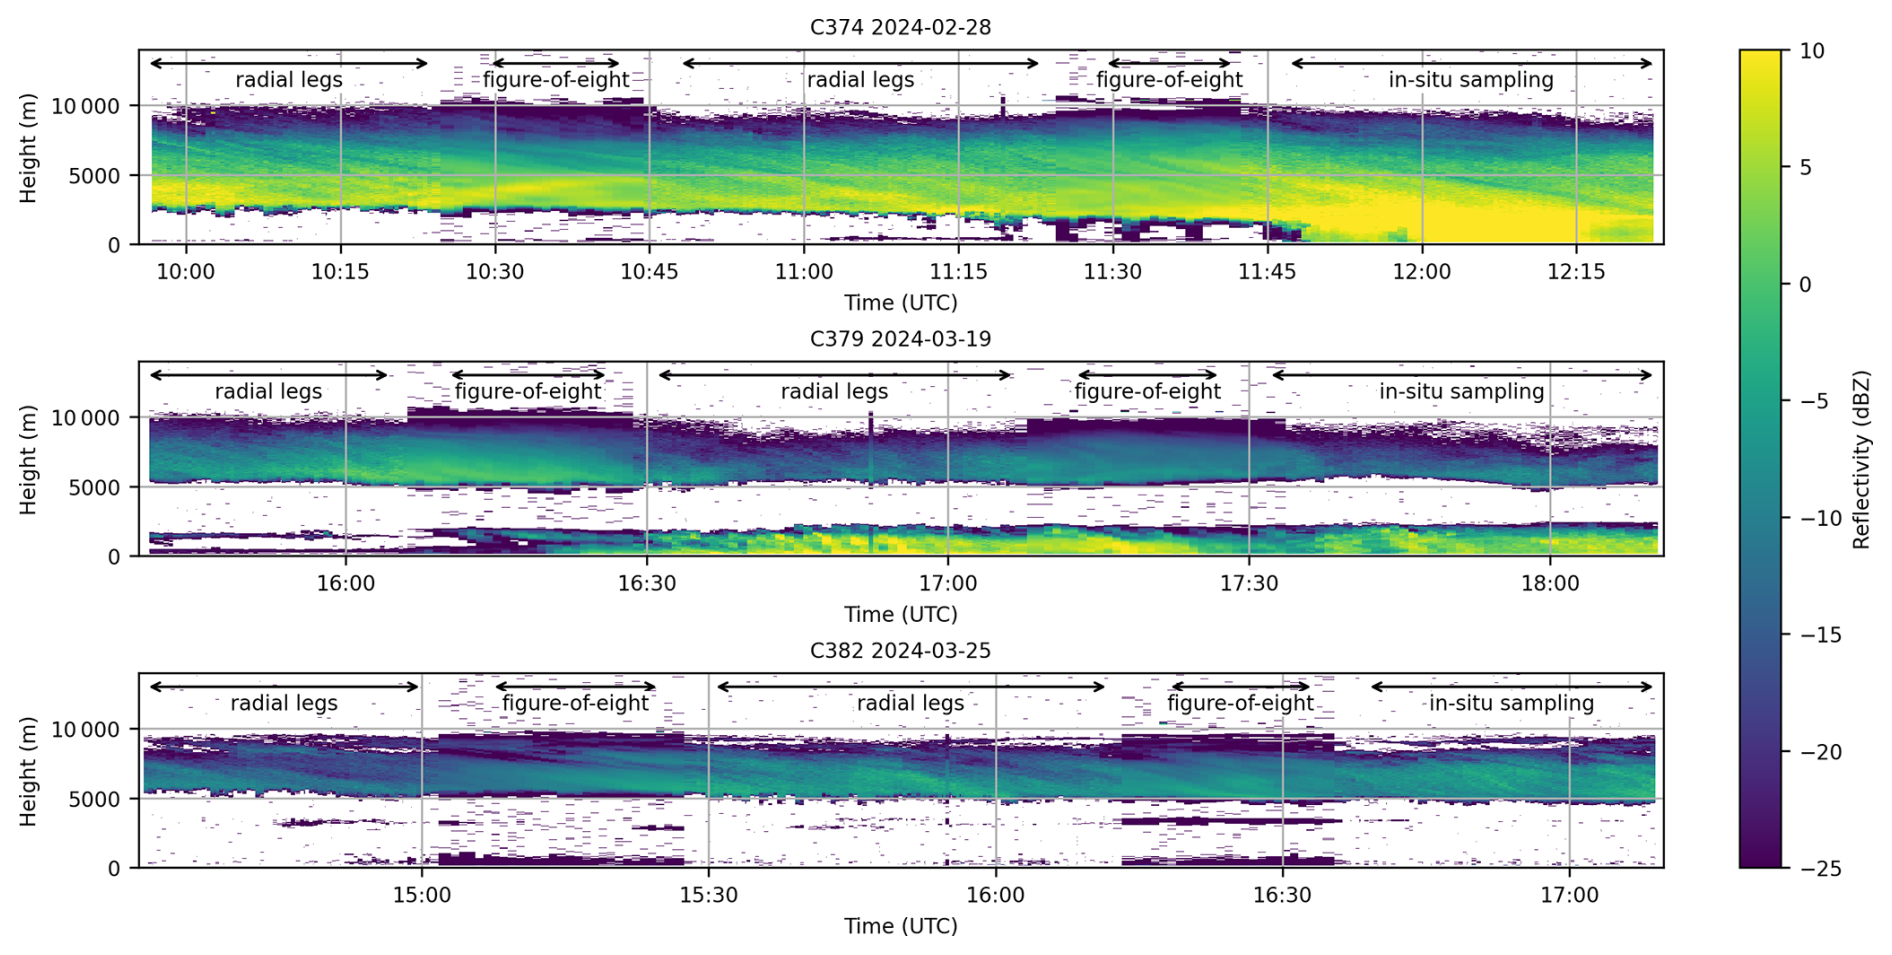
Figure 2Time–height cross-sections of 35 GHz Kepler radar reflectivity for the three CCREST-M cases: C374 (28 February 2024, top panel), C379 (19 March 2024, middle panel), and C382 (25 March 2024, bottom panel). Colours show the radar reflectivity (dBZ) at the native time–height resolution of the complete (i.e., RHI and Zenith-pointing data) processed Kepler dataset, with white areas indicating the absence of cloud or values below the noise threshold. The time periods used for the aircraft radial legs, figure-of-eight manoeuvres, and in-situ sampling are indicated at the top of each panel. The 35 GHz radar is shown here as it provides a good compromise between sensitivity to ice crystals and susceptibility to attenuation. The colour bar on the right-hand side provides the radar reflectivity scale.
2.1.2 Case summaries and predominant ice crystal habits
The synoptic environments of the three flights were typical of winter mid-latitude frontal systems over the UK, with non-precipitating cloud during the science flying for C374 and weakly precipitating ice clouds during the science flying for C379 and C382. Figure 2 summarises the temporal and vertical structure of the three CCREST-M cases using time–height plots of 35 GHz Kepler radar reflectivity. For C374 (Fig. 2, top panel), a deep frontal ice cloud is observed, with radar reflectivities ranging from approximately +10 to −25 dBZ between about 3 to 9 km for over two hours. Above about 9 km, the radar detects weaker and more intermittent returns, consistent with sparse upper-level ice cloud. Scientific flying for this case concluded at around 11:45 UTC as significant precipitation began. For C379 (Fig. 2, middle panel), the primary ice layer is located between about 5 and 9 km. Below about 2 km, stronger and more variable reflectivities indicate the presence of an underlying liquid water cloud, which occasionally produced light precipitation of around 1 mm h−1 at the surface, as recorded by the Observatory rain gauges. The C382 (Fig. 2, bottom panel) case exhibits a somewhat generally thinner main ice layer than in the other cases, extending from roughly 5 to 8 km. A shallow cirrus layer is present just below approximately 9 km, with a thickness of less than 1 km, and occasional low level-level liquid water cloud is also detected by the Kepler radar. For the cases C374 and C382, the liquid water paths were typically below 0.2 g m−2. Overall, these time–height cross-sections confirm that all three cases correspond to mid-latitude frontal ice cloud with relatively persistent vertical structure, making them well suited for the radiometric overpasses and radar-based PSD retrievals.
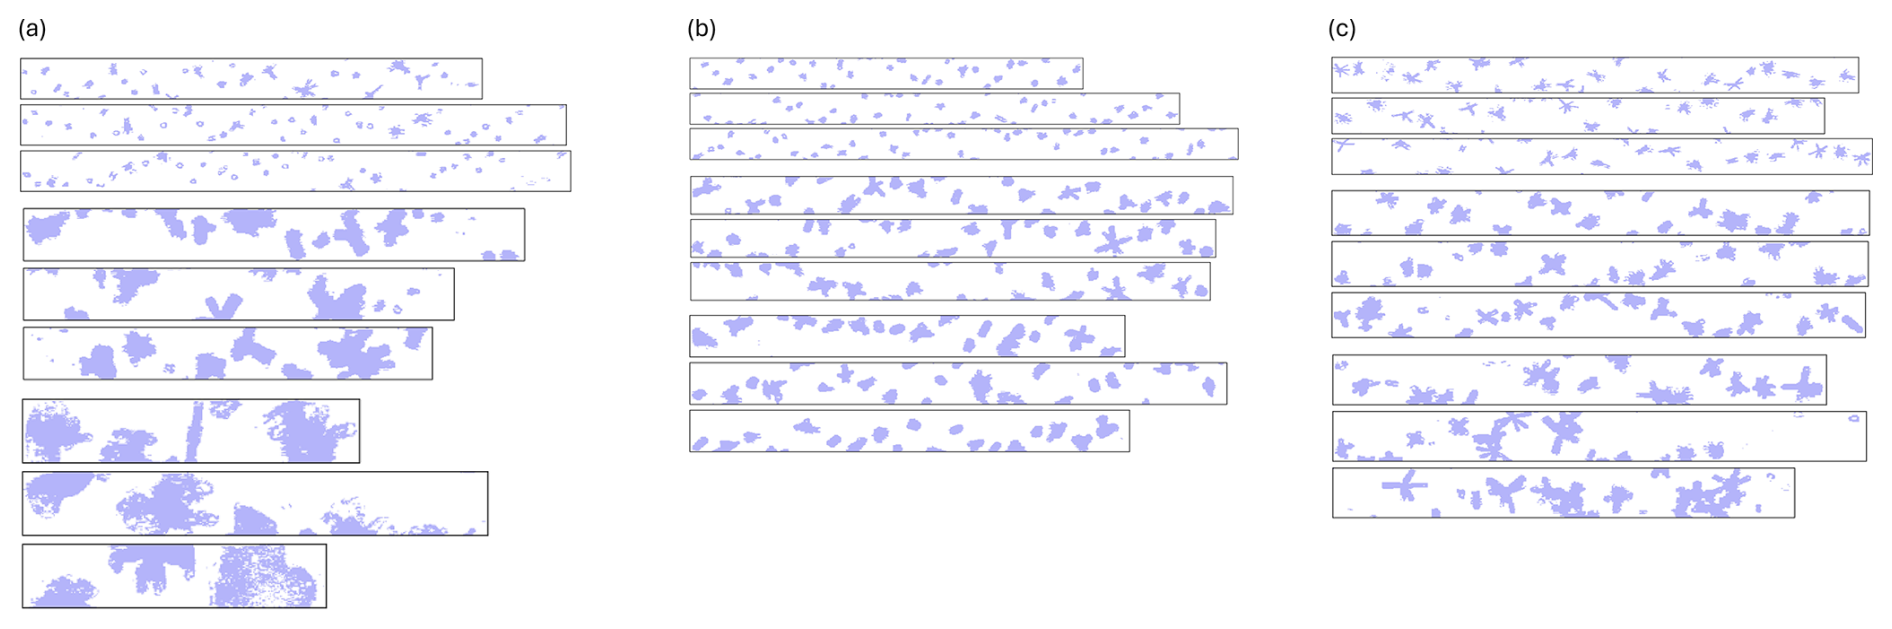
Figure 3Representative CIP-15 imagery obtained during three distinct altitude levels. In each panel, the top three rectangular strips correspond to cloud top, followed by the next three representing the cloud mid-level, and the bottom three rectangular strips represent the cloud base during descent through the ice layer for cases (a) C374, (b) C379, and (c) C382. Each rectangular strip spans 64 pixels across the CIP-15 array, corresponding to a physical width of 960 µm at 15 µm per pixel. The length of each strip is variable.
The most detailed analysis of C374 has already been reported by McCusker et al. (2025), who also provide a detailed description of the observed ice crystal habits for that case. Consistent with that study, examination of CIP-15 imagery from all three flights shows rosettes and aggregates of rosettes as the dominant particle types, with occasional columns, plates, and aggregates of columns. Typical examples of the CIP-15 imagery from the three cases are presented in Fig. 3a–c, where the image files were manually examined to identify the predominant ice crystal shapes across different altitudes, and the imagery is taken from the mid-point of each profile. Across all the three cases, a similar vertical evolution of ice crystal habit was observed as shown in the figure. That is, near cloud top the habits consisted of small, pristine rosettes and some columns. At mid-level in the cloud, larger more complex rosette aggregates were observed and at near cloud base, extensive irregular rosette aggregates and occasional columns and column aggregates were observed.
Although the three ice cloud cases differ in altitude and temperature, their microphysical ice crystal shape characteristics were broadly consistent, making them ideal cases for testing the retrieval methodology under comparable mid-latitude conditions. The same rosette-aggregate habits observed here underpin the scattering assumptions described in Sect. 3.
The scattering properties assumed in this study are based on the randomly oriented rosette-aggregate model described in detail by Kleanthous et al. (2024). The model represents an ensemble of rosette aggregates generated using the aggregation model of Westbrook et al. (2004) and constrained to follow the Cotton et al. (2013) mass–dimension relationship, given by , where Dm is the maximum dimension of the ice crystal expressed in SI units, consistent with the Met Office two-moment microphysics scheme, see for details Field et al. (2023). The aggregates are constructed from solid three-branched rosette monomers and are assumed to be randomly oriented in 3-D space.
The ensemble comprises of 65 rosette-aggregate realisations spanning maximum dimensions between 10 µm and approximately 1 cm, representative of the dominant habits observed during CCREST-M, as previously discussed in Sect. 2.1.2, and consistent with the findings reported by Lawson et al. (2019) and Wagner et al. (2025) in the case of in-situ generated cirrus, typical of the mid-latitudes. Full details of the model generation, morphology, and mass– and area–dimension power laws are described by Kleanthous et al. (2024). Although referred to as the rosette-aggregate model, this representation does not correspond to a single ice type. As detailed in Kleanthous et al. (2024), the aggregates are composed of rosettes but evolve into different structural forms as they grow, with morphology varying systematically when mass scales with the square of their maximum dimension. For each of the rosette-aggregates, the backscattering cross section, σb(Dm), is computed using the electromagnetic boundary element method (BEM) described by Kleanthous et al. (2022). The rosette-aggregate scattering model has been shown by Baran et al. (2024) to reproduce triple-frequency radar reflectivity measurements at 9, 35 and 94 GHz to within a few dBZ for various mid-latitude and mixed-phase cloud systems that were observed off the north-east coast of the United States during the IMPACTS campaign. Therefore, the rosette-aggregate model is utilised in this paper as the representative ice crystal habit for the retrievals.
3.1 The forward radar reflectivity model
From the BEM calculations, solutions found for σb are used to forward model the equivalent radar reflectivity factor, Ze, where the units of Ze are mm6 m−3 and are transformed into units of dBZ via 10log 10(Ze), and Ze (Atlas et al., 1995; Hong et al., 2008; Baran et al., 2011, and references therein) is calculated following Eq. (1):
The measured reflectivities from CAMRa, Kepler, mini-BASTA and GRaCE are provided as equivalent radar reflectivity factor Ze in dBZ. These values are computed using the standard definition of water-equivalent reflectivity, i.e., assuming scattering from water spheres and using the same definition as Eq. (1). For our forward model, we adopt the same convention, with , where λ is the incident wavelength in m, and is the dielectric factor of liquid water. This dielectric factor is both frequency and temperature dependent as discussed by Hogan et al. (2006) and in that paper at ≈270 K for 35 and 94 GHz is 0.88 and 0.67, respectively. At 3 GHz, we use the value of 0.93, and at 200 GHz we use the value used by McCusker et al. (2025) to be consistent with that paper, which was also 0.93. For the cases described by Baran et al. (2024), it was shown that the equivalent radar reflectivity factor has only a weak dependence on temperature and differences in radar reflectivity between the different temperatures was found to be ≪1 dBZ. The other terms used in Eq. (1) are the backscattering cross section, σb(Dm), in units of m2 and n(Dm), the assumed PSD in units of m4. The complex refractive indices of ice for 3, 35, 94 and 200 GHz, assuming a temperature of 270 K, have been determined from the tabulation due to Mätzler (2006). This set of refractive indices for ice has been previously recommended by Eriksson et al. (2018). In Eq. (1), the factor 1018 is required to convert the units of the integrand into the units of Ze. We next consider the PSD assumptions for n(Dm), the ML approach and retrieval methodology.
In radar studies, the PSD models used to represent snow crystals or ice aggregates are most commonly gamma or exponential size distributions, see for instance the studies by Heymsfield et al. (2023), and Kozu and Nakamura (1991). The well-known gamma size distributions are calculated following Eq. (2):
where No, λ and μ represent the intercept parameter, the slope, and the shape parameter of the size distribution, respectively. The units of No and λ are m−4 and m−1, respectively. In Eq. (2), the exponential PSD is represented when μ=0. The PSD parameters No, λ and μ can be estimated from the moments of the PSD, where the nth moment of the PSD, Mn, is calculated following Eq. (3):
It follows from Kozu and Nakamura (1991) that μ, λ, and No can be estimated from the PSD moments following Eqs. (4)–(6):
where , and
and No is given by:
where Γ is the gamma function.
Another useful microphysical parameter to derive is the mean mass-weighted diameter (Dmmw) given by the ratio of on the assumption that mass is proportional to the maximum dimension of the ice crystal raised to the power of two. Here, we consider ice aggregation at radar frequencies assuming the Cotton et al. (2013) mass–dimension power law and this relationship is consistent with our definition of Dmmw. From the PICASSO campaign that took place over the Chilbolton Observatory, from those measured PSDs, all three of the model PSD parameters can be estimated from Eqs. (4)–(6), and from these the PSDs can be generated from Eq. (2). Therefore, here, we require to retrieve No, λ and μ from the multi-frequency radar reflectivities measured during CCREST-M. Note also, that F from above is determined from M3, M4 and M6, where M4 for the assumption of ice aggregation is more related to the radar reflectivity since in this case the radar backscatter is proportional to the square of the mass and M6 further enhances the contribution of larger particles that dominate the radar signal. This is the reason as to why we adopt the definitions of Kozu and Nakamura (1991) in this paper to retrieve the PSDs.
Here, we make use of the in-situ measured PSDs from the PICASSO campaign, which was also conducted over the Chilbolton Observatory, where data were collected from ten flights that we utilise in this paper. The approach adopted here is based on the meteorological principle that mid-latitude cirrus clouds observed over the same geographical location should exhibit similar microphysical characteristics when sampled across similar time periods, assuming no significant climate shifts. By constructing a moment climatology from the PICASSO dataset, we can establish a baseline of cloud properties specific to the Chilbolton region. This climatology should reasonably represent the cloud structures encountered during the CCREST-M period of flying, as both campaigns targeted similar cloud systems in the same geographical location under comparable synoptic conditions during a similar period. Therefore, the moment climatology derived from PICASSO should provide valid prior information for CCREST-M retrievals within the sampled temperature range of the PICASSO campaign.
To construct the moment climatology, we utilise nine PICASSO flights, which are C076, C082, C098, C155, C169, C170, C171, C172, and C174, available from the CEDA website. We use these flights to obtain the profile of moments M2, M3, M4, and M6, – that is, the variation of these quantities as a function of altitude – as well as profiles of in-cloud temperature, Tc, pressure, p, and bulk IWC from the Nevzorov probe. Data from flight C081 is kept as the “unseen” data to evaluate our ML models, as this flight is broadly representative of the others in terms of temperature and IWC ranges. The ML regression-based approach adopted in this study is described in the following sub-section.
4.1 The ensemble of machine learning models and results
The ensemble of ML models we utilise are from Python's scikit-learn (Pedregosa et al., 2011), this ensemble approach is used to predict the moments of the PSD that will serve as first-guess inputs for the physical retrieval of IWC and the previously described PSD parameters. In this ML model, the feature vector, x, consists of:
- (i)
log 10(Dmmw), where Dmmw is in units of µm,
- (ii)
log 10(IWC), where IWC is in units of g m−3,
- (iii)
log 10(p), where p is in units of hPa, and to be consistent with all other feature spaces,
- (iv)
log 10(Tc), where Tc is in units of Kelvin.
For each moment log 10(Mn) where , we train a separate ML model, fn, such that:
where in Eq. (7) the log 10 symbol has been dropped for reasons of clarity.
For training the ML models we use the PICASSO climatology described above using the nine flights. From these flights we diagnose vertical profiles of the PSD moments M2, M3, M4, M6, Tc, p, bulk IWC from the Nevzorov probe, and Dmmw as defined above. However, in the CCREST-M application, Dmmw is not directly observed and is instead estimated from the empirical Dmmw(Tc) relationship derived from the PICASSO dataset (see Sect. 4.2), so that the same set of predictors can be used. From the feature space given by Eq. (7), the targets of the ML models are the logarithms of the PSD moments, log 10(Mn) for , and 6. Although Dmmw is strongly correlated with Tc in the PICASSO climatology, it is not a deterministic function of Tc, since for a given Tc there can be considerable variation in Dmmw. Including both Dmmw and Tc in vector x provides the ML models with complementary information representing the thermodynamics through Tc and p and the cloud physics through IWC and Dmmw. For each target moment log 10(Mn), we train a separate regression model fn(x) using an ensemble of ML models using the default hyperparameter settings to maintain simplicity and reproducibility. The ML models in the ensemble are the random forest regressor, gradient boosting regressor, and support vector regression. For the random forest regressor the “shuffle” parameter is set to “false” as the dataset is a time series and by setting this parameter to “false” we ensure that data from the prediction dataset were not randomly selected to be a part of the training dataset. Therefore, in the presentation of results that follow, the prediction dataset in unseen in the training dataset. The resulting predictions from each of the ML models are simply arithmetically averaged to find the prediction of the ensemble. This approach allows us to predict log 10(Mn) given f(x), required for the retrieval algorithm.
We first evaluate the ensemble approach using a standard 80:20 split of the PICASSO climatology dataset, where 80 % of the data are used for the training data, and the remaining 20 % are used for the validation dataset. The ensemble predictions for each target moment log 10(Mn) are compared with the actual values in Fig. 4a–d. The hexagonally binned scatter plots show that the ensemble ML predictions cluster tightly about the 1:1 line for all the four moments, which indicates excellent agreement between predicted and true values across the full range of values. The mean-squared errors found for log 10(M2), log 10(M3), log 10(M4), and log 10(M6) are 0.016, 0.0006, 0.003, and 0.006, respectively, demonstrating that the ensemble of ML models reproduces the logarithmic moments of the PSD with high accuracy. For comparison, using the default random forest model alone resulted in substantially larger mean-squared errors for log 10(M2), log 10(M3), log 10(M4), and log 10(M6) which were found to be 0.1, 0.103, 0.12, and 0.191, respectively. Clearly, from these results, the ensemble ML model is better to use for the prediction of the required moments than a single ML model. The full results of comparisons are not shown here for reasons of brevity.
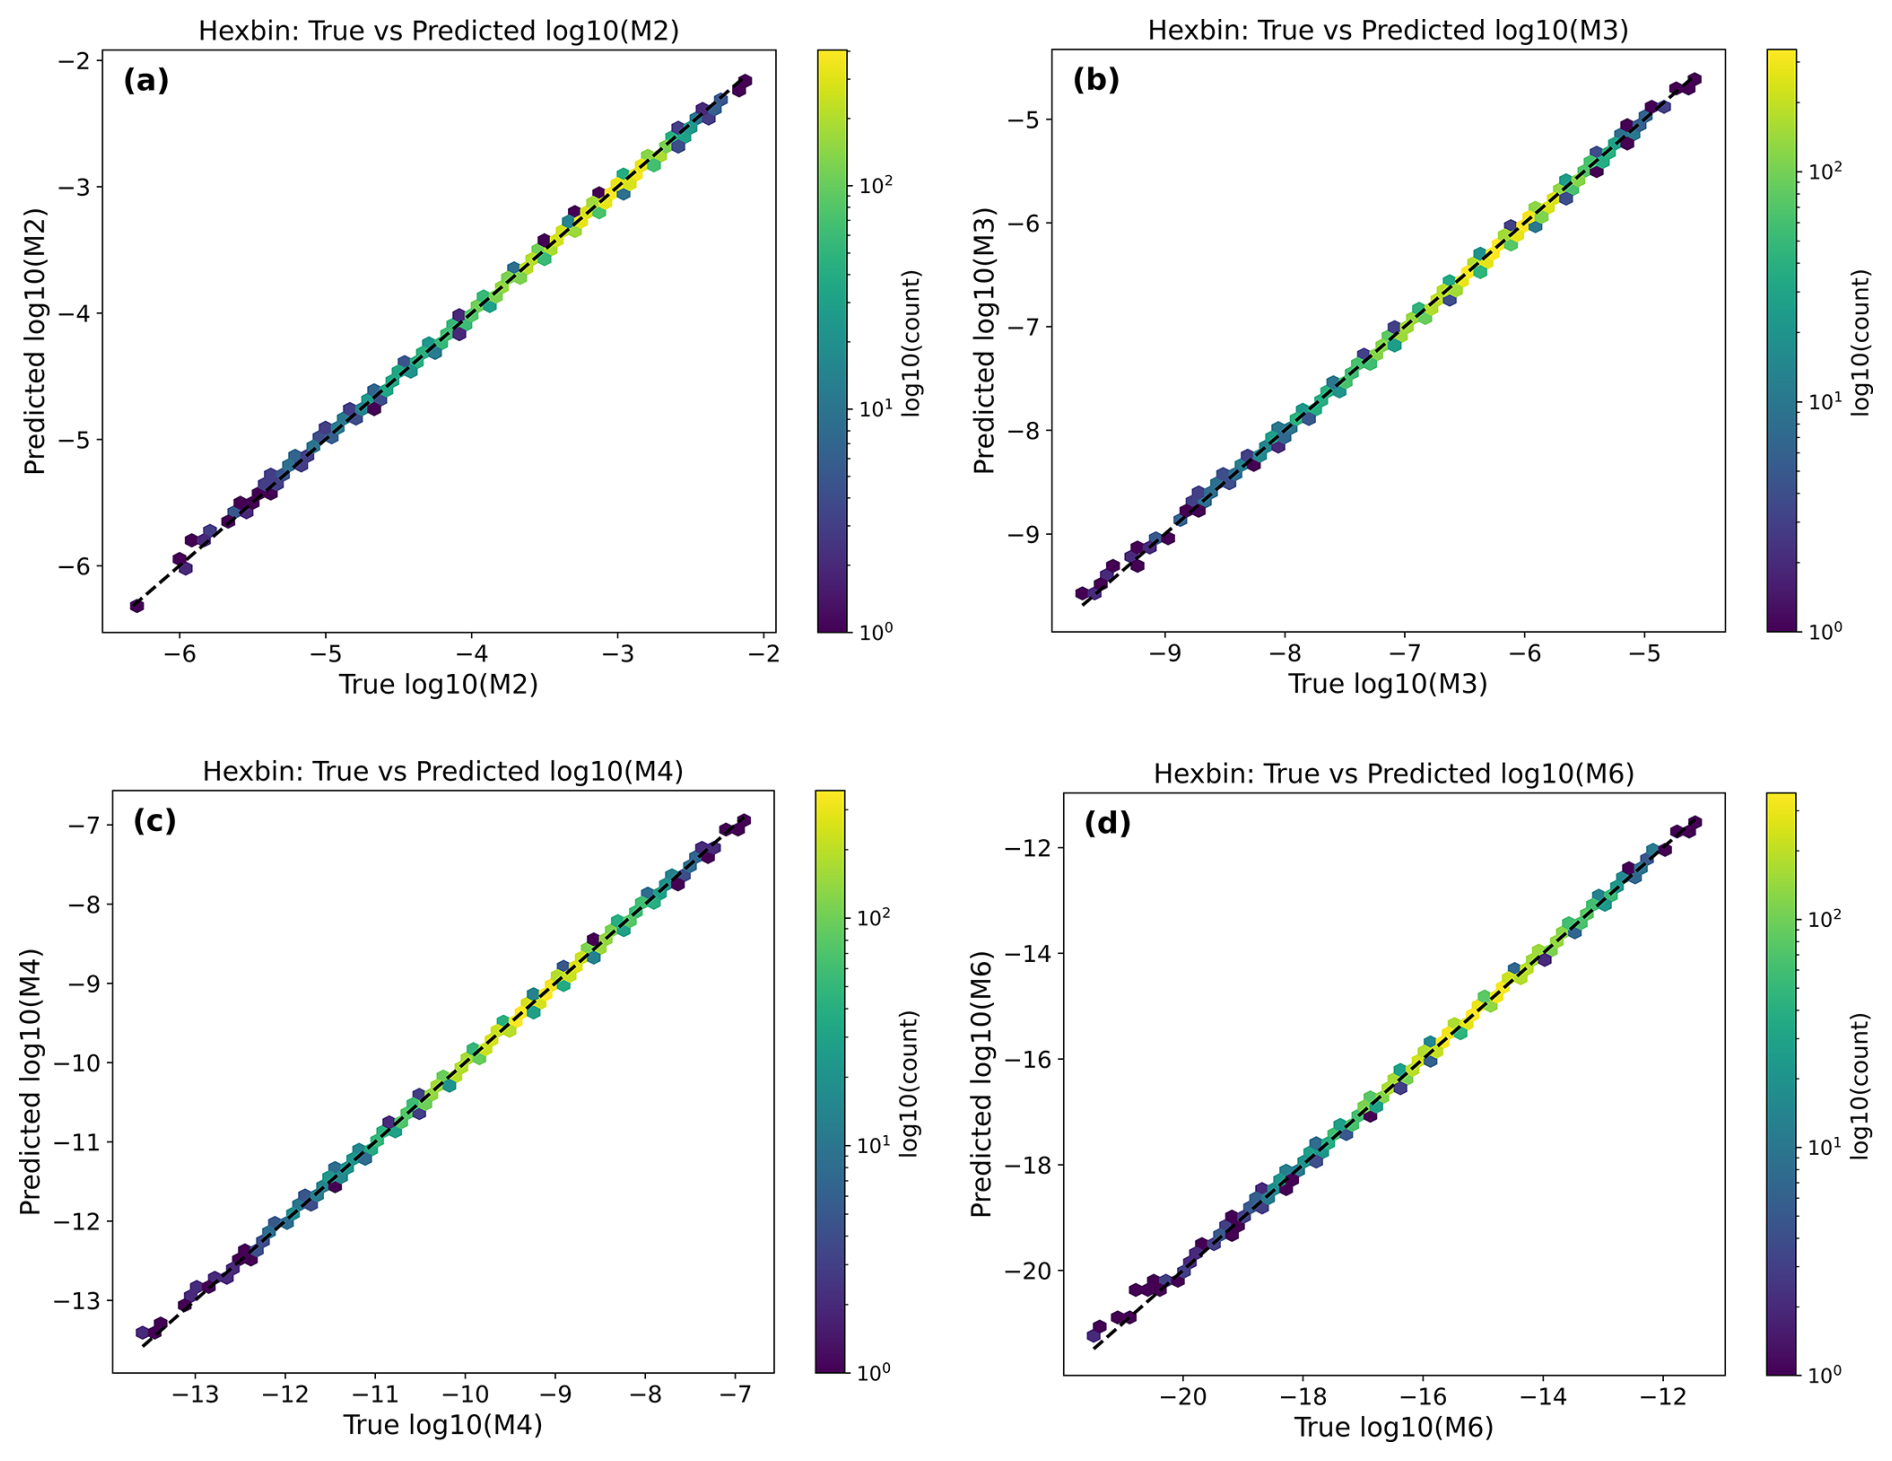
Figure 4Hexagonally binned scatter plots of predicted versus true log 10(Mn) from the ensemble of ML models for the PICASSO validation subset for (a) n=2, (b) n=3, (c) n=4, and (d) n=6. The colour scale shows the logarithm to the base 10 of the number of points in each of the hexagonal bins and the dashed line in each of the panels indicates the 1:1 line.
Given the results for testing and prediction, the moment predictions for the unseen data from the PICASSO case C081 using the ensemble ML model are presented in Fig. 5a–d. Here, rather than presenting statistical representations of how well the predicted moments match the actual moments for C081, we present the moment comparisons in physical space. The figure demonstrates that the predicted re-transformed moments back to physical space compare generally very well with the variability of the actual moments from C081 as a function of temperature. The results depicted in Fig. 5a–d do indeed suggest that ML can be applied to predict the moments of unseen data, and as such ML can provide a good first guess profile for the PSD parameters in a physical retrieval of the microphysics using observed radar reflectivities.
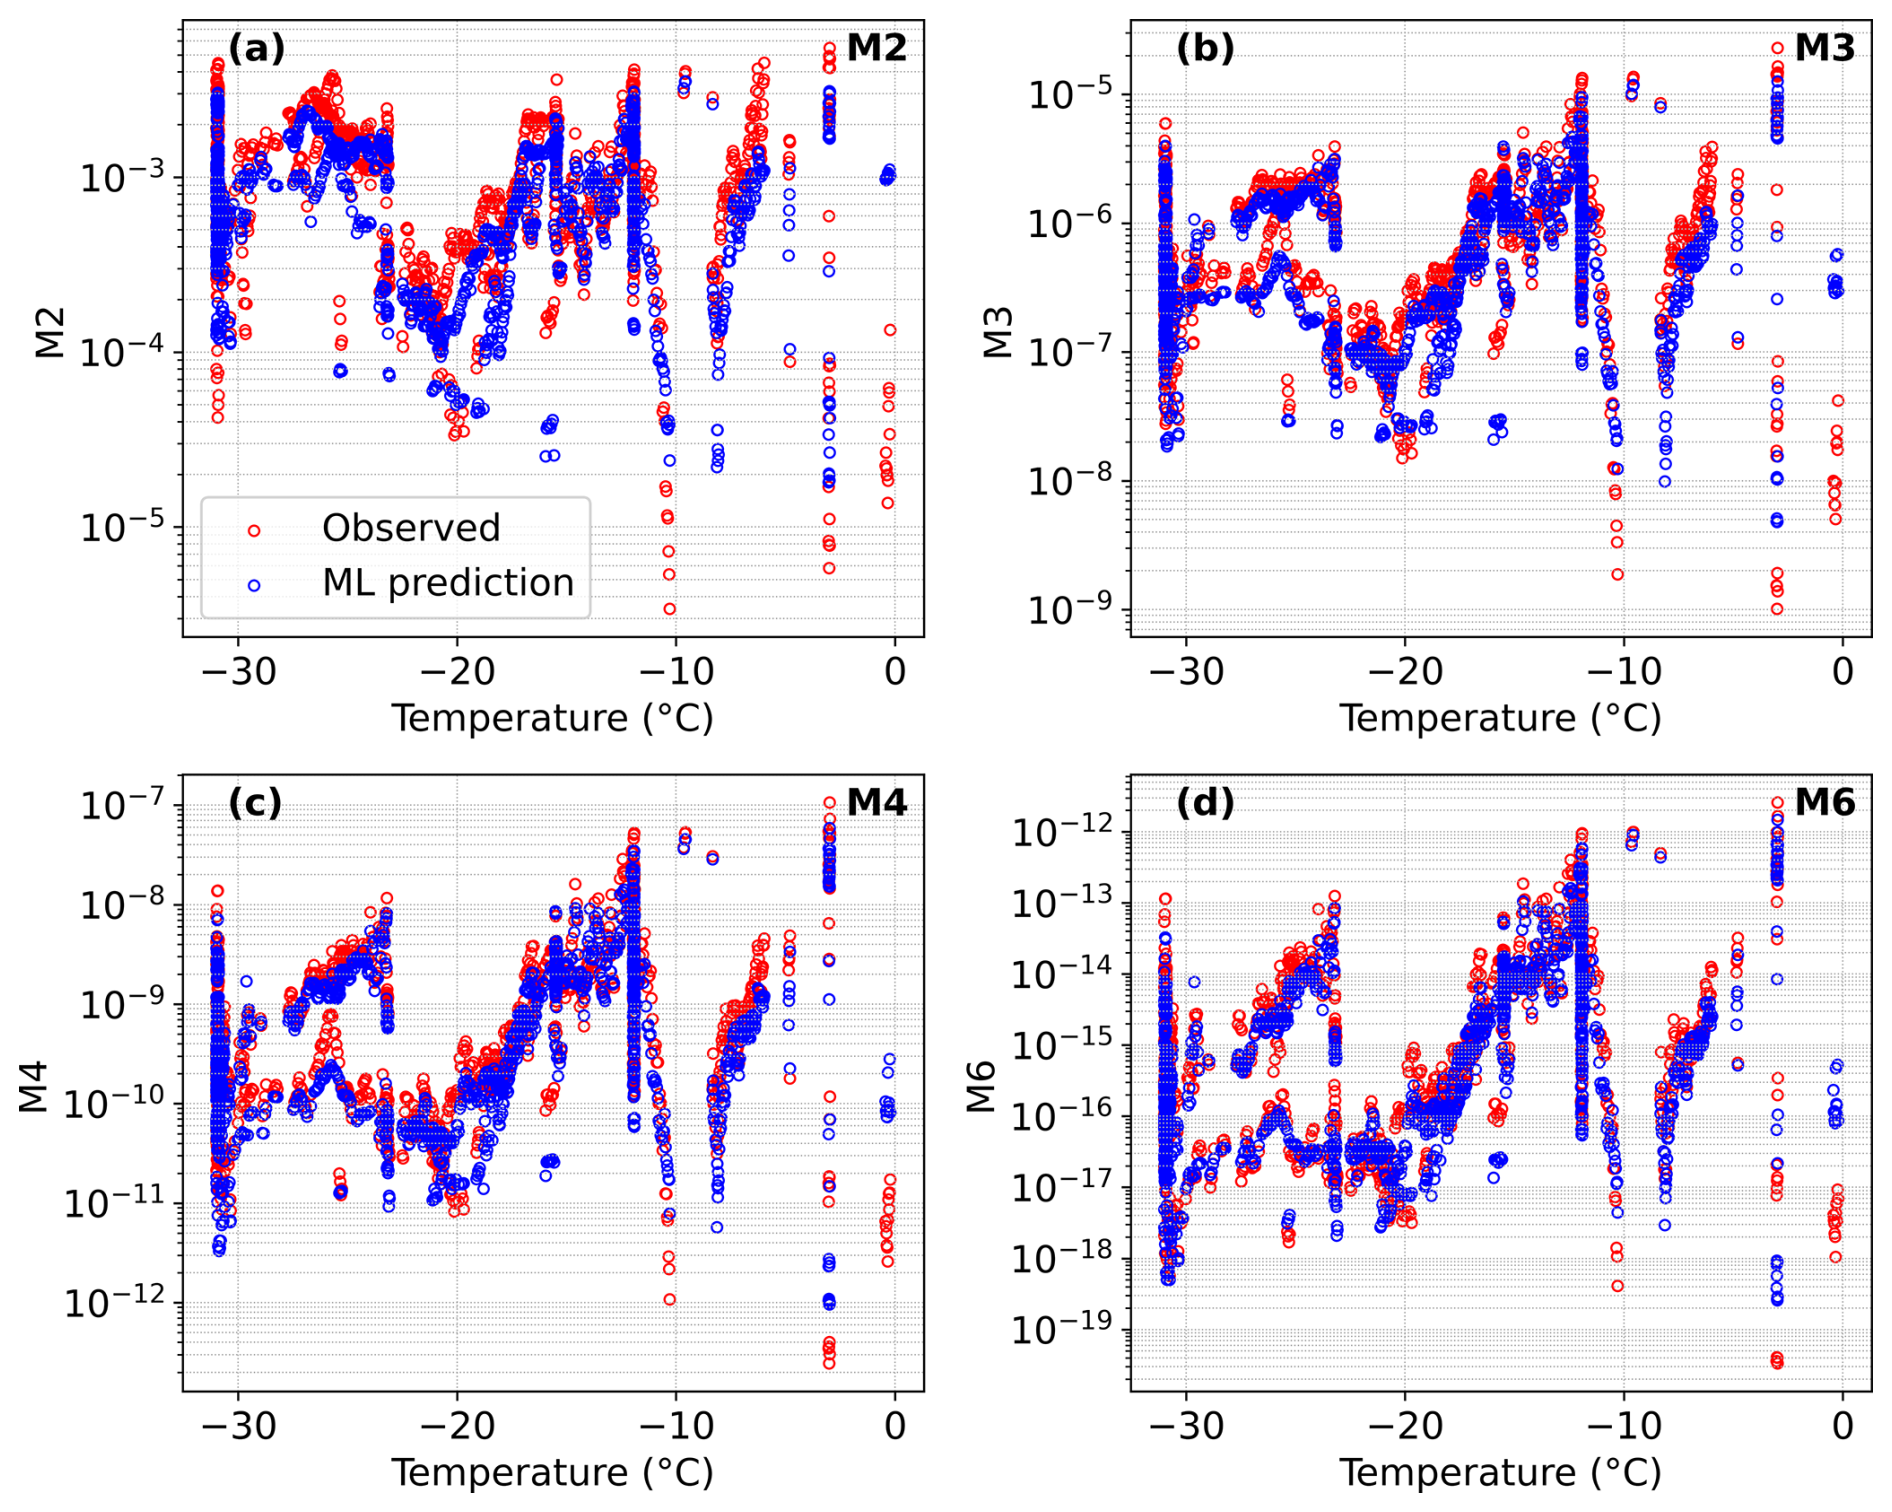
Figure 5Comparison of the re-transformed observed (open red circles) moments from C081 and predicted moments (open blue circles) using the ensemble-averaged ML predictions plotted against the in-cloud temperature for (a) M2, (b) M3, (c) M4 and (d) M6. The key to each of the panels is shown in the bottom-left corner of panel (a).
When applying the trained models to the CCREST-M cases, the same feature vector x is constructed using profiles of Tc and p from the dropsondes, together with profiles of IWC and Dmmw derived from the 3 GHz radar reflectivity and a separate temperature-based polynomial model, respectively. The prediction of Dmmw from Tc is next described in Sect. 4.2 and the retrieval methodology in physical space is described in the Sect. 4.3. In Sect. 4.4, the retrieval of IWC from the 3 GHz radar is then described. A schematic overview of the full retrieval framework, from PICASSO training to the CCREST-M multi-frequency radar retrieval, is depicted in Fig. 6.
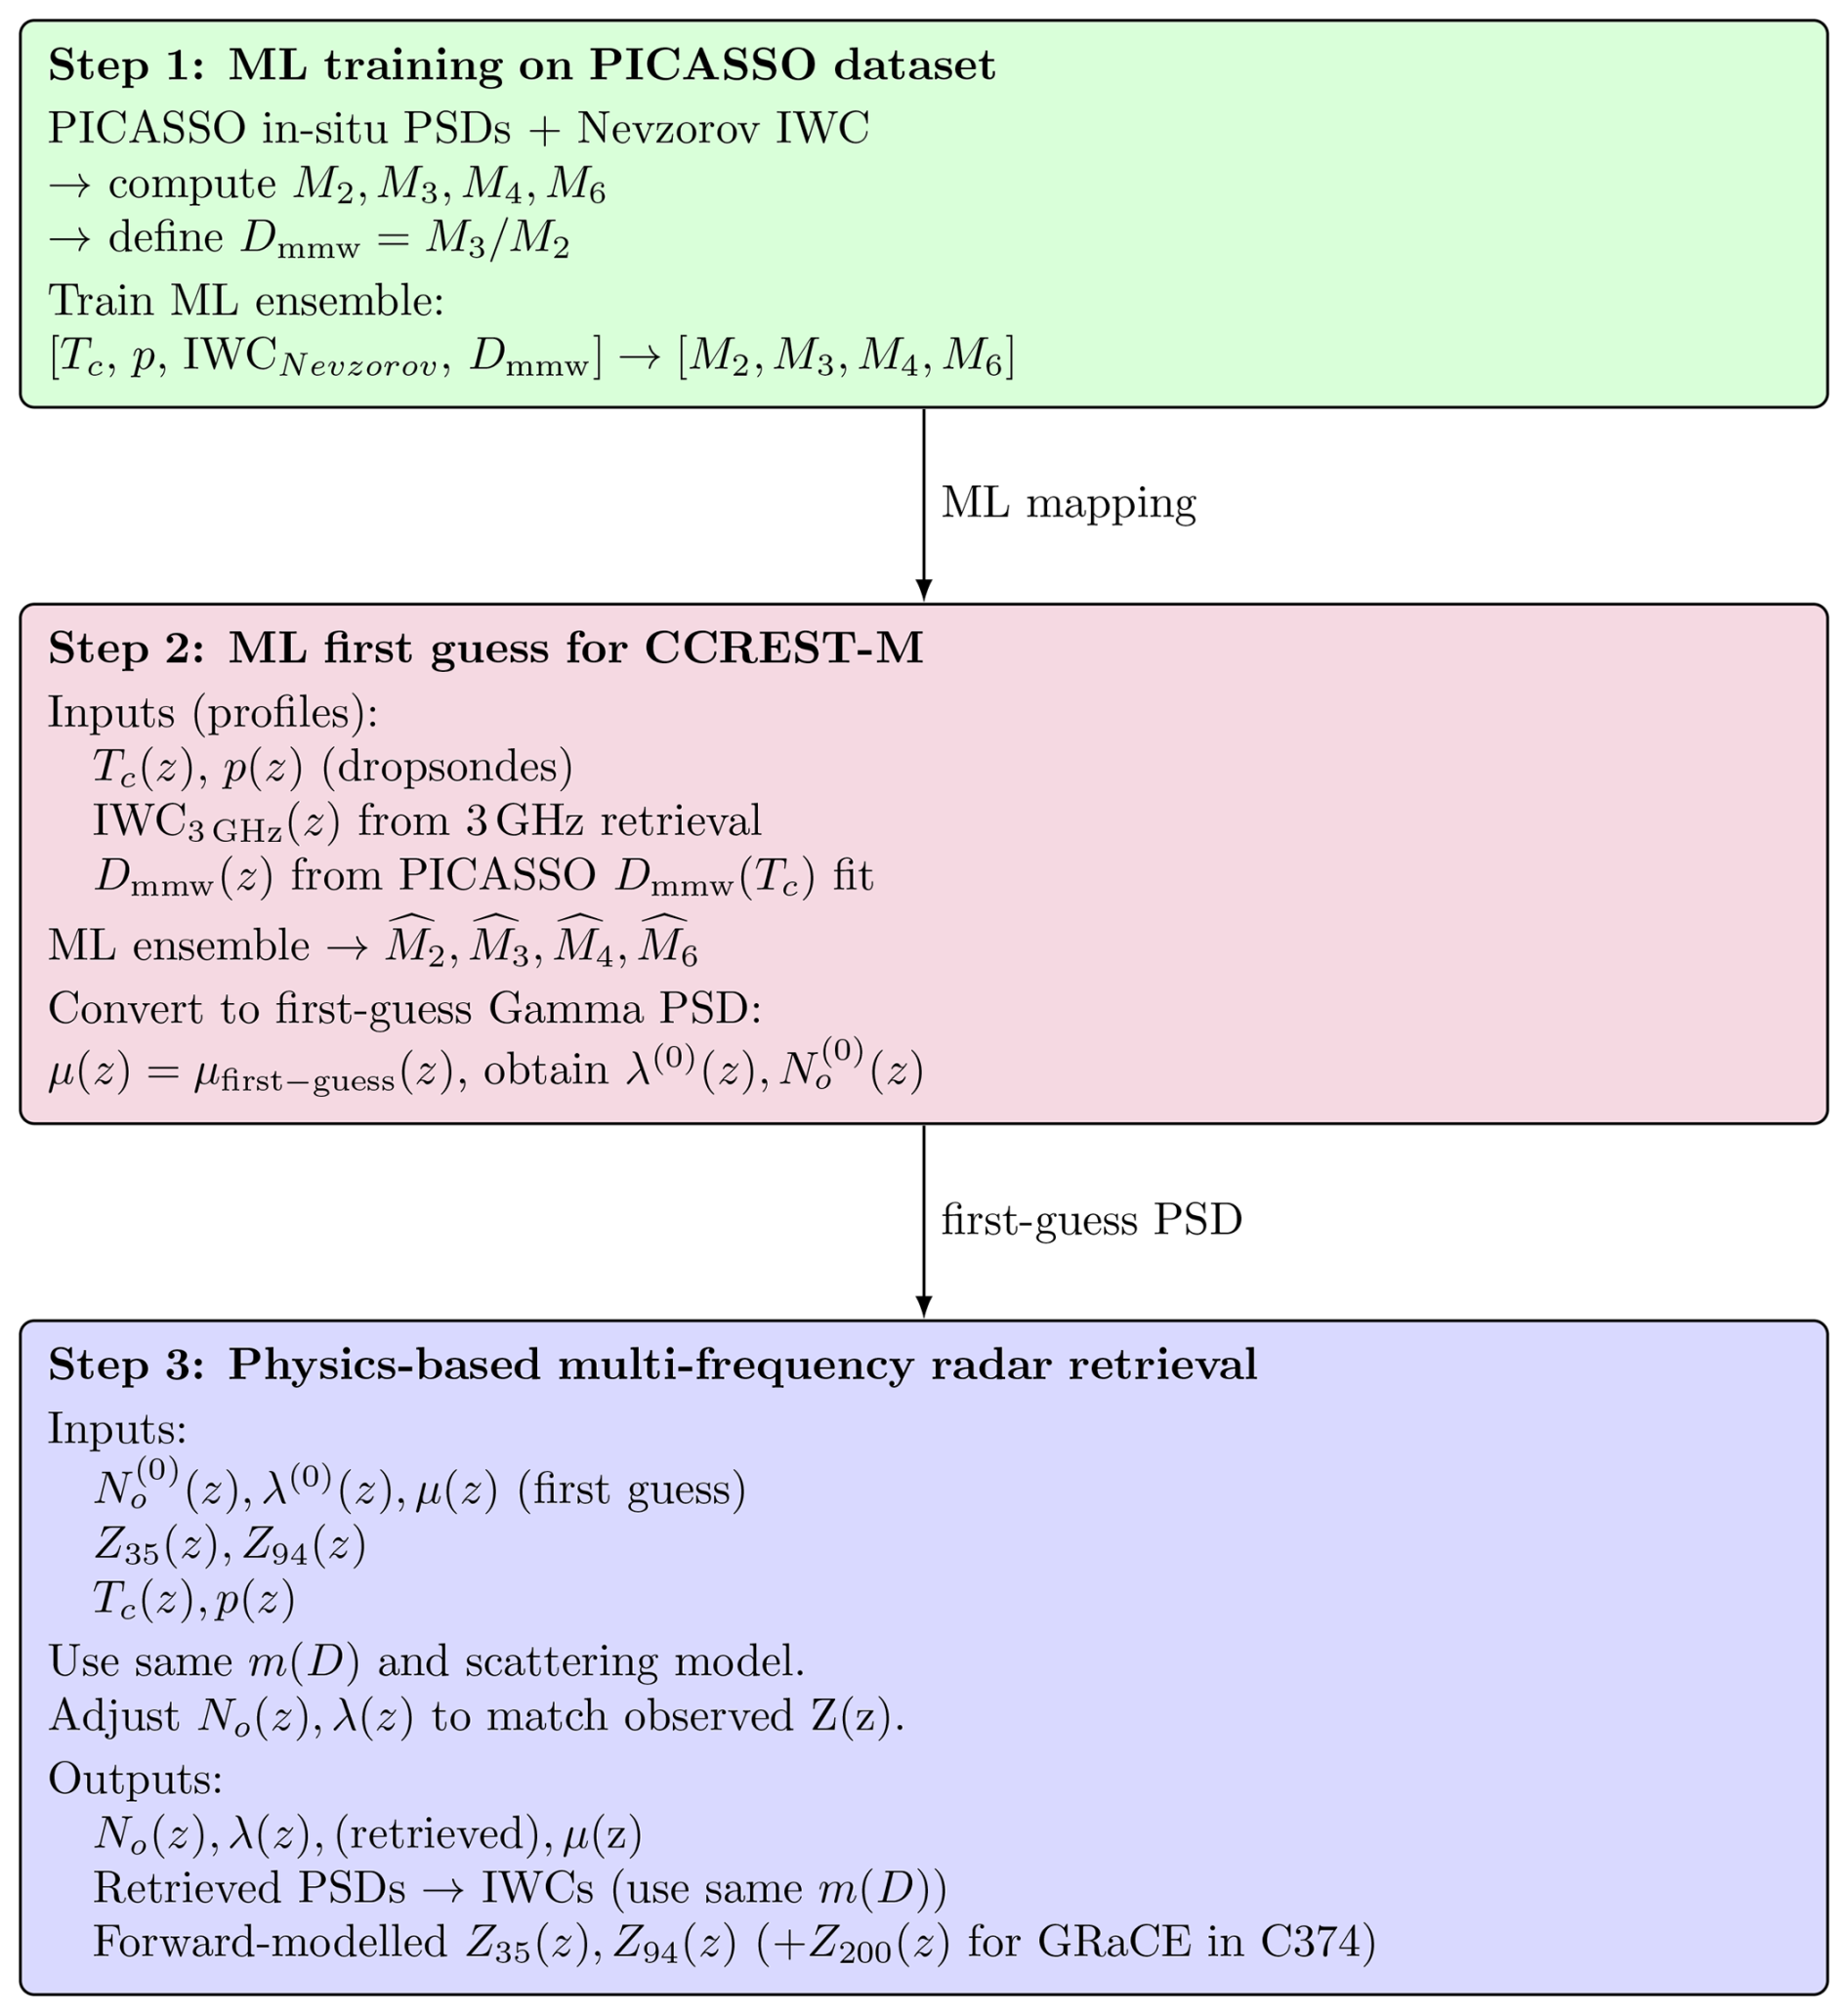
Figure 6A schematic overview of the retrieval framework. Step 1: an ensemble ML model is trained on the PICASSO dataset using in-situ PSDs and the Nevzorov IWC to compute the PSD moments M2, M3, M4 and M6 and the mean mass-weighted diameter . Step 2: for each CCREST-M case, profiles of Tc, p, 3 GHz-retrieved IWC and Dmmw(Tc) are passed through the ML ensemble to predict the moments, which are converted into first-guess gamma PSD parameters, with μ(z)=μfirst guess(z), where z is the altitude, and corresponding λ(0)(z) and . Step 3: a physics-based multi-frequency radar retrieval adjusts No(z) and λ(z) using the same m(D) and scattering model so that simulated reflectivities Z35(z) and Z94(z) match the observations, yielding retrieved PSD parameters, PSDs and estimated IWCs, and forward-modelled reflectivities.
4.2 Estimating the profile of Dmmw
To obtain a first-guess profile of Dmmw we exploit the observed relationship between Dmmw and the in-cloud temperature Tc in the PICASSO dataset, where . Since we use Tc to be the only predicator for Dmmw, the underlying relationship is expected to be a smooth function of temperature rather than a highly structured one. Therefore, a low-order polynomial is fitted to the PICASSO Dmmw(Tc) dataset. Polynomials from degree 1 to degree 10 were tested and each fit was evaluated using the coefficient of determination, R2, the root mean-square error, RMSE, and a k-fold cross-validation score. It was found that a low-order polynomial provided a good fit, with R2=0.40, and RMSE=475 µm, and positive cross-validation performance, while higher-degree polynomials yield only marginal improvements in RMSE and increasingly unstable cross-validation statistics indicative of overfitting. The resulting quadratic relation between Dmmw (in µm) and Tc (in °C) is .
Figure 7 depicts the best-fit curve overlaid on the observed PICASSO distribution of Dmmw as a function of Tc. It can be seen from the figure that the fit captures the overall increase of Dmmw with temperature, while the substantial scatter about the curve, especially at the warmer temperatures, reflects the differing cloud bulk and microphysical properties encountered during each of the PICASSO flights.
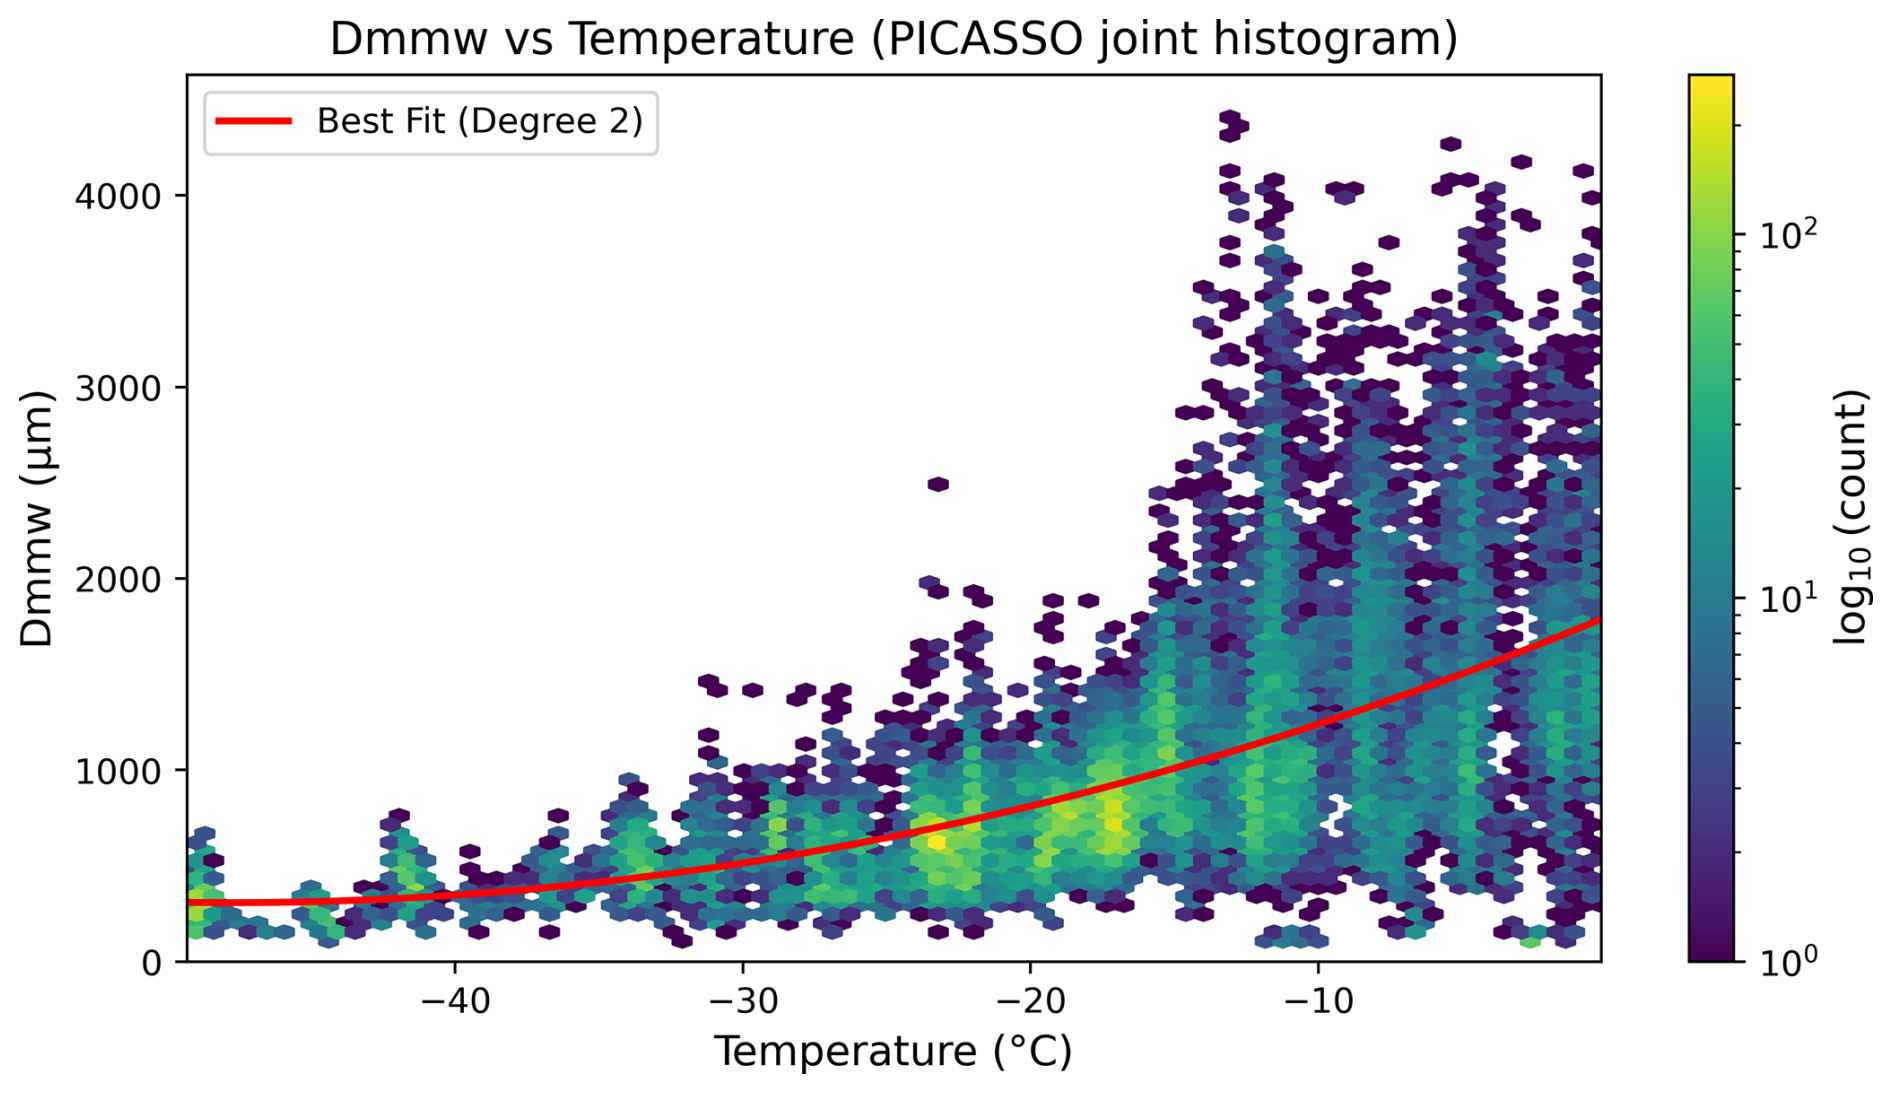
Figure 7Joint distribution of Dmmw and in-cloud temperature Tc for the PICASSO dataset. The coloured hexagons show a two-dimensional histogram of Dmmw versus Tc, shaded by log10(count) as indicated by the colour bar on the right-side of the figure. The red line shows the best-fit quadratic polynomial: .
In the CCREST-M retrievals, this quadratic relation is used to predict a deterministic first-guess profile of Dmmw from the dropsonde temperatures. As with the 3 GHz IWC retrieval, the role of Dmmw is to keep the ML-based PSD moment estimates close to representative values by providing a good starting point, while the subsequent multi-frequency optimisation adjusts the PSD parameters to match the observed reflectivities. We next describe the physically based dual-frequency retrieval of the PSD parameters given the ML first guess PSD parameter profiles.
4.3 Retrieval methodology in physical space
For the dual-frequency retrieval methodology we utilise the 35(z) and 94(z) GHz mean profile radar data and we employ a gamma size distribution model for the PSD as given by Eq. (2). The forward model F is given by Eq. (1). Here, the retrieval process begins with an initial guess profile derived from the ensemble of ML moment predictions, which are transformed into the PSD parameters μ(z), λ(z), and No(z) via Eqs. (4)–(6), respectively, to provide the starting values for the retrieval. The algorithm then retrieves optimal values of No(z) and λ(z) by minimising the differences between the forward model predictions and the observed radar reflectivities at both 35 and 94 GHz simultaneously.
The minimisation problem can be formally expressed as:
where Zobs represents the observed 35 and 94 GHz radar reflectivities, and the retrieval results are only accepted when the difference between the forward model and observations satisfies the following condition:
To solve this minimisation problem, we implement the Nelder–Mead simplex algorithm, which is a derivative-free optimisation method. The Nelder–Mead approach, see Nelder and Mead (1965), iteratively refines a simplex (a geometric figure in n-dimensional space with n+1 vertices) to find the minimum of our objective function. Also, the Nelder–Mead algorithm demonstrates robust performance in the presence of noise and other irregularities in the objective function, making this method appropriate for the retrievals where observational uncertainties are inherent. In the next sub-section, we describe the method to retrieve the IWC from the 3 GHz radar using the optimisation presented here.
4.4 Retrieval of the IWC profiles
To retrieve the IWC, we utilise the 3 GHz radar reflectivities, and for this retrieval the climatologically averaged PSD parameters found for No, λ, and μ, which have been derived from the PICASSO dataset are used to initialise the retrieval of λ, where μ is set to its climatologically averaged value of 2.33 throughout the retrieval. In the case of No, this parameter is allowed to vary with temperature following Hogan et al. (2006), where we initialise and adjust No according to the relationship , and the numerical factor in the relationship is derived from the PICASSO climatology using the No equation from Kozu and Nakamura (1991), Tc is in units of degree Celsius. This retrieval uses the same forward-model retrieval framework as the full multi-frequency retrieval described in Sect. 4.3, but in this case the radar observation consists solely of the 3 GHz radar reflectivities. The retrieval of IWC here is to provide IWC profiles as an input feature to the ensemble of ML models.
The gradient λ is retrieved by minimising the difference between , where F(3 GHz) and Zobs(3 GHz) are the forward model given by Eq. (1) and observed radar reflectivities at 3 GHz, respectively, with retrievals only being accepted when these differences are less than 1 dBZ. Thus, using the retrieved λ, estimated No, and constant μ, we apply the gamma PSD to estimate the IWC using:
where in Eq. (10), m(Dm) is the mass–dimension relationship from Cotton et al. (2013), i.e., . This mass power law is the same as the mass power law used to construct the rosette aggregate model described in Sect. 3, and the rosette aggregate model is used to predict the backscattering coefficients at 3 GHz using the well-known Rayleigh scattering, assuming the equivalent ice mass spherical radius.
To test our retrieval of IWC using the 3 GHz radar data we use collocated radar and aircraft observations from the PICASSO flight C081. Figure 8 compares the hexagonally binned retrieved IWC with the in-situ IWC measured by the Nevzorov probe for all samples above 3200 m. We focus on altitudes greater than 3200 m owing to the presence of a melting layer at lower altitudes. We specifically target retrievals outside of the melting layer because during CCREST-M we deliberately avoided this region, as it is too complex to simulate accurately assuming the rosette aggregate model. Moreover, the comparisons in Fig. 8 include only data points where radar observations were recorded within 36 s of the aircraft position, within 50 m of the aircraft altitude, and within the same distance from the Chilbolton Observatory site. The hexagonally binned scatter plot shows that most points lie close to the 1:1 line, with a RMSE difference of 0.047 g m−3 and a negligible bias of just 0.004 g m−3, but with a moderate r=0.44, the latter value is probably owing to the limited range of sampled IWC because of the choice of the minimum altitude. However, in absolute terms the 3 GHz retrieval of IWC reproduces the Nevzorov-derived IWC with small errors over the ice layer of interest. Moreover, in the retrieval framework, the 3 GHz retrieved IWC profile is used only as a constraint on the first-guess PSD moments for the multi-frequency optimisation described in Sect. 4.3, so the IWC profile does not need to be completely correct but rather provide a reasonable estimate of the profile of ice mass within the cloud, which the retrieval achieves as Fig. 8 depicts.
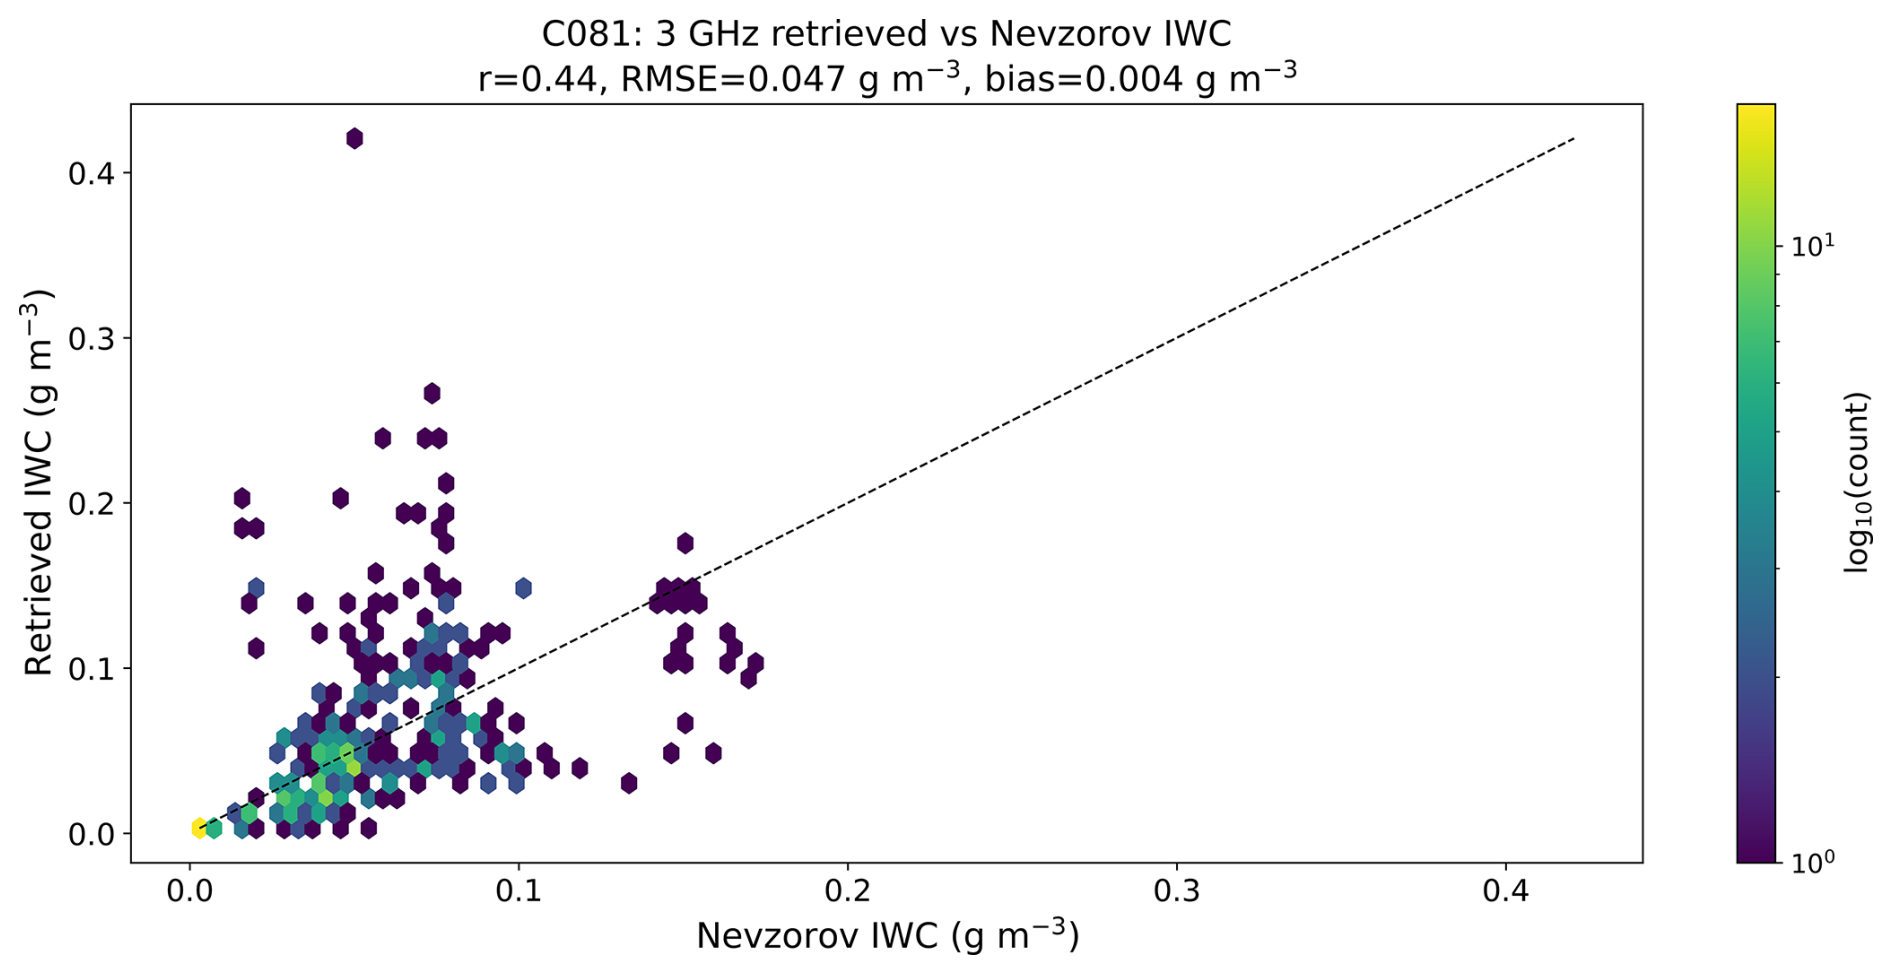
Figure 8Hexagonally binned scatter plots of retrieved IWC from the 3 GHz radar plotted against in-situ Nevzorov-derived IWC for the PICASSO flight C081and for altitudes greater than 3200 m. The colour scale on the right-side shows the log 10 of the number collocated samples per bin, with the dashed line indicating a slope of unity. The correlation coefficient, r, the root mean square error (RMSE) and the bias are shown at the top of the figure.
In the next section, the retrieval methodologies outlined in this section and sub-sections are applied to the three in-situ cases that were sampled during the CCREST-M campaign of flying.
Here, the retrieval methodology outlined in Sect. 4 is applied to the zenith-pointing 3, 35 and 94 GHz mean radar reflectivity profiles for the three CCREST-M cases (C374, C379, C382). For each of the flights, the zenith-pointing radar profiles are taken from periods when the FAAM BAe-146 aircraft executed figure-of-eight overpasses above cloud top while all three radars operated in zenith pointing mode.
For C374, these figure-of-eight overpasses occurred in three blocks between about 10:24–10:43, 11:29–11:33, and 11:37–11:42 UTC at altitudes near to 10 km. After the third set of overpasses, the aircraft flew a single profile descent through the cloud as described in Sect. 2. For C379, the aircraft flew two blocks of figure-of-eight overpasses between approximately 16:10–16:26 and 17:07–17:28 UTC. These were followed by in-situ sampling along the 270° radial, which began at about 17:33 UTC and lasted until about 18:11 UTC, and consisted of stepped descents with straight-and-level runs of several minutes at successive levels. Finally, for C382, the aircraft first completed the figure-of-eight overpasses between about 15:00 and 15:26 UTC and again between 16:17 and 16:28 UTC while the radars were in Zenith mode. The subsequent in-situ sampling along the 246° radial began at 16:33 until about 17:09 UTC, following a similar pattern to C379.
As alluded to previously, only a single aircraft was available, and from the flight patterns and timings described above, the in-situ PSDs and the zenith-retrieved PSDs are not strictly collocated in time and space, instead they represent different realisations of the same frontal ice cloud systems. The in-situ legs typically lag the initial zenith-dwell period by about 60 min but closely follow the final zenith-dwell period by about 5 min. Horizontally, each in-situ straight and level run lasts about 9 min at an airspeed of about 100 m s−1, corresponding to along-track distances of order 50–60 km along the selected Chilbolton radial before the aircraft turns to begin the next leg. Thus, the in-situ sampling spans a substantial segment of the radar radial rather than a single point above the Chilbolton site. For each flight we therefore compare the retrieved PSDs statistically with the in-situ composited PSDs, rather than on a point-by-point basis, and retrievals that are below the IWC threshold of 0.002 g m−3 are rejected for the reasons given in Sect. 2.1. The following sub-sections present the ensemble ML moment predictions, retrieved PSDs, and their comparisons with the in-situ moments and PSDs for each case.
5.1 The case C374
For C374, we begin by comparing the ensemble ML predictions of the target moments with those derived in-situ from the composite PSDs. Following this, the retrieved PSDs are evaluated against the in-situ composite PSDs as a function of temperature, the dual-frequency residuals are also examined along with comparisons of IWCs estimated from the retrieved PSDs with the Nevzorov-derived IWCs.
5.1.1 Moment estimations and comparisons with aircraft data
The ensemble ML model predictions of Dmmw, M3, M4, and M6 are compared with the derived in-situ estimated moments from the composite PSDs in Fig. 9a–d, the comparisons are shown as normalised probability density functions (PDFs), where the area under the curve equates to unity. Here the in-situ distributions are formed from all PSDs measured during the stepped-descent legs, while the ML distributions are formed from the ML predictions from the zenith-radar retrieval levels over about the same altitude range. To assess the sensitivity of the ML predictions to the assumed shape of the PSD in the 3 GHz IWC retrieval, results are shown for both gamma and exponential PSD assumptions. We consider altitudes greater than 1 km, and in-cloud temperatures warmer than −50 °C.
Under the gamma PSD assumption, the ML ensemble predictions compare favourably with the in-situ moments, with similar distribution spreads, indicating that the ML captures to some extent the natural variability observed in the in-situ data. The central tendency is well captured for Dmmw and M6 as shown in panels (a) and (d) but is slightly underestimated for M3 and M4 in panels (b) and (c). A systematic bias is nonetheless evident across all the parameters, for instance, for Dmmw the in-situ mean is 941 µm compared with 734 µm for the ensemble ML model, and similar leftward shifts are apparent in panels (b)–(d).
For the case of the exponential PSD assumption, we see that this PSD assumption mitigates the previous negative biases for the higher-order moments. The central tendencies of the ML predictions for M3, M4, and M6 shift towards the in-situ values, and the distribution spreads improve correspondingly. For Dmmw, which is a ratio of moments, the change in PSD assumption has little impact as shown in panel (a). The improvement at the high-order moments is likely owing to the exponential distribution predicting a greater occurrence of larger particles than the gamma distribution.
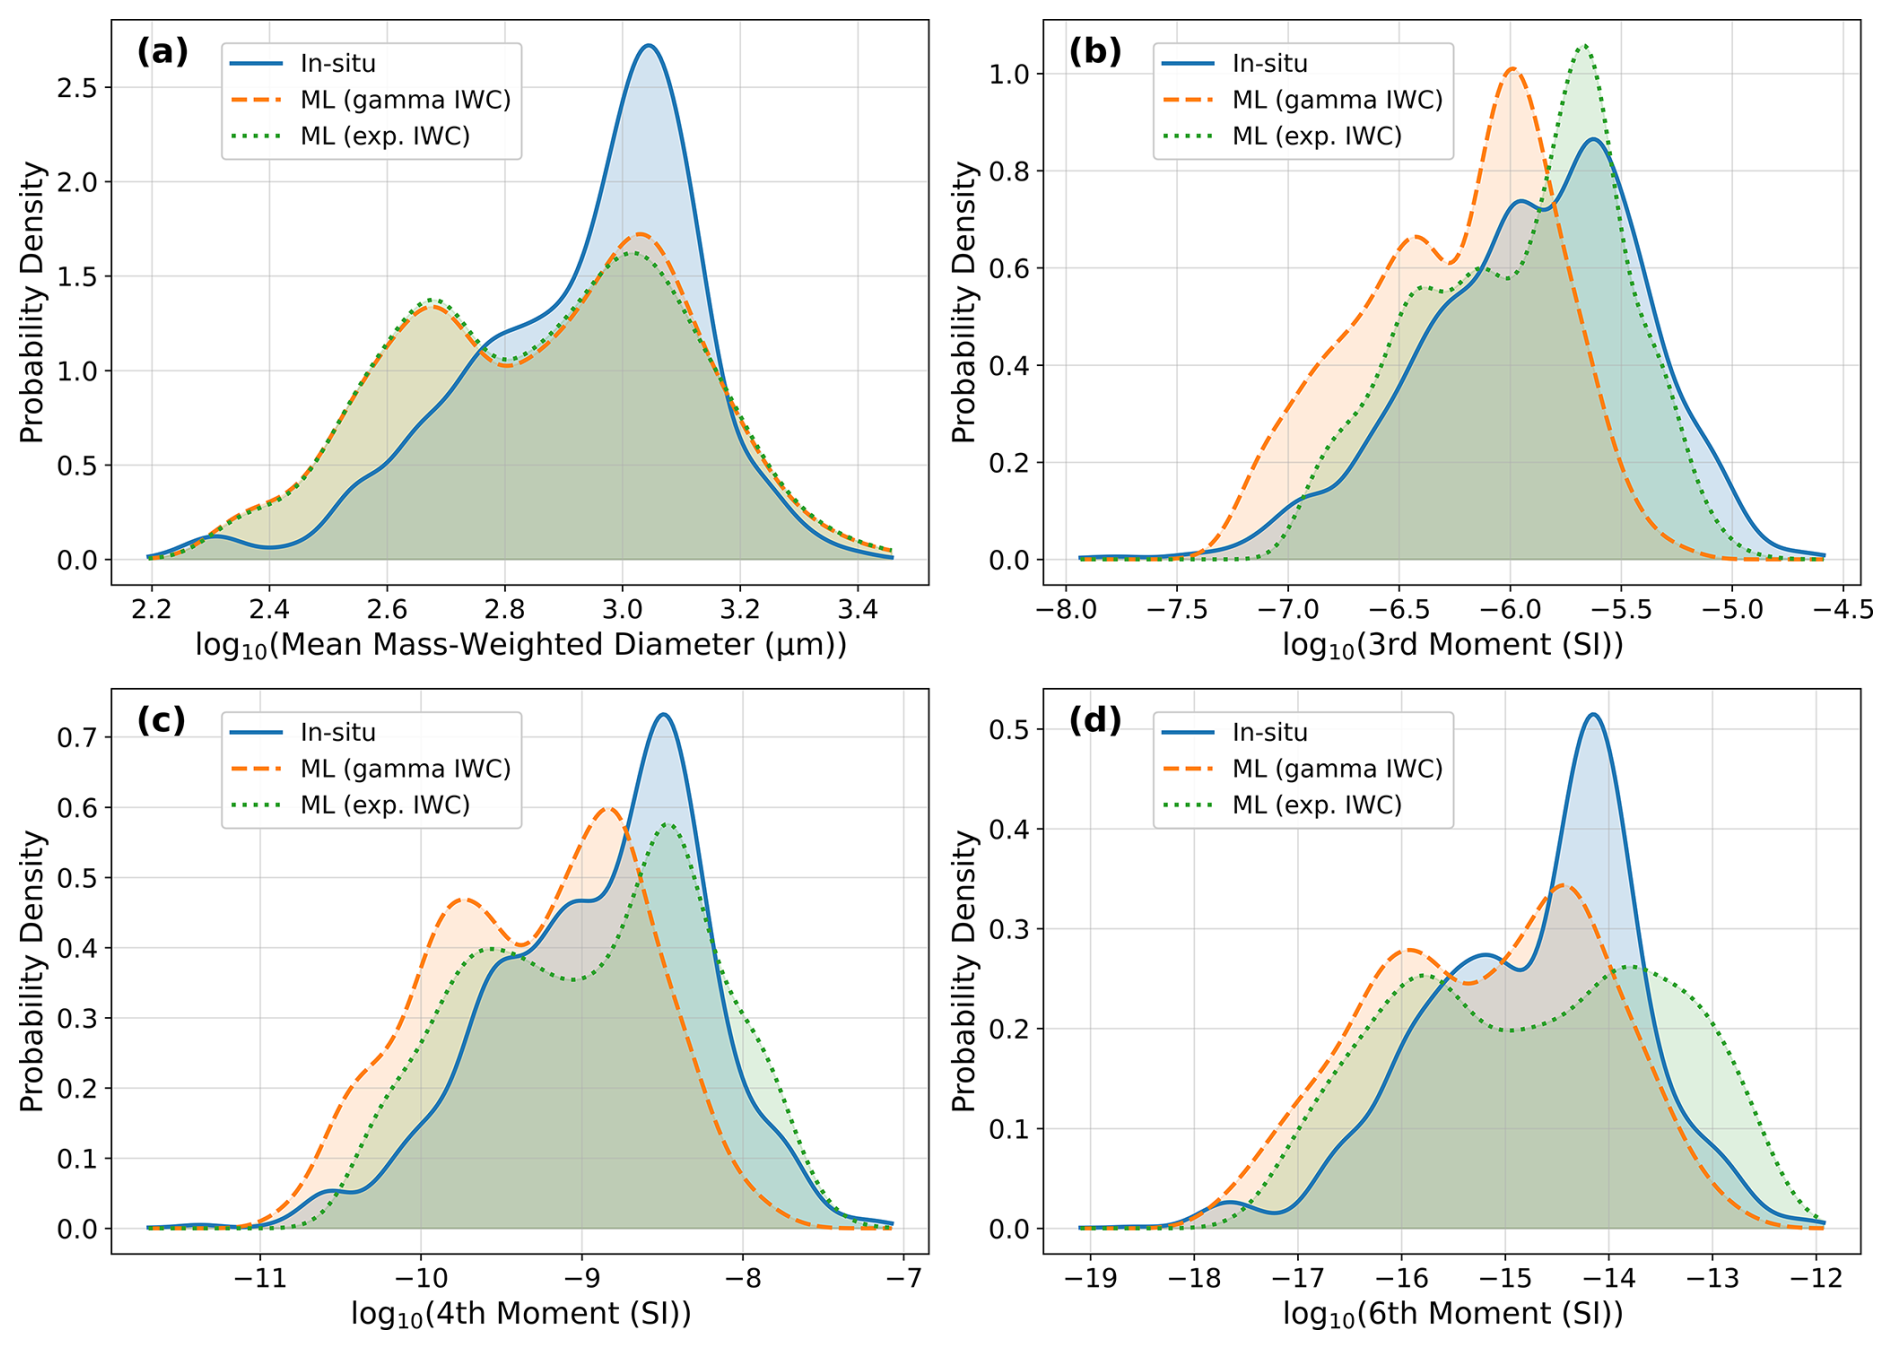
Figure 9The normalised PDFs of the logarithm (base 10) of the predicted and observed moments for case C374. In-situ size distributions derived from the composite PSDs are shown as solid blue lines and a blue shaded fill. The ML ensemble predictions are presented for the gamma and exponential PSD assumptions used in the retrieval of the 3 GHz IWC. The gamma and exponential PSD assumptions are shown as the orange-dashed line with orange fill, and green-dashed line with green fill, respectively. Comparisons are presented for (a) Dmmw, (b) M3, (c) M4 and (d) M6. The key is shown in the top-left corner of each panel.
The impact of changing the shape assumption of the PSD on the retrieval of IWC and how this manifests itself on the retrieved PSDs as a function of temperature will be examined in the next sub-section.
5.1.2 Retrieval of the PSDs and comparisons with the in-situ composite PSDs
Now that we have derived the first-guess profiles for the PSD parameters from the profiles of IWC, Dmmw, Tc, and p, the PSD parameters, No, λ and μ are input to the dual-frequency retrieval as described in Sect. 4.3, only varying No and λ while keeping the profile of μ as the first guess. Figure 10a–e presents a comparison between retrieved and in-situ composite PSDs for the flight C374, as a function of temperature for maximum dimensions greater than 100 µm. The retrieved PSDs assume gamma and exponential size distributions for the retrieval of the IWC profiles using the 3 GHz radar and only include retrievals greater than 1 km in altitude to focus on the primary iced regions of this frontal cloud system and IWCs greater than 0.002 g m−3. To provide robust statistical comparisons, the analysis presents the mean and the in-situ interpercentile range (20th to 95th percentiles) for both sets of data across five temperature bins: −50 to −40, −40 to −30, −30 to −20, −20 to −10, and −10 to 0 °C. This choice of in-situ interpercentile range retains the bulk of the distribution while excluding the retrievals in the lowest tail, and a small number of very large values which may arise from occasional misfits. Thus, the 20th to 95th percentile range provides a clearer view of the central behaviour of the retrievals relative to the in-situ composites without being overly influenced by a small number of extremes. Also, the temperature stratification allows examination of retrieval performance as a function of temperature, and it is the temperature that chiefly determines the microphysics. Here, we focus on the PSDs themselves rather than plotting the corresponding moments of the retrieved PSDs after the 35 and 94 GHz fitting. This is because the moments are effectively summarised by the PSD comparisons shown in Fig. 10a–e and so a moment-by-moment comparison would therefore be redundant.
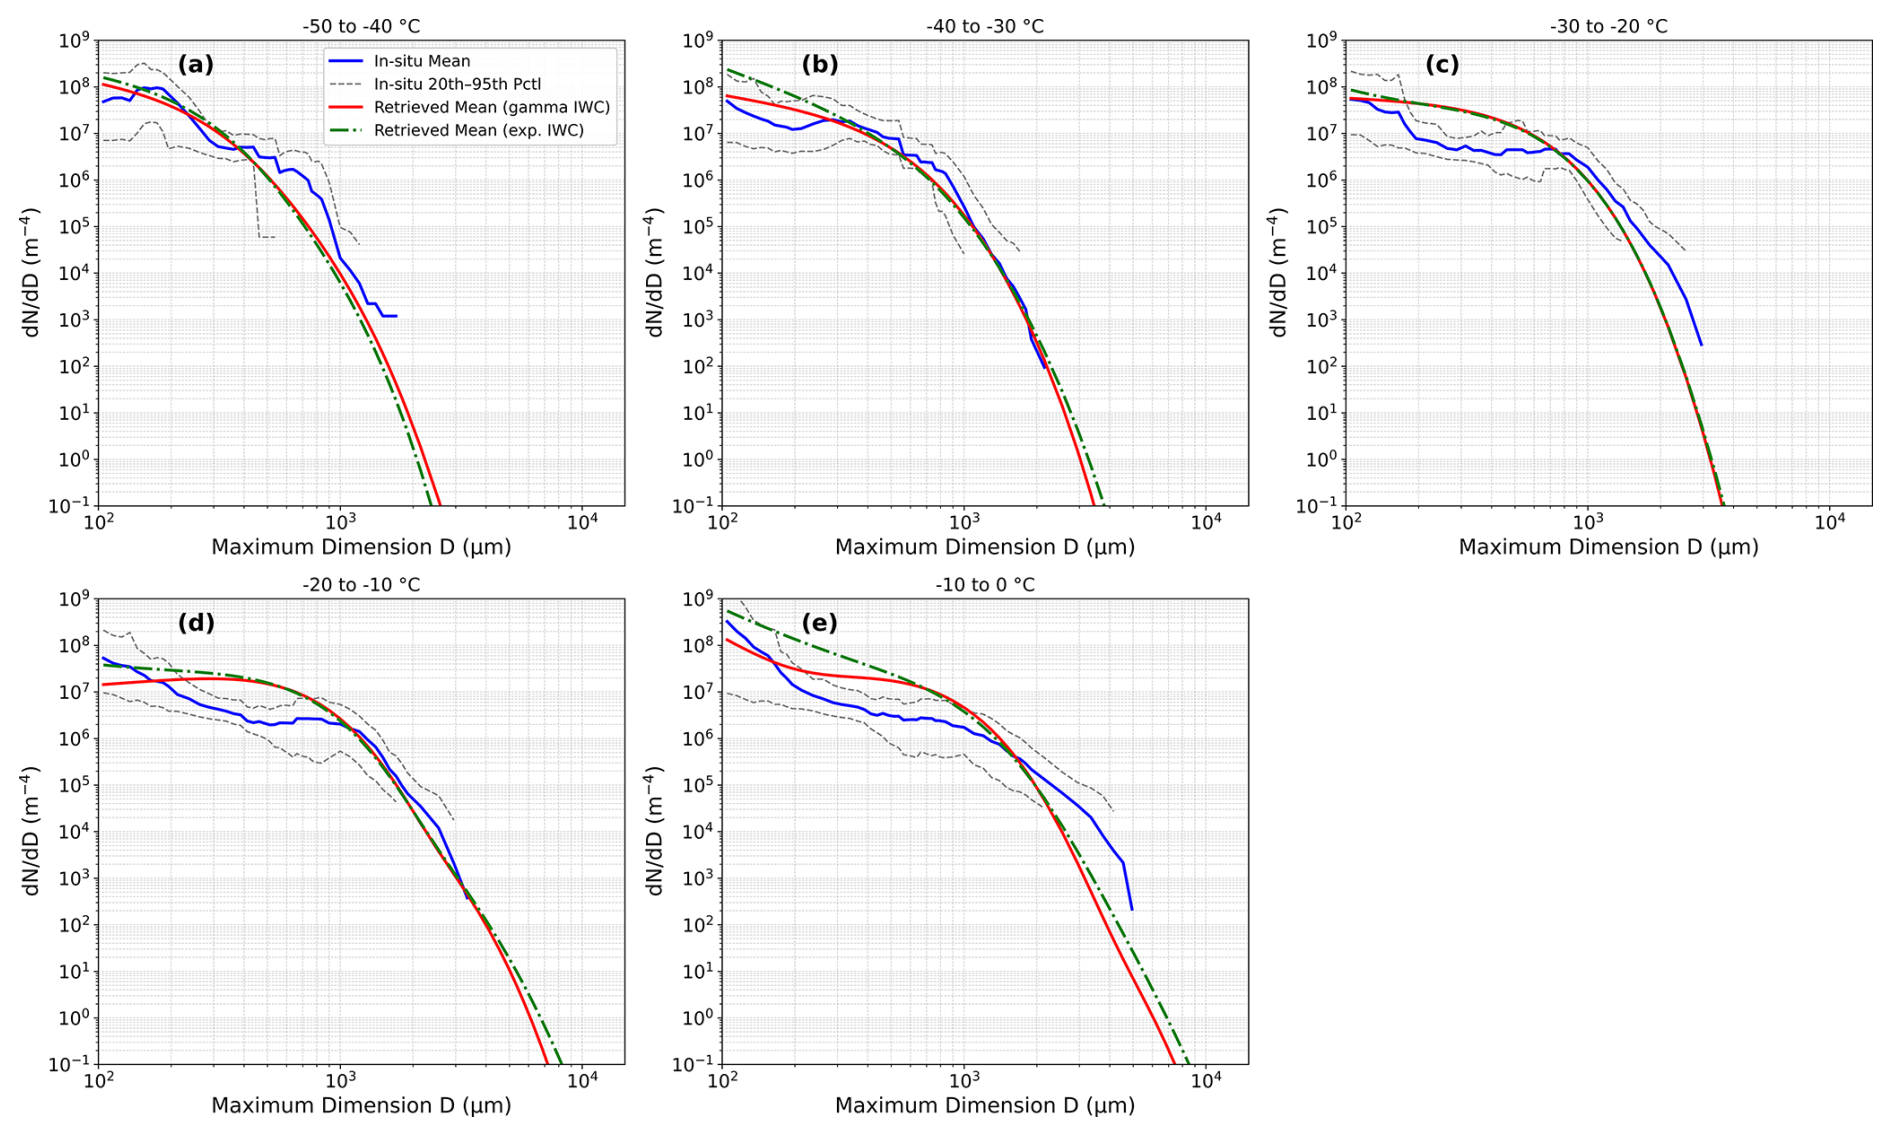
Figure 10Comparison of retrieved and in-situ composite PSDs for flight C374 as a function of temperature. Retrieved mean PSDs assuming the gamma and exponential PSDs for the retrieval of the 3 GHz IWC are shown as red solid lines and green-dotted lines, respectively. The composite mean in-situ PSDs are shown as solid blue lines and the in-situ 20th and 95th percentiles are shown as the grey dashed lines. Results are presented for the temperature bins (a) −50 to −40 °C, (b) −40 to −30 °C, (c) −30 to −20 °C, (d) −20 to −10 °C, and (e) −10 to 0 °C. The key is shown in the upper-right of panel (a).
For the case of assuming the gamma size distribution for the retrieval of IWC at 3 GHz the comparisons presented in Fig. 10a–e show generally good agreement between the retrieved and in-situ PSDs across most of the temperature bins. For instance, the mean retrieved PSD is largely within the interpercentile range of the in-situ PSDs for most of the considered temperatures. The most notable systematic overestimations of the retrieved number concentrations relative to the in-situ concentrations occur for the sizes of several hundred µm at the warmer temperatures, especially as seen in Fig. 10c–e. In general, the figure shows that across all temperature regimes there is considerable overlap in the variability captured by the retrieved and in-situ PSDs, suggesting that the retrieval method successfully represents the natural variability in PSD characteristics, even when absolute concentrations might be biased at some of the sizes.
In the case of the exponential PSD being assumed to retrieve the IWC at 3 GHz, the exponential size distribution assumption produces notable changes in representing smaller ice crystal number concentrations at the warmer temperature bins. Specifically, it tends to overestimate number concentrations for sizes less than about 1000 µm and above several thousand microns, as shown in panels (b, d, e).
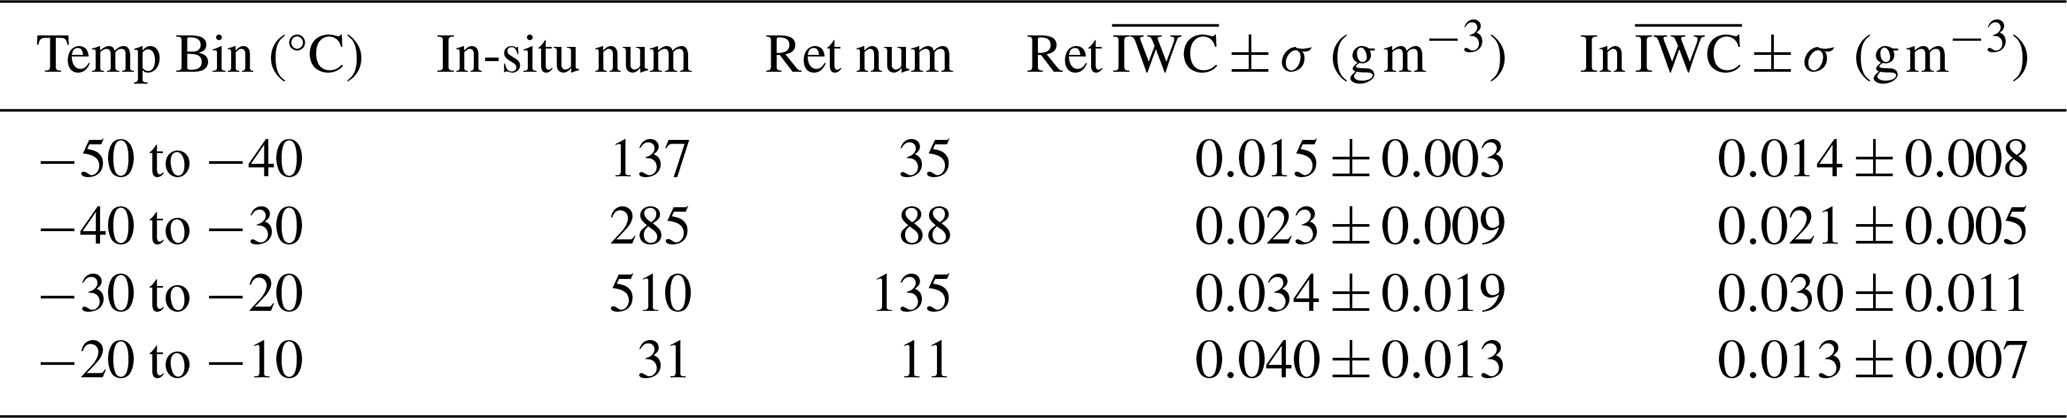
To further evaluate the retrieved PSDs assuming the gamma or exponential PSD for the retrieval of IWC at 3 GHz, we compare the mean and standard deviation, σ, of the IWC computed from the retrieved PSDs, using Eq. (10) assuming the Cotton et al. (2013) mass–dimension power law, within each temperature bin, with corresponding in-situ IWC statistics measured by the Nevzorov probe. The results of these comparisons are presented in Table 2, along with the numbers of retrieved PSDs and in-situ measurements within the interpercentile range used in the calculation for each of the temperature bins.
Table 2Comparison of retrieved () and in-situ (In) statistics for the mean and standard deviation of the IWC in each temperature bin, with the total number (num) of retrievals (numgamma/exp) and measurements filtered into each temperature bin.
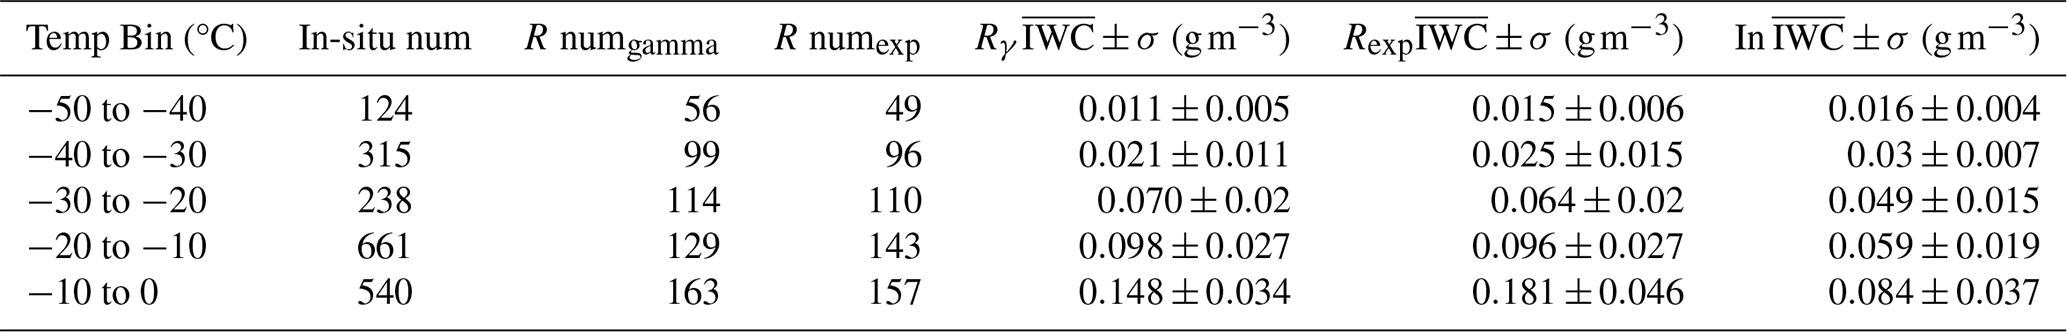
Under both the gamma and exponential PSD assumptions, Table 2 demonstrates that for the integral property IWC, the retrieved PSDs generally compare well with the in-situ Nevzorov measurements in the two coldest temperature ranges. At the warmer temperatures, both assumptions tend to overestimate the in-situ mean IWC values by varying amounts, although the differences remain within a factor of two. However, despite this, there is substantial statistical overlap between the retrieved and in-situ IWC ranges for both PSD assumptions. The only exception being the exponential PSD assumption at the warmest temperature bin. Figure 10 and Table 2 illustrate the trade-off at different temperature bins in selecting an optimal size distribution that performs well across the full range of ice cloud conditions.
To evaluate the consistency of the retrieval framework, it is instructive to examine how well the forward-modelled radar reflectivities at 35 and 94 GHz compare with observations when using the retrieved PSDs and scattering model. Figure 11 (left–right panels) depicts the radar reflectivity profiles and their residuals, assuming the gamma PSD for the 3 GHz retrieval of IWC, computed from Eqs. (1) and (9), for accepted retrievals as a function of altitude for two of the six coincident overpasses between the aircraft and zenith-pointing radars. In Fig. 11 (left–right panels), we show residuals for the first (10.49 h) and last (11.63 h) overpass times, as these are representative of all six overpass times.
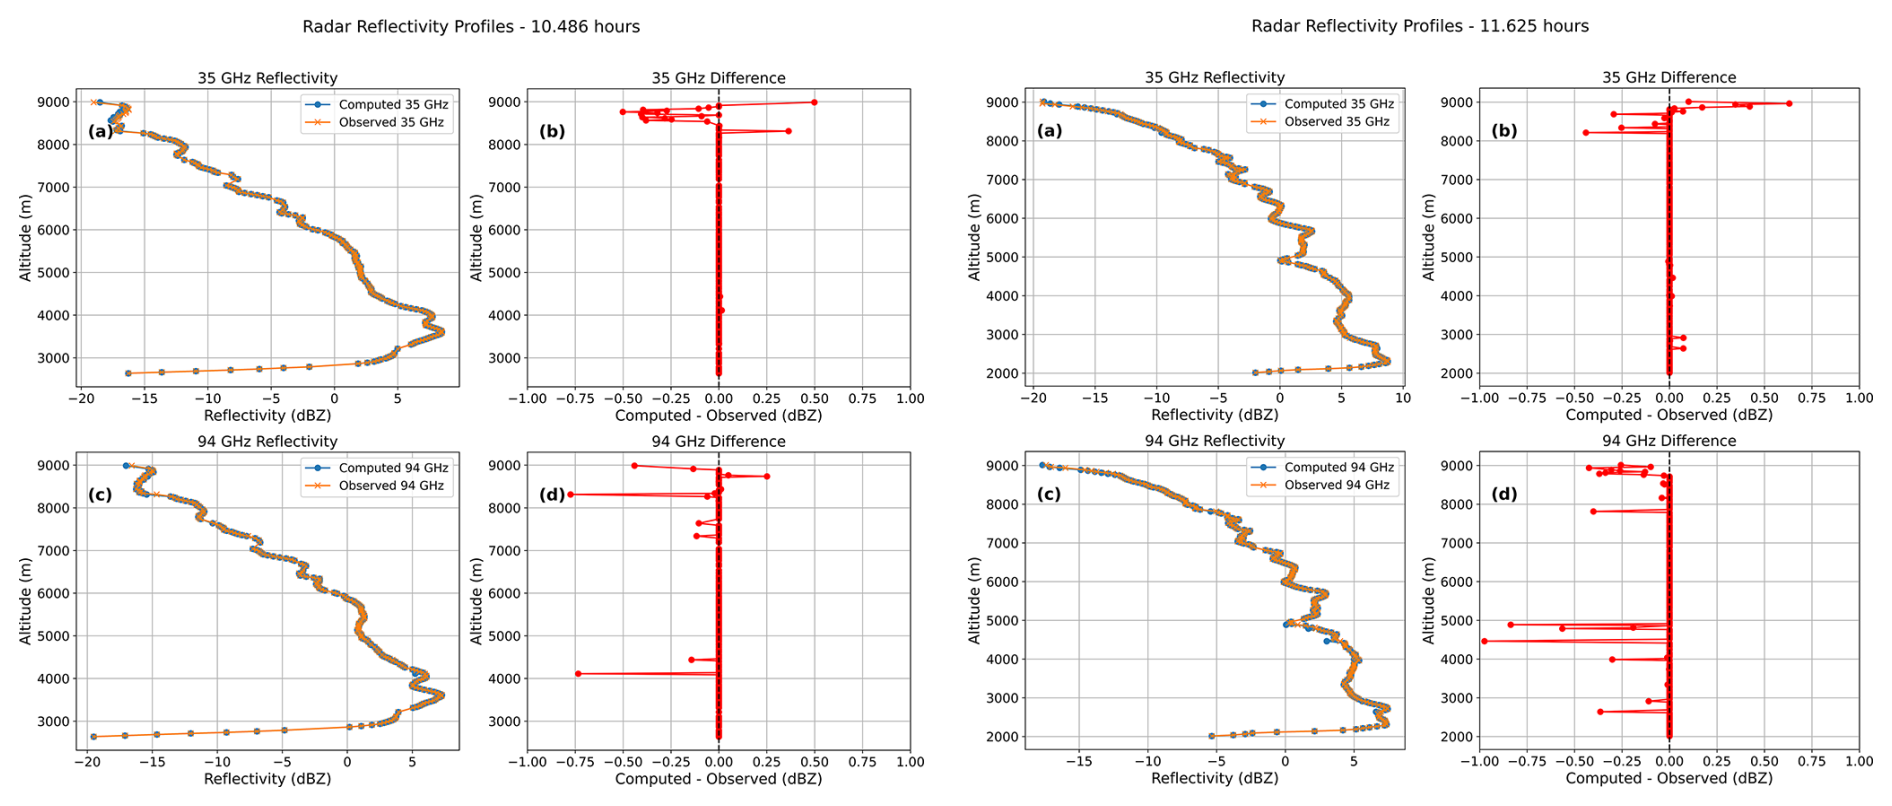
Figure 11Comparison of forward model simulations (blue lines and circles) and observations (orange lines and circles) with their corresponding residuals (red lines and circles) as a function of altitude for the 35 (a, b) and 94 GHz (c, d) radars. Times correspond to coincident aircraft overpasses for 10.49 h (left panels) and 11.63 h (right panels). The key is shown in the top-right of each panel.
The radar reflectivity comparisons demonstrate generally good agreement between the forward-modelled and observed reflectivities across most altitude levels. At both of the frequencies, the simulated reflectivities closely follow the observed profiles through the main parts of the ice cloud, with residuals typically well within ±0.5 dBZ. This agreement shows that the retrieved PSDs and scattering model are appropriate for the bulk of the ice cloud. However, at the cloud top regions and on some occasions in the cloud bottom regions, in particular panel (d) at the time of 11.625 h, below about 5 km, residuals show increased variability and magnitude, with some approaching −1 dBZ in those regions. At the cloud top regions, the radars become less sensitive, owing to the smaller sizes and concentrations of ice crystals making retrievals in those regions more problematic. The consistency of this pattern across all of the six times suggests that the greater deviations of the residuals from near-zero are systematic rather than random, indicating the fundamental limitation of the dual-frequency retrievals in regions where the ice crystals are small and radar sensitivity is reduced. At cloud bottom, ice crystal type may also be changing causing the retrievals to become more problematic where this could be occurring. The computed and measurement residuals are not shown for the exponential PSD assumption as these are very similar to those already presented in Fig. 11.
One radar frequency operated during C374 but not used in any retrievals was the G-band GRaCE radar, providing an excellent independent validation of the retrieved PSDs and scattering model. The radar operation during C374 and applied attenuation corrections have been fully discussed by McCusker et al. (2025), and so will not be repeated here. However, in this paper, the G-band reflectivities have been corrected for ice attenuation using the rosette aggregate model. The forward-modelled GRaCE radar reflectivity using the retrieved filtered PSDs and the randomly oriented rosette aggregate model is compared with the GRaCE observations in Fig. 12. The figure compares the forward-modelled 200 GHz radar reflectivity, computed from the retrieved PSDs assuming both the gamma and exponential PSD assumptions, with the GRaCE radar observations. The comparisons show time-averaged mean profiles, the standard radar reflectivity measurement uncertainty of ±1 dBZ, and the interpercentile ranges for both the observations and simulations. The simulations were averaged using the thresholds of 0.1 decimal hours for time and 100 m for the altitude to provide meaningful statistical comparisons. The comparisons were further restricted to times before approximately 11:45 UTC, beyond which the cloud evolved down to 2 km, a complex configuration which resulted in precipitation at later times. Above approximately 4.5 km the calculated reflectivities sit within or very close to the measured 10–90th percentile envelope, and the gamma and exponential assumptions produce very similar forward-modelled profiles. For the upper part of the cloud, this level of agreement provides strong support for the rosette-aggregate scattering model and retrieved PSDs. Indeed, Fig. 3a (upper panels), show the predominant habits to be rosettes and small rosette aggregates, providing further evidence for the choice of scattering model. Below approximately 4.5 km, the calculated mean reflectivities trend higher than the measured mean, although the calculated 10–90th percentile envelopes continue to overlap the measured envelope just above 3 km. These discrepancies as shown by Fig. 3a in the lower parts of the clouds, are likely owing to the presence of more irregular dendritic particles and snowflakes, which are not represented by the rosette-aggregate model used here. Also, the two PSD assumptions in the lower part of the cloud follow each other closely, indicating that this independent validation cannot discriminate between the two PSD shape assumptions.
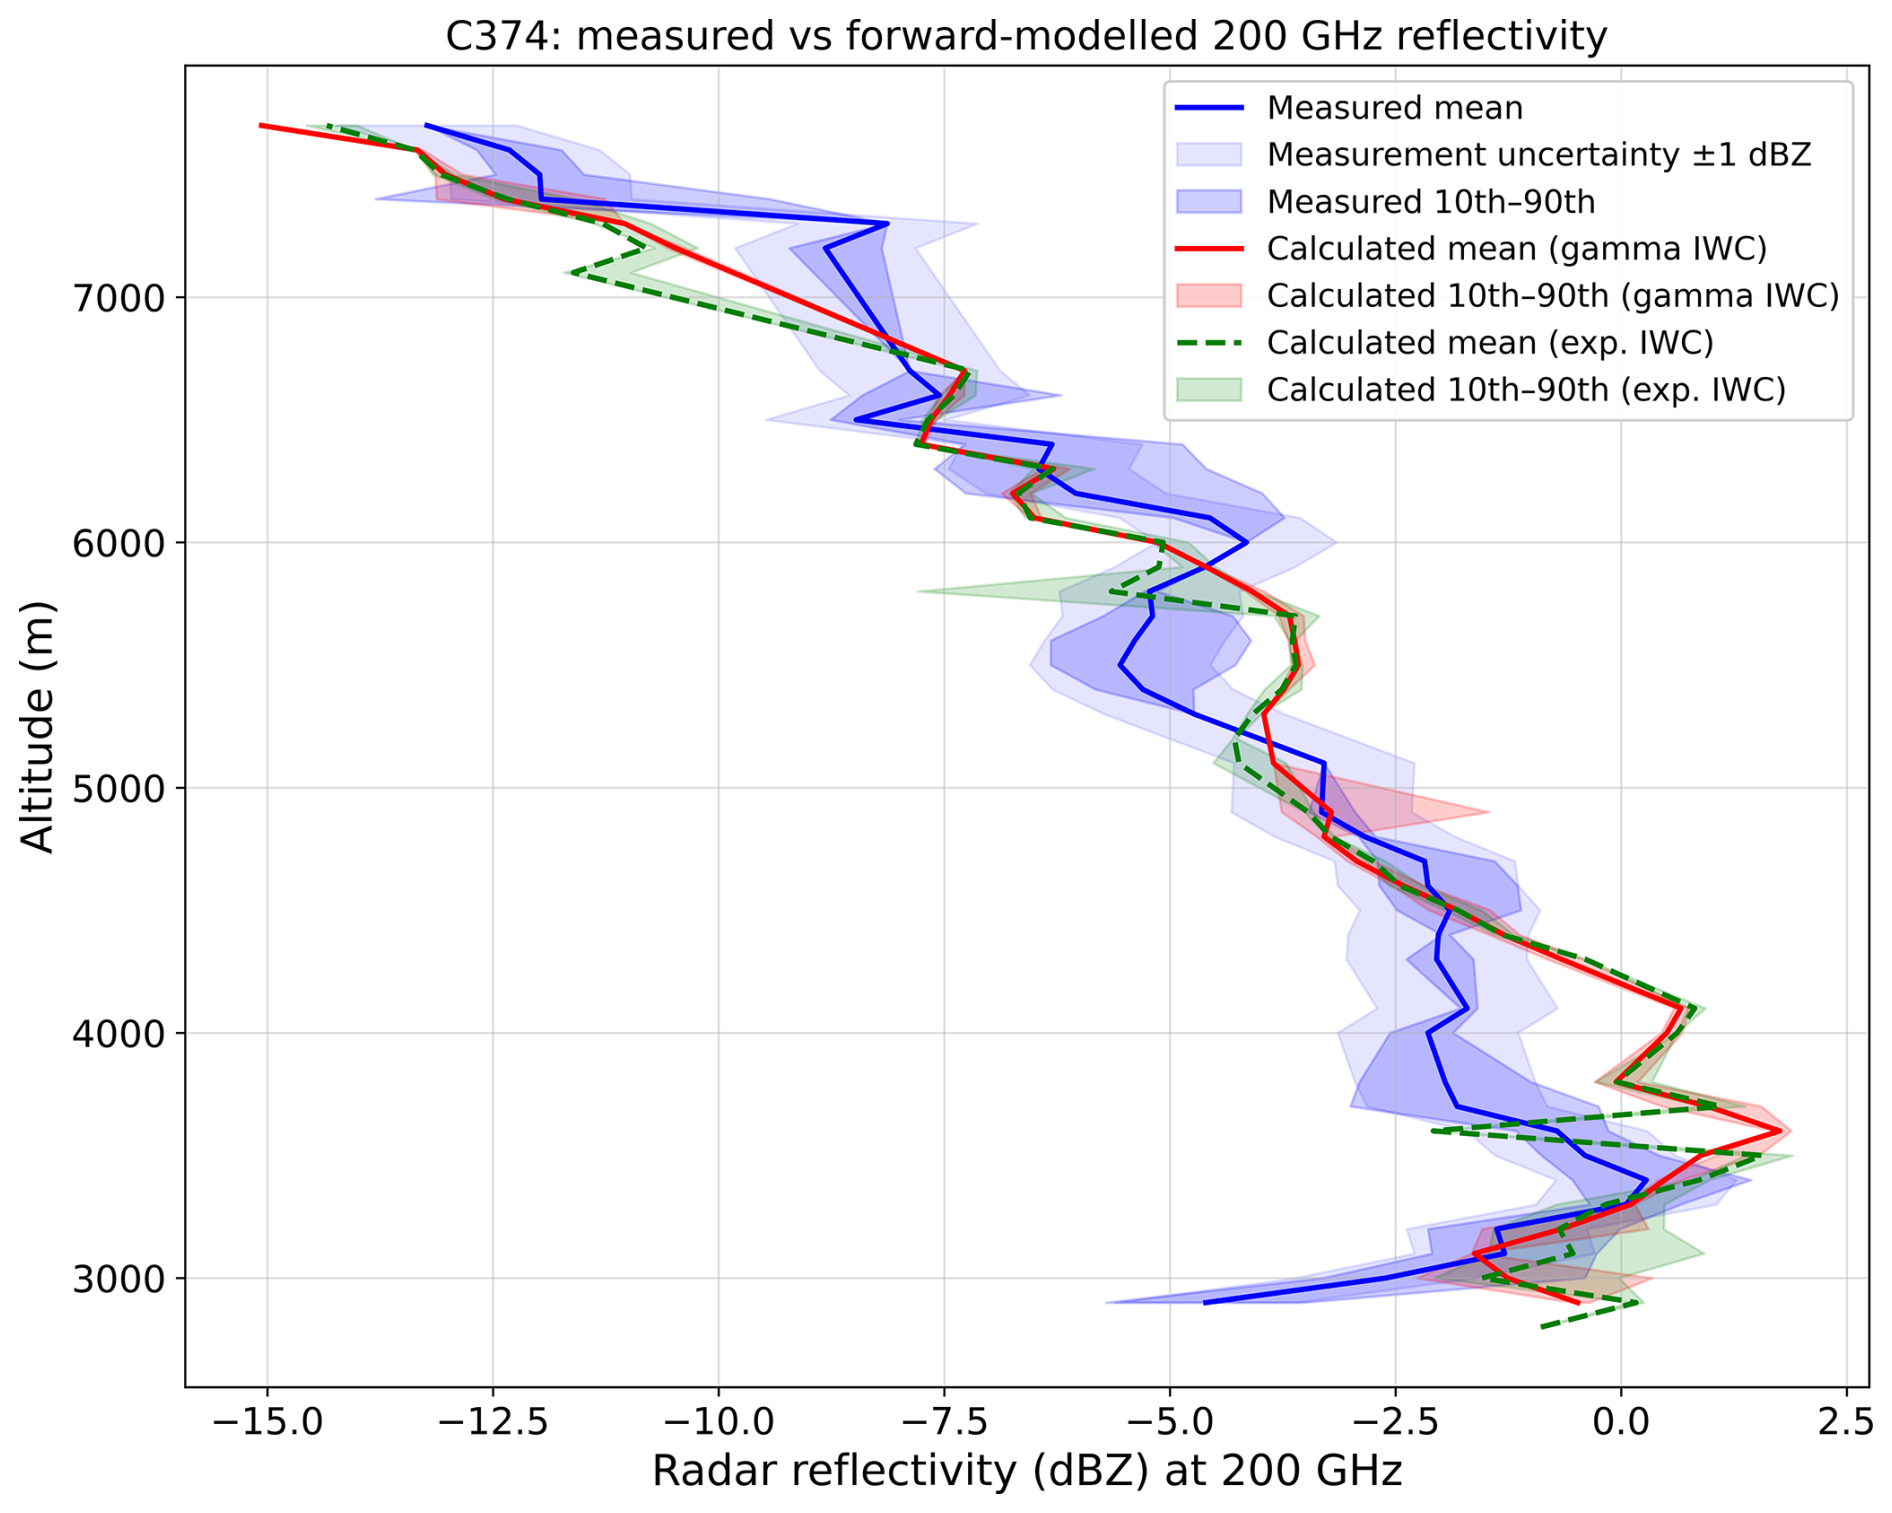
Figure 12Comparison of the time-averaged forward model simulations (red, green lines, and shade) assuming the retrieved PSDs, assuming the gamma (red lines) and exponential (green lines) PSDs for the retrieval of IWC at 3 GHz with the 200 GHz GRaCE radar observations (blue lines and shade). The key is shown in the top-right of the figure.
5.2 The case C379
For C379, the 94 GHz radar experienced severe attenuation owing to precipitation and collection of water on the radar dome that occurred at about 09:00 UTC. More prolonged precipitation occurred from about 17:00 UTC for the rest of the day of between about several to 1 mm h−1, as measured by the drop counting rain gauge at Chilbolton (McCusker et al., 2025). There was no rain after 10:00 UTC until about 16:00 UTC, when more episodic precipitation was measured by the rain gauge. The occurrence of lower-level liquid water cloud can clearly be seen in Fig. 2 (middle panel). Since this precipitation after 16:00 UTC occurred during the figure-of-eight overpasses and the aircraft in-situ sampling period, dual-frequency retrievals were not possible. Consequently, only single-frequency retrievals using the 35 GHz radar are employed for this case. We begin with ML to predict the PSD parameters and use these to generate the PSDs that are compared with the in-situ composite PSDs, following the same analysis as used in Sect. 5.1.
5.2.1 Moment estimations and comparisons with aircraft data for C379
Following the methodology for the case C374, we examine the ML performance in predicting the PSD moments for single-frequency retrievals. Consistent with C374, IWC was optimally retrieved using an exponential size distribution with the 3 GHz radar as input to the ML.
Figure 13a–d depicts the normalised PDFs, comparing the ML-predicted moments with those derived from the in-situ PSDs for Dmmw, M3, M4, and M6. The ML-predicted Dmmw distribution exhibits a bimodal structure with the primary peak positioned close to the in-situ peak. For the higher-order moments M3, M4, and M6, the ML-predicted distribution spreads align very well with the in-situ derived moments, suggesting the relative variability patterns are very well captured by ML for this case.
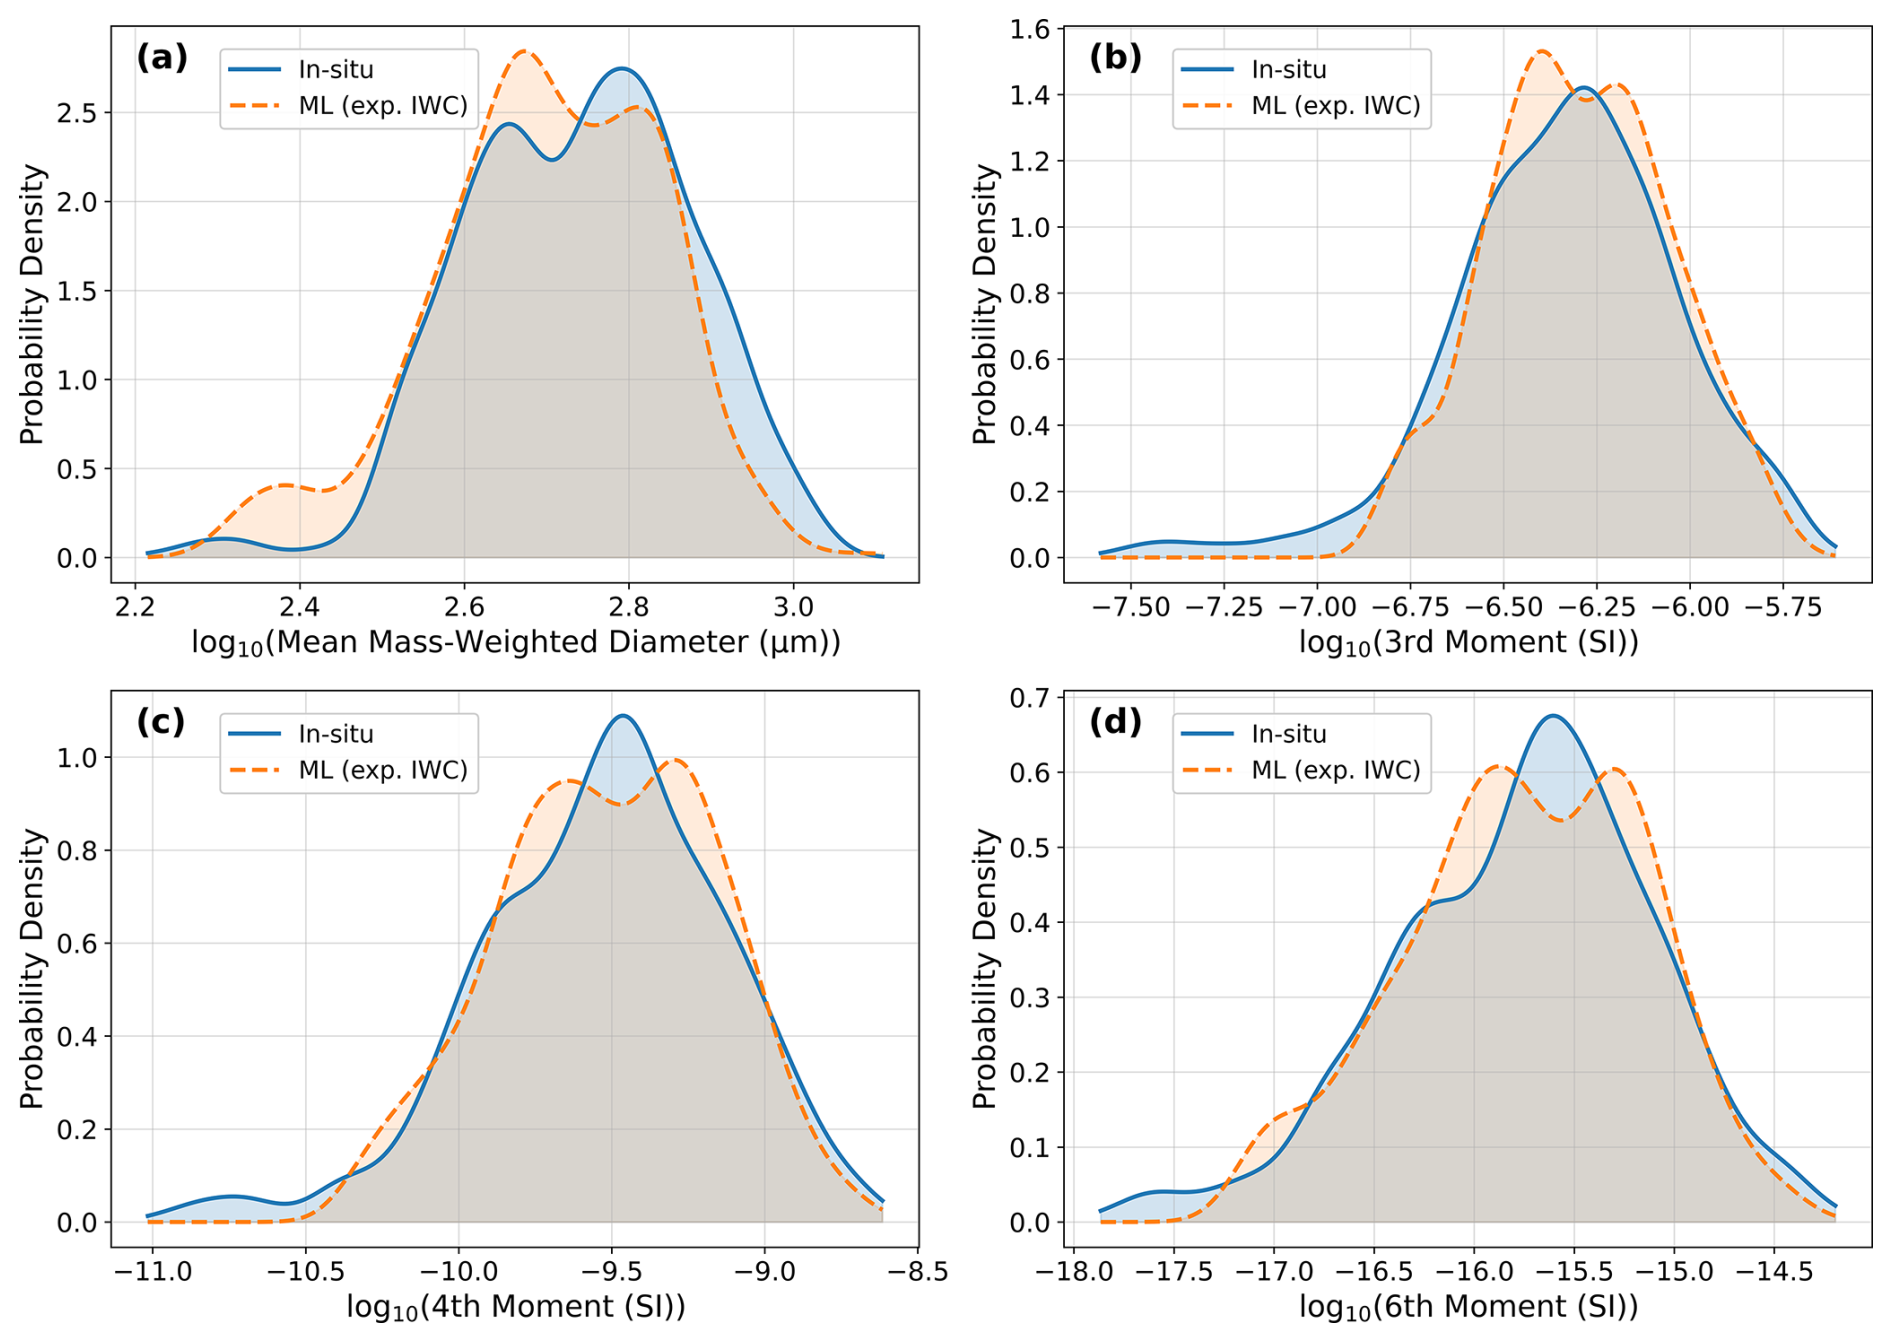
Figure 13Same as Fig. 9, but for the case C379 and using the exponential size distribution to retrieve IWC at 3 GHz.
5.2.2 Single-frequency retrievals of the PSDs and comparisons with the in-situ composite PSDs for C379
For case C379, we use the 35 GHz radar to the retrieve one PSD parameter. The IWC profile first-guess is retrieved from the 3 GHz radar assuming the gamma size distribution. The ML provides first-guess profiles for No and μ, while the slope parameter λ is optimised using Eq. (8) to minimise differences between the forward model simulations and the 35 GHz radar observations.
Figure 14a–d compares the single-frequency PSD retrievals with the in-situ measurements for four temperature bins (−50 to −40, −40 to −30, −30 to −20 and −20 to −10 °C).
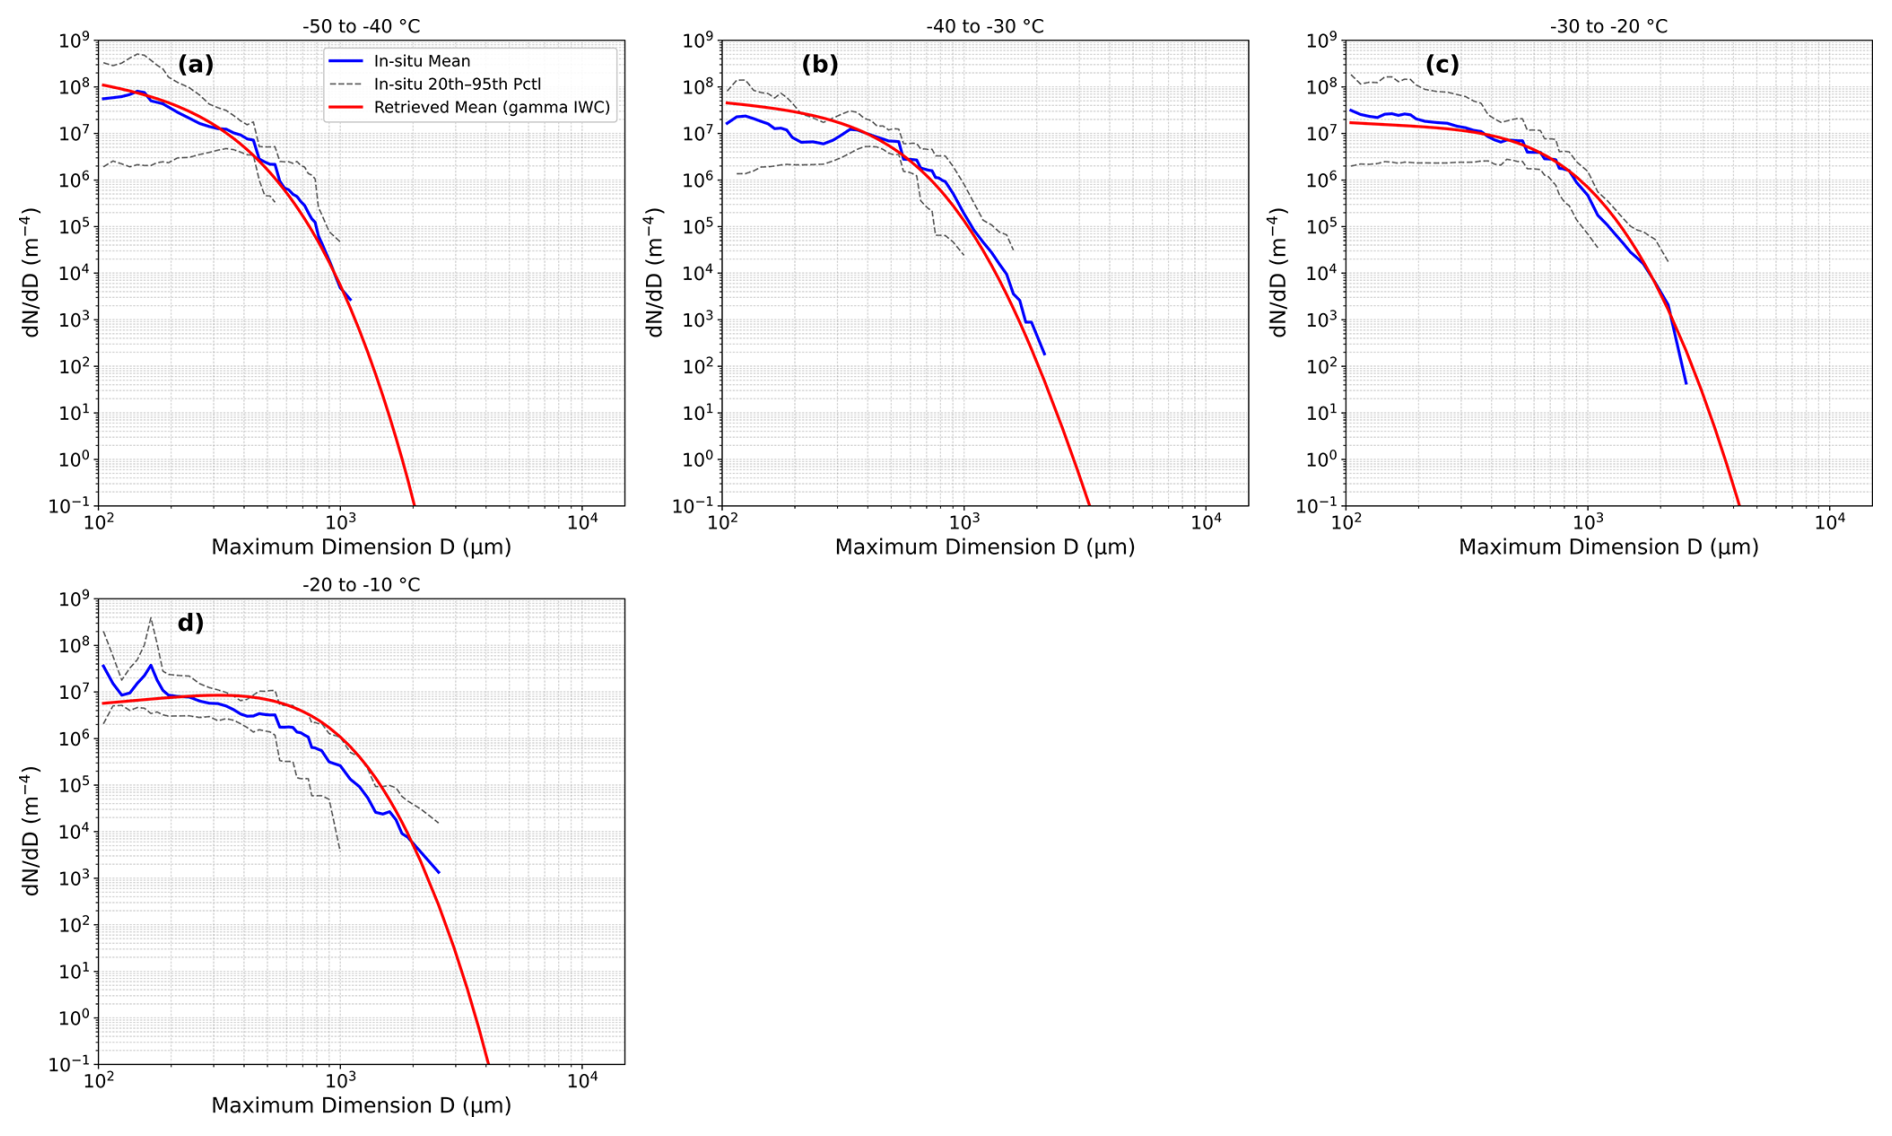
Figure 14Same as Fig. 10, but for the single-frequency retrieval using the 35 GHz radar and assuming the gamma size distribution for the retrieval of IWC at 3 GHz.
In Fig. 14a–d, the statistical variability of the mean retrieved PSD using a single-frequency shows good overlap within interpercentile ranges, except for panel (d) where occurrences for particle sizes between several hundred and several thousand µm are overestimated. Table 3 shows that the estimated mean IWC for this temperature bin is about three times larger than the in-situ value. This table also shows that the mean estimated IWCs agree well with the in-situ mean values between the temperatures of −50 to −20 °C.
Table 3Comparison of retrieved (Ret) and in-situ (In) statistics for the mean and standard deviation of the IWC in each temperature bin, with the total number (num) of retrievals and measurements filtered into each temperature bin.
Critically, the single-frequency retrievals agree well with the in-situ measured IWCs across the sampled temperature range. For this case, the differences between the forward-modelled radar reflectivities at 35 GHz and the observations when using the retrieved PSDs and scattering model are like those already presented for C374 in Fig. 11, and so are not repeated here for reasons of brevity. Suffice to say that generally throughout the cloud layer, between about 5.5 and 8 km, the measurement residuals are generally ≪0.5 dBZ for all overpass times. Having studied C374 and C379, we now examine the final case C382.
5.3 The case C382
Case C382 represents a test of the retrieval methodology for ice clouds that are geometrically thinner than the other two cases. To avoid precipitation contamination of approximately just over 1 mm h−1 between 16:00 and 17:00 UTC, this analysis focusses on the radar profile at 15.117 h, allowing application of the full dual-frequency retrieval methodology to the 3, 35 and 94 GHz radar profiles. For this case, the in-situ sampling began at 16.55 and continued until about 17.15 h, some 60–90 min after the first figure-of-eight overpasses, which began at about 15.00 h and ended at 15.43 h.
5.3.1 Moment estimations and comparisons with aircraft data for C382
Following the established methodology, we first examine the ML performance in predicting the PSD moments used in the dual-frequency retrievals. The IWC profile is retrieved at 3 GHz assuming the exponential size distribution function. Figure 15a–d, reveals a failure of the ML model for this thinner and colder ice cloud case, with minimal overlap between predicted and observed distributions. The ML-predicted Dmmw peaks at approximately 470 µm compared to the in-situ peak near to 600 µm. The higher-order moments show even larger systematic underestimation, with predicted distribution shapes differing significantly from the in-situ distributions.
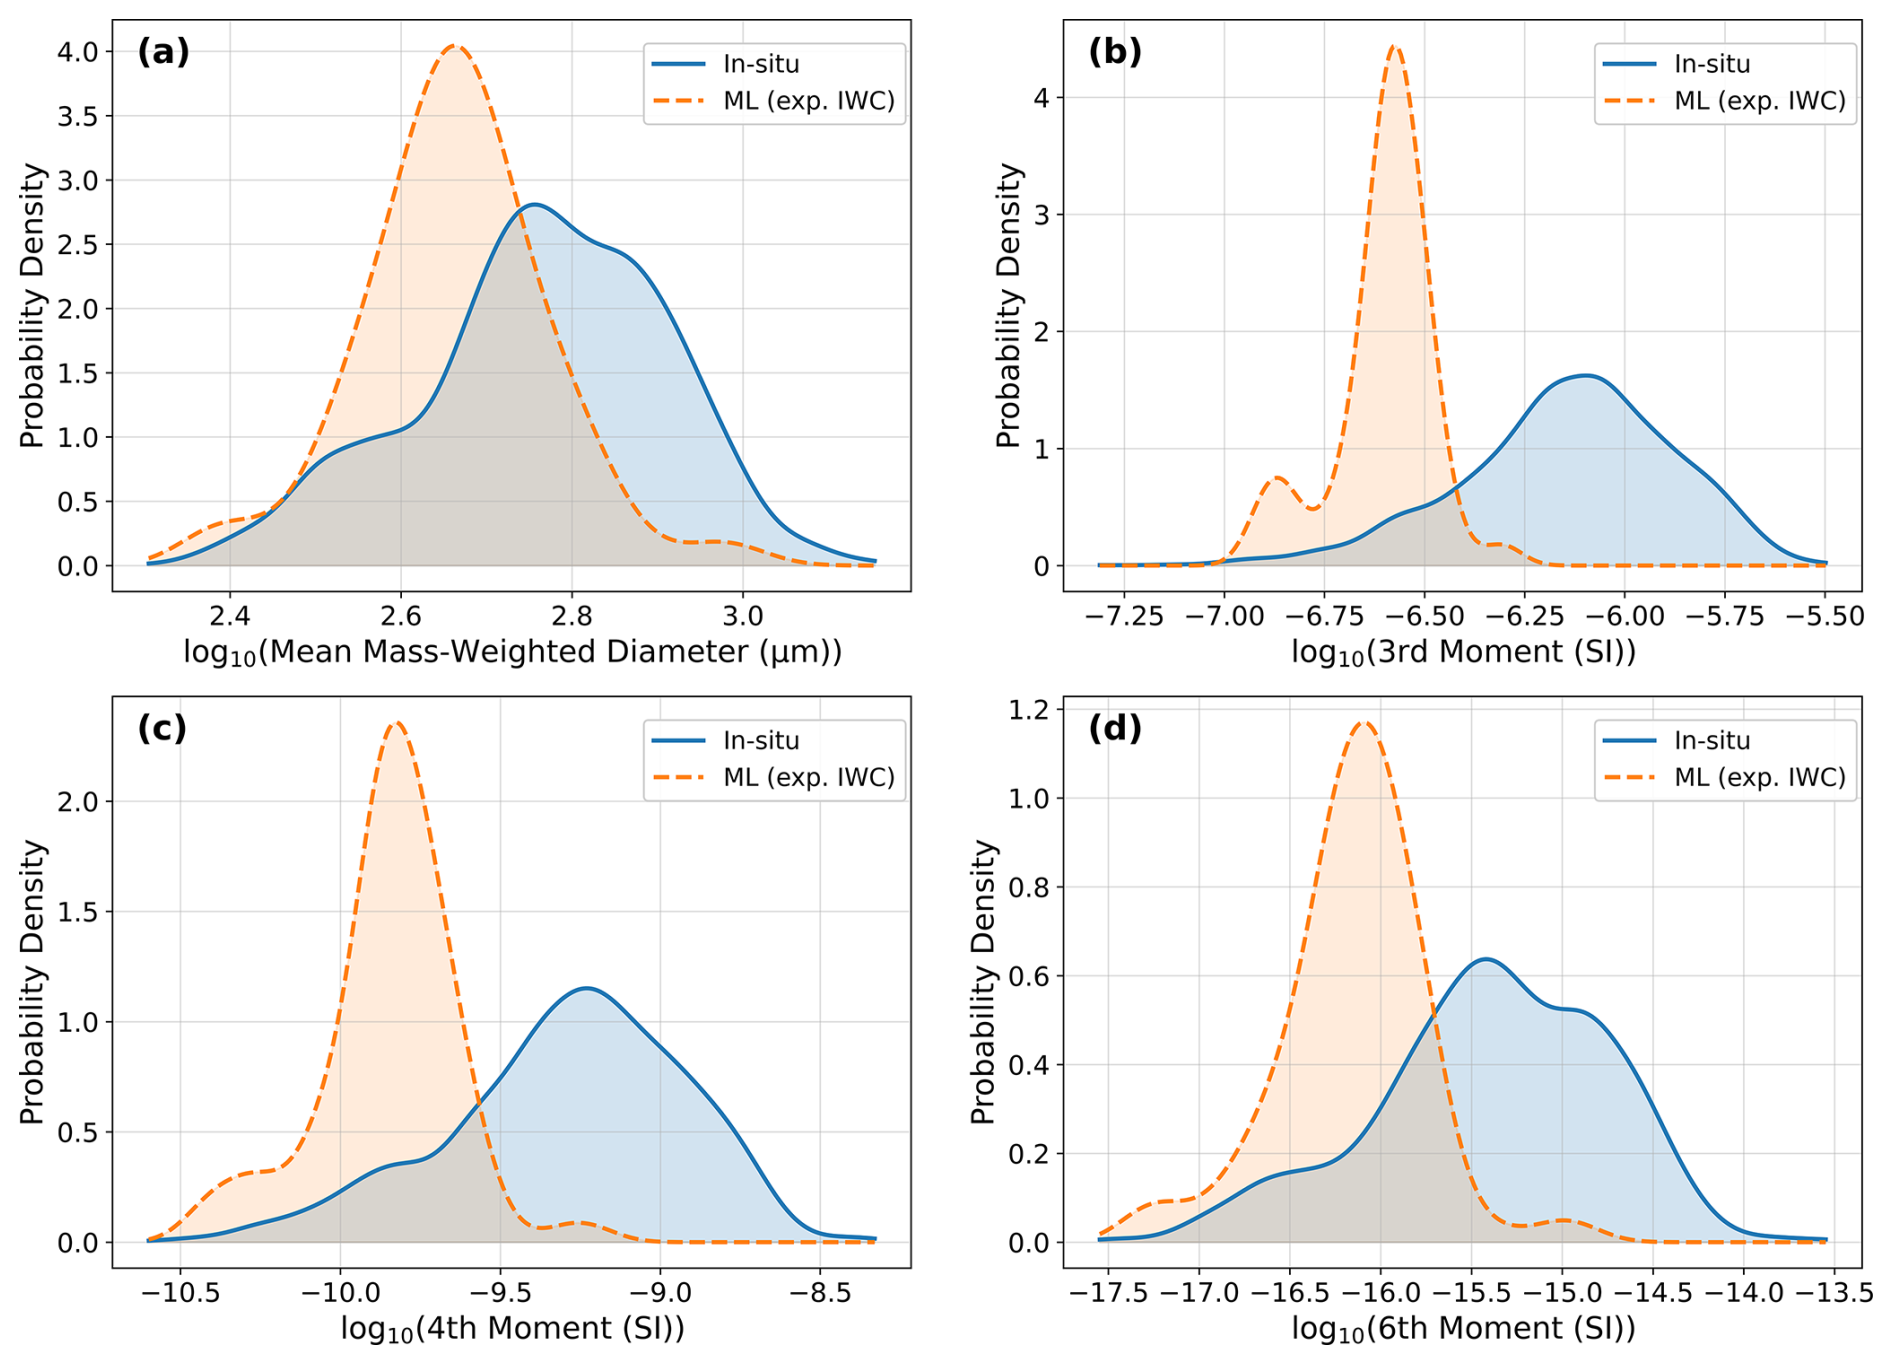
This ML failure likely occurs because C382 falls outside the model's training domain. The PICASSO campaign training dataset predominantly sampled lower-altitude warmer ice clouds. This underscores the importance of ensuring training datasets encompass the full range of atmospheric conditions expected in applications. This is also why the ML PSD profiles are generally used as the first guess estimates to aid physics-based multi-frequency radar retrievals of the PSDs.
5.3.2 Dual-frequency retrievals of the PSDs and comparisons with the in-situ composite PSDs for C382
Using the dual-frequency retrieval method with the ML-predicted moments from Fig. 15, the retrieved PSDs are compared with the in-situ measurements as a function of in-cloud temperature in Fig. 16a–c, following the same procedures as the other cases. Results assume the exponential size distribution for the retrieval of IWC at 3 GHz for altitudes greater than 5 km and IWCs greater than 0.002 g m−3. The ice cloud was situated between approximately 5.0 and 8 km, with the in-cloud temperatures stratified into three in-cloud temperature bins: −50 to −40, −40 to −30, and −30 to −20 °C.
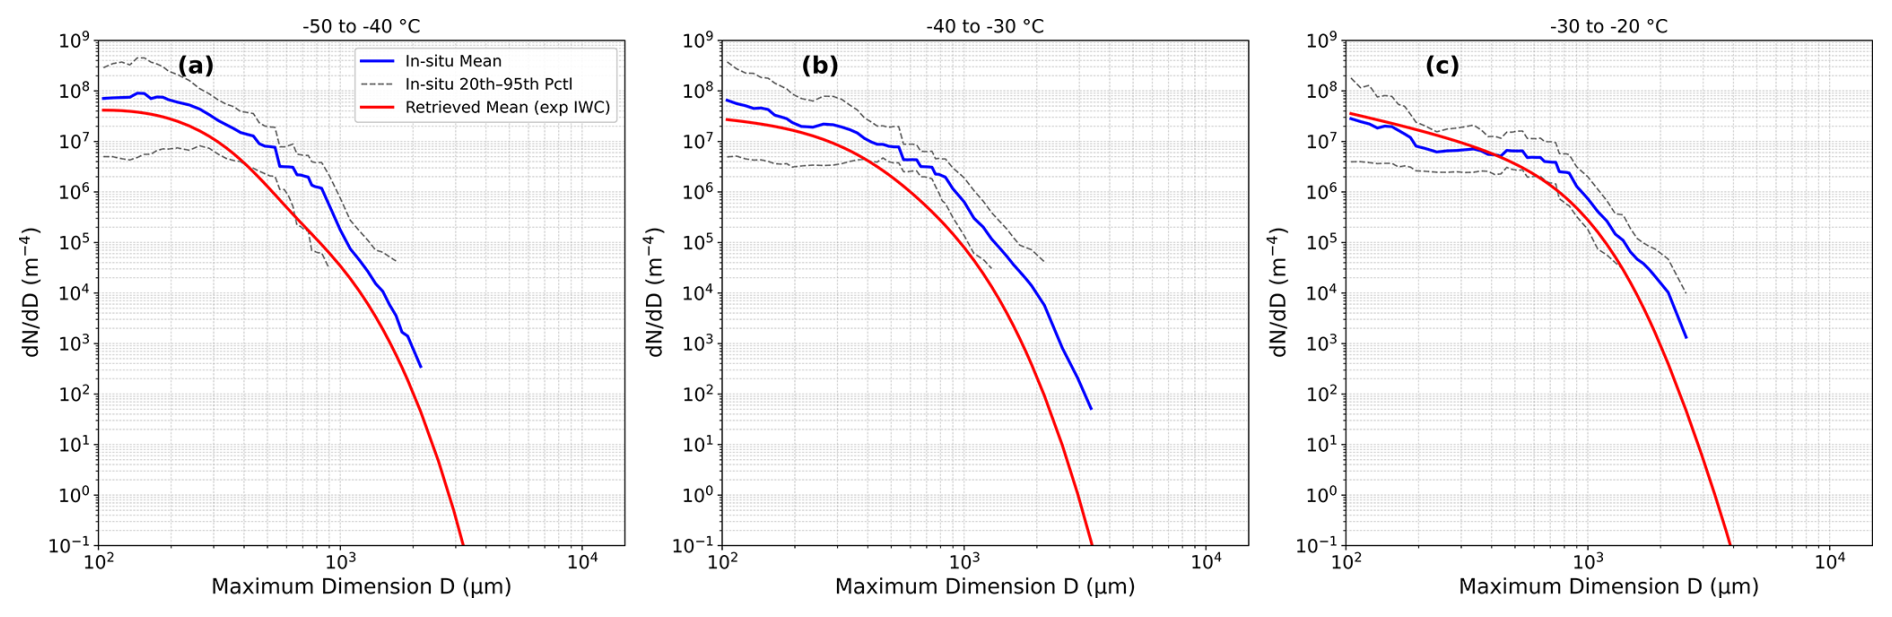
Figure 16As Fig. 14 but for C382 and temperature bins of (a) −50 to −40 °C, (b) −40 to −30 °C, and (c) −30 to −20 °C.
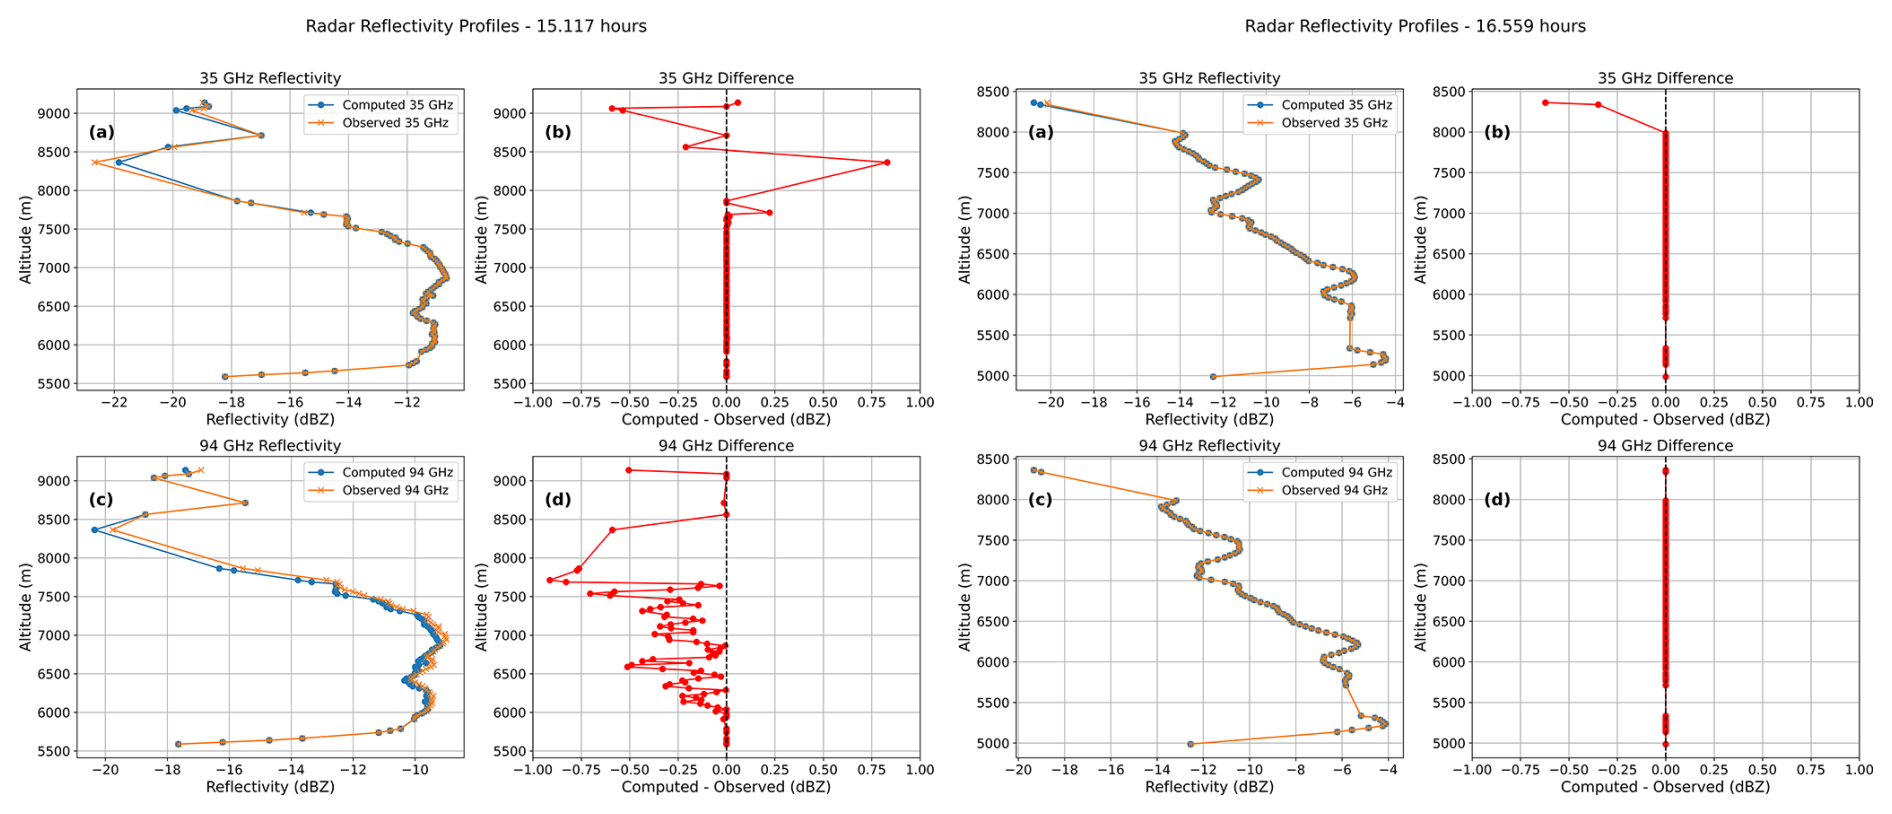
Figure 17Same as Fig. 11, but for the case C382 at the time of 15.117 h (left panel) and 15.559 h (right panel). Effects of a thin cirrus layer detached from the main ice layer can be seen at altitudes between about 8.5 and 9 km (left panel).
Figure 16a–c reveals that the dual-frequency retrievals do not improve upon the first-guess profiles, with mean retrieved PSDs generally systematically underestimating the in-situ number concentrations across all particle sizes at the two coldest temperature bins and for sizes greater than several hundred microns at the warmest temperature bin. This systematic bias propagates to substantial underestimation of computed IWC by several factors (not shown here for reasons of brevity). The in-situ PSDs exhibit notably broad distributions even at the coldest temperatures, suggesting the presence of large ice crystals throughout the sample volume of the in-situ measurements. Moreover, changing to the gamma size distribution to retrieve the IWC at 3 GHz does not fundamentally alter these results, indicating that the mismatch between ML predictions and the ice cloud conditions cannot be bridged by PSD parameter optimisation alone.
To investigate whether improved initial conditions could enhance performance, we replaced the ML model predictions with the in-situ derived gamma PSD parameters as the first guess estimates. The results of this investigation revealed that this substitution does not improve agreement between the retrieved and in-situ PSDs, the results being very similar to Fig. 16 and so are not reproduced here for reasons of brevity. Despite starting from nearly perfect conditions, the dual-frequency optimisation consistently drives the retrievals away from the in-situ measurements. This systematic divergence may suggest that the fundamental issue lies with a mismatch between the radar observations and the in-situ measurements themselves, most likely owing to temporal evolution of the ice cloud between radar sampling, which began at 15.117 h and ended at 16.559 h, and the later in-situ aircraft measurements. The 90 min interval between the beginning radar sampling time and the in-situ sampling that started after 16.559 h allowed the cloud to evolve toward broader PSDs with larger ice crystals.
To test whether the assumed Cotton et al. (2013) mass–dimension relation used in the rosette-aggregate scattering model is consistent with the in-situ measurements for C382, the IWC was re-computed from the composite PSDs using the relation in Eq. (10) and compared with the IWC derived from the Nevzorov probe. The re-computed PSD IWCs show a strong correlation with the measured IWCs with the correlation coefficient, r=0.88, and root mean square error of 0.014 g m−3, and bias of −0.006 g m−3. The very good agreement obtained between the re-computed IWCs and the measured IWCs indicates that the assumed mass–dimension used for the rosette-aggregate scattering model is consistent with the in-situ IWC and cannot explain the discrepancy between the retrieved and in-situ PSDs.
Figure 17 presents the measurement residual analysis for the dual-frequency radar retrievals at the beginning of the radar sampling time at 15.117 h (left panel) and at the end time 16.559 h (right panel). The 35 GHz residuals at 15.117 h are quite stable, with most retrieval residuals being well within ±0.25 dBZ. At 94 GHz, the residuals demonstrate a systematic negative bias in the presence of very small residuals at the corresponding 35 GHz altitudes, though most residuals are between zero and −0.5 dBZ. This asymmetry in the residual analysis is a result of the retrieval optimisation favouring the 35 GHz match at the expense of the 94 GHz match, which suggests that at the beginning of the radar sampling the scattering model might not be completely representative of ice habits at this time. However, both frequency residuals at the time of 16.559 h are essentially zero, except for near the cloud top at 35 GHz, and inspection of the other six radar-sampling times shows that the 94 GHz residual structure becomes progressively less noisy from beginning to end. The progressive stabilisation of the 94 GHz residual structure possibly suggests that the cloud evolves to ice habits that are more consistent with the scattering model used here, future radiative transfer studies will study this aspect further. Given the evolution of the 94 GHz residuals that is represented by Fig. 17, the temporal-evolution hypothesis remains the most plausible explanation for the discrepancy between the in-situ and retrieved PSDs.
In this paper, a new retrieval methodology has been presented for estimating mid-latitude PSD parameters using multi-frequency radar observations. The approach combines ensemble machine learning predictions of M2, M3, M4, and M6 moments of the PSD with dual-frequency optimised physical retrievals based on the randomly oriented rosette aggregate ice crystal scattering model. The ensemble ML model, trained on the PICASSO climatology, provides robust first guess profiles of the PSD parameters No, λ and μ, where No and λ are subsequently refined by the physical retrieval to achieve simultaneous agreement with the 35 and 94 GHz radar reflectivities. The 3 GHz radar data are used separately to retrieve the IWC profiles that enter the ML feature vector to ultimately inform the retrieval of the PSDs.
Application of this retrieval methodology to three of the CCREST-M case studies (i.e., C374, C379 and C382), supported by the FAAM aircraft in-situ measurements, demonstrates that for the combined ML–physics methodology yields PSDs that reproduce observed radar reflectivities to within typically ±0.25–0.5 dBZ for well-constrained cases such as C374. Comparisons with in-situ composite PSDs show that the retrievals capture the observed variability as a function of temperature, with generally good agreement in mean values of the number concentration with ice crystal maximum dimension. The choice of PSD functional form (i.e., the exponential or gamma size distributions) also introduces some sensitivity when retrieving the IWC using the 3 GHz radar profiles. For the case C374, the gamma size distribution assumption is largely within the interpercentile ranges of the in-situ PSDs and the estimated IWCs are statistically within the ranges of the in-situ measured IWC. The exponential size distribution could overestimate the number concentrations at the smaller and larger sizes, though were also largely within the in-situ ranges of the measured IWCs, apart from the warmest temperature bin. Independent validation with the 200 GHz radar reflectivities confirms the applicability of the rosette aggregate ice crystal scattering model for the bulk of the ice cloud above approximately 4.5 km, where the rosette aggregates were the predominant in-situ habit. In the lower cloud regions, the presence of other ice particle types was the likely cause of departures of the rosette aggregate model simulations from the measurements. The 200 GHz validation could not distinguish between the two PSD assumptions, and so no one PSD assumption was found to be the better choice.
For C379, the 35 GHz single-frequency retrievals of the PSDs achieved successful PSD retrievals when the ML first guess was also very good. However, the retrieved PSDs using the physically based optimisation method improved the ML first guess estimates and agreed well with the in-situ measurements for most of the temperature bins, demonstrating that single-frequency optimisation can still refine physically realistic first guess profiles when the ML model estimate is good.
However, for the case C382, limitations of the retrieval methodology were evident, where the presented methodology degrades in colder, thinner clouds where ML predictions extrapolate beyond their training range. For instance, in the case of C374 and C379, the ML first guess normalised distributions of the moments were found to overlap well with the normalised distributions of the in-situ derived moments. Only in the case of C382 did the ML method fail owing to an extrapolation being required rather than an interpolation. Case-to-case differences emphasise the need for diverse training datasets and capturing the temporal evolution of ice clouds for multi-frequency approaches to robustly characterise ice cloud microphysics. For C382, the optimised retrieval did produce converged retrievals with 35 GHz residuals essentially being at zero for most of the cloud layer during the radar-sampling period. However, the 94 GHz residuals revealed a small systematic negative bias at the beginning of the radar sampling but diminished and became essentially zero by the end of the sampling period. The 90 min time difference between the beginning of the radar sampling and in-situ sampling, combined with the evolution noted in the 94 GHz measurement residuals, strongly supports temporal evolution as the primary cause of the in-situ versus retrieved PSD disagreement.
A paper in preparation will use the same rosette aggregate ice crystal scattering model, together with the retrieved PSDs for all three cases, to forward model radiative transfer simulations of brightness temperatures across the mm-wave and sub-mm-wave spectrum. This will allow us to assess the consistency between the radar-constrained retrievals and the suitability of the adopted scattering model, using collocated radiometer measurements, for forward modelling in the data assimilation process.
CCREST-M code is available upon request.
The CCREST-M dropsonde, and aircraft in-situ measurements and the 3 (CAMRa), and 35 GHz (Kepler) radar data are available from the CEDA website located here: for C374: https://catalogue.ceda.ac.uk/uuid/7892db5c68104a0c9caf99bc59337647 (Facility for Airborne Atmospheric Measurements, Natural Environment Research Council, 2024a), for C379: https://catalogue.ceda.ac.uk/uuid/7892db5c68104a0c9caf99bc59337647 (Facility for Airborne Atmospheric Measurements, Natural Environment Research Council, 2024b), and for C382: https://catalogue.ceda.ac.uk/uuid/67911f14d0a24d7ea8866eaf4575e9f5 (Facility for Airborne Atmospheric Measurements, Natural Environment Research Council, 2024c).
AJB conceived the scientific objectives of the CCREST-M campaign, developed the retrieval methodology and its implementation, performed the retrieval and in-situ comparison analyses, and led the writing of the manuscript, including revisions. SF co-developed the scientific aims of the CCREST-M campaign, served as the principal lead for the aircraft flight operations, provided the atmospheric and radar datasets for the retrievals, and contributed to the manuscript review and preparation for submission. RC provided the in-situ PSD and Nevzorov data analyses, supplied the PICASSO PSD climatology, and contributed to manuscript proofing. JD provided the 94 GHz mini-BASTA radar data and its processing and contributed to manuscript proofing. CJW operated the Chilbolton Observatory radars during the CCREST-M campaign, provided and processed the CAMRa (3 GHz) and Kepler (35 GHz) radar datasets, and assisted with manuscript proofing. KM supplied the 200 GHz radar data and applied the necessary corrections for ice crystals, liquid water, and atmospheric attenuation. CDW provided the C081 PICASSO 3 GHz data, corrections for the near-antenna 3 GHz CCREST-M data, 200 GHz processed data, and assisted with manuscript proofing. PGH and the GRaCE team operated the 200 GHz radar system, provided the datasets to KM and CDW and contributed to manuscript proofing.
The contact author has declared that none of the authors has any competing interests.
Publisher's note: Copernicus Publications remains neutral with regard to jurisdictional claims made in the text, published maps, institutional affiliations, or any other geographical representation in this paper. The authors bear the ultimate responsibility for providing appropriate place names. Views expressed in the text are those of the authors and do not necessarily reflect the views of the publisher.
The authors would like to thank the crew and personnel involved in the CCREST-M campaign and the Chilbolton Observatory and mini-BASTA radar operators, and the personnel involved in the operation of the 200 GHz radar at Chilbolton Observatory. The BAe-146 research aircraft is operated by Airtask and Avalon and managed by FAAM. We further thank NCAS for the availability of the 35 GHz radar and CNRS, and the LATMOS for providing, operating, and delivering to the Chilbolton Observatory the mini-BASTA radar. Access to the 3 and 35 GHz radars was provided through the Atmospheric Measurement and Observation Facility (AMOF), part of UKRI-NERC funded National Capability delivered by the National Centre for Atmospheric Science (NCAS).
This research has been supported by the Met Office, Public Weather Service.
This paper was edited by Chao Liu and reviewed by Haoran Li and one anonymous referee.
Abel, S. J., Cotton, R. J., Barrett, P. A., and Vance, A. K.: A comparison of ice water content measurement techniques on the FAAM BAe-146 aircraft, Atmos. Meas. Tech., 7, 3007–3022, https://doi.org/10.5194/amt-7-3007-2014, 2014.
Atlas, D., Matrosov, S. Y., Heymsfield, A. J., Chou, M., and Wolff, D. B.: Radar and Radiation Properties of Ice Clouds, J. Appl. Meteor. Climatol., 34, 2329–2345, https://doi.org/10.1175/1520-0450(1995)034<2329:RARPOI>2.0.CO;2, 1995.
Baran, A. J.: A review of the light scattering properties of cirrus, J. Quant. Spectrosc. Ra., 110, 1239–1260, https://doi.org/10.1016/j.jqsrt.2009.02.026, 2009.
Baran, A. J.: From the single-scattering properties of ice crystals to climate prediction: A way forward, Atmos. Res., 112, 45–69, https://doi.org/10.1016/j.atmosres.2012.04.010, 2012.
Baran, A. J., Bodas-Salcedo, A., Cotton, R., and Lee, C.: Simulating the equivalent radar reflectivity of cirrus at 94 GHz using an ensemble model of cirrus ice crystals: a test of the Met Office global numerical weather prediction model, Q. J. Roy. Meteor. Soc., 137, 1547–1560, https://doi.org/10.1002/qj.870, 2011.
Baran, A. J., Heymsfield, A. J., Kleanthous, A., Westbrook, C. D., Betcke, T., Hewett, D. P., Barrett, P., and Fox, S.: Testing the Consistency of the Boundary Element Method for Computing the 75 Backscattering Properties of Complex Ice Crystals at Multiple Radar Frequencies, in: IGARSS 7–12 July, 2024 – 2024 IEEE International Geoscience and Remote Sensing Symposium, Athens, Greece, 2024, 538–541, https://doi.org/10.1109/IGARSS53475.2024.10641675, 2024.
Barker, H. W., Cole, J. N. S., Villefranque, N., Qu, Z., Velázquez Blázquez, A., Domenech, C., Mason, S. L., and Hogan, R. J.: Radiative closure assessment of retrieved cloud and aerosol properties for the EarthCARE mission: the ACMB-DF product, Atmos. Meas. Tech., 18, 3095–3107, https://doi.org/10.5194/amt-18-3095-2025, 2025.
Bartolomé García, I., Sourdeval, O., Spang, R., and Krämer, M.: Technical note: Bimodal parameterizations of in situ ice cloud particle size distributions, Atmos. Chem. Phys., 24, 1699–1716, https://doi.org/10.5194/acp-24-1699-2024, 2024.
Brath, M., Ekelund, R., Eriksson, P., Lemke, O., and Buehler, S. A.: Microwave and submillimeter wave scattering of oriented ice particles, Atmos. Meas. Tech., 13, 2309–2333, https://doi.org/10.5194/amt-13-2309-2020, 2020.
Cotton, R. J., Field, P. R., Ulanowski, Z., Kaye, P. H., Hirst, E., Greenaway, R. S., Crawford, I., Crosier, J., and Dorsey, J.: The effective density of small ice particles obtained from in situ aircraft observations of mid-latitude cirrus, Q. J. Roy. Meteor. Soc., 139, 1923–1934, https://doi.org/10.1002/qj.2058, 2013.
Courtier, B. M., Battaglia, A., Huggard, P. G., Westbrook, C., Mroz, K., Dhillon, R. S., Walden, C. J., Howells, G., Wang, H., Ellison, B. N., Reeves, R., Robertson, D. A., and Wylde, R. J.: First observations of G-band radar Doppler spectra, Geophys. Res. Lett., 49, e2021GL096475, https://doi.org/10.1029/2021GL096475, 2022.
Delanoë, J., Protat, A., Vinson, J. P., Brett, W., Caudoux, C., Bertrand, F., Parent du Chatelet, J., Hallali, R., Barthes, L., Haeffelin, M., and Dupont, J. C.: BASTA: A 95 GHz FMCW Doppler Radar for Cloud and Fog Studies, J. Atmos. Ocean. Tech., 33, 1023–1038, https://doi.org/10.1175/JTECH-D-15-0104.1, 2016.
Duffy, G. and Posselt, D. J.: A Gamma Parameterization for Precipitating Particle Size Distributions Containing Snowflake Aggregates Drawn from Five Field Experiments, J. Appl. Meteorol. Clim., 61, 1077–1085, https://doi.org/10.1175/JAMC-D-21-0131.1, 2022.
Ellison, W. J.: Permittivity of pure water, at standard atmospheric pressure, over the frequency range 0–25 Hz and the temperature range 0–100 °C, J. Phys. Chem. Ref. Data, 36, https://doi.org/10.1063/1.2360986, 2007.
Eriksson, P., Ekelund, R., Mendrok, J., Brath, M., Lemke, O., and Buehler, S. A.: A general database of hydrometeor single scattering properties at microwave and sub-millimetre wavelengths, Earth Syst. Sci. Data, 10, 1301–1326, https://doi.org/10.5194/essd-10-1301-2018, 2018.
Eriksson, P., Rydberg, B., Mattioli, V., Thoss, A., Accadia, C., Klein, U., and Buehler, S. A.: Towards an operational Ice Cloud Imager (ICI) retrieval product, Atmos. Meas. Tech., 13, 53–71, https://doi.org/10.5194/amt-13-53-2020, 2020.
Facility for Airborne Atmospheric Measurements, Natural Environment Research Council: FAAM C374 CCREST-M flight: Airborne atmospheric measurements from core instrument suite on board the BAE-146 aircraft, NERC EDS Centre for Environmental Data Analysis [data set], https://catalogue.ceda.ac.uk/uuid/7892db5c68104a0c9caf99bc59337647, 2024a.
Facility for Airborne Atmospheric Measurements, Natural Environment Research Council: FAAM C374 CCREST-M flight: Airborne atmospheric measurements from core instrument suite on board the BAE-146 aircraft, NERC EDS Centre for Environmental Data Analysis [data set], https://catalogue.ceda.ac.uk/uuid/7892db5c68104a0c9caf99bc59337647, 2024b.
Facility for Airborne Atmospheric Measurements, Natural Environment Research Council: FAAM C382 CCREST-M flight: Airborne atmospheric measurements from core instrument suite on board the BAE-146 aircraft, NERC EDS Centre for Environmental Data Analysis [data set], https://catalogue.ceda.ac.uk/uuid/67911f14d0a24d7ea8866eaf4575e9f5, 2024c.
Field, P. R., Hill, A., Shipway, B., Furtado, K., Wilkinson, J., Miltenberger, A., Gordon, H., Grosvenor, D.P., Stevens, R., and Van Weverberg, K.: Implementation of a double moment cloud microphysics scheme in the UK met office regional numerical weather prediction model, Q. J. Roy. Meteor. Soc., 149, 703–739, https://doi.org/10.1002/qj.4414, 2023.
Fontaine, E., Leroy, D., Schwarzenboeck, A., Delanoë, J., Protat, A., Dezitter, F., Grandin, A., Strapp, J. W., and Lilie, L. E.: Evaluation of radar reflectivity factor simulations of ice crystal populations from in situ observations for the retrieval of condensed water content in tropical mesoscale convective systems, Atmos. Meas. Tech., 10, 2239–2252, https://doi.org/10.5194/amt-10-2239-2017, 2017.
Fox, S., Lee, C., Moyna, B., Philipp, M., Rule, I., Rogers, S., King, R., Oldfield, M., Rea, S., Henry, M., Wang, H., and Harlow, R. C.: ISMAR: an airborne submillimetre radiometer, Atmos. Meas. Tech., 10, 477–490, https://doi.org/10.5194/amt-10-477-2017, 2017.
Geer, A. J. and Baordo, F.: Improved scattering radiative transfer for frozen hydrometeors at microwave frequencies, Atmos. Meas. Tech., 7, 1839–1860, https://doi.org/10.5194/amt-7-1839-2014, 2014.
Geer, A. J., Baordo, F., Bormann, N., English, S., Kazumori, M., Lawrence, H., Lean, P., Lonitz, K., and Lupu, C.: The growing impact of satellite observations sensitive to humidity, cloud and precipitation, Q. J. Roy. Meteor. Soc., 143, 3189–3206, https://doi.org/10.1002/qj.3172, 2017.
Geer, A. J., Bauer, P., Lonitz, K., Barlakas, V., Eriksson, P., Mendrok, J., Doherty, A., Hocking, J., and Chambon, P.: Bulk hydrometeor optical properties for microwave and sub-millimetre radiative transfer in RTTOV-SCATT v13.0, Geosci. Model Dev., 14, 7497–7526, https://doi.org/10.5194/gmd-14-7497-2021, 2021.
Heymsfield, A., Bansemer, A., Heymsfield, G., Noone, D., Grecu, M., and Toohey, D.: Relationship of Multiwavelength Radar Measurements to Ice Microphysics from the IMPACTS Field Program, J. Appl. Meteorol. Clim., 62, 289–315, https://doi.org/10.1175/JAMC-D-22-0057.1, 2023.
Hogan, R. J., Illingworth, A. J., and Sauvageot, H.: Measuring Crystal Size in Cirrus Using 35- and 94-GHz Radars, J. Atmos. Ocean. Tech., 17, 27–37, https://doi.org/10.1175/1520-0426(2000)017<0027:MCSICU>2.0.CO;2, 2000.
Hogan, R. J., Mittermaier, M. P., and Illingworth, A. J.: The retrieval of ice water content from radar reflectivity factor and temperature and its use in evaluating a mesoscale model, J. Appl. Meteorol. Clim., 45, 301–317., https://doi.org/10.1175/JAM2340.1, 2006.
Hong, G., Yang, P., Baum, B. A., and Heymsfield, A. J.: Relationship between ice water content and equivalent radar reflectivity for clouds consisting of nonspherical ice particles, J. Geophys. Res., 113, D20205, https://doi.org/10.1029/2008JD009890, 2008.
Hong, Y., Meng, H., Fan, Y., Dong, J., Ren, T., and Yang, P.: The effects of ice habit models on passive snowfall rate retrievals, Geophys. Res. Lett., 52, e2025GL11685, https://doi.org/10.1029/2025GL116853, 2025.
Illingworth, A. J., Barker, H. W., Beljaars, A., Ceccaldi, M., Chepfer, H., Clerbaux, N., Cole, J., Delanoë, J., Domenech, C., Donovan, D. P., Fukuda, S., Hirakata, M., Hogan, R. J., Huenerbein, A., Kollias, P., Kubota, T., Nakajima, T., Nakajima, T. Y., Nishizawa, T., Ohno, Y., Okamoto, H., Oki, R., Sato, K., Satoh, M., Shephard, M. W., Velázquez-Blázquez, A., Wandinger, U., Wehr, T., and van Zadelhoff, G.-J.: The EarthCARE Satellite: The Next Step Forward in Global Measurements of Clouds, Aerosols, Precipitation, and Radiation, B. Am. Meteorol. Soc., 96, 1311–1332, https://doi.org/10.1175/BAMS-D-12-00227.1, 2015.
International Telecommunication Union (ITU).P.676: Attenuation by atmospheric gases and related effects, https://www.itu.int/rec/R-REC-P.676-13-202208-I/en (last access: 26 June 2026), 2022.
Janisková., M.: Assimilation of cloud information from space-borne radar and lidar: experimental study using a 1D+4D-Var technique, Q. J. Roy. Meteor. Soc., 141, 2708–2725, https://doi.org/10.1002/qj.2558, 2015.
Kleanthous, A., Betcke, T., Hewett, D. P., Escapil-Inchauspé, P., Jerez-Hanckes, C., and Baran, A. J.: Accelerated Calderón preconditioning for Maxwell transmission problems, J. Comput. Phys., 458, 111099, https://doi.org/10.1016/j.jcp.2022.111099, 2022.
Kleanthous, A., Baran, A. J., Betcke, T., Hewett, D. P., and Westbrook, C. D.: An application of the boundary element method (BEM) to the calculation of the single-scattering properties of very complex ice crystals in the microwave and sub-millimetre regions of the electromagnetic spectrum, J. Quant. Spectrosc. Ra., 312, 108793, https://doi.org/10.1016/j.jqsrt.2023.108793, 2024.
Kozu, T. and Nakamura, K.: Rainfall Parameter Estimation from Dual-Radar Measurements Combining Reflectivity Profile and Path-integrated Attenuation, J. Atmos. Ocean. Tech., 8, 259–270, https://doi.org/10.1175/1520-0426(1991)008<0259:RPEFDR>2.0.CO;2, 1991.
Krämer, M., Spelten, N., Rolf, C., and Spang, R.: A microphysics guide to cirrus – Part 3: Occurrence patterns of cloud particles, Atmos. Chem. Phys., 25, 13563–13583, https://doi.org/10.5194/acp-25-13563-2025, 2025.
Lawson, R. P., Woods, S., Jensen, E., Erfani, E., Gurganus, C., Gallagher, M., Connolly, P., Whiteway, J., Baran, A. J., May, P., Heymsfield, A., Schmitt, C. G., McFarquhar, G., Um, J., Protat, A., Bailey, M., Lance, S., Muehlbauer, A., Stith, J., Korolev, A., Toon, O. B., and Krämer, M.: A review of ice particle shapes in cirrus formed in situ and in anvils, J. Geophys. Res.-Atmos., 124, 10049–10090, https://doi.org/10.1029/2018JD030122, 2019.
Li, Q., Li, H., Sun, X., Zhang, Y., Lyu, W., Ruan, Z., Liu, L., Liu, A., and Zhang, C.: A survey of snow growth signatures from tropics to Antarctica using triple-frequency radar observations, Atmos. Chem. Phys., 26, 1249–1264, https://doi.org/10.5194/acp-26-1249-2026, 2026.
Liu, P., Gao, J., Zhang, G., Carlin, J. T.: Assimilation of radar reflectivity data using parameterized forward operators for improving short-term forecasts of high-impact convection events, J. Geophys. Res.-Atmos., 129, e2024JD041458, https://doi.org/10.1029/2024JD041458, 2024.
Liou, K.: Influence of Cirrus Clouds on Weather and Climate Processes: A Global Perspective, Mon. Weather Rev., 114, 1167–1199, https://doi.org/10.1175/1520-0493(1986)114<1167:IOCCOW>2.0.CO;2, 1986.
Liou, K. N. and Yang, P.: Light Scattering by Ice Crystals: fundamentals and applications, Cambridge University Press, Cambridge, UK, https://doi.org/10.1017/CBO9781139030052, 2016.
Mätzler, C.: Microwave dielectric properties of ice, Thermal Microwave Radiation: Applications for Remote Sensing, 52, 455–462, 2006.
Mason, S. L., Barker, H. W., Cole, J. N. S., Docter, N., Donovan, D. P., Hogan, R. J., Hünerbein, A., Kollias, P., Puigdomènech Treserras, B., Qu, Z., Wandinger, U., and van Zadelhoff, G.-J.: An intercomparison of EarthCARE cloud, aerosol, and precipitation retrieval products, Atmos. Meas. Tech., 17, 875–898, https://doi.org/10.5194/amt-17-875-2024, 2024.
May, E., Rydberg, B., Kaur, I., Mattioli, V., Hallborn, H., and Eriksson, P.: The Ice Cloud Imager: retrieval of frozen water column properties, Atmos. Meas. Tech., 17, 5957–5987, https://doi.org/10.5194/amt-17-5957-2024, 2024.
McCusker, K., Baran, A. J., Westbrook, C., Fox, S., Eriksson, P., Cotton, R., Delanoë, J, and Ewald, F.: The first microwave and submillimetre closure study using particle models of oriented ice hydrometeors to simulate polarimetric measurements of ice clouds, Atmos. Meas. Tech., 17, 3533–3552, https://doi.org/10.5194/amt-17-3533-2024, 2024.
McCusker, K., Westbrook, C., Battaglia, A., Mroz, K., Courtier, B. M., Huggard, P. G., Wang, H., Reeves, R., Walden, C. J., Cotton, R., Fox, S., and Baran, A. J.: Estimating vertical profiles of ice water content and snowfall rate from radar measurements in the G-band, Atmos. Meas. Tech., 18, 7833–7852, https://doi.org/10.5194/amt-18-7833-2025, 2025.
McFarquhar, G. M., Baumgardner, D., Bansemer, A., Abel, S. J., Crosier, J., French, J., Rosenberg, P., Korolev, A., Schwarzoen-boeck, A., Leroy, D., Um, J., Wu, W., Heymsfield, A. J., Twohy, C., Detwiler, A., Field, P., Neumann, A., Cotton, R., Axisa, D., and Dong, J.: Processing of Ice Cloud In Situ Data Collected by Bulk Water, Scattering, and Imaging Probes: Fundamentals, Uncertainties, and Efforts toward Consistency, Meteor. Mon., 58, 1.1–11.33, https://doi.org/10.1175/AMSMONOGRAPHS-D-16-0007.1, 2017.
Naud, C. M., J. Muller, E. C. Slack, C. L. Wrench, and E. E. Clothiaux.: Assessment of the Performance of the Chilbolton 3 GHz Advanced Meteorological Radar for Cloud-Top-Height Retrieval, J. Appl. Meteorol. Clim., 44, 876–887, https://doi.org/10.1175/JAM2244.1, 2005.
Nelder, J. A., Mead, R. A Simplex Method for Function Minimization, Comput. J., 7, 308–313, https://doi.org/10.1093/comjnl/7.4.308, 1965.
Pedregosa, F., Varoquaux, G., Gramfort, A., Michel, V., Thirion, B., Grisel, O., Blondel, M., Müller, A., Nothman, J., Louppe, G., Prettenhofer, P., Weiss, R., Dubourg, V., Vanderplas, J., Passos, A., Cournapeau, D., Brucher, M., Perrot, M., and Duchesnay, É.: Scikit-learn: Machine learning in Python, J. Mach. Learn. Res., 12, 2825–2830, 2011.
Schrom, R. S., Kumjian, M. R.: A Probabilistic Radar Forward Model for Branched Planar Ice Crystals, J. Appl. Meteorol. Clim., 58, 1245–1265, https://doi.org/10.1175/JAMC-D-18-0204.1, 2019.
Sephton, E.: Understanding the Origins of Ice in Mixed-Phase Layer Clouds, PhD, The University of Manchester (United Kingdom), https://search.proquest.com/openview/6bd6e902c7690c8413a32a3734738137/1?pq-origsite=gscholar&cbl=2026366&diss=y (last access: 26 June 2026), 2022.
Wagner, S. W., Schnaiter, M., Xu, G., Rogge, F., and Järvinen, E.: Light scattering and microphysical properties of atmospheric bullet rosette ice crystals, Atmos. Chem. Phys., 25, 8785–8804, https://doi.org/10.5194/acp-25-8785-2025, 2025.
Walden, C.: UL HATPRO-G5, ACTRIS Cloud remote sensing data centre unit (CLU), https://hdl.handle.net/21.12132/3.5f5640d6deb6491d, 2026a.
Walden, C.: UKRI CL51, ACTRIS Cloud remote sensing data centre unit (CLU), https://hdl.handle.net/21.12132/3.1ca2b7d6323f486b, 2026b.
Wang, S. and Liu, Z.: A radar reflectivity operator with ice-phase hydrometeors for variational data assimilation (version 1.0) and its evaluation with real radar data, Geosci. Model Dev., 12, 4031–4051, https://doi.org/10.5194/gmd-12-4031-2019, 2019.
Westbrook, C. D., Ball, R. C., Field, P. R., and Heymsfield, A. J.: A theory of growth by differential sedimentation with application to snowflake formation, Phys. Rev. E, 70, https://doi.org/10.1103/PhysRevE.70.021403, 2004.
Wood, N. B. and L'Ecuyer, T. S.: What millimeter-wavelength radar reflectivity reveals about snowfall: an information-centric analysis, Atmos. Meas. Tech., 14, 869–888, https://doi.org/10.5194/amt-14-869-2021, 2021.
Wu, B., Wang, Y., Fan, X., Liu, S., and Fu, Y.: A mixing scheme of ice particle models for global ice cloud measurements, Remote Sens. Environ., 313, 114356, https://doi.org/10.1016/j.rse.2024.114356, 2024.
Yang, P., Liou, K.-N., Bi, L., Liu, C., Yi, B., and Baum, B. A.: On the radiative properties of ice clouds: Light scattering, remote sensing, and radiation parameterization, Adv. Atmos. Sci., 32, 32–63, https://doi.org/10.1007/s00376-014-0011-z, 2015.
- Abstract
- Introduction
- The rationale of the CCREST-M campaign, instrumentation and data
- The ice crystal scattering model and forward radar reflectivity model
- The PSD assumptions, machine learning approach, and retrieval methodology
- The PSD parameter retrievals and comparisons with aircraft data
- Summary and conclusions
- Code availability
- Data availability
- Author contributions
- Competing interests
- Disclaimer
- Acknowledgements
- Financial support
- Review statement
- References