
the Creative Commons Attribution 4.0 License.
the Creative Commons Attribution 4.0 License.
 | 28 Jul 2026
How does assimilating a large commercial GNSS RO dataset impact HAFS hurricane forecasts? An evaluation in support of the ROMEX experiment
William J. Miller
Yong Chen
Shu-Peng Ho
Xi Shao
While Global Navigation Satellite System (GNSS) radio occultation (RO) data assimilation improves tropical cyclone (TC) intensity forecasts, the scaling of these impacts with RO observation volume remains unclear. This observing system experiment (OSE) study evaluates the impact of assimilating the large commercial GNSS RO profile dataset from the Radio Occultation Modeling EXperiment (ROMEX) on 84 Hurricane Analysis and Forecast System – configuration A (HAFS-A) model forecasts of four 2022 Atlantic hurricanes. The ROMEX dataset contains about 20 000 daily global Spire and PlanetiQ profiles, which is roughly triple the volume of government-provided RO data that the National Centers for Environmental Prediction (NCEP) assimilated operationally in 2022. Compared to a Control experiment that uses only operational RO data, assimilating ROMEX data together with operational RO profiles in HAFS-A yields ∼ 5 %–15 % relative skill improvement in minimum central sea-level pressure (PMIN) absolute intensity forecast errors in short-range forecasts, and it nearly eliminates a ∼ 2–3 hPa PMIN over-intensification bias in medium-to-long range forecasts. Additionally, ROMEX commercial RO data assimilation reduces errors in HAFS-A temperature and water vapor in the middle-to-upper troposphere. A sensitivity experiment shows that lower-tropospheric RO data assimilated below the 5 km impact height contribute substantially to ROMEX forecast improvements relative to Control. These results demonstrate that quadrupling the volume of assimilated GNSS RO data yields a meaningful positive impact on regional model TC forecasts.
- Article
(10727 KB) - Full-text XML
- BibTeX
- EndNote


Global Navigation Satellite System (GNSS) radio occultation (RO) events occur when Low Earth Orbit (LEO) receiver satellites intercept radio signals transmitted by GNSS satellites [e.g., Global Positioning System (GPS), Global Navigation Satellite System (GLONASS)] that have passed through the Earth's atmosphere along limb soundings. Atmospheric refraction bends the RO ray, causing a delay in the received radio signal relative to its predicted phase in a vacuum. Processing centers, such as the University Corporation for Atmospheric Research (UCAR)'s COSMIC Data and Archive Center (CDAAC), use physics-based inversion techniques (Kuo et al., 2004) and precisely determined transmitter and receiver satellite positions to retrieve vertical profiles of the RO ray bending angle from Doppler-shifted occultation radio signals. RO bending angles can also be simulated from numerical weather prediction (NWP) model output using a forward operator that integrates atmospheric refractivity field gradients along an approximation of the RO ray path (Healy et al., 2007; Cucurull et al., 2013), since atmospheric refractivity depends on water vapor, temperature, and pressure.
GNSS RO bending angles have been assimilated in operational global NWP models over the last two decades, with their beneficial impacts on predicted temperature, wind, and pressure fields in the upper troposphere and lower stratosphere being well documented (Cucurull et al., 2013; Bonavita, 2014; Bowler, 2020; Lien et al., 2021). RO profiles complement satellite radiances in sampling atmospheric water vapor and temperature, offering high vertical resolution (sub 200 m), deep tropospheric signal penetration, and all-sky observability (Ho et al., 2020a; Schreiner et al., 2020). Additionally, RO bending angles serve as anchor data for radiance bias correction in NWP models (Poli et al., 2010) because they exhibit relatively unbiased errors above the boundary layer (Schreiner et al., 2020; Lien et al., 2021). Launched in June 2019, the joint US-Taiwan Formosa Satellite Mission-7/Constellation Observing System for Meteorology, Ionosphere, and Climate-2 (COSMIC-2) six-satellite constellation currently yields about 6,000 daily profiles globally, all within the ±45° latitude band. Compared to previous missions, COSMIC-2 provides enhanced data coverage over the tropics (with approximately 5 daily profiles per 500 × 500 km2 box) and a higher signal-to-noise ratio (SNR), owing to improved receivers and digital beamforming antennas (Ho et al., 2020b; Schreiner et al., 2020). Studies have demonstrated that tropospheric water vapor information derived from assimilating RO data from COSMIC-2 or its predecessor mission could improve TC cyclogenesis detection in regional models (Liu et al., 2012; Chen et al., 2020; Teng et al., 2021, 2023).
Despite a substantial increase in available GNSS RO data after the COSMIC-2 launch, the full benefits of assimilating these RO profiles into NWP models are likely not yet realized, due to their relatively sparse horizontal sampling density compared to satellite radiances. To theoretically evaluate how the forecast error improvement scales with RO profile volume, Harnisch et al. (2013) ran an ensemble of data-assimilation (EDA) experiments using the European Centre for Medium-Range Weather Forecasts (ECMWF) global model. Using the reduction in ensemble spread as a proxy for forecast error reduction, they found incremental forecast improvement with up to 128 000 globally assimilated profiles. Specifically, the improvement in upper-tropospheric temperature forecast error scaled logarithmically with the number of assimilated RO data, such that assimilating 16 000 daily profiles accounted for about 50 % of the benefit from assimilating 128 000 daily profiles. Based on these findings, Harnisch et al. (2013) recommended 16 000–20 000 daily global RO profiles as the minimum number for optimal utilization in a global NWP system. Current government-owned GNSS RO receiver platforms, such as COSMIC-2 and the Meteorological Operational (Metop) satellites operated by the European Organisation for the Exploitation of Meteorological Satellites (EUMETSAT), supply fewer than 10 000 daily global profiles to operational NWP centers.
Over the past five years, companies such as Spire Global and PlanetiQ have launched LEO satellites equipped with GNSS RO signal receivers. The US National Oceanic and Atmospheric Administration (NOAA), ECMWF, and other federal weather services worldwide are currently evaluating the benefits of assimilating commercial RO data into their operational NWP models. Data assimilation (DA) impact studies have found that augmenting government-provided RO data with relatively small commercial RO datasets is generally beneficial, at least to some degree. Lonitz et al. (2021) reported that assimilating about 5000 daily Spire RO profiles, in addition to operationally assimilated RO data, into the global NWP models of both the UK Met Office and ECMWF reduced short-range temperature errors, with the most substantial improvement occurring in the extratropical upper troposphere when verified against radiosondes. Miller et al. (2025) evaluated the impacts of assimilating about 5500 daily global Spire RO profiles in NOAA's Hurricane Weather Research and Forecasting (HWRF) model forecasts of four 2022 Atlantic hurricanes. They found that assimilating the Spire bending angles along with operational government-provided RO data reduced HWRF's tropical cyclone (TC) minimum central sea-level pressure (PMIN) over-intensification bias by 17 %–38 % for medium-to-long range forecasts. However, this only improved PMIN absolute errors for short-to-medium range lead times up to t=42 h. They also showed that Spire assimilation reduced short-range water vapor errors measured against dropsondes in the lower troposphere, which was consistent with previous studies demonstrating that TC genesis and intensification can be sensitive to low-to-middle tropospheric water vapor fields in the storm environment at earlier times (Nolan, 2007; Doyle et al., 2012; Teng et al., 2021). This sensitivity results partly from the fact that drier air from the TC environment can intrude into the core and suppress updraft development (Cram et al., 2007; Molinari et al., 2013). Inner-core updrafts drive the conversion of latent heat extracted from the ocean to a TC's swirling wind kinetic energy (Rotunno and Emanuel, 1987).
The Radio Occultation Modeling EXperiment (ROMEX; Anthes et al., 2024) is a multi-center study evaluating the impacts of assimilating a large commercial GNSS RO dataset on retrospective operational NWP forecasts for the September–November 2022 period. More than 10 weather forecasting and research centers globally have participated, including NOAA, the Joint Center for Satellite Data Assimilation (JCSDA), ECMWF, the UK Met Office, Meteo-France, and the Korea Meteorological Administration. ROMEX seeks to demonstrate how DA scales with increasing numbers of RO observations and to validate the theoretical results of Harnisch et al. (2013) using real observations across a variety of operational NWP model configurations. ROMEX participants are assimilating the largest commercial RO dataset evaluated to date, comprising approximately 27 000 global daily commercial RO bending angle profiles, into their NWP systems.
This study supports ROMEX by evaluating the impact of assimilating a large commercial RO bending angle dataset, comprising about 20 000 Spire and PlanetiQ RO bending angle profiles per day globally1, on Hurricane Analysis and Forecasting System – configuration A (HAFS-A) forecasts of four 2022 Atlantic hurricanes. Together with its “B” configuration, which uses different physics parameterizations and horizontal grid resolution, HAFS-A has provided NOAA with operational regional TC forecasting guidance since 2023. Our main objectives are to: (i) evaluate the extent to which assimilating an additional ∼ 20 000 daily global commercial RO profiles on top of operationally assimilated government-owned RO data benefits HAFS-A TC intensity forecasts; (ii) demonstrate how the assimilated ROMEX observation impacts vary across atmospheric layers and meteorological variables; and (iii) determine whether the ROMEX observations assimilated in the lower troposphere can positively impact HAFS-A forecasts, given the tendency for these observations to have larger retrieval or forward modeling errors leading to greater likelihood of rejection, compared to RO data from the middle or upper troposphere.
The remainder of this paper is organized as follows. Section 2 describes the selected hurricane cases, the HAFS-A model configuration, the ROMEX RO dataset, and the experimental design. Section 3 assesses how HAFS-A's DA system responds when provided with the ROMEX commercial RO profiles. Section 4 presents the impacts of assimilated RO data on forecast track, intensity, and gridded forecast field error statistics, and Sect. 5 describes a case study of these impacts on Hurricane Fiona (2022) forecasts. Section 6 provides a summary and concluding remarks.
2.1 Selected TC cases
Figure 1 shows the observed tracks and Saffir-Simpson scale intensities of the four 2022 Atlantic hurricanes selected for this study. These four TCs were selected because they were the most significant of the 2022 Atlantic season in terms of strength, longevity, and overall impact. Due to computational constraints, additional cases could not be included. Data are taken from the National Hurricane Center (NHC) Best Track archive (Jarvinen et al., 1984). Category 2 Hurricane Earl (2–10 September) and Category 4 Hurricane Fiona (14–23 September) were long-tracked storms that spent most of their time at hurricane intensity, defined as having maximum surface wind speed (VMAX) exceeding 65 kn, outside the tropics (Blake, 2023; Pasch et al., 2023). Both storms originated as African Easterly Wave (AEW) disturbances in the eastern tropical Atlantic, intensified as they encountered a moister environment around the Lesser Antilles, recurved northward around the Western Atlantic Ridge, and eventually underwent extratropical transition. Earl passed close enough to Bermuda to generate tropical-storm-force winds, and its outer rainbands caused heavy rainfall over Puerto Rico, leading to isolated flooding reports. Compared to Earl, Fiona was a more impactful storm. Fiona dropped 10–20 in. (254–508 mm) of rainfall over Guadeloupe and Puerto Rico, causing significant to catastrophic flash flooding on those islands. Fiona later made landfall as an extratropical storm on Nova Scotia with hurricane-force winds and a minimum central pressure of 931 hPa, becoming the deepest cyclone on record to strike Canada. Fiona's flooding and winds caused seven direct fatalities in the Caribbean islands and Canada.
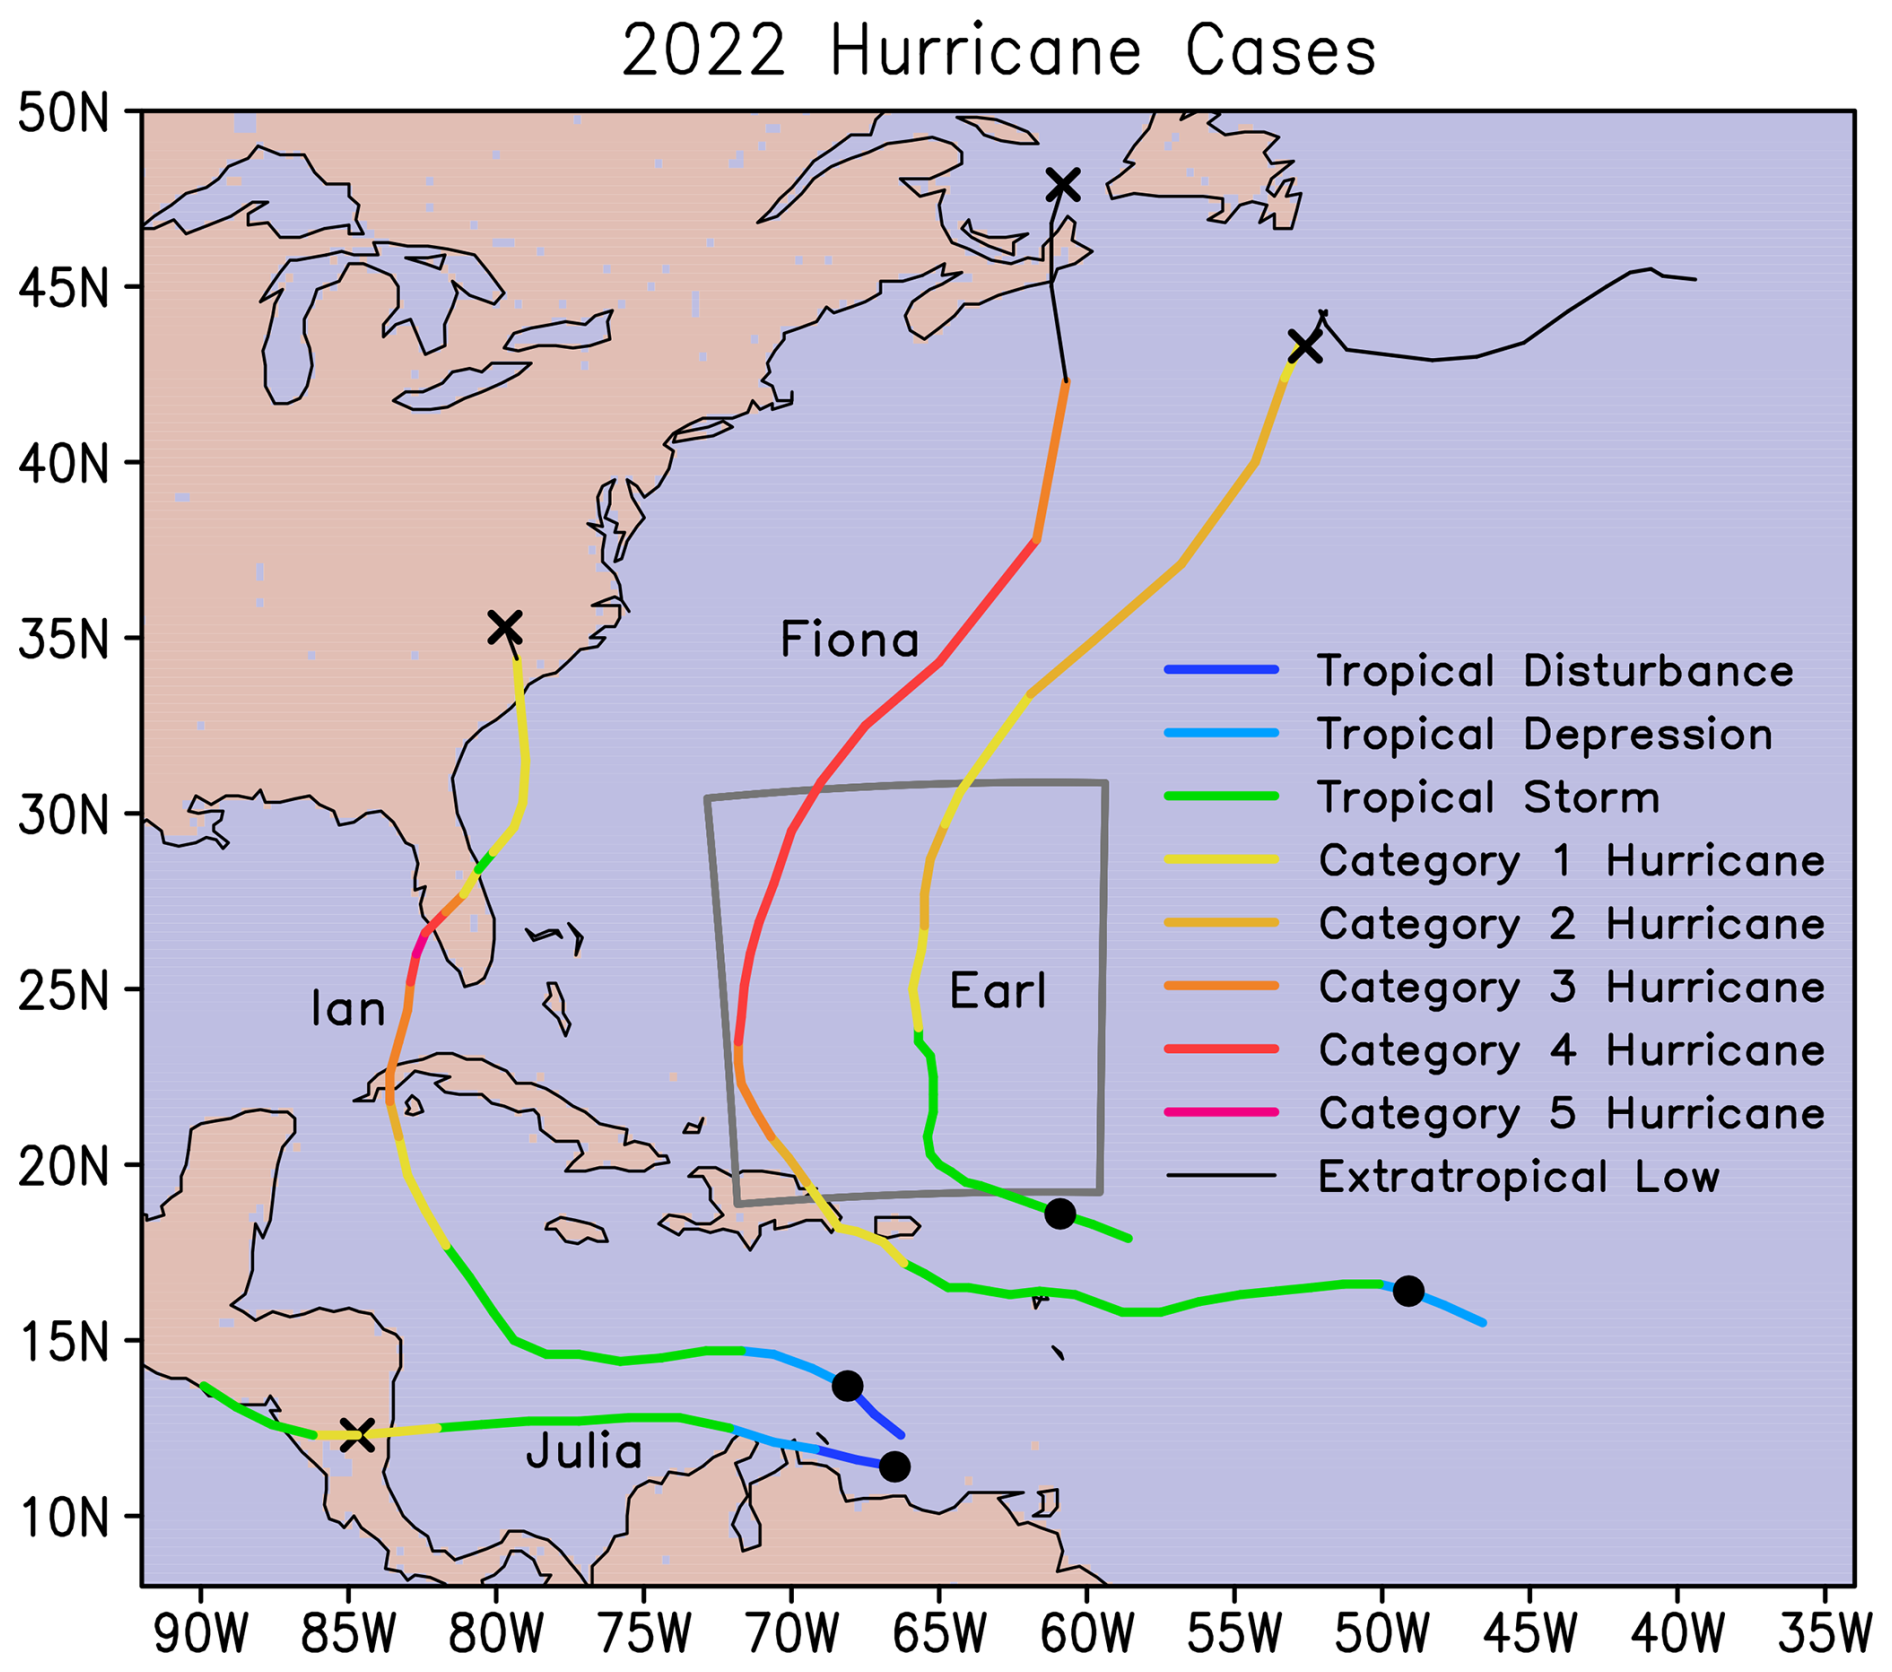
Figure 1The observed tracks of the four 2022 Atlantic hurricanes selected for the ROMEX HAFS-A forecast experiments, with colors indicating the stage of TC development at the time. VMAX stratifies hurricane intensity according to the Saffir-Simpson Scale: Category 1 (64–82 kn), Category 2 (83–95 kn), Category 3 (96–112 kn), Category 4 (113–136 kn), and Category 5 (above 136 kn). Closed circles and X-symbols mark the beginning and end, respectively, of each hurricane's HAFS-A experiment cycling period. The dark gray polygon shows the HAFS-A moving nest boundaries for the 06:00 UTC 7 September Hurricane Earl analysis.
Major Hurricane Ian (23–30 September) also originated as an AEW and was slow to intensify initially while moving westward through the eastern and central Caribbean (Bucci et al., 2023). Late on 25 September, upper-level winds around the storm relaxed, enabling the vortex's upper- and lower-level centers to align vertically. Ian then underwent a 39 h rapid intensification episode (Kaplan and DeMaria, 2003) while moving over an area of high ocean heat content, which ended with landfall in western Cuba. During this period Ian's VMAX increased from 40 to 110 kn. After slightly weakening from the land interaction, Ian resumed intensifying in the southeastern Gulf of Mexico, and the storm made landfall at 19:05 UTC on 28 September near Cape Coral, Florida, as a 130 kn Category 4 hurricane with a 4.6 m peak storm surge. Ian caused 156 fatalities and an estimated USD 113 billion of damage in the US, making it the third most costly US hurricane on record. Category 1 Hurricane Julia (6–10 October 2022) developed and intensified in the southwestern Caribbean and struck Nicaragua (Cangialosi 2023). Moving across Central America, Julia caused severe flooding, leading to 35 fatalities. Please refer to the NHC tropical cyclone reports [Blake, 2023 (Earl); Pasch et al., 2023 (Fiona); Bucci et al., 2023 (Ian); and Cangialosi, 2023 (Julia)] for further details on the meteorology, damage impacts, and operational forecast assessments of these storms.
2.2 HAFS-A model configuration and RO data assimilation algorithm
This study uses version 2.0 of NOAA's HAFS-A, a regional forecasting model operationally activated by the National Centers for Environmental Prediction (NCEP) to forecast a single TC following its cyclogenesis in the Atlantic or eastern Pacific basins. HAFS-A v2.0 is dual nested with two-way feedback between a fixed ∼ 75° × 75° sized outer domain with 5.4 km horizontal resolution and a TC-following ∼ 12° × 12° sized nest with 1.8 km horizontal resolution. The 81-level sigma pressure hybrid vertical coordinate system has a 2 hPa model top, and its lower boundary is coupled to the Modular Ocean Model version 6 (MOM6). Initial conditions and lateral boundary conditions for the outer domain are provided by NOAA's operational Global Forecasting System (GFS). The Gridpoint Statistical Interpolation (GSI; Wang et al., 2013) software assimilates observations into HAFS-A's moving nest every 6 h using a Four-dimensional Ensemble Variational (4DEnVar) algorithm that extracts flow-dependent background error covariances from the 80-member operational GFS ensemble. Assimilated observations include temperature, humidity, and winds from conventional platforms (radiosondes, ships, and buoys); GNSS RO bending angles; microwave and infrared satellite radiances; and in-situ data from aircraft reconnaissance missions (dropsondes, High Density Observations from aircraft sensors, and Tail Doppler Radar-measured winds).
Assimilating observations into a background vortex that poorly estimates a TC's intensity, structure, or position can cause analysis degradations because a TC's inner core can feature sharp horizontal gradients of wind, temperature, and water vapor (Christophersen et al., 2022). To mitigate this potential problem, HAFS-A adjusts 6 h forecast fields within the moving nest using a vortex initialization (VI) algorithm during each DA cycle, prior to assimilating observations (Liu et al., 2020). The VI procedure relocates the background vortex's kinematic and thermodynamic fields to the position estimated by the real-time Tropical Cyclone Vitals Database (TCVitals; Trahan and Sparling, 2012). It then adjusts these fields to better match the TCVitals VMAX, PMIN, and storm size while keeping relative humidity (RH) unchanged. The background vortex is normally extracted from the 6 h HAFS-A forecast initialized from the previous cycle, unless the storm is very weak (TCVitals VMAX < 20 m s−1), in which case the 6 h operational GFS-forecast vortex is used. In either case, HAFS-A pastes the background vortex onto the operational GFS's 6 h forecast environmental fields interpolated to the moving nest. Therefore, the HAFS-A DA system does not cycle background fields between the TC vortex edge and the moving nest boundaries, although these fields are modified by observations assimilated in the current cycle.
HAFS-A assimilates RO bending angles occurring within a ±3 h window around the analysis time using the NCEP Bending Angle Model (NBAM; Cucurull et al., 2013; Cucurull and Purser, 2023), a one-dimensional forward operator. NBAM estimates RO bending angle observation errors using a piecewise exponential function of the observation's impact height with default tunable coefficients that have been determined from GFS background and analysis departure statistics using the Desroziers et al. (2005) method. The HAFS-GSI quality control (QC) algorithm rejects RO observations that could adversely affect the analysis. Most rejections are triggered either by a “statistical check” when the fractional observation-minus-background (O−B) innovation exceeds a latitude, height, and temperature-dependent cutoff value, or by the RO ray's tangent point being located within or below a background super-refractivity (SR) layer where the vertical refractivity gradient exceeds 75 % of the −157 N-units km−1 critical threshold. The SR rejections are necessary because NBAM can yield an indeterminate solution for observations located inside or below a SR layer (Cucurull, 2015; Cucurull and Purser, 2023).
2.3 ROMEX RO observation dataset
The ROMEX dataset used in this study contains approximately 26 000 daily global RO bending-angle profiles. EUMETSAT processed all ROMEX profiles, except for the COSMIC-2 data, which UCAR provided. The largest data volume comes from Spire, which provides about 16 750 profiles per day globally, followed by the COSMIC-2, PlanetiQ, and Metop-B/C missions, which contribute about 4900, 2750, and 1150 profiles per day, respectively (Anthes et al., 2024). Prior to a December 2024 code upgrade, GSI implementations with NCEP's forecasting models rejected all Metop bending angles below the 8 km impact height (∼ 650 hPa) based on prior work finding larger Metop-A/B departures against the GFS background (Dutta et al., 2019). Since our HAFS-GSI build predates the removal of this QC check, the assimilated Metop-B/C profiles are expected to have little impact on the forecast lower- to middle-tropospheric temperature and water vapor fields. The government-owned TerraSAR-X, TanDEM-X, and KOMPSAT-5 missions together contribute up to 500 daily global profiles. The ROMEX commercial bending angles are assigned the same observation errors and QC settings as those used for COSMIC-2, except that their QC cutoff threshold rejects all data above the 30 km impact height, whereas COSMIC-2 and other government RO mission data are rejected above 50 km. This follows the default settings for commercial RO data in the operational HAFS-GSI.
2.4 RO Data Impact Experiment Design
To demonstrate the impacts of assimilating the ROMEX commercial observations, COSMIC-2, and all lower-tropospheric RO data, four independent HAFS-A observing system experiments (OSEs) are run as follows:
- i.
Control, assimilating only data from government-owned missions (primarily COSMIC-2 and Metop);
- ii.
Control_noC2, the same as Control except without assimilating COSMIC-2;
- iii.
ROMEX, assimilating the full ROMEX dataset; and
- iv.
ROMEX_noLowlevRO, like ROMEX except that all RO data below the 5 km impact height are rejected.
The 5 km height threshold is chosen for ROMEX_noLowlevRO because it serves as a reasonable proxy for the top of the moist lower troposphere where many processes important to TC intensification occur (Montgomery and Smith, 2014), and because HAFS-GSI checks RO bending angles below this height for background SR conditions (Sect. 2.2). Among these experiments, Control most closely replicates the RO dataset assimilated in NOAA's 2022 operational NWP models2, which included approximately 5500 daily Spire profiles purchased through the Commercial Weather Data Pilot (CWDP) program during that year's Atlantic hurricane season. The operational GFS provides the initial and boundary conditions for HAFS-A's outer domain during each DA cycle in all four experiments. Therefore, since HAFS-A only assimilates observations in the moving nest, this study measures the impacts of assimilated GNSS RO observations on a TC vortex and its near-storm environment within a few hundred kilometers. Each experiment begins with a HAFS-A cold start initialized soon after TC cyclogenesis (Fig. 1). The HAFS-A analysis is then cycled over a multi-day period, with each analysis initializing a 120 h HAFS-A free forecast (run without further observation assimilation). The last HAFS-A analysis is initialized soon after final landfall for Fiona, Ian, and Julia, and shortly before Earl's extratropical transition.
3.1 RO data retention and quality control in HAFS-GSI
Figure 2a shows the number of Spire, PlanetiQ, and COSMIC-2 profiles available for assimilation in HAFS-A during each Hurricane Fiona analysis cycle. As expected, Spire provides the largest volume of RO data, although the number of profiles overlapping the ∼ 12° × 12° domain varies substantially across different analysis cycles, ranging from one to thirty-one. Anthes et al. (2024) observed a bimodal distribution in the local time sampling density of ROMEX Spire profiles, with peaks at 09:00–12:00 and 21:00–00:00 LT (see their Fig. 12), which they attributed to the Spire satellites' sun-synchronous polar orbits. Spire's bimodal local time sampling pattern is not easily discernible during periods when the HAFS-A nest has limited zonal movement, such as 20–22 September, when Fiona remains over the US Eastern Daylight Time zone's (GMT−4 h) longitudinal range while moving mostly northward east of the Bahamas (Fig. 1). This is not surprising, given the HAFS-A nest's relatively small size and wide (6 h) DA window. Therefore, we attribute the differences in Spire profile availability over DA cycles mostly to variability in Spire occultation swath locations over the TC case study periods.
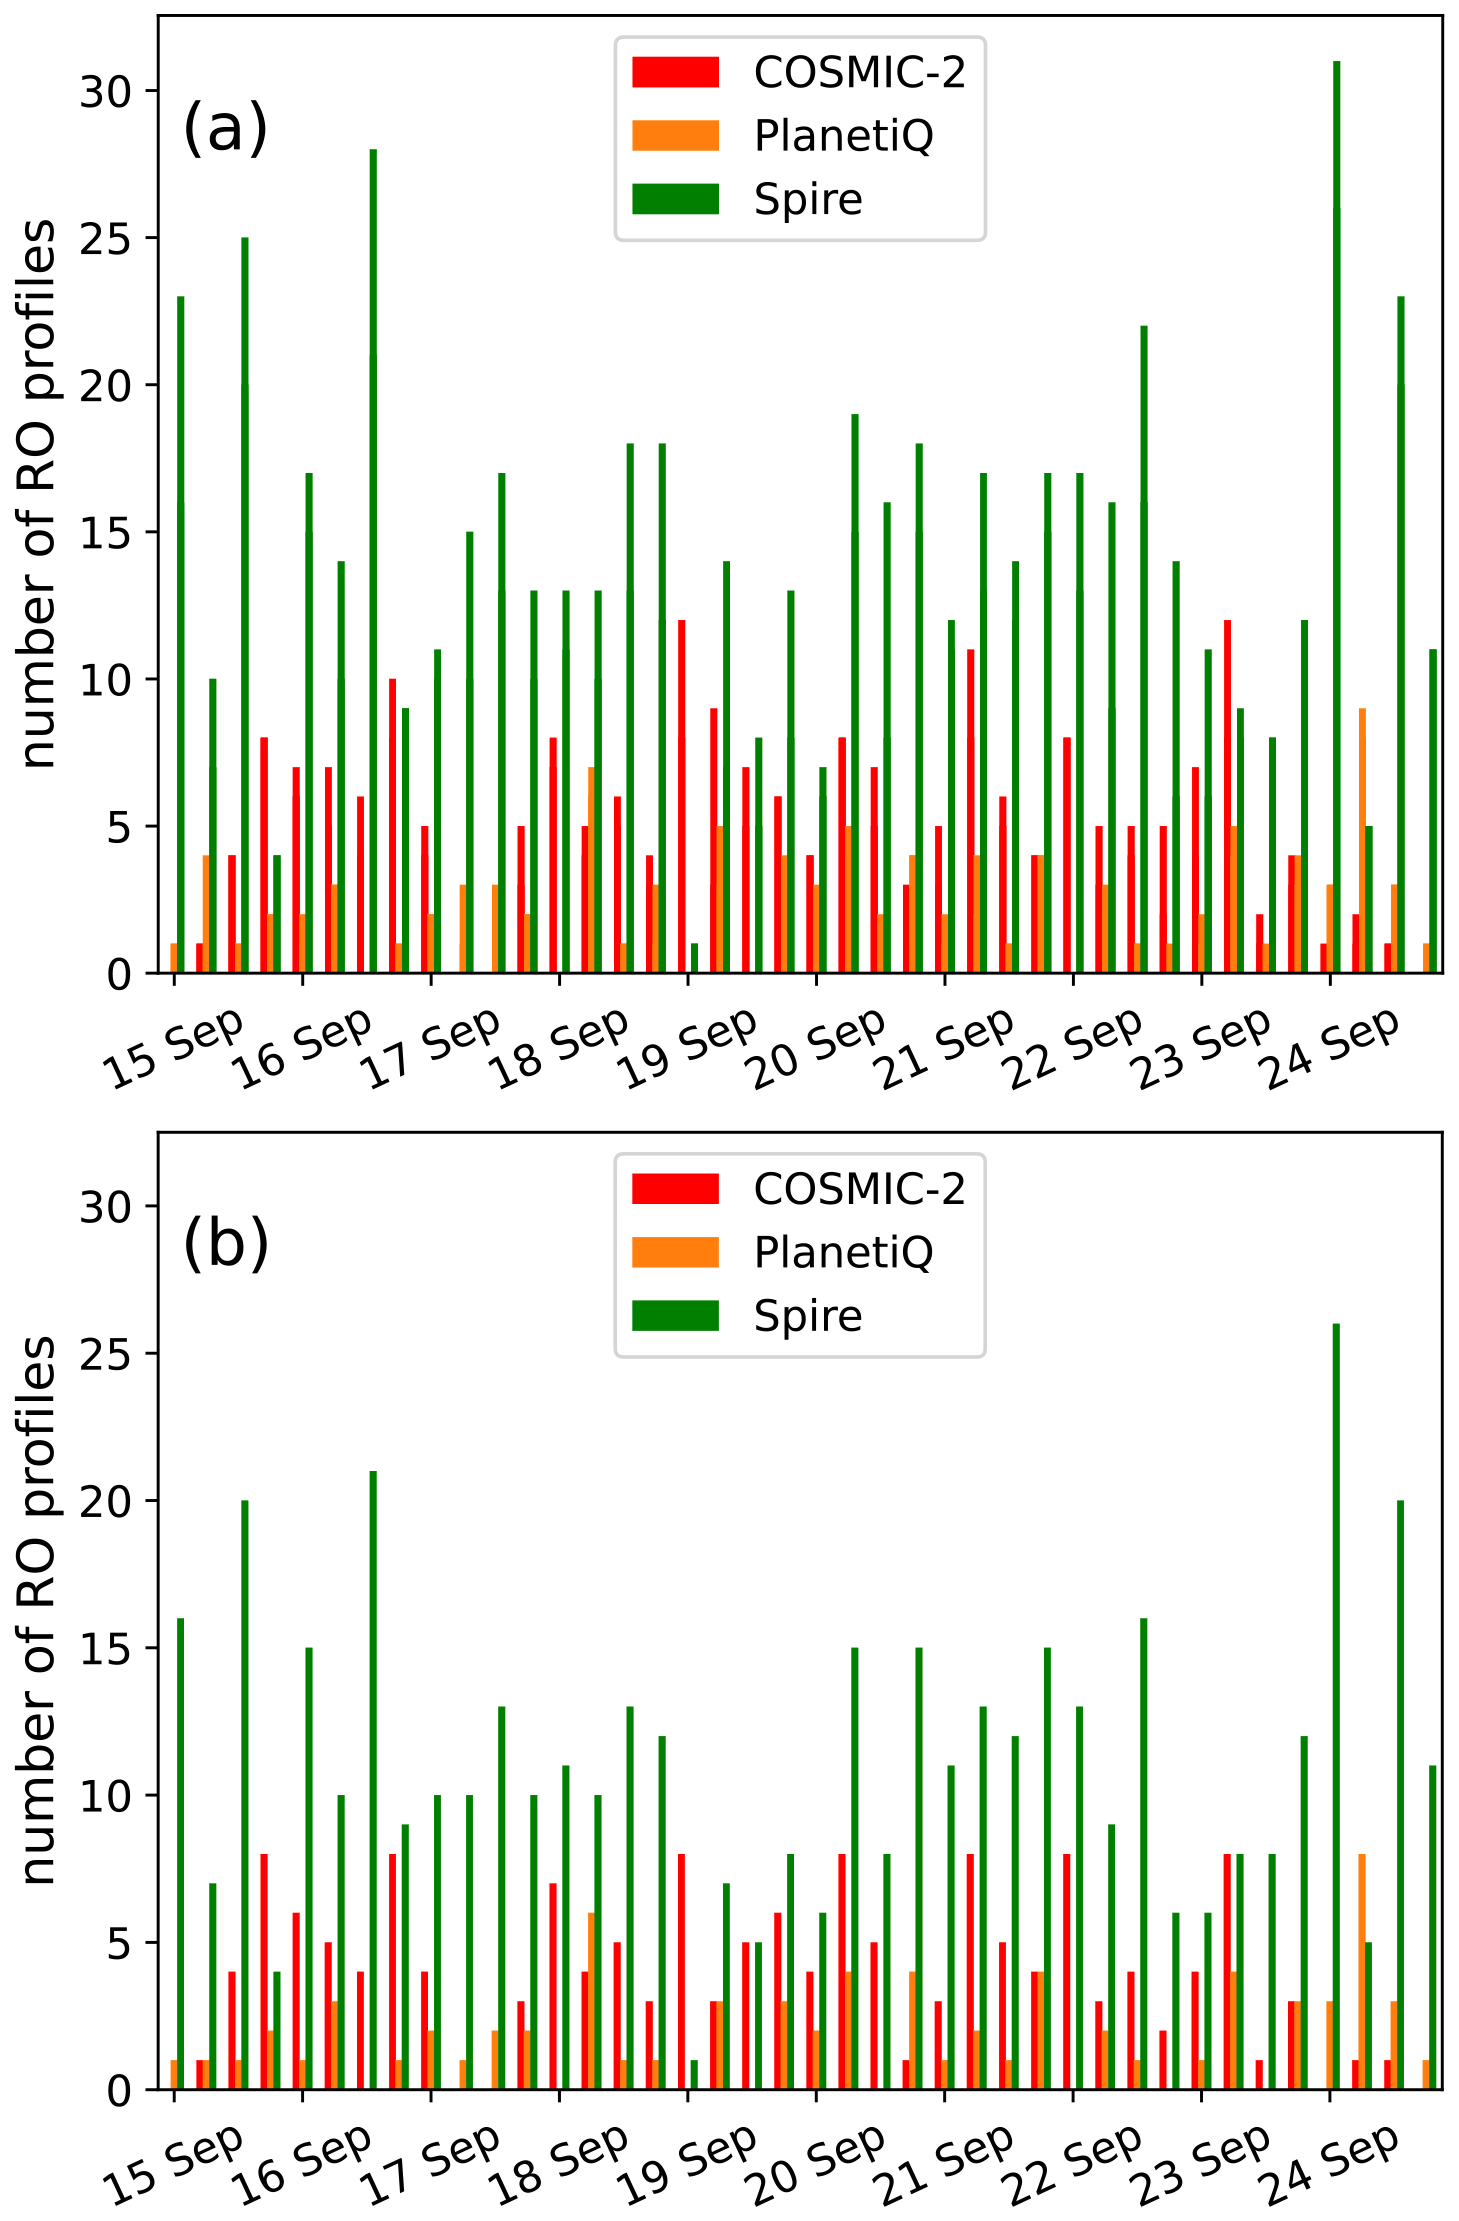
Figure 2(a) Number of COSMIC-2, PlanetiQ, and Spire GNSS RO profiles available for assimilation in the HAFS-A moving nest for individual Hurricane Fiona (2022) DA cycles, shown as red, orange, and green bars, respectively. Each 00:00 UTC cycle time is labeled with its date on the x-axis. (b) As in panel (a), except showing the number of profiles with at least one bending angle assimilated below 800 hPa.
Table 1 lists the number of RO profiles assimilated per day in the Control_noC2, Control, and ROMEX experiments for each TC case. Over the full evaluation period, the addition of Spire and PlanetiQ data in ROMEX increases the assimilated profile count 4.4-fold for Earl, 3.8-fold for Fiona, 3.3-fold for Ian, and 1.8-fold for Julia, relative to Control. Earl and Fionas' larger gain in RO data volume from Control to ROMEX is consistent with those storms spending more time outside the tropics (Fig. 1), where COSMIC-2 data have sparser coverage (Ho et al., 2020b). When combining all analyses from the four TC cases, Control_noC2 assimilates 129 profiles, Control assimilates 717 profiles, and ROMEX assimilates 2513 profiles.
Table 1Number of GNSS RO profiles assimilated for the Control_noC2 (noC2), Control, and ROMEX experiments in the 12° × 12° HAFS-A moving nest for each day that overlaps a TC case cycling period. Dashes indicate that no HAFS DA cycles occurred for that storm on that day, as identified by the column and row respectively. Numbers in parentheses list the number of DA cycles for a given day, with the maximum value of four indicating that observations were assimilated in the 00:00, 06:00, 12:00, and 18:00 UTC cycles. The comma-delimited values for 23 and 24 September indicate that the HAFS-A nest assimilated profiles for both the Fiona and Ian cases, with the Fiona cycling period ending at 18:00 UTC 24 September and the Ian cycling period beginning at 06:00 UTC 23 September. The sets of profiles assimilated for Fiona and Ian on 23–24 September were different and non-overlapping due to differences in the HAFS-A nest location for the two storms.
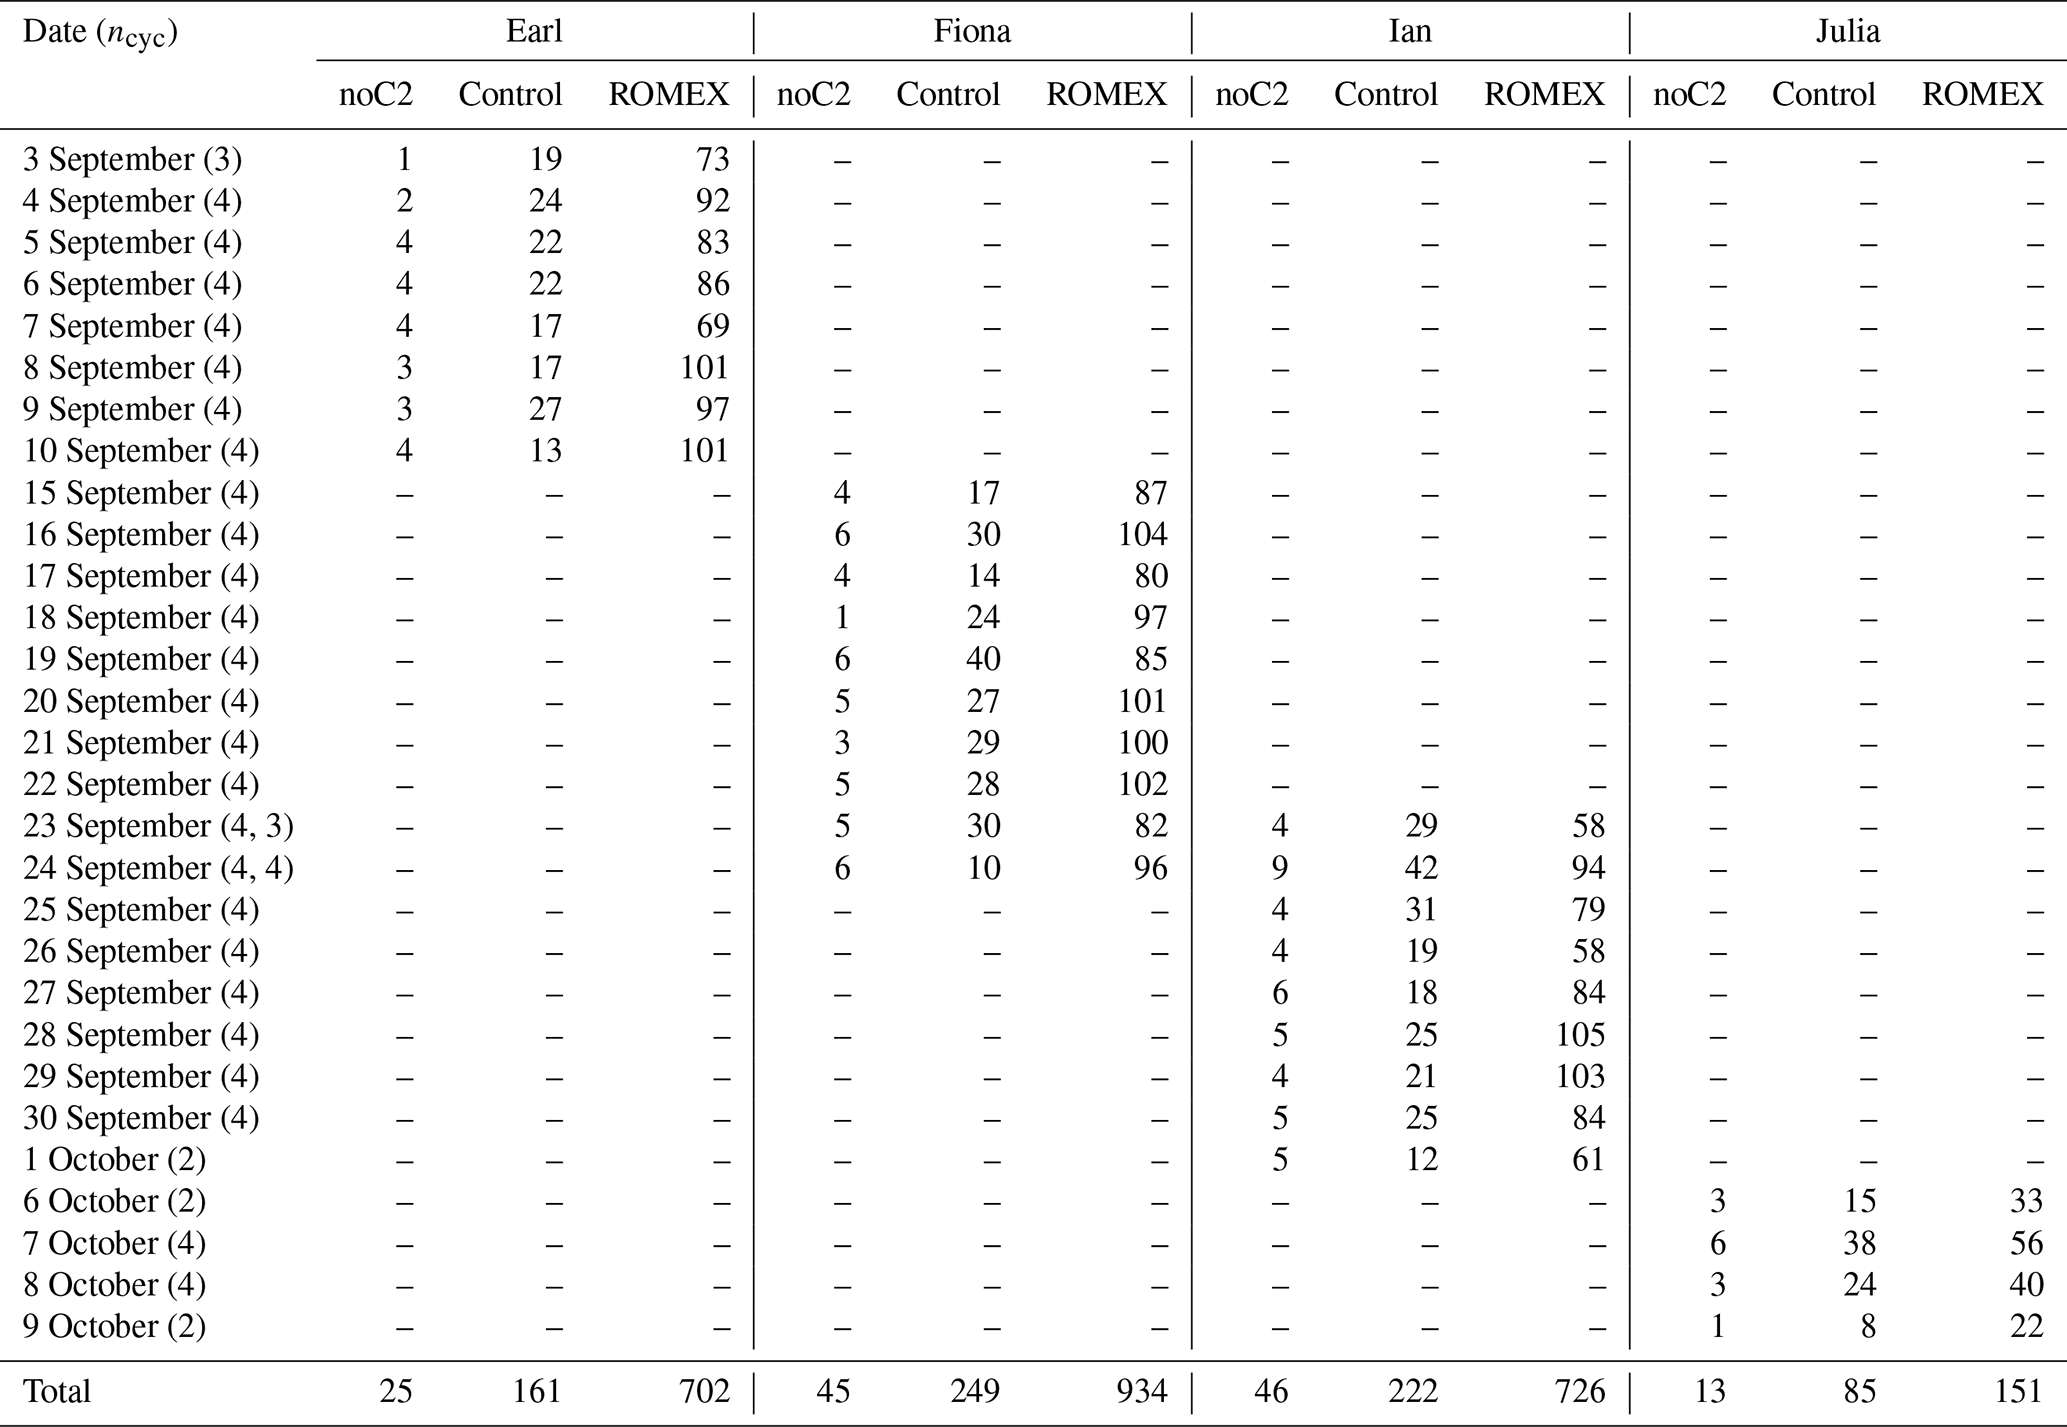
Figure 2b highlights a key challenge: for some COSMIC-2 and commercial RO profiles, all bending angles below 800 hPa are rejected by HAFS-GSI's QC checks and not assimilated. This is critical because TC intensification is highly sensitive to water vapor distribution in the lower-to-middle troposphere around the storm (e.g., Nolan, 2007; Doyle et al., 2012; Teng et al., 2021). The GSI QC algorithm is known to reject the largest percentage of RO data in the lower-to-middle troposphere (Miller et al., 2023, 2025; Lien et al., 2021), primarily due to greater bending angle retrieval uncertainty caused by water vapor effects (Kursinski et al., 1997; Kuo et al., 2004; Anthes et al., 2022). Further work is needed to determine whether HAFS-GSI's QC criteria are optimally set for all RO data platforms.
Figure 3 presents histograms of COSMIC-2, Spire, and PlanetiQ bending angle rejection percentages binned by pressure level for all checks (Fig. 3a) and the statistical O−B outlier check (Fig. 3b). The bins extend up to 15 hPa, which is below the 30 km high altitude cutoff used for commercial RO data. All three platforms show similar retention statistics above 950 hPa that are mostly caused by the statistical O−B check (cf. Fig. 3a, b), with the total rejection rate increasing from ∼ 20 % in the 700–450 hPa layer to ∼ 55 % in the 950–850 hPa layer (Fig. 3a). Notably, below 950 hPa, Spire's O−B rejection percentage is almost 10 % smaller than that of COSMIC-2. Since GSI uses the same empirically-determined rejection thresholds for COSMIC-2 and commercial RO data, this indicates that Spire has a lower frequency of extreme O−B outliers within and near the boundary layer than COSMIC-2. Almost all other tropospheric RO observation rejections are triggered by the super-refractivity check, which mainly depends on the background refractivity field (Cucurull, 2015).
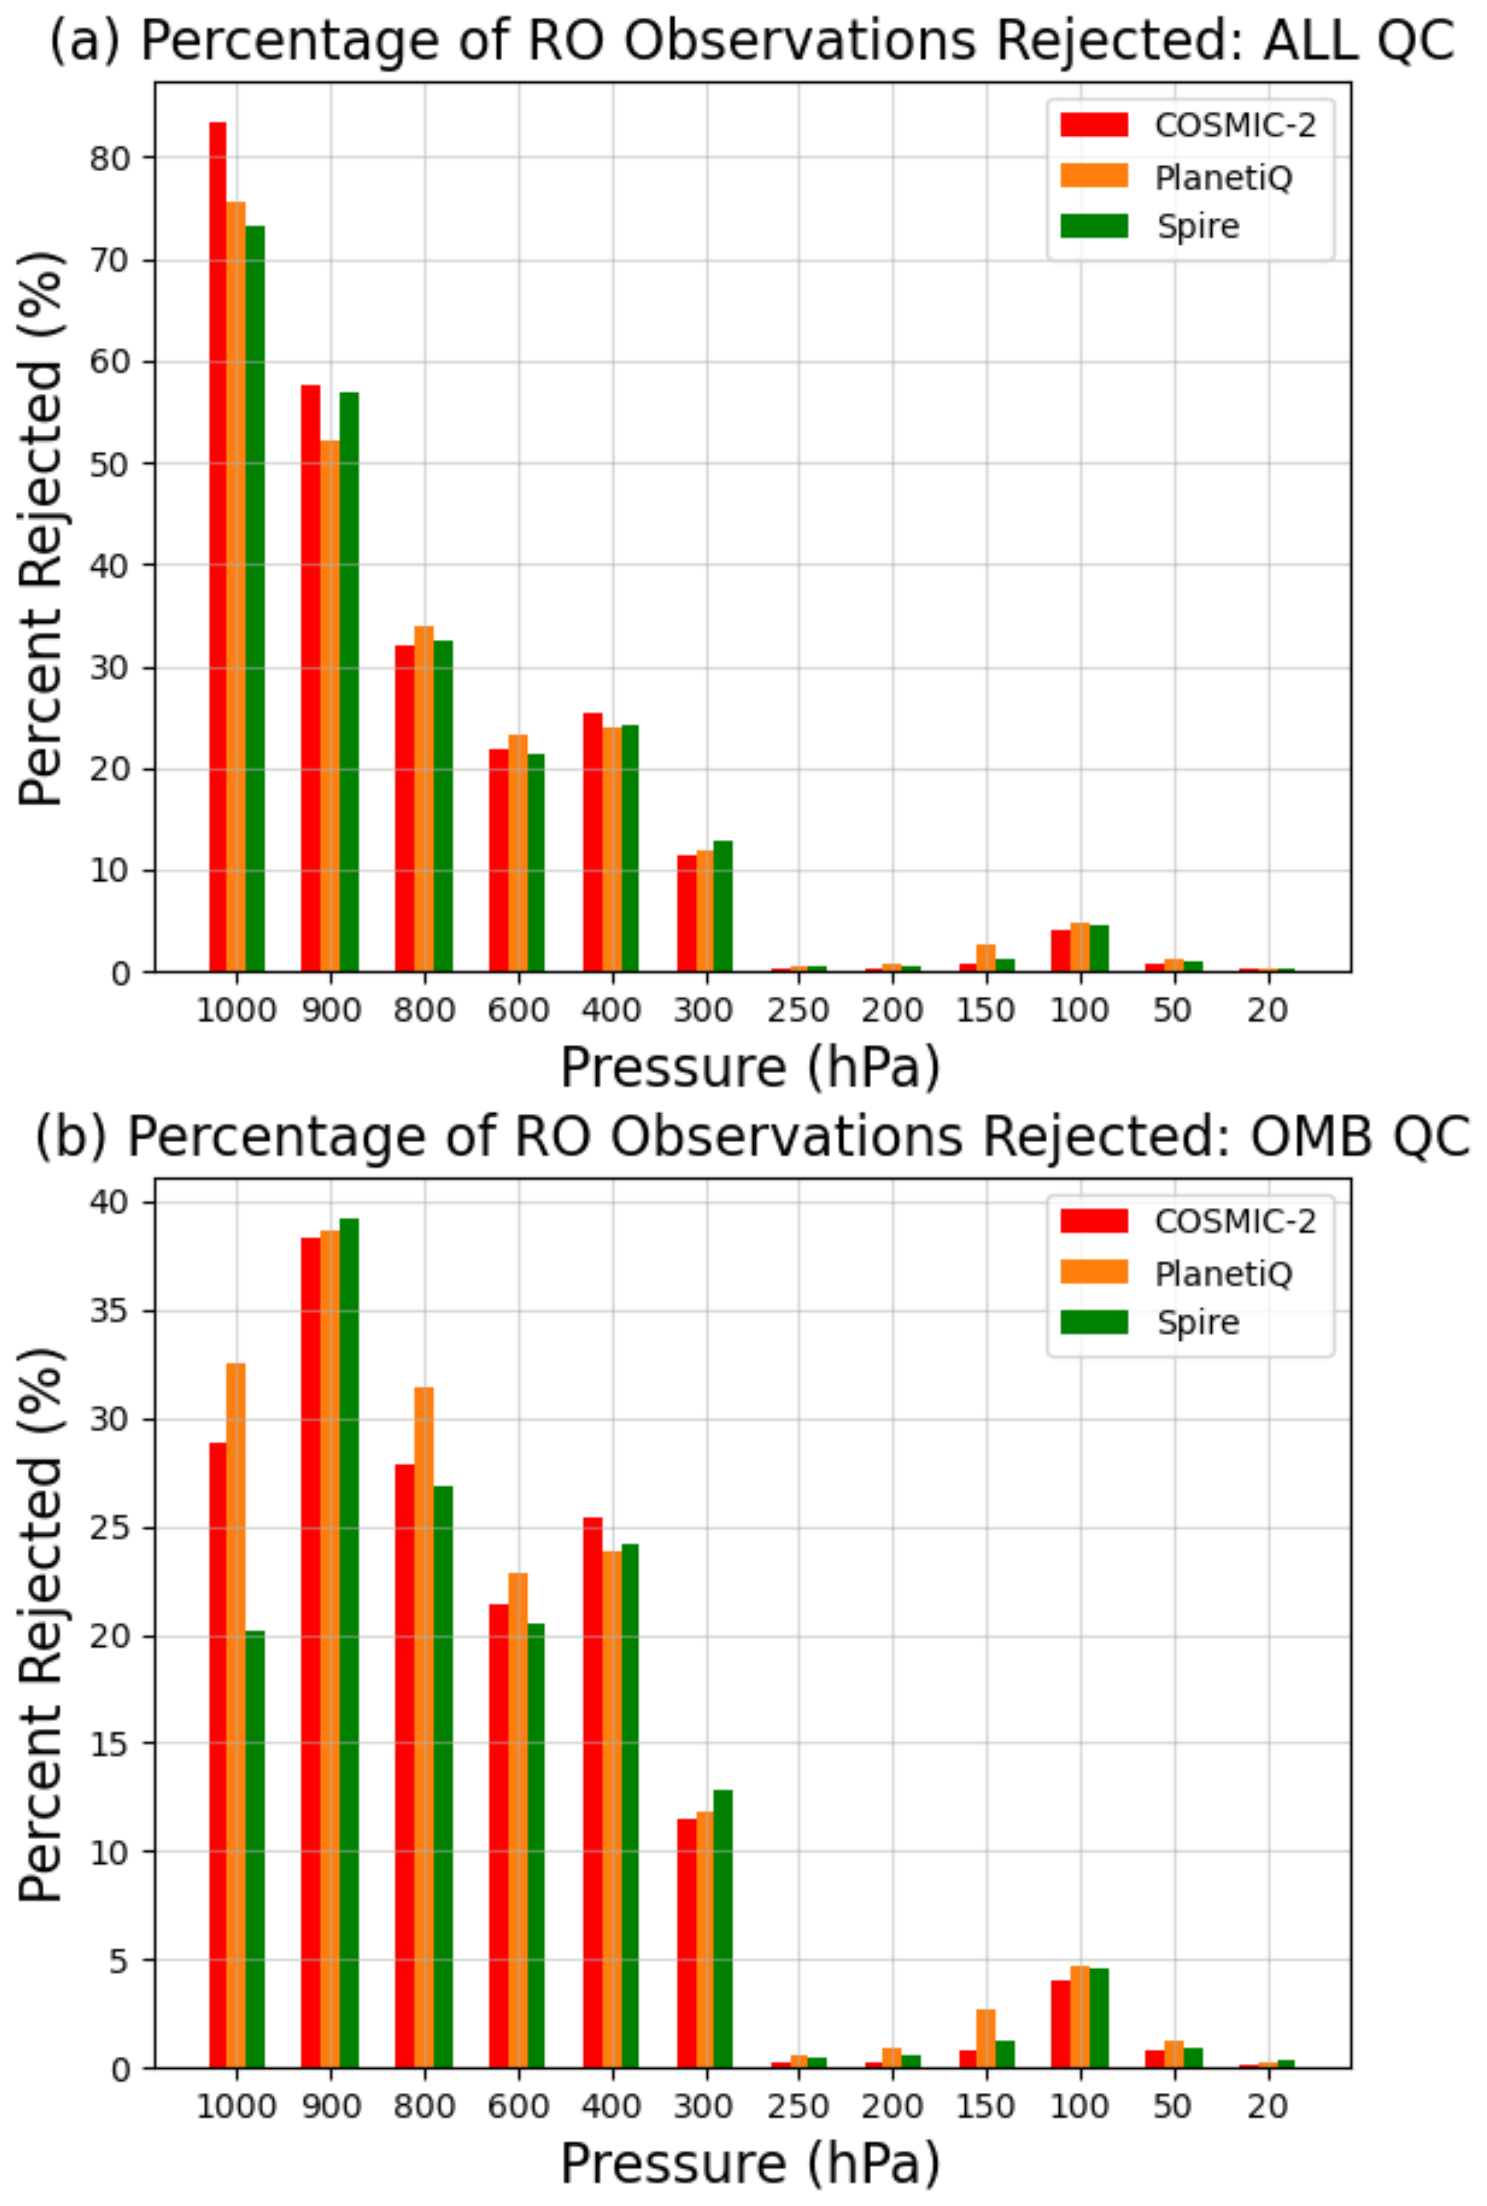
Figure 3(a) Percentage of RO bending angle observations binned by pressure level that are rejected by HAFS-GSI QC screens. Pressure level height (hPa) bins labeled on the abscissa as 1000, 900, 800, 600, 400, 300, 250, 200, 150, 100, 50, and 20 are bounded as > 950, 950–850, 850–700, 700–450, 450–350, 350–275, 275–225, 225–175, 175–125, 125–75, 75–25 and 25–15 hPa, respectively. Red, orange, and green bars show COSMIC-2, PlanetiQ, and Spire rejection percentages respectively. (b) As in panel (a), except showing only the percentage of observations rejected by the statistical check for O−B outliers.
3.2 Diagnosed RO observation uncertainty
Figure 4 compares profiles of COSMIC-2, Spire, and PlanetiQ observation error standard deviations estimated from the ROMEX experiment's O−B and observation-minus-analysis (O−A) data collected from all four TC cases. These diagnosed observation errors include contributions from instrument, retrieval, and representative sources, and we estimated them using the Desroziers et al. (2005) algorithm, which has been widely employed by operational NWP centers (Cucurull et al., 2013; Bonavita, 2014; Bowler, 2020; Lien et al., 2021). Some caution is warranted in drawing broader conclusions about the uncertainty characteristics of these three RO observation platforms, given our relatively small DA diagnostic data sample drawn from a TC-following regional domain. From our experiments, we find that all three platforms have similar observation uncertainty in the upper troposphere. However, Spire observations show the smallest uncertainty below the 5 km impact height in the tropics (Fig. 4a) and below the 7 km impact height in the extratropics (Fig. 4b).
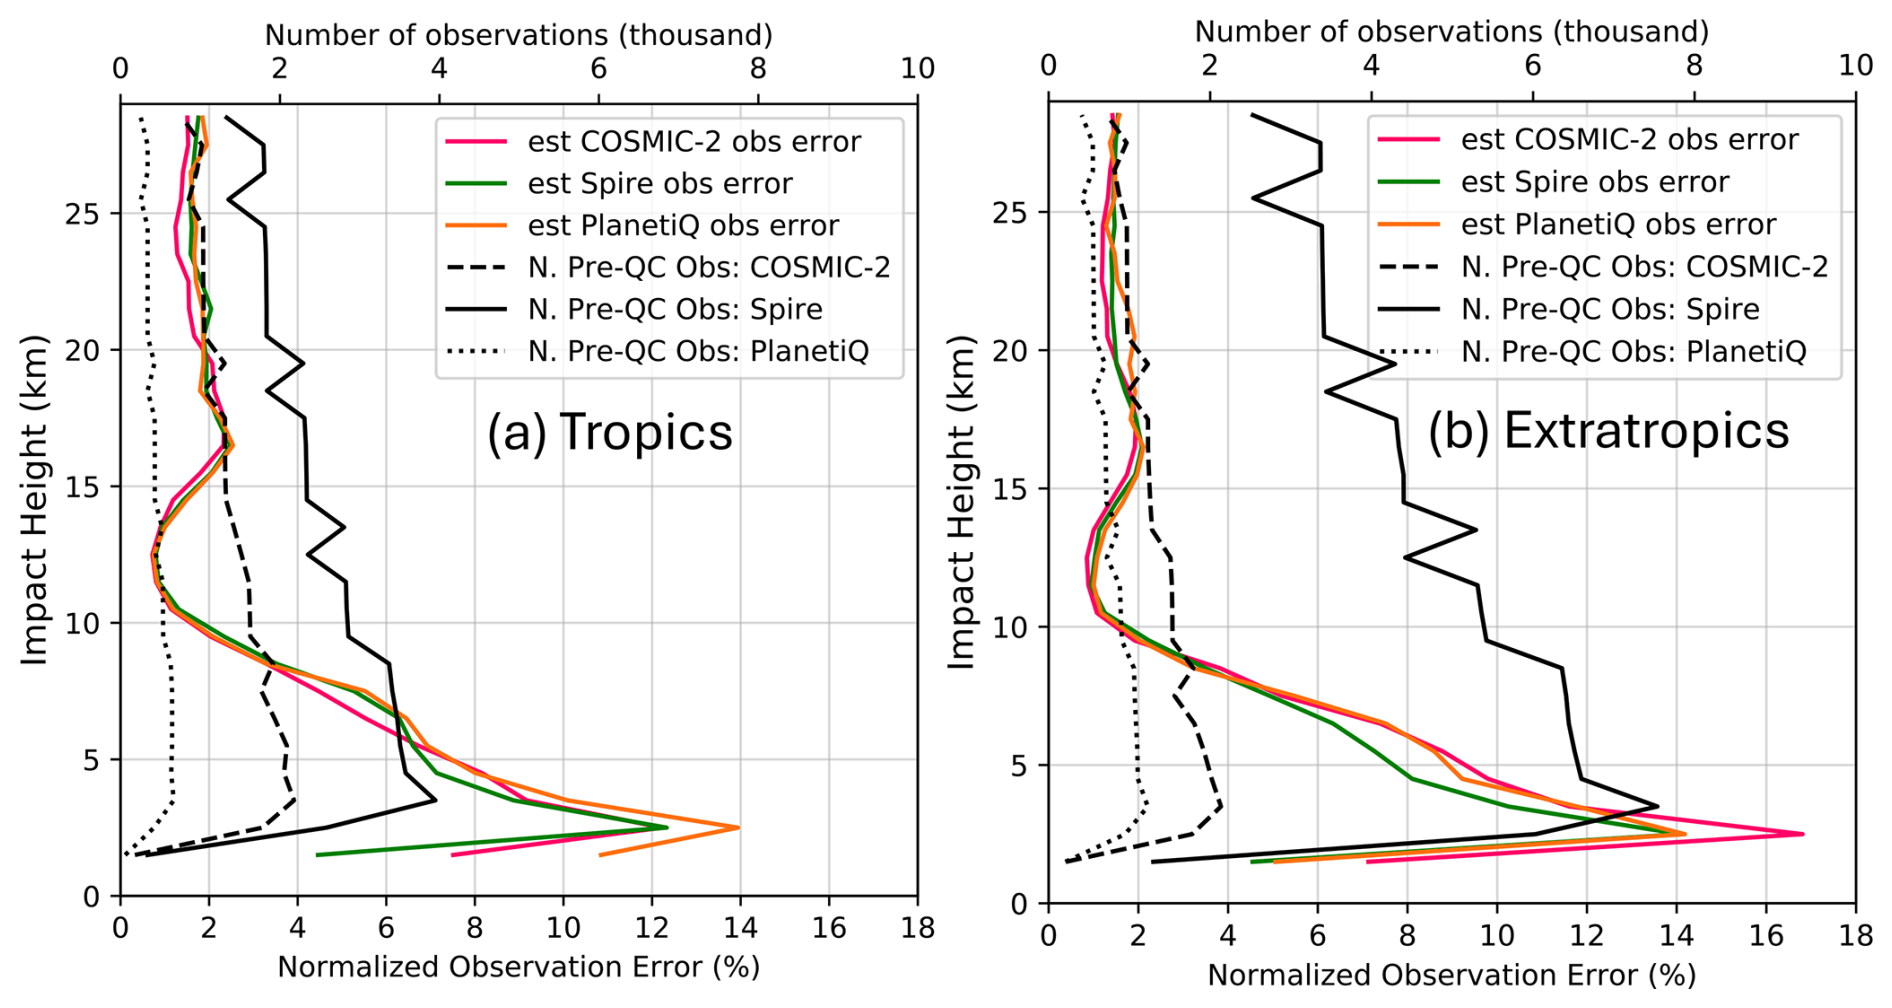
Figure 4RO bending angle observation error standard deviation profiles estimated by the Desroziers et al. (2005) method for (a) the tropics and (b) the extratropics. The magenta, green, and orange lines show COSMIC-2, Spire, and PlanetiQ errors, respectively. Dashed, solid, and dotted black lines, respectively, show the number of COSMIC-2, Spire, and PlanetiQ observations per height bin that were used in the error estimation.
4.1 TC track and intensity forecasts
We now evaluate the impacts of assimilating ROMEX and COSMIC-2 RO observations on HAFS-A TC track and intensity forecasts verified against the NHC's Best Track dataset. Forecasts initialized during the first 48 cycling hours (containing eight analysis cycles) are not used for computing verification statistics to allow HAFS-A time to “spin up” and respond to the accumulative impacts of assimilated observations. Figure 5a compares the mean absolute TC position errors across the four experiments as a function of forecast lead time. Also shown is the number of Control forecasts used for averaging, which decreases with increasing lead time because the HAFS-A TC vortex tracker does not provide output for storms that have weakened after landfall or moved near the edge of the fixed outer domain. Differences in TC position error among the four experiments are generally small, which is not surprising given that TC motion is often most sensitive to larger-scale flows driven by synoptic weather features far from the storm (Chan and Gray, 1982; Galarneau and Davis, 2013). The HAFS-A model's 12° × 12° storm-following nest receives the same GFS-provided initial and lateral boundary conditions from its surrounding outer domain in all four experiments (Sect. 2.2).
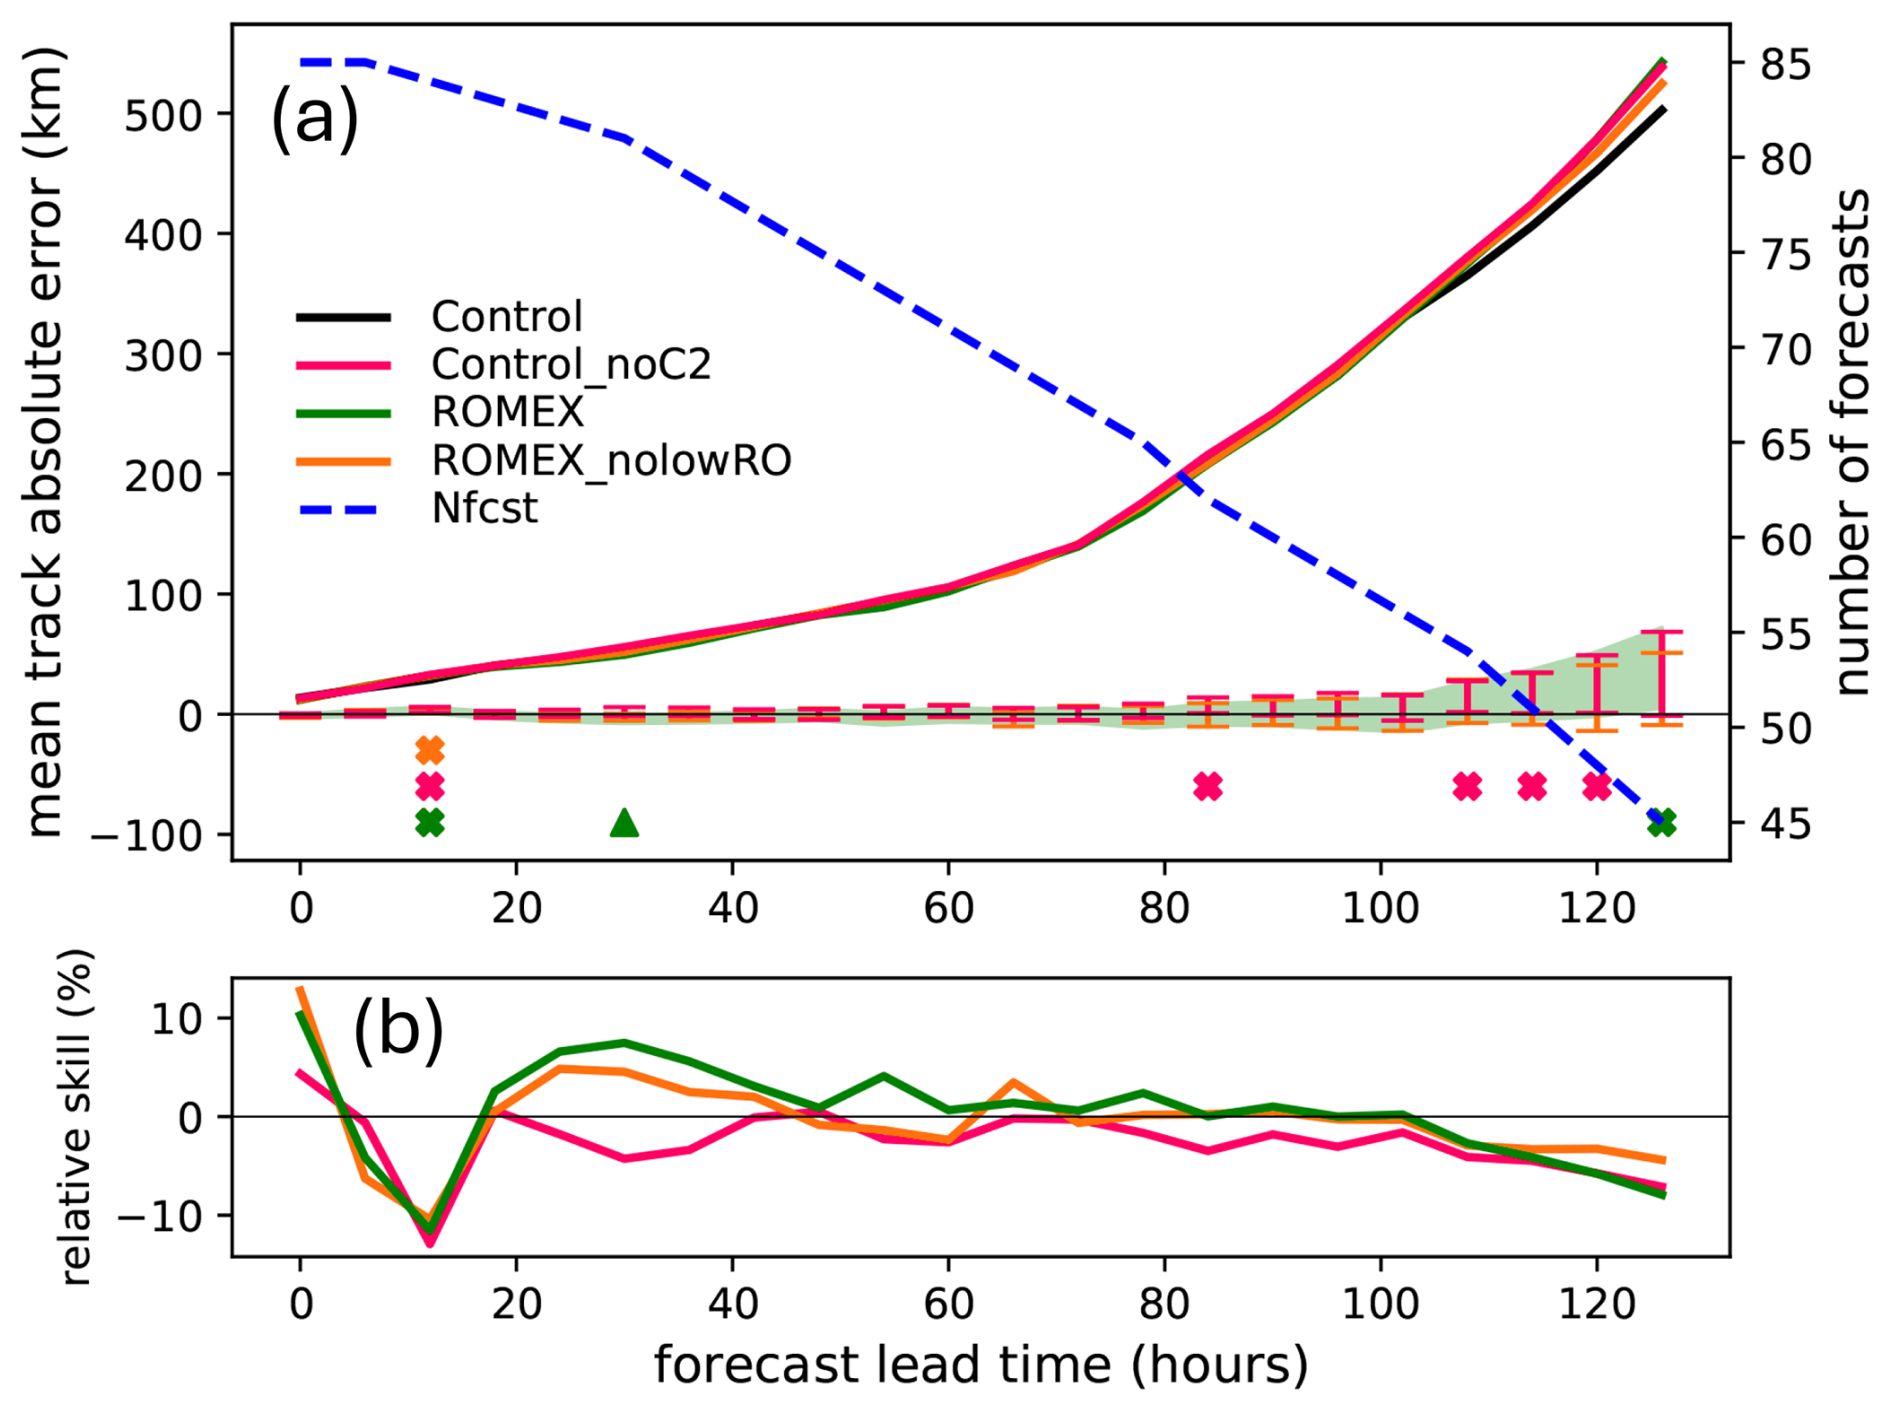
Figure 5(a) Mean absolute errors in TC position (km) plotted as a function of forecast lead time for the Control (black line), Control_noC2 (magenta line), ROMEX (green line), and ROMEX_noLowlevRO (orange line) HAFS-A experiments. Errors are measured against the NHC Best Track data. The dashed blue line shows the number of available verification forecasts. Green shading shows the 90 % confidence interval of the ROMEX-minus-Control forecast TC position error difference generated by bootstrap resampling. Statistically significant larger (smaller) ROMEX errors relative to Control occur at times when these confidence intervals remain above (below) zero, as denoted by green cross symbols (triangles). Magenta (orange) error bars and colored symbols likewise show ROMEX_noC2-minus-Control (ROMEX_noLowlevRO-minus-Control) forecast TC position error confidence intervals and statistically significant differences. (b) Time series of the TC position forecast relative skill (%) for the Control_noC2 (magenta line), ROMEX (green line), and ROMEX_noLowlevRO (orange line) experiments.
Nevertheless, we find that assimilating the commercial RO observations has a small positive impact on TC position errors during the t=18–102 h period, as evidenced by the positive ROMEX relative skill versus Control (Fig. 5b). When analyzing mean absolute error (MAE) statistics from a set of forecasts, we define relative skill for each sensitivity experiment (EXP) as (. Control_noC2's negative relative skill during the same period (Fig. 5b) indicates that COSMIC-2 observations are also beneficial for TC track forecasts. This is particularly true for the subset of analyses that initialize TCs equatorward of 24° N, for which removing COSMIC-2 from Control yields negative 5 %–10 % relative skill during t=54–96 h (not shown). We hypothesize that these small- to medium-range track forecast improvements, gained from assimilating COSMIC-2 and commercial RO data in the HAFS-A moving nest, could come from improved model predictions of TC vortex size, depth, or circulations in the near-storm environment, which in turn influence the storm's response to larger-scale flow fields (Galarneau and Davis, 2013).
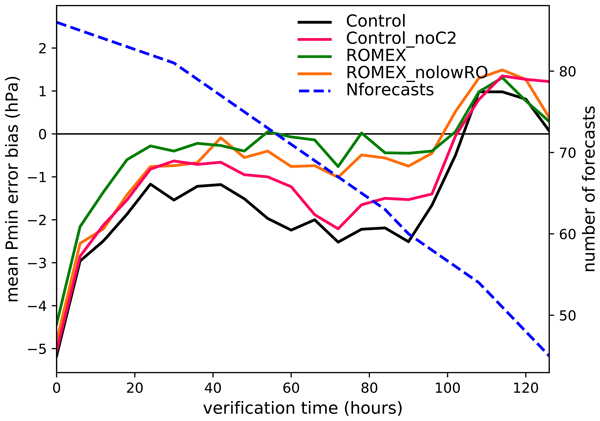
Figure 6 compares the HAFS-A experiments' PMIN mean absolute error time series. ROMEX commercial observations are modestly beneficial through t=36 h, when they provide a ∼ 5 %–15 % relative skill improvement, which is statistically significant for 0 h and 12 h forecasts. A substantial portion of ROMEX's t=0–36 h relative skill improvement is lost when RO data below the 5 km impact height are removed (compare the green and orange curves in Fig. 6b). COSMIC-2 impacts on forecast PMIN intensity mean absolute errors are mixed. Assimilating the ROMEX commercial observations nearly eliminates Control's negative 2–3 hPa mean PMIN bias over the t=24–90 h period (Fig. 7). COSMIC-2 assimilation partially contributes to Control's PMIN over-intensification bias, as shown by comparing the red and black curves in Fig. 7.
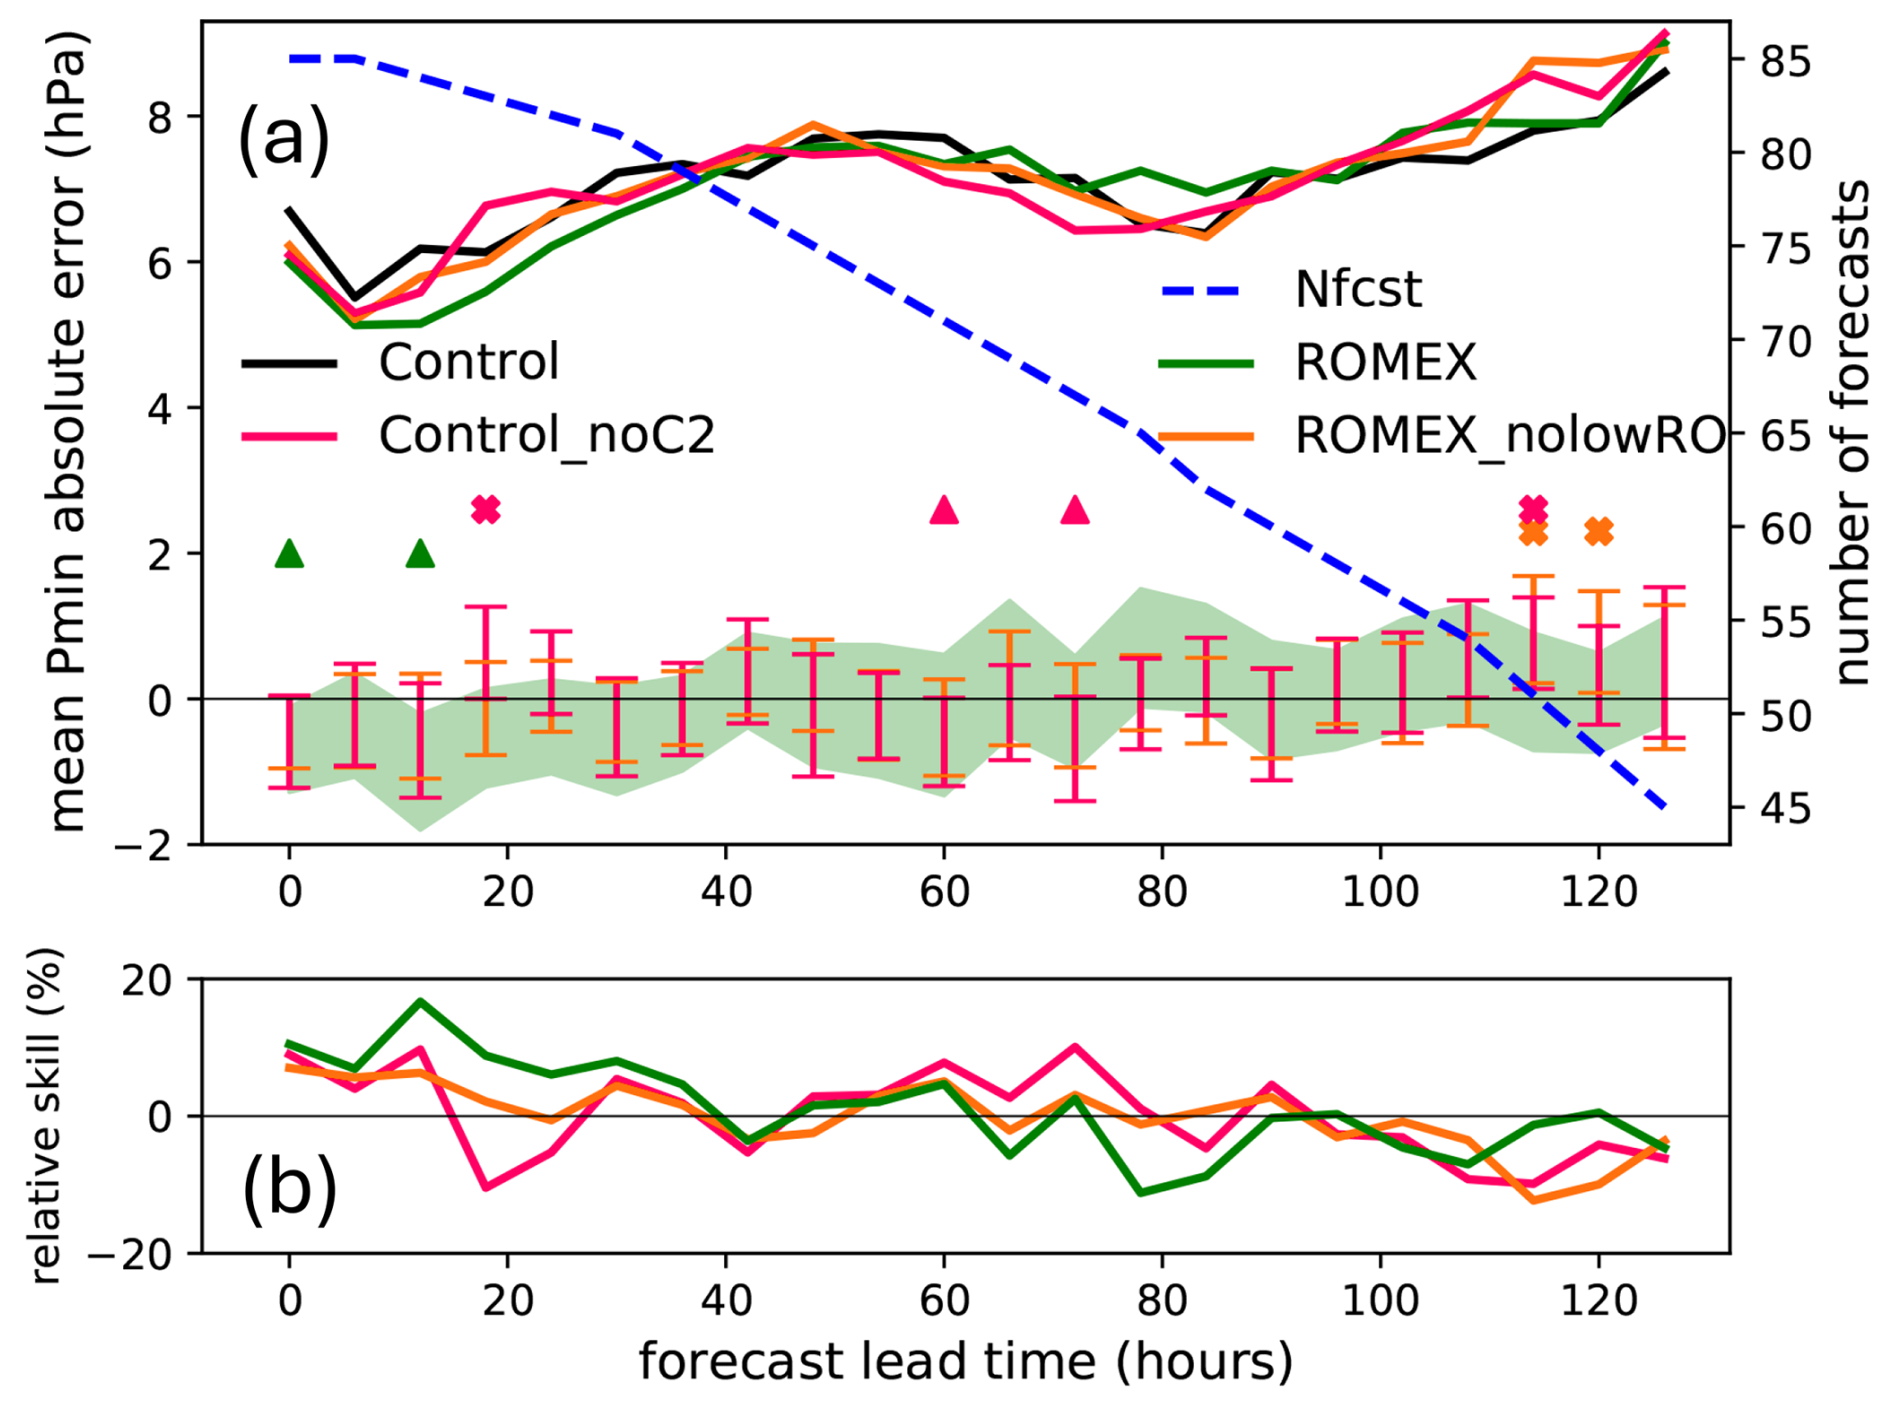
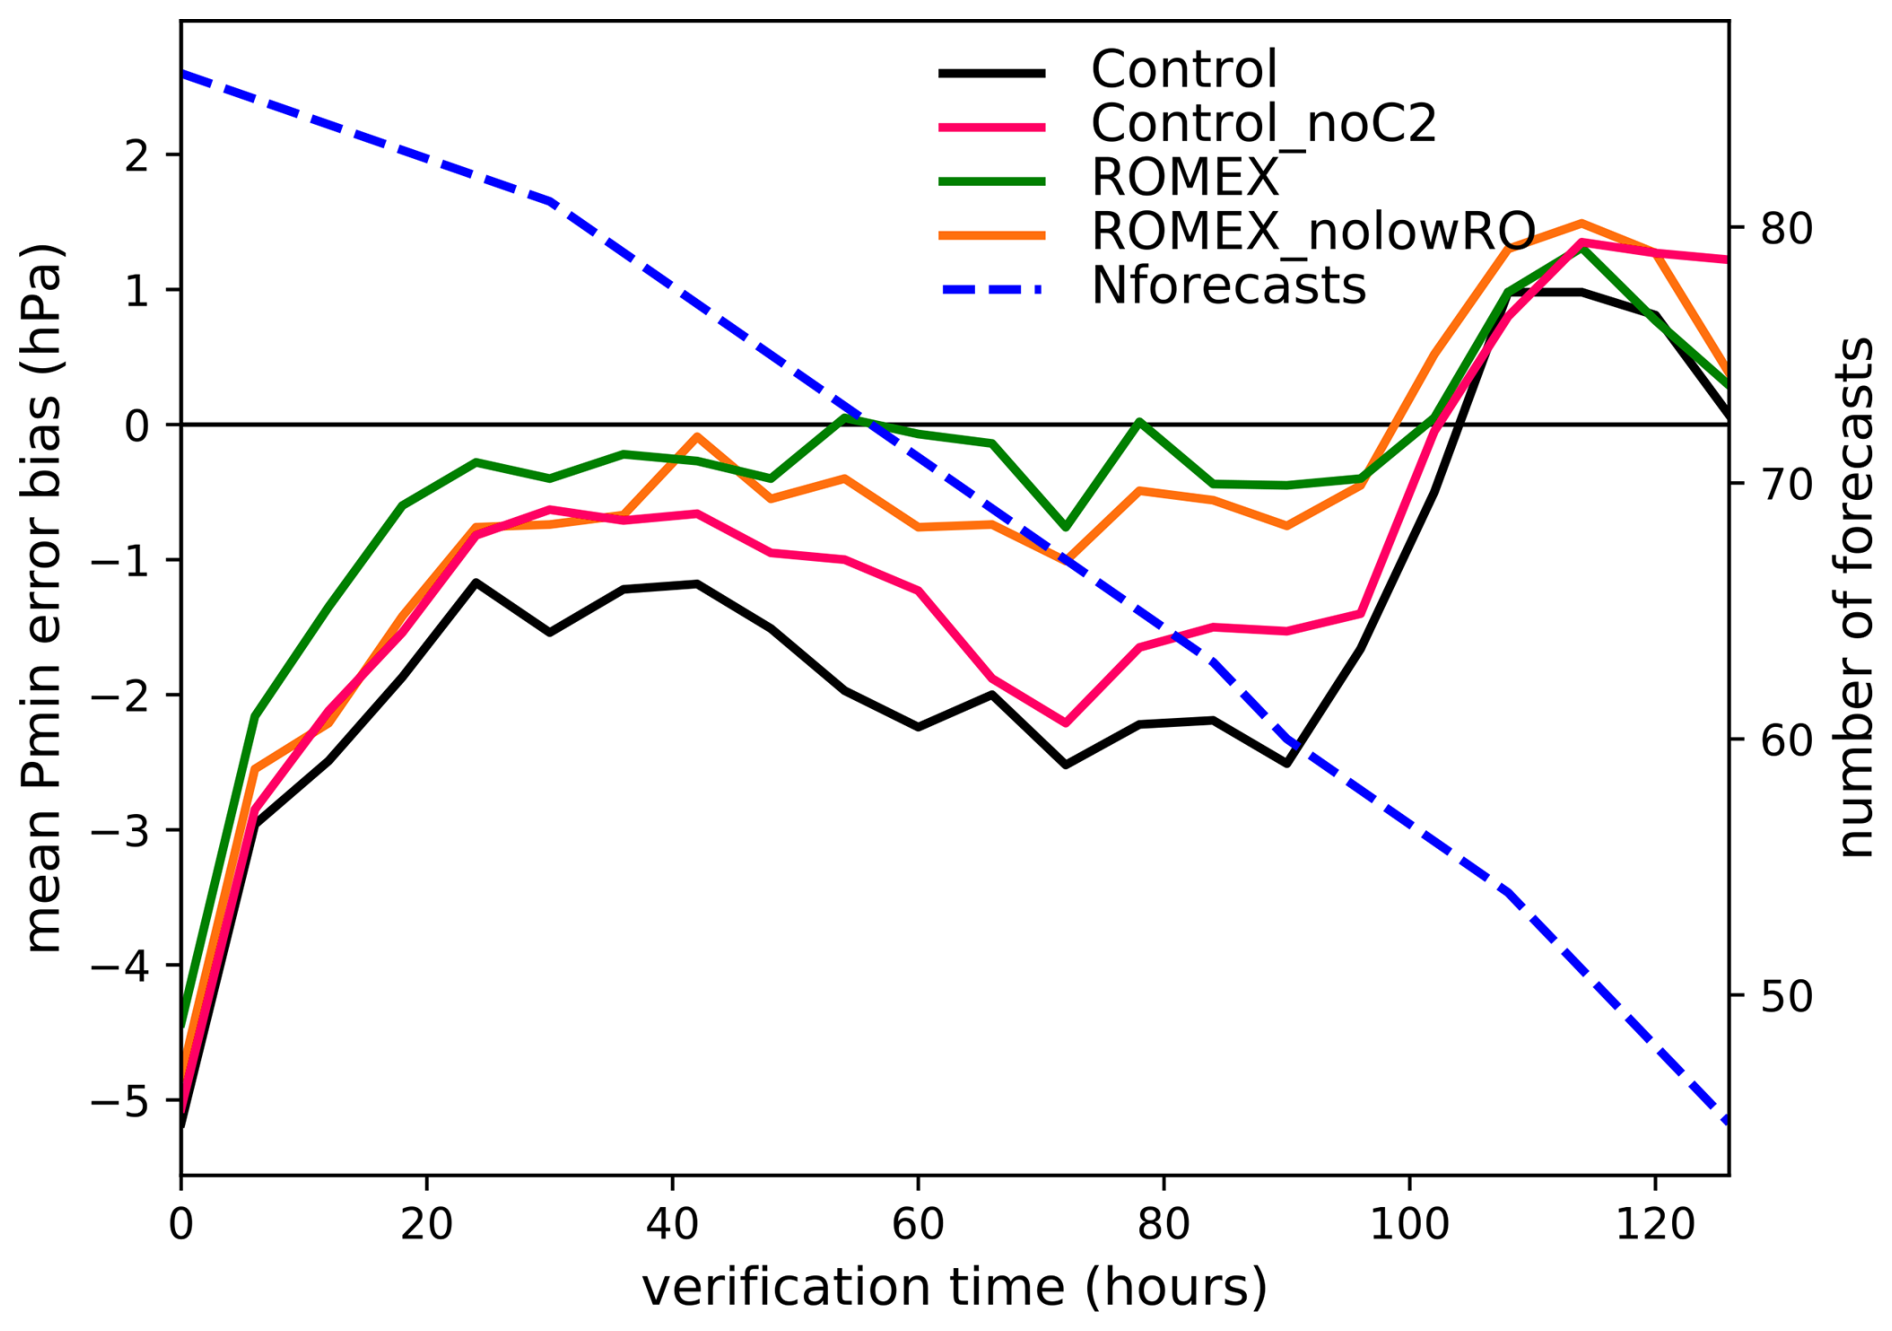
Figure 7Forecast time series of TC PMIN mean bias (hPa) for the Control (black line), Control_noC2 (magenta line), ROMEX (green line), and ROMEX_noLowlevRO (orange line) experiments, along with the number of forecasts used for verification (dashed blue line).
4.2 Verification against ERA5 data
We next compare the HAFS-A experiments in terms of their forecast temperature and water vapor errors, using the ECMWF Reanalysis version 5 (ERA5) as the verification truth. Figure 8a shows that assimilating ROMEX commercial RO data reduces the temperature Root-Mean-Square Deviation (RMSD) in the 200–400 hPa layer by several percentage points relative to Control over most of the forecast period. This improvement in ROMEX temperature RMSD extends down to around 800 hPa between t=18 h and t=48 h. In the lower troposphere, the impacts of ROMEX commercial RO observation impacts on temperature RMSD are mixed, showing degradation over the first 18 h but mostly improvement after t=54 h. Regarding bias, Fig. 8b shows that Control has a cool bias in the lower troposphere and a warm bias in the mid-to-upper troposphere. Assimilating the ROMEX commercial RO observations has little impact on the HAFS-A temperature bias patterns, except for a slight mitigation of the warm bias between 200 and 400 hPa in the later forecast period. Compared to the ROMEX commercial RO data, the assimilated COSMIC-2 observations have more mixed and muted impacts on the HAFS-A temperature fields, as evidenced by the Control and Control_noC2 temperature RMSD and bias field comparisons shown in Fig. 8c and d, respectively.
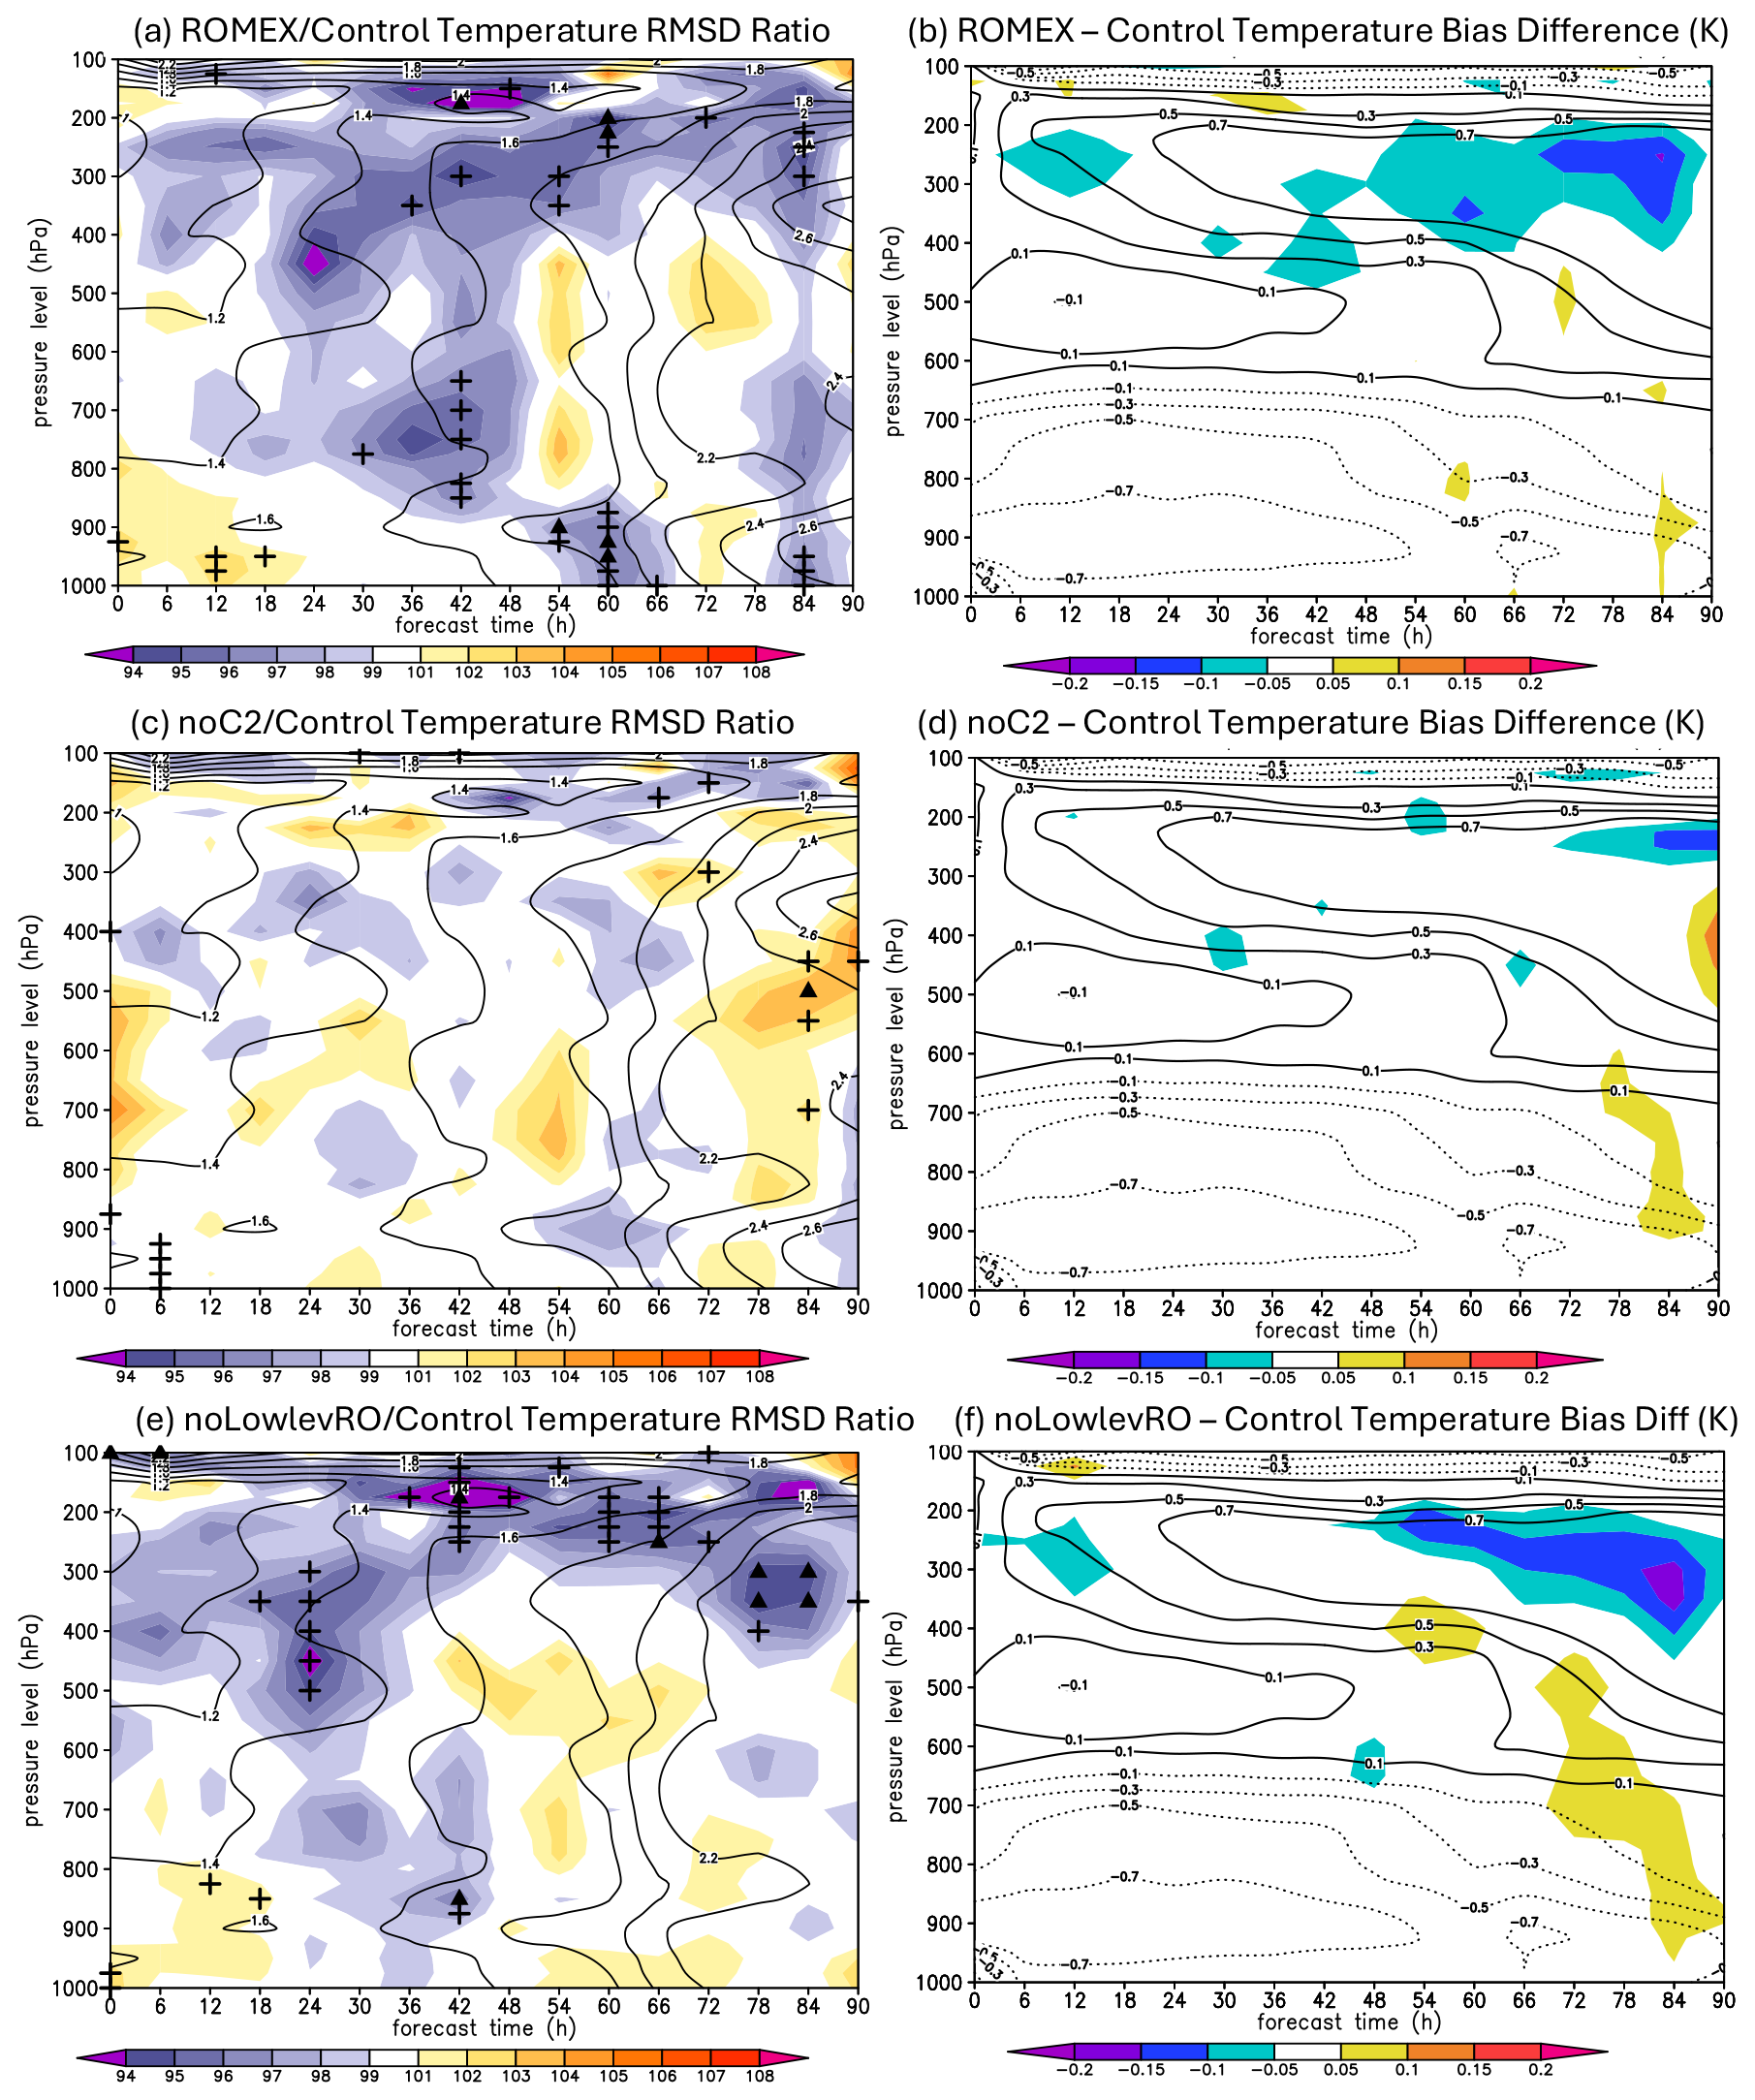
Figure 8(a) Time-height plot showing the ratio of the ROMEX forecast temperature RMSD divided by the Control forecast temperature RMSD (shading, %), where the RMSD is computed with respect to the ERA5 within 300 km of the TC center. Black contours show the Control temperature RMSD (K). Crosses and triangles show times and layers where the difference between the Control and ROMEX temperature RMSD is statistically significant at the 95 % and 99 % level, respectively. (b) Time-height plot showing the difference between the ROMEX and Control temperature biases [(ROMEX − ERA5) − (Control − ERA5)] in shading (K), with the Control temperature bias (K) also plotted in black contours. (c) As in panel (a), but for the Control_noC2/Control temperature RMSD ratio. (d) As in panel (b), but for the Control_noC2-Control temperature bias difference. (e) As in panel (a), but for the ROMEX_noLowlevRO/Control temperature RMSD ratio. (f) As in panel (b), but for the ROMEX_noLowlevRO-Control temperature bias difference.
Differences between the Control-normalized temperature RMSDs shown in Fig. 8a and e reflect the impacts of RO data assimilated below 5 km. Removing all lower-tropospheric RO observations from the ROMEX configuration (Fig. 8e) results in a substantial portion of the ROMEX temperature RMSD improvement (relative to Control) below 600 hPa (Fig. 8a) being lost. Predictably, the temperature RMSD improvement in the upper troposphere is largely retained in ROMEX_noLowlevRO. This outcome is expected, as localization in the HAFS-A background-error covariance matrix should cause assimilated observation impacts to dampen with increasing vertical distance from the observation.
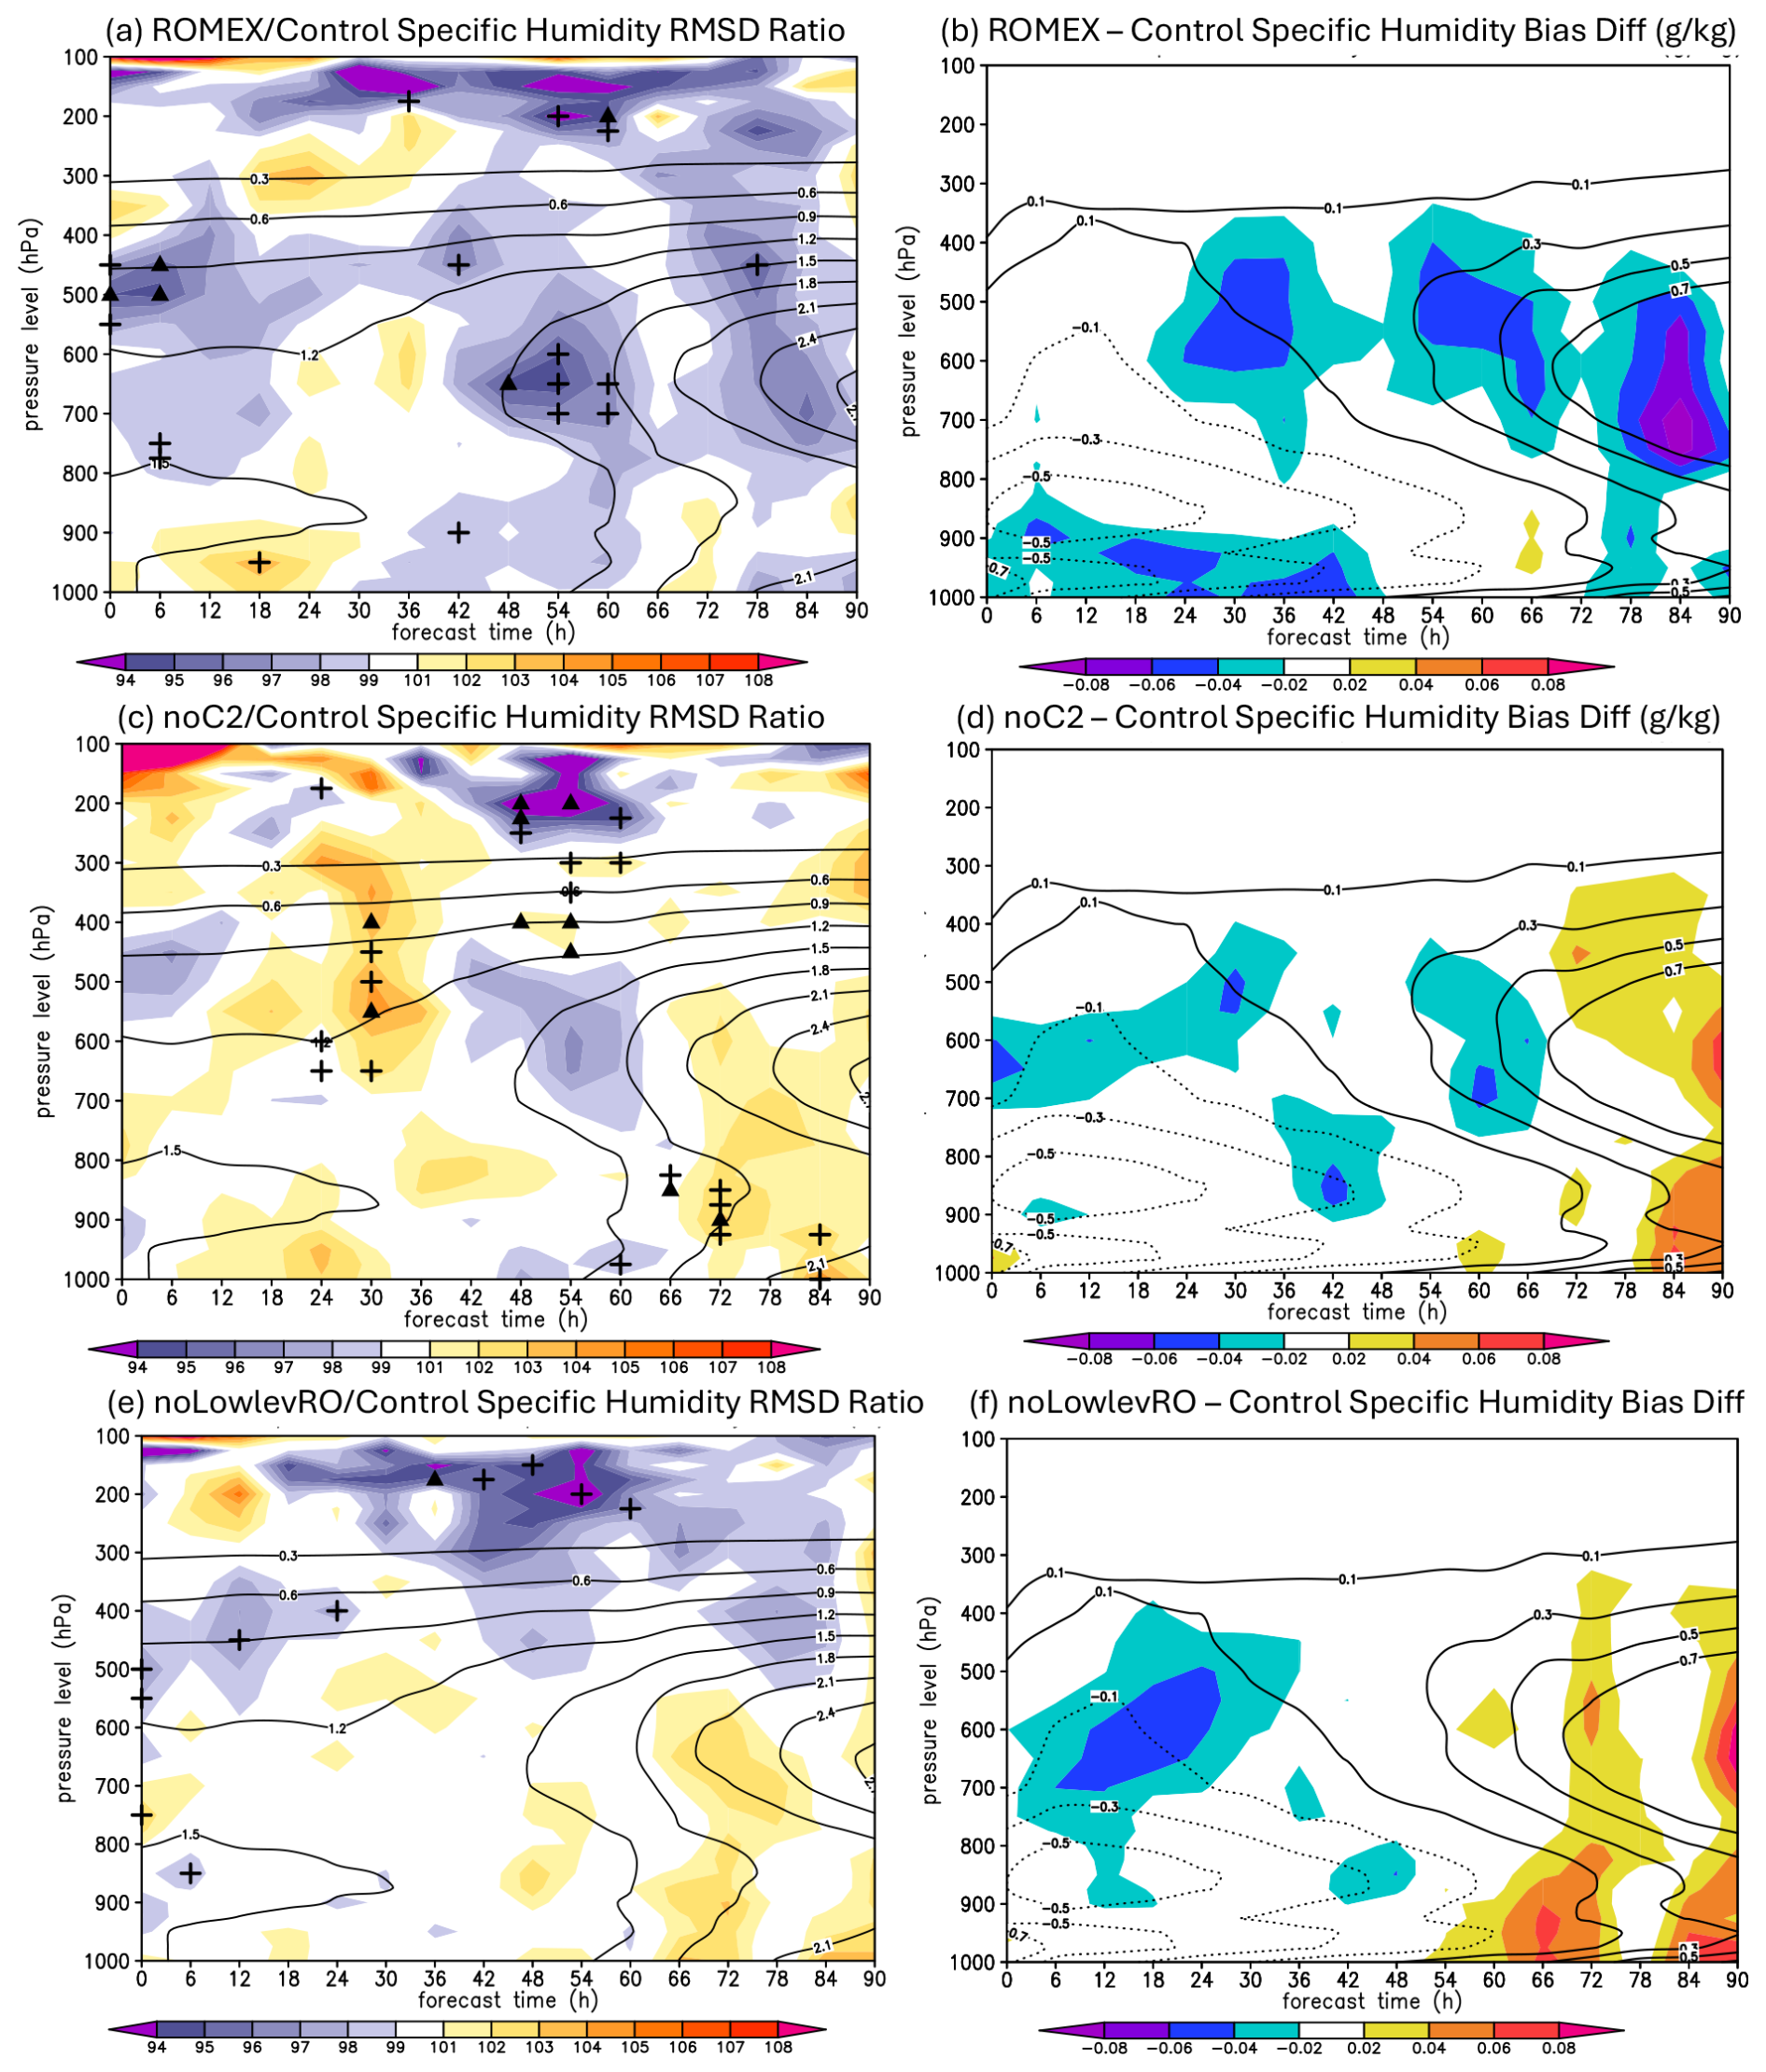
Overall, assimilating ROMEX commercial RO data reduces random errors in HAFS-A forecast tropospheric water vapor. Like temperature, the ROMEX specific humidity RMSD is reduced by several percentage points relative to Control over most layers and times in the middle and upper troposphere, with mixed impacts in the lower troposphere (Fig. 9a). Some of the most substantial improvement occurs during analyses and short-range forecasts around 500 hPa, where the ROMEX specific humidity RMSD is 3 %–6 % smaller than Control. The ROMEX commercial RO data have a modest drying impact; they mitigate a Control moist bias in the 400–700 hPa layer but exacerbate a Control dry bias in short-to-medium range forecasts below 850 hPa (Fig. 9b). However, these ROMEX-minus-Control specific humidity mean error differences are quite small, generally less than 0.1 g kg−1.
Unlike the mixed results for temperature, COSMIC-2 observations show a clearer positive impact on water vapor fields, as evidenced by the widespread specific humidity RMSD degradation in Control_noC2 relative to Control (Fig. 9c). COSMIC-2 assimilation also yields mixed and generally very small changes in HAFS-A water vapor mean biases (Fig. 9d). Finally, removing all (commercial- and government-mission) RO data below 5 km in ROMEX_noLowlevRO causes nearly all water vapor RMSD improvement below 400 hPa in ROMEX to be lost (cf. Fig. 9a, e). This implies that lower-tropospheric RO observations can also improve HAFS-A water vapor estimates in the middle troposphere via the background-error covariance matrix.
4.3 Verification against dropsonde observations
NOAA P-3 reconnaissance aircraft sampled Hurricanes Earl, Fiona, and Ian at 12–24 h intervals during their intensification and mature phases. Flying around 3 km in altitude, the P-3 aircraft crossed the TC inner core in several transect legs while releasing GPS dropsondes and collecting other in-situ observations. Two NOAA Gulfstream-IV missions also flew into Fiona's near-storm environment and released upper-tropospheric dropsondes. For verification, we compute 12 h HAFS-A forecast errors for temperature, specific humidity, and wind speed from 21 initialization cycles (7 from Earl, 7 from Fiona, 6 from Ian, and 1 from Julia; see Table 2) against dropsondes available within ±3 h of the verification time. Dropsondes were equipped with GPS sensors, enabling tracking of their three-dimensional trajectories during free fall. Since most dropsondes were collected by the lower-flying P-3 missions, our verification is restricted to the sub-700 hPa layer.
Table 2List of all HAFS-A 12 h forecasts verified against aircraft reconnaissance mission dropsonde data.
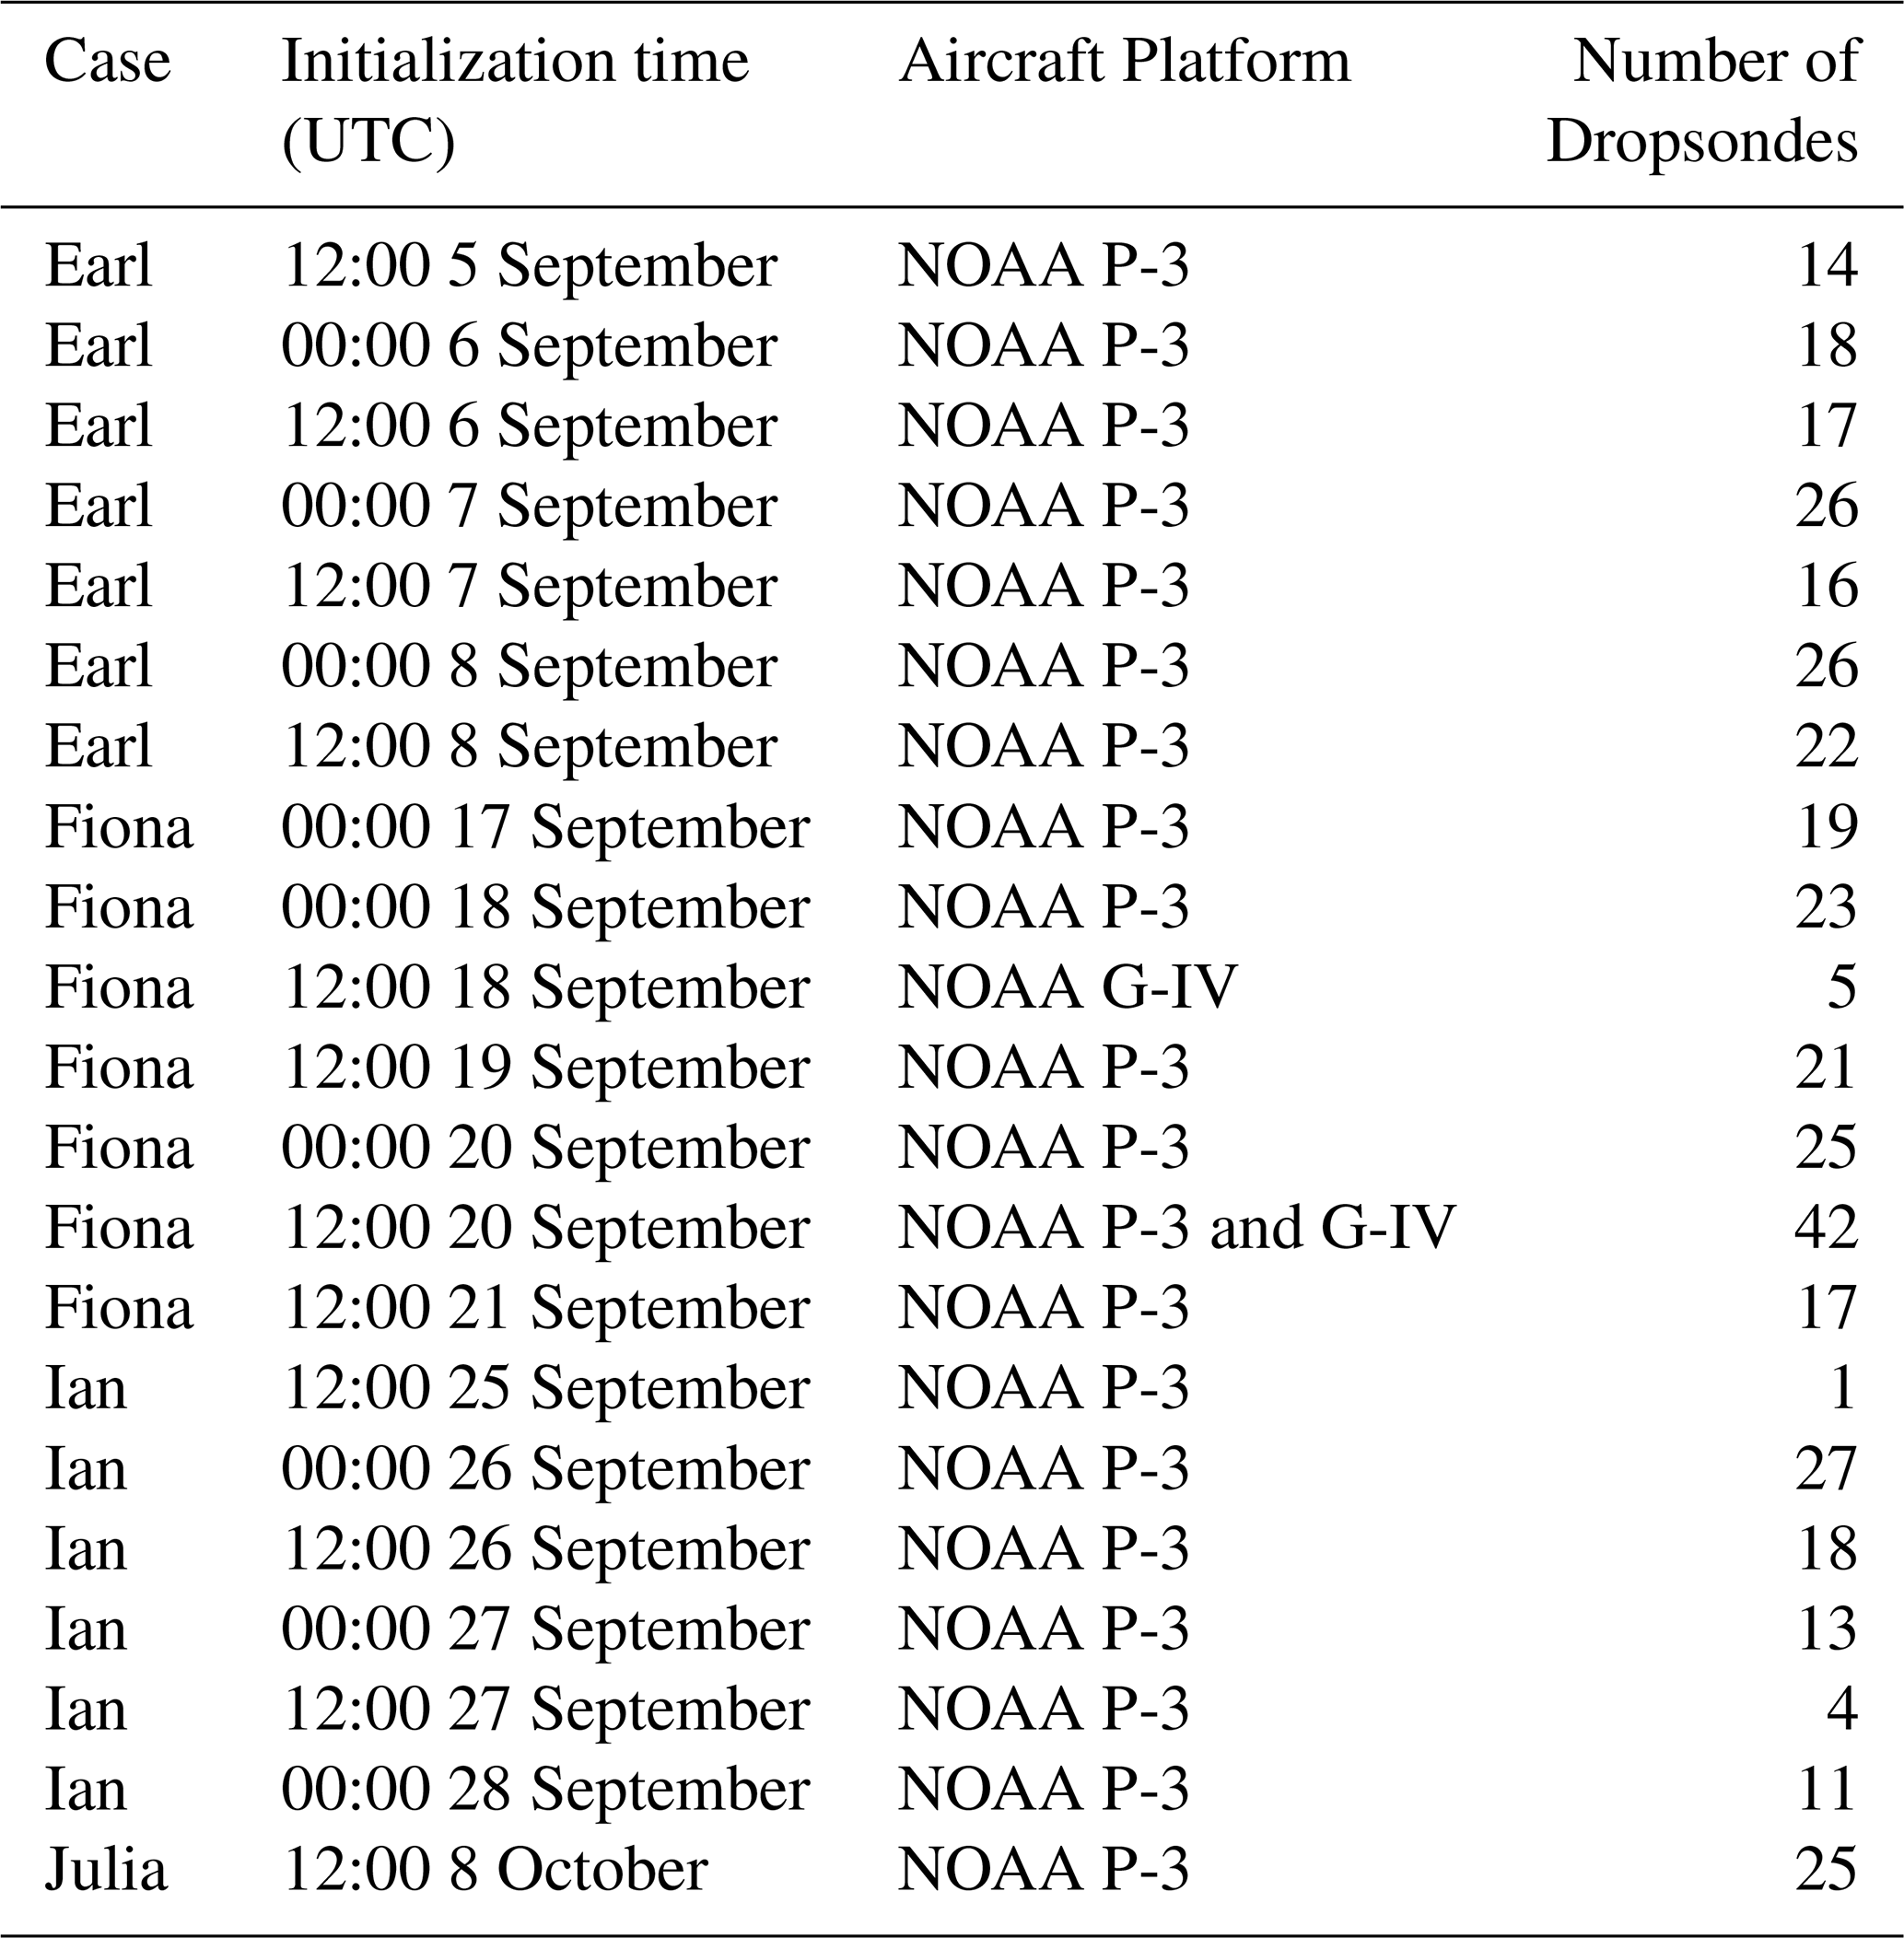
Figure 10a compares the 12 h forecast temperature biases and RMSDs of the four HAFS-A experiments against collocated dropsonde temperature observations. Control shows a negative 0.5–1 K cool bias in the sub-700 hPa layer. Compared to Control, the ROMEX temperature bias profile is similar, with one exception: it shows a ∼ 0.25 K stronger cool bias in the 700–750 hPa layer. Removing the sub-5 km RO data from our ROMEX experiment reduces the cool-temperature bias in this layer, bringing it closer to that of Control, suggesting that sub-5 km RO observations drive the ROMEX experiment's degradation there. The Control_noC2 cool bias is also ∼ 0.25 K stronger than Control's between 700 and 750 hPa, indicating a positive impact from assimilating COSMIC-2 in that layer. For temperature RMSD, both the ROMEX and ROMEX_noLowlevRO are comparable to or larger than Control's over the sub-700 hPa layer. However, assimilating COSMIC-2 in Control yields a 0.1–0.2 K RMSD improvement over Control_noC2 within a large portion of the sub-700 hPa layer.
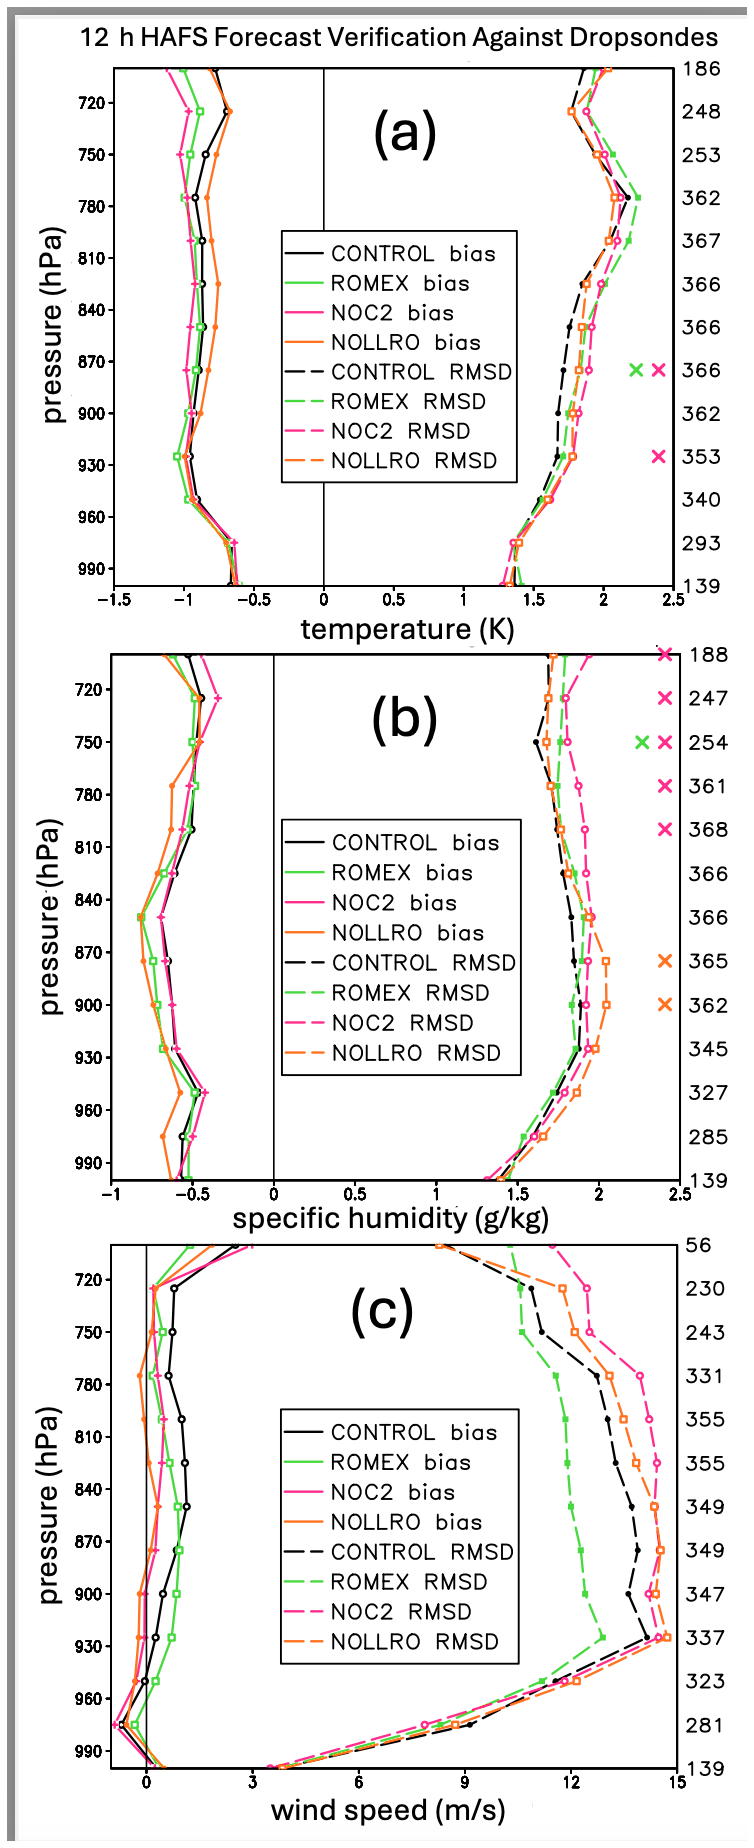
Figure 10(a) Solid lines show profiles of the 12 h HAFS-A temperature forecast bias (K) computed against NOAA aircraft reconnaissance mission dropsondes for Control (black), ROMEX (green), Control_ noC2 (magenta), and ROMEX_noLowlevRO (orange). The number of dropsonde temperature observations per verification layer is shown on the right y-axis. Dashed lines show the 12 h HAFS-A forecast temperature RMSD (K) relative to dropsonde data, colored by experiment. (b) As in panel (a) but for 12 h forecast specific humidity (g kg−1). (c) As in panel (a) but for 12 h forecast horizontal wind speed (m s−1). Green, magenta, and orange X-symbols, respectively, mark layers where the ROMEX, Control_noC2, and ROMEX_noLowlevRO forecast RMSDs differ statistically significantly from the Control RMSD at the 95 % level.
For the 12 h forecast specific humidity verification (Fig. 10b), we find that Control has a ∼ 0.5 g kg−1 dry bias below 700 hPa, and that ROMEX's dry bias is similar or slightly worse. RO data assimilated below 5 km are slightly beneficial, as removing them increases the dry bias by ∼ 0.1 g kg−1 over portions of the sub-700 hPa layer. COSMIC-2 assimilation has little impact on Control's dry bias. While the ROMEX specific humidity RMSD profile resembles that of Control, the RO data assimilated below 5 km are generally beneficial for reducing random water vapor errors, particularly around 900 hPa. At this level, the ROMEX_noLowlevRO specific humidity RMSD is a statistically significant ∼ 0.2 g kg−1 larger than those of both ROMEX and Control. Above 800 hPa, COSMIC-2 assimilation in Control also yields a statistically significant ∼ 0.2 g kg−1 specific humidity RMSD improvement over Control_noC2.
The assimilated ROMEX RO data improves the horizontal wind speed RMSD by ∼ 1–2 m s−1 in the 750–950 hPa layer, although this result is not statistically significant. Removing all sub-5 km RO data more than reverses all of ROMEX's wind RMSD improvement, and additionally, removing the COSMIC-2 observations degrades the Control wind RMSD. Therefore, the lower-tropospheric RO dataset from Spire, PlanetiQ, and COSMIC-2 is beneficial for reducing random horizontal wind-speed errors below 750 hPa in HAFS-A. Even though the RO forward operator does not depend on kinematic variables, this result is consistent with Chen et al. (2020), who showed that cycled RO refractivity assimilation in a regional model could improve short-range forecasts of vertical velocity and vorticity during TC cyclogenesis via dynamical coupling between thermodynamic and kinematic fields.
After examining individual HAFS-A forecasts from all four cases, it was found that Hurricane Fiona intensity forecasts initialized on 21 and 22 September stood out from the rest for their greater improvement when assimilating the ROMEX data. This is shown in Fig. 11, which compares the Control and ROMEX PMIN forecast time series against Best Track PMIN for the eight 21–22 September initialization cycles. During this period, Fiona's intensification rate slowed as the Category 4 storm reached a steady state while moving northeastward through the subtropical North Atlantic about 1000 km off the southeastern US coast. Favorable environmental conditions, including warm sea surface temperatures (SSTs) and low vertical wind shear (VWS), maintained Fiona's mature TC structure and 930–935 hPa PMIN through 12:00 UTC 23 September. Except for the 06:00 UTC 21 September cycle (Fig. 11a), the Control PMIN forecasts shown here feature a persistent 10–20 hPa over-intensification (i.e., negative) bias starting at the model initialization. Assimilating the ROMEX dataset yields a ∼ 5–10 hPa mitigation of Control's negative PMIN analysis and forecast bias. The track forecasts initialized on 21 and 22 September show minimal differences between the Control and ROMEX experiments (not shown).
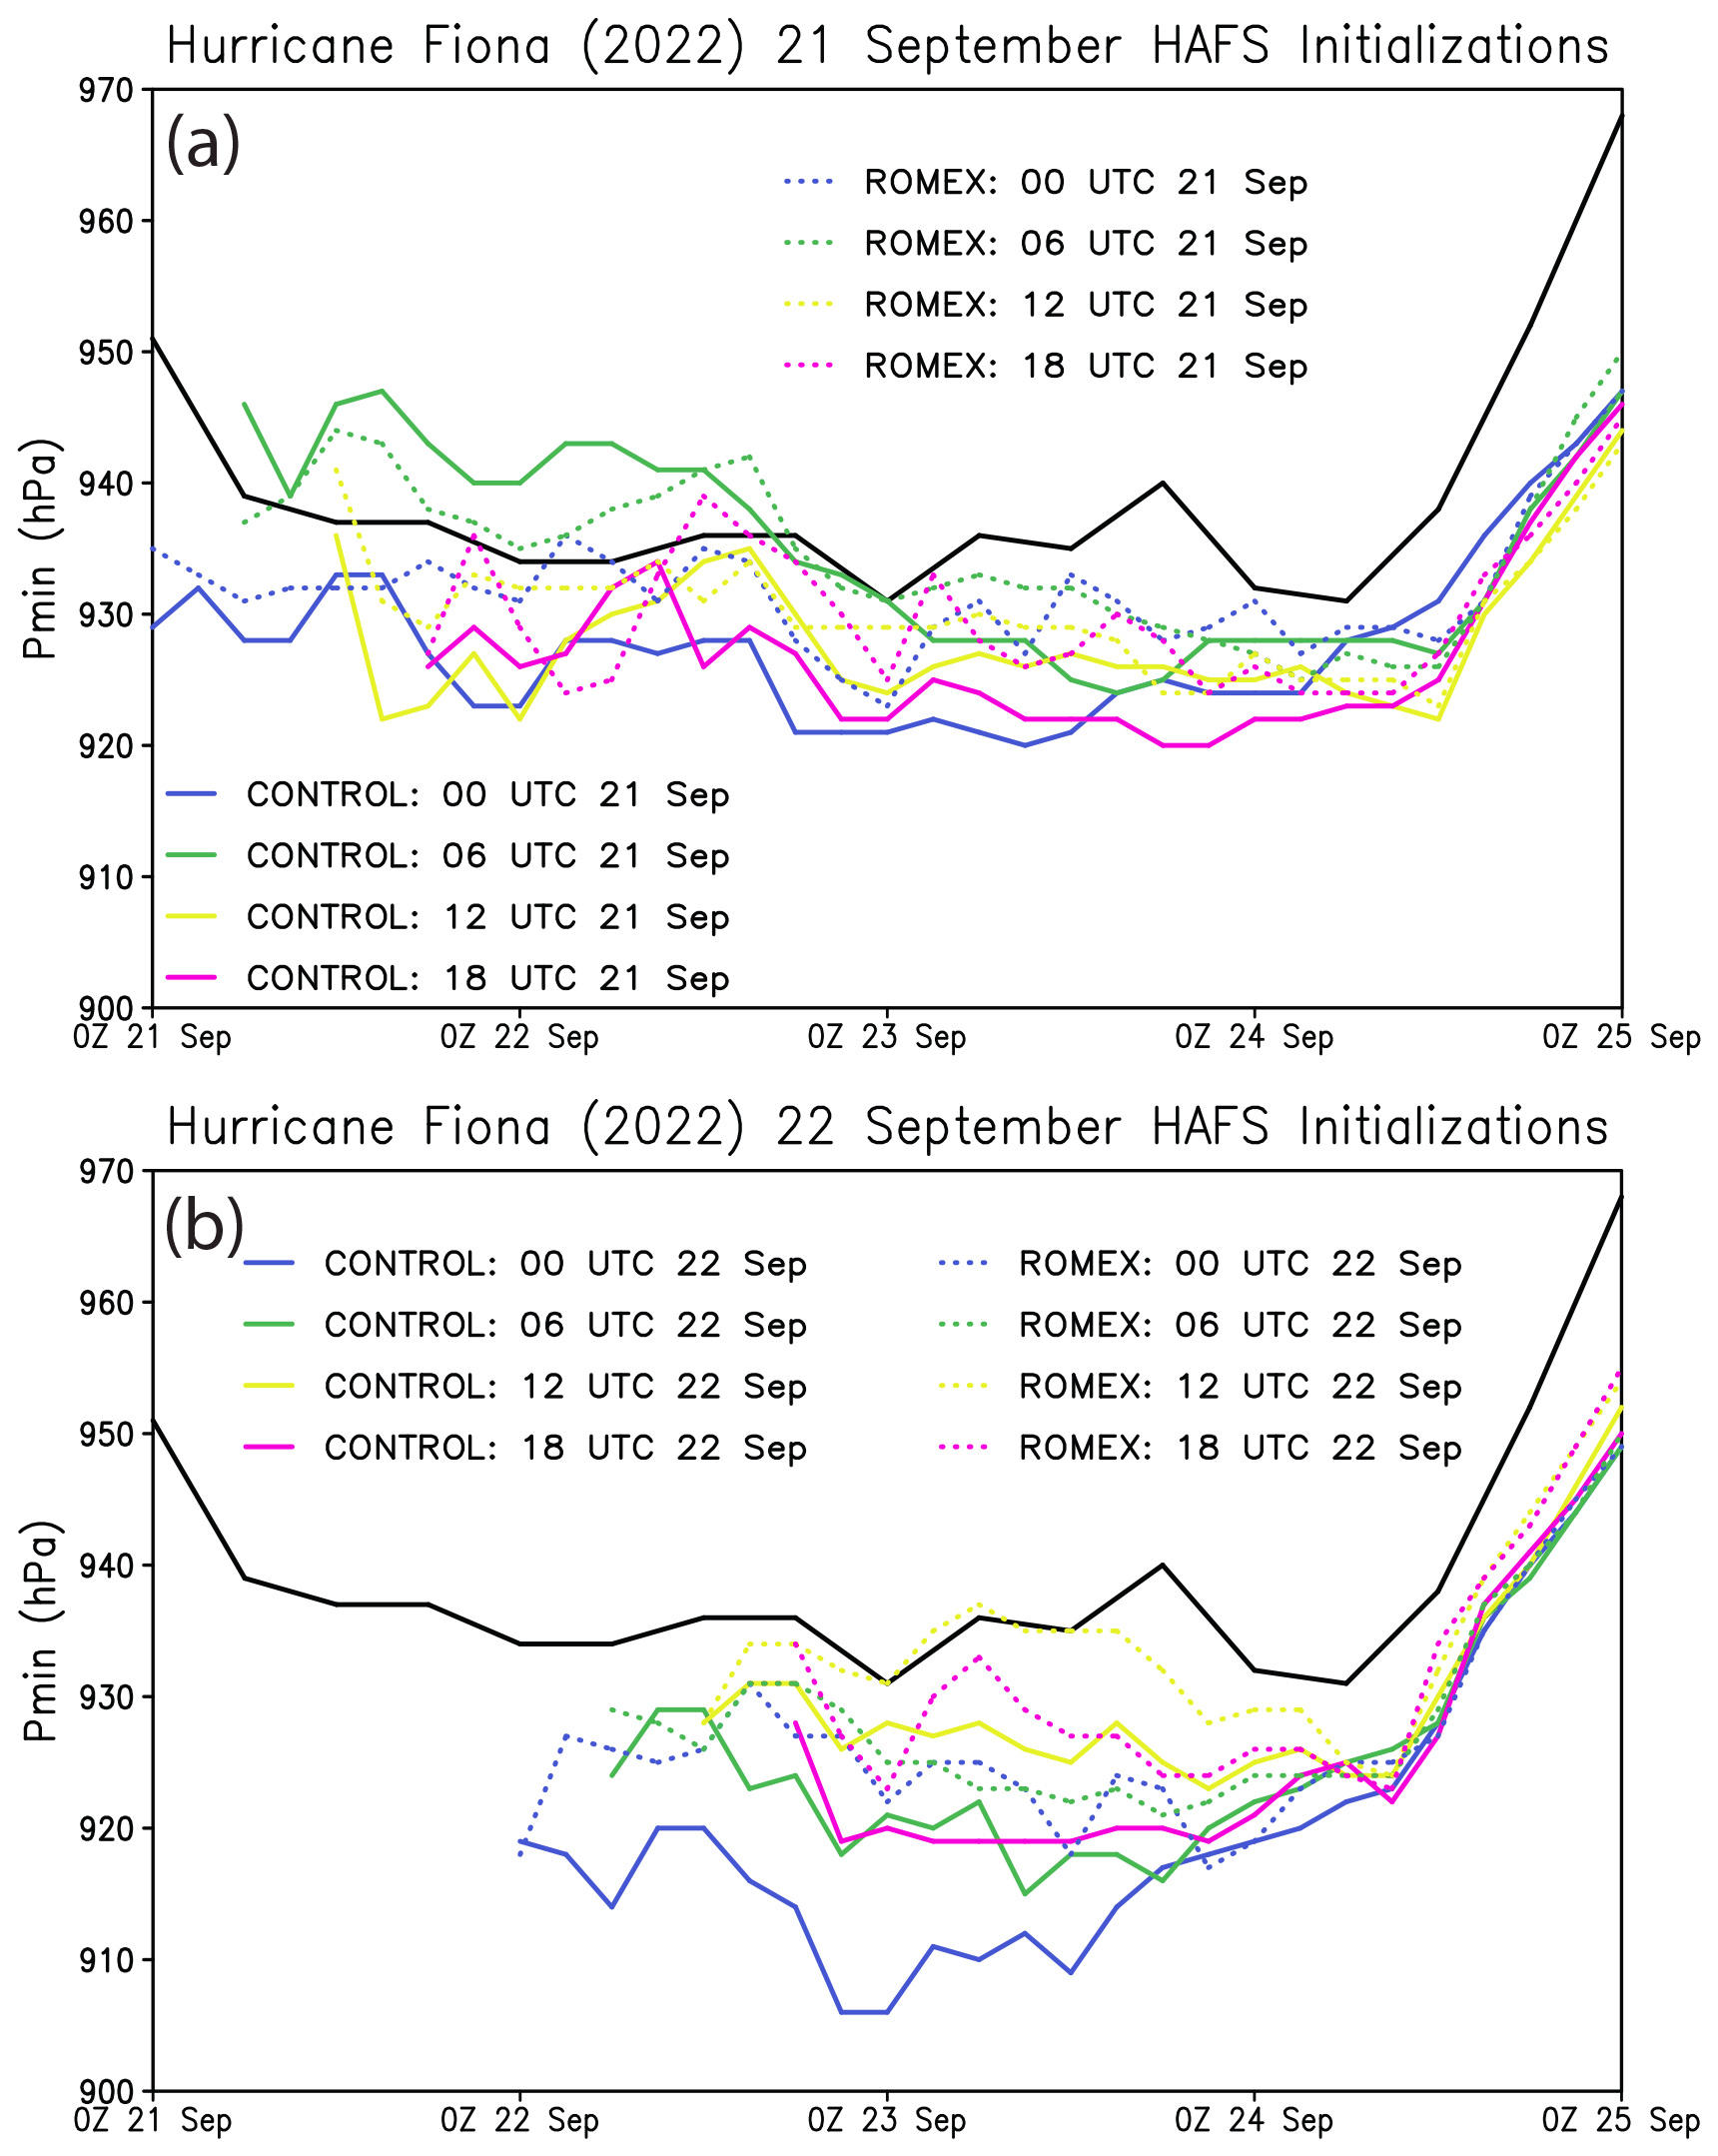
Figure 11Hurricane Fiona (2022) PMIN forecasts initialized on (a) 21 September and (b) 22 September, shown for Control (solid lines) and ROMEX (dotted lines). Lines plotting forecast PMIN time series are colored by initialization time, as indicated in the inset key boxes. The black line shows the NHC Best Track PMIN for Fiona.
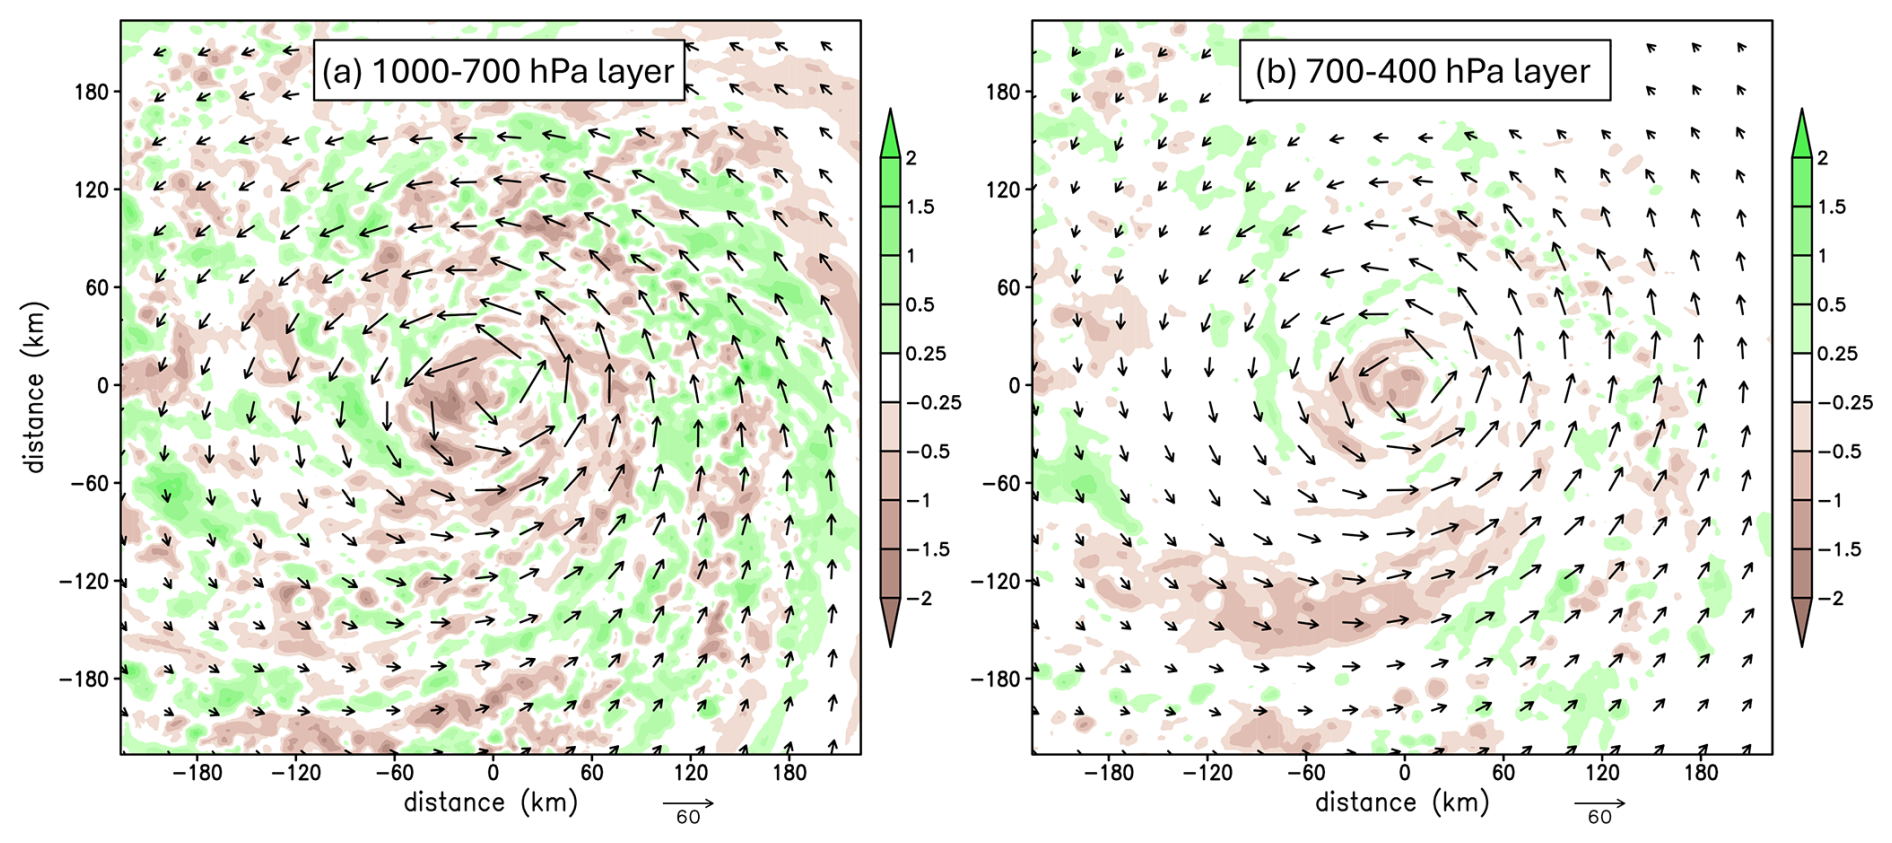
Figure 12(a) ROMEX-minus-Control specific humidity differences (g kg−1) averaged over the 1000–700 layer and over the 00:00, 06:00, 12:00, and 18:00 UTC 21 September analyses. Vectors show ROMEX 900 hPa horizontal winds (m s−1) averaged over the same four analyses. (b) As in panel (a) but for ROMEX-minus-Control specific humidity differences averaged over the 700–400 hPa layer with 500 hPa ROMEX horizontal winds.
This persistent pattern of reduced over-intensification biases in ROMEX initializations on 21–22 September suggests that the ROMEX DA cycles led to the evolution of a less favorable near-storm environment. Figure 12a shows ROMEX-minus-Control analysis specific humidity differences averaged vertically below 700 hPa and temporally over the 00:00, 06:00, 12:00, and 18:00 UTC cycles on 21 September. Most areas inside the 100 km radius are 0.25–1 g kg−1 drier in ROMEX, compared to Control. This is consistent with our finding of drier 12 h ROMEX forecasts versus Control along inner-core P-3 dropsonde trajectories in the 825–925 hPa layer (Fig. 10b). Beyond the 100 km radius, particularly in the storm's northeastern quadrant, the ROMEX lower troposphere analysis is found to be moister than that of Control. Examining ROMEX-minus-Control specific humidity analysis differences averaged in the 700–400 hPa mid-troposphere layer for the same four cycles (Fig. 12b), the most prominent differences are evident near the TC center as well as in a band about 120 km to the south and southwest, where ROMEX analyses are about 0.25–1 g kg−1 drier.
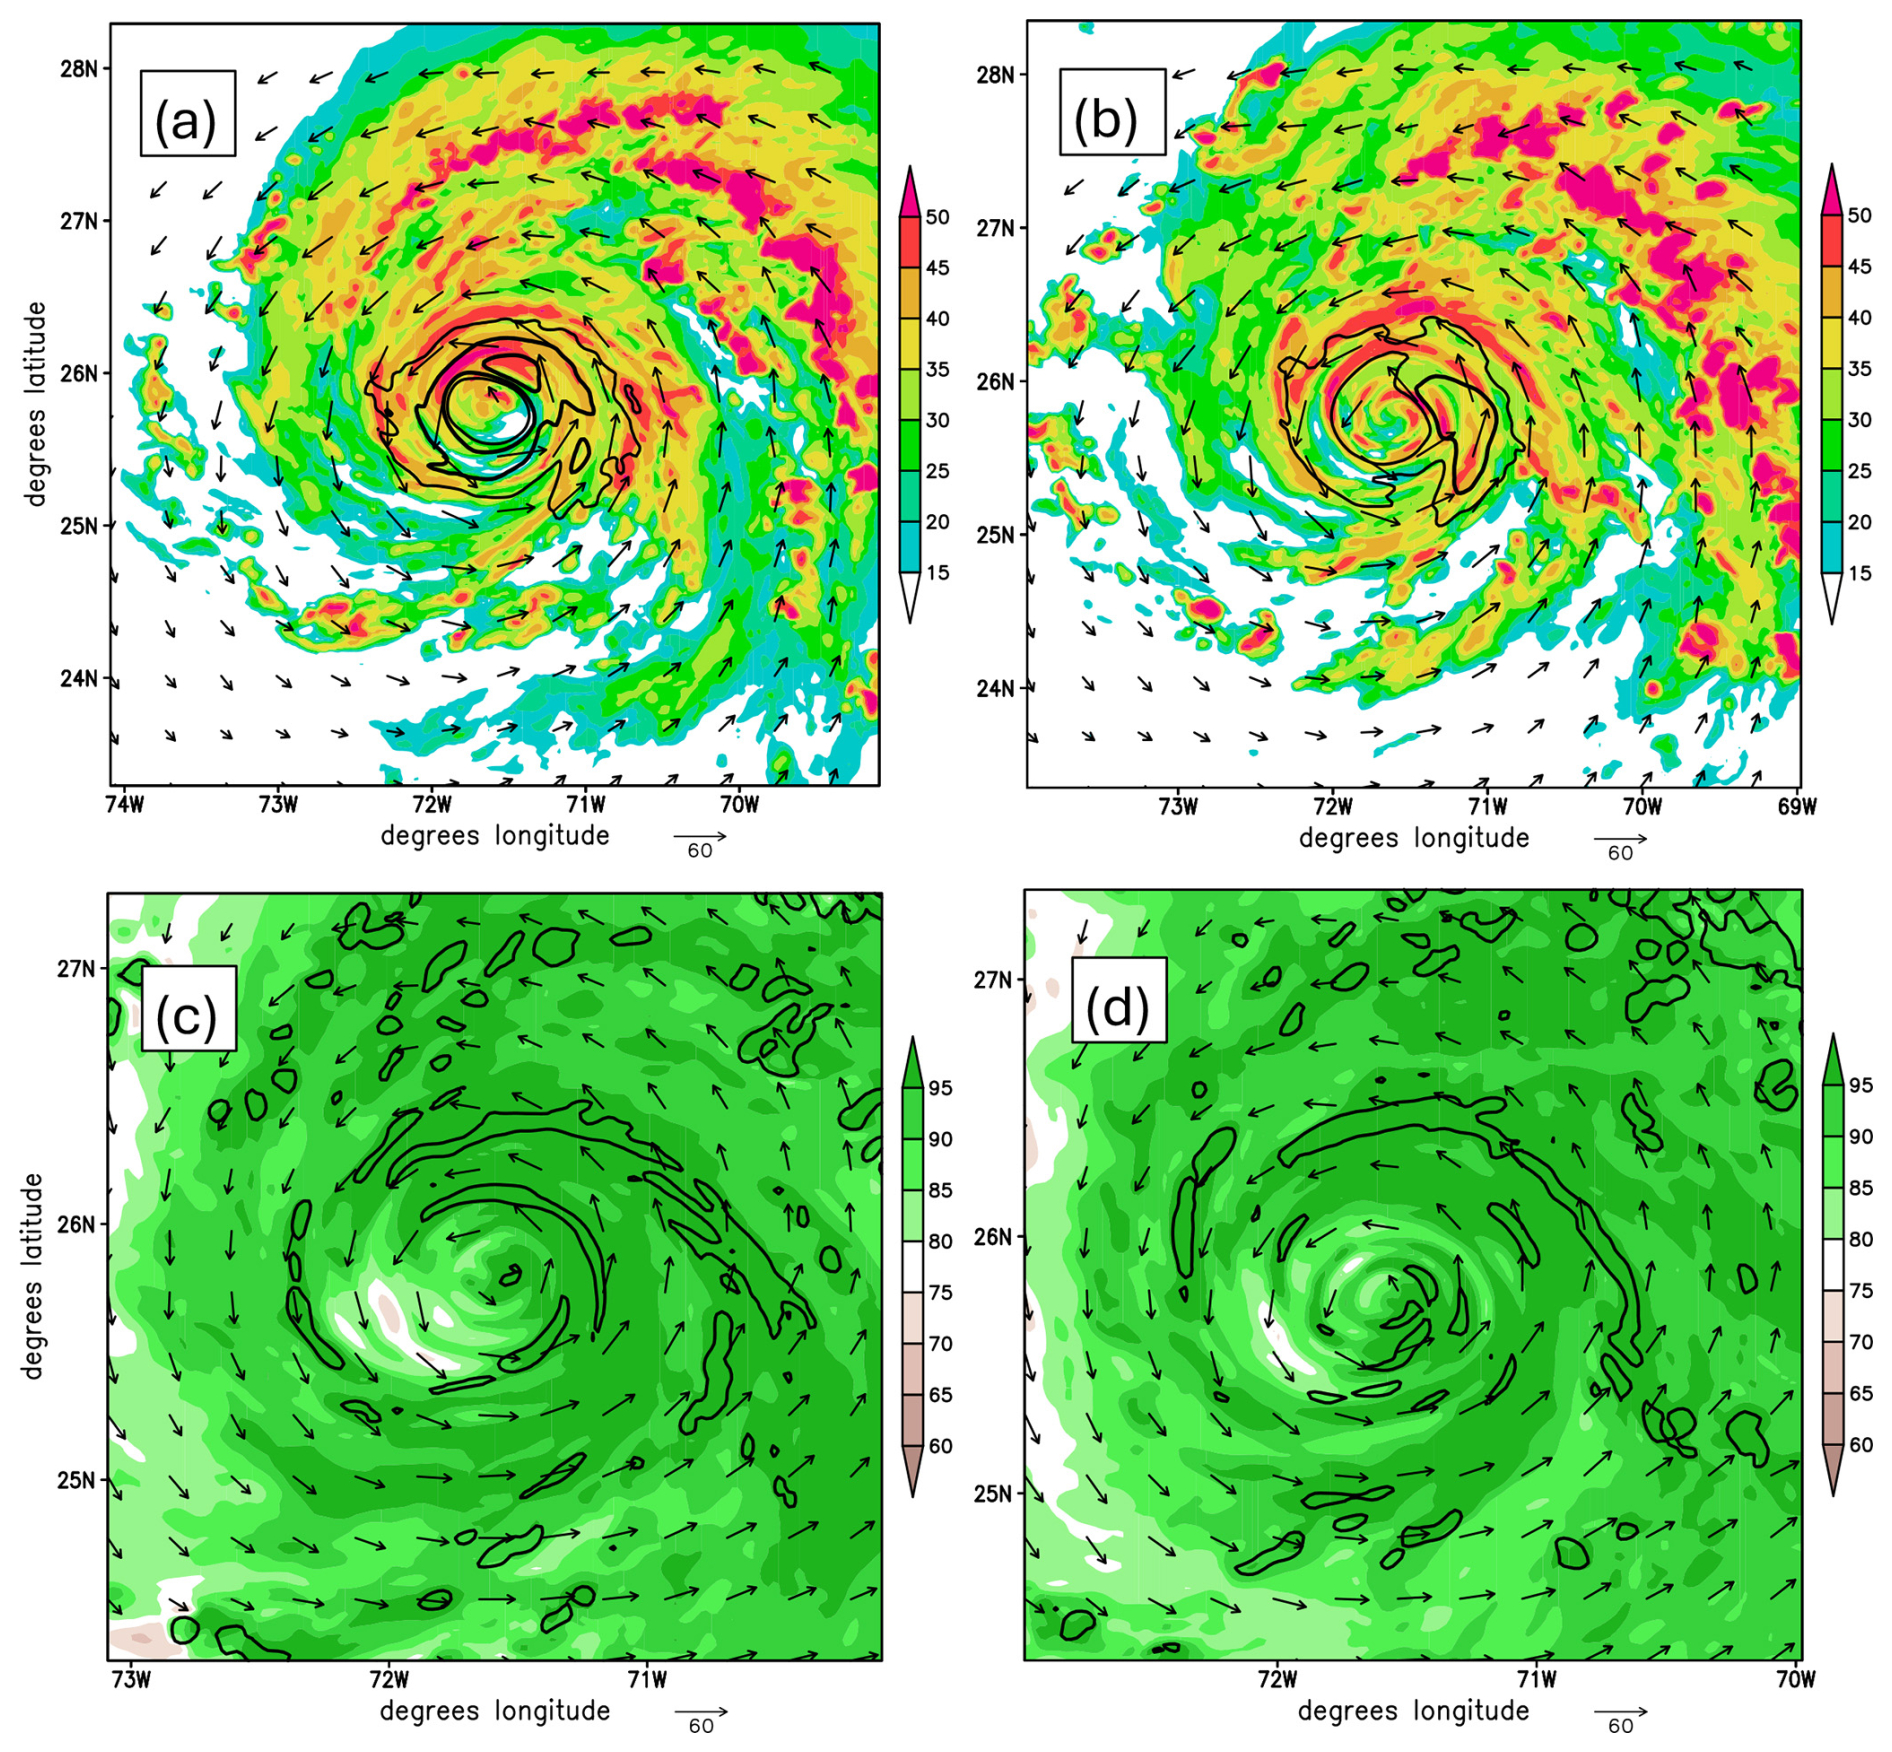
Figure 13(a) Control 12 h forecast of Hurricane Fiona (2022) composite radar reflectivity (shading, dBZ) valid at 00:00 UTC 22 September. Horizontal winds at 900 hPa (m s−1) are shown as vectors (see arrow scale at lower right) and their magnitudes are contoured (thin for 50 and thick for 55 and 60). (b) As in panel (a) but for the ROMEX experiment. (c) Same Control 12 h forecast shown in panel (a), but here plotting 700–400 hPa layer-averaged RH (shading, %), the 1 m s−1 vertical velocity contour at 600 hPa, and 500 hPa horizontal wind vectors (m s−1). (d) As in panel (c) but for the ROMEX experiment.
Figure 13 compares Hurricane Fiona's structure in 12 h Control and ROMEX forecasts initialized at 12:00 UTC 21 September. While both the Control- (Fig. 13a) and ROMEX-forecast (Fig. 13b) storms' convective patterns share many characteristics, including a prominent rainband located in the northeastern quadrant around 2° radius from the center, the Control storm has higher reflectivity values within its eyewall. The latter appears here as the annular-shaped region around Fiona's center where 900 hPa horizontal wind speed exceeds 50 m s−1. Compared to ROMEX, the Control forecast's near-surface eyewall winds are about 5–10 m s−1 stronger, broadly consistent with these forecasts' PMIN differences (compare the dotted and solid orange lines at 00:00 UTC 22 September in Fig. 11a) under an empirical TC vortex pressure-wind relationship (Chavas et al., 2025). Control also generates stronger and more organized midlevel updrafts, arcing around the ∼ 0.3° radius in the northern and southeastern quadrants of its eyewall (cf. Fig. 13c, d). These differences in reflectivity and mid-level updraft strength between the Control and ROMEX 12 h forecasts reveal that the Control has more vigorous inner-core convection, which aligns with its analysis showing a moister lower-to-middle troposphere within a 100 km radius (Fig. 12). This is dynamically significant: deep convective updrafts in a TC inner core provide a key mechanistic link between the favorable thermodynamic conditions of high relative humidity (RH) in the lower-to-middle troposphere and the storm's wind field intensification. For example, it is well known that eyewall updrafts facilitate latent heat conversion to kinetic energy (Rotunno and Emanuel, 1987) and convergence of higher absolute angular momentum (AAM)-air advected inward from larger radii (Zhang et al., 2001; Montgomery and Smith, 2014). A moister near-storm environment limits dry air entrainment and favors stronger, more organized eyewall updrafts (Cram et al., 2007; Braun et al., 2012). Therefore, it is plausible that the drying impact of the assimilated ROMEX observations on Hurricane Fiona's 21 September analyses helped to reduce the storm's over-intensification bias in HAFS-A forecasts initialized from those analyses.
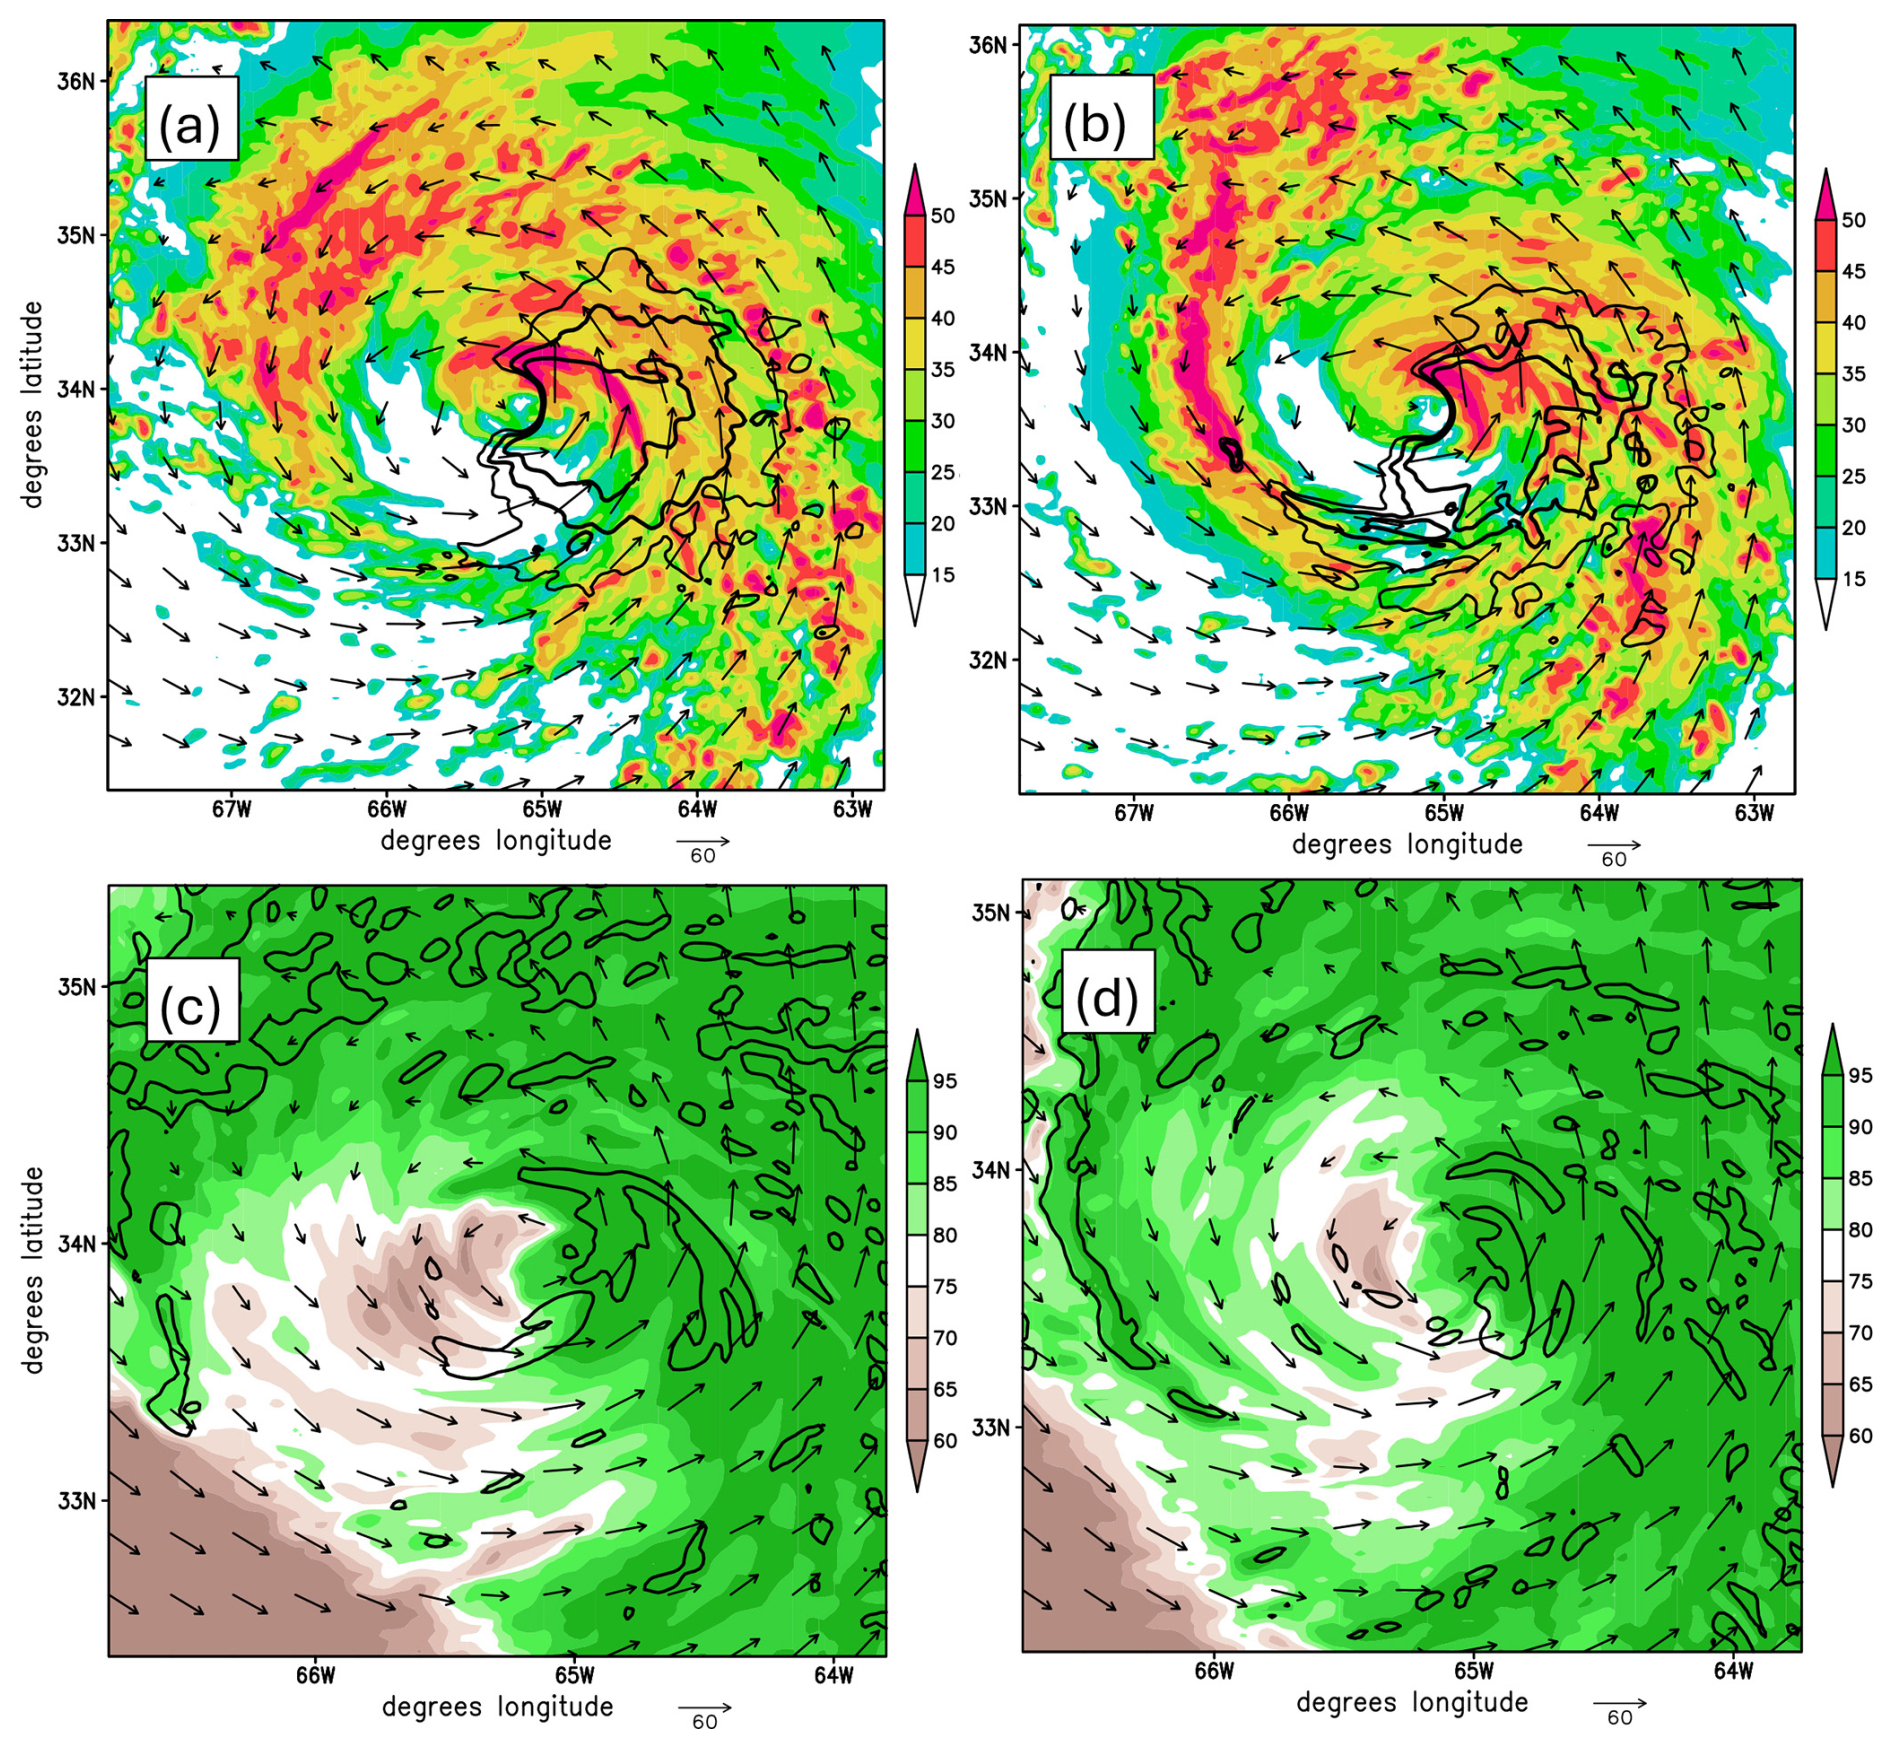
Revisiting these Control and ROMEX forecasts 36 h later at 12:00 UTC 23 September, we find more similar intensities, both in terms of their 900 hPa wind speed, which exceeds 60 m s−1 in the eastern quadrant (Fig. 14a and b), and in their ∼ 930 hPa PMIN (orange lines in Fig. 11a). Compared to the 12 h forecast, Fiona's inner-core reflectivity, horizontal wind (Fig. 14a, b), and updraft (Fig. 14c, d) structures are more asymmetric. Meanwhile, southwesterly 850–200 hPa VWS ahead of an upper-level trough moving off the northeastern US coast has strengthened from 11.0 to 12.9 m s−1 over the past 36 h, according to the NHC's Statistical Hurricane Intensity Prediction Scheme (SHIPS; DeMaria et al., 2005) analysis. Differential advection of TC eyewall vorticity with height caused by moderate-to-strong VWS creates a more favorable (unfavorable) environment for deep convection on the vortex's downshear (upshear) side (DeMaria, 1996; Jones, 1995; Chen et al., 2018), which could account for the asymmetries shown in Fig. 14. Broadly consistent with the Best Track, both the Control and ROMEX forecasts initialized at 12:00 UTC 21 September maintain Fiona's intensity in a quasi-steady state for the next 24 h, after which the storm weakens (Fig. 11a) while undergoing extratropical transition (Pasch et al., 2023). Although beyond the scope of this study, we speculate that Fiona's weakening resulted from a combination of cooling SSTs and the disruptive impacts of moderate-to-strong VWS on the vortex structure (Simpson and Riehl, 1958; Frank and Ritchie, 2001). Predominating influences from these larger-scale environmental conditions, which are not affected by DA in the HAFS-A nest (Sect. 2.2), would be consistent with the relatively small differences between the Control and ROMEX intensity forecasts during this later period of Fiona's lifecycle (Fig. 11).
This study evaluated the impacts of assimilating the ROMEX GNSS RO bending angle dataset on 84 HAFS-A regional model forecasts of four 2022 Atlantic hurricanes. The ROMEX dataset contains about 20 000 daily global commercial RO profiles from Spire and PlanetiQ, processed by EUMETSAT, as well as government-owned RO data. Spire provided the bulk of the ROMEX observations – about 16 750 per day globally, and their observation error standard deviation diagnosed from HAFS-A O−B and O−A statistics was found to be smaller than that of COSMIC-2 in most layers of the lower-to-middle troposphere. HAFS-A assimilated RO observations that passed QC checks within its ∼ 12° × 12° TC-following domain.
Compared to a Control experiment using only the government-owned RO dataset containing about 7000 daily global profiles, ROMEX assimilation yielded a modest ∼ 5 %–15 % relative skill improvement in PMIN absolute intensity forecast errors through t=36 h, with mixed results at longer lead times. Additionally, ROMEX assimilation nearly eliminated a ∼ 2–3 hPa PMIN over-intensification bias in medium-to-long range forecasts. While short-range Control forecasts had a ∼ 0.5 g kg−1 lower-tropospheric dry bias relative to aircraft reconnaissance mission dropsondes and ERA5, this dry bias was slightly stronger in ROMEX forecasts, consistent with the marginally weaker ROMEX-forecast storms. Notably, ROMEX assimilation reduced a large fraction of Control's persistent 10–20 hPa PMIN over-intensification bias in short-to-medium range forecasts of Hurricane Fiona (2022) initialized on 21 and 22 September, when the TC was approaching its peak intensity. ROMEX analyses were about 0.25–1 g kg−1 drier in the lower-to-middle tropospheric TC core region than those of Control during this period, which likely helped to reduce the vigor of inner-core convection modestly, as was shown for the Fiona forecasts initialized at 12:00 UTC on 21 September.
The assimilated ROMEX observations reduced Control's specific humidity RMSD measured against ERA5 by ∼ 1 %–5 % in the mid-to-upper troposphere and showed a similar temperature RMSD improvement in the upper troposphere. However, lower-tropospheric temperature RMSD was slightly degraded up to t=18 h. Additionally, ROMEX assimilation reduced the HAFS-A 750–950 hPa layer horizontal wind speed RMSD against dropsondes by ∼ 1–2 m s−1, demonstrating that the thermodynamic information provided by the additional RO observations can also improve HAFS-A forecast kinematic fields through cross-variate covariances in the DA system and/or dynamical adjustments during the cycled model advances. Assimilating the ROMEX data also yielded up to 5 % of relative skill improvement in medium-range forecast TC position forecasting, suggesting a slight improvement in the near-storm flow environment and vortex size. Track forecast impacts were likely limited because all HAFS-A experiments received the same larger-scale steering flow information supplied by the operational GFS to the outer domain's initial and lateral boundary conditions.
Two sensitivity experiments provided further insight. Control_noC2 (Control without COSMIC-2 data) showed that COSMIC-2 observations modestly improved track, short-range PMIN intensity, and lower- to mid-tropospheric water vapor forecasts, but had small and mixed impacts on temperature forecasts. The ROMEX_noLowlevRO experiment, which excluded all RO data below the 5 km impact height, assessed the value of assimilating lower-tropospheric RO data. Despite HAFS-A rejecting a large fraction of sub-5 km RO observations, those assimilated in ROMEX contributed to 50 % its PMIN relative skill improvement over Control in short-range forecasts. Although removal of the sub-5 km RO observations alleviated the modest ROMEX temperature and water vapor RMSD degradations against ERA5 found in the lower troposphere, it also largely eliminated ROMEX's water vapor RMSD improvements over a deeper layer between 800 and 400 hPa.
In conclusion, this study demonstrates that a 3.5-fold increase in the number of assimilated GNSS RO profiles with the addition of commercial Spire and PlanetiQ observations has an overall beneficial impact on HAFS-A track, PMIN, lower-tropospheric wind speed, and middle-to-upper-tropospheric temperature and water vapor forecasts for the four 2022 Atlantic TCs evaluated. However, the impacts of these assimilated commercial observations on HAFS-A PMIN intensity varied substantially across the 84-forecast sample, with the most notable improvement (a ≳ 50 % reduction in over-intensification bias) found in short- to medium-range Fiona forecasts initialized on 21–22 September. Also, we should note that the statistical forecast error analysis described in Sect. 4 was heavily influenced by the long-lived Earl and Fiona cases, which spent most of their time as hurricanes outside the tropics. Considering the marked decrease in COSMIC-2 profile density with latitude in the extratropics (Ho et al., 2020b), the incremental benefits of assimilating additional RO data may be proportionally greater for TCs moving outside the tropics, given the more uniform latitudinal distribution of sun-synchronous polar orbiting Spire and PlanetiQ satellites (Anthes et al., 2024). Future studies evaluating larger TC samples could test this hypothesis. Additionally, by showing Control_noC2's short-range intensity and medium-range track forecast degradations relative to Control, this study supports previous work showing positive impacts of COSMIC-2 assimilation on regional model TC forecasts (Miller et al., 2023; Teng et al., 2023) and the need to sustain COSMIC-2-like coverage over the tropics in future RO satellite missions.
For future work, HAFS forecast impact studies with a larger number of hurricane cases, particularly those weighted more towards the tropics, would provide a more definitive value assessment of commercial RO data. A major limitation of this study's OSEs is that HAFS-A, by design, assimilates data only within its inner moving nest, measuring impacts only within the TC vortex and near-storm environment. The HAFS-A outer domain's initial and lateral boundary conditions are downscaled from the operational GFS. When interpreting our results, it is also worth noting that RO bending angles are nonlocal observations that depend primarily on atmospheric fields along the tangent point-centered ∼ 200 km ray path, which is about of the HAFS-A inner nest width. Although HAFS-A's one-dimensional bending angle forward operator uses only the vertical column of background data above the tangent point, the analysis impacts of observations assimilated near the nest's lateral boundaries could be limited if the boundaries truncate the horizontal spread of observation information by the regional background error covariance matrix. Miller et al. (2023), for example, showed that COSMIC-2 bending angles assimilated in HWRF could adjust lower-to-middle tropospheric analysis water vapor fields 100 km away by over 0.3 g kg−1 (see their Fig. 10). Future studies should also evaluate HAFS sensitivity to RO data assimilated in the GFS to demonstrate impacts from profiles located further from the TCs that could affect larger-scale steering flows or water vapor fields advected into the inner nest. Additional improvements to the HAFS RO DA algorithm, such as in its QC screening criteria, observation error specification, and the implementation of nonlocal bending-angle forward operators, could further enhance the benefits of assimilating commercial RO data alongside the backbone government missions.
Large input and output datasets from the OSEs described in this study are stored on the NOAA Research and Development High-Performance Computing System (RDHPCS) High Performance Storage System (HPSS; https://docs.rdhpcs.noaa.gov/data/storage.html, last access: 12 July 2026). They include the HAFS-A gridded forecasts, operational GFS forecasts providing the outer domain's initial and boundary conditions, HAFS-GSI DA diagnostic files, and the ROMEX global dataset covering the four Atlantic TC forecasting periods. The latter consists of BUFR-file-formatted Level-2 commercial and government-mission GNSS RO bending-angle observations processed by EUMETSAT, except for COSMIC-2 data, which were processed by UCAR. Additionally, software used for generating the results presented in this study are stored on the University of Maryland Linux servers. These resources can be made available upon request, although restrictions apply to sharing and redistribution of the ROMEX RO dataset (https://irowg.org/ro-modeling-experiment-romex/, last access: 12 July 2026). Source code for the HAFS model (Hazelton et al., 2023) version used here is publicly available on Github at https://github.com/hafs-community/HAFS/tree/production/hafs.v2 (last access: 12 July 2026).
WM, YC, and SH designed the experiments, and WM carried them out. YC, SH, and XS coordinated with EUMETSAT in obtaining the commercial ROMEX dataset, and they performed an initial GNSS RO observation quality evaluation. WM developed codes to process and plot the HAFS-A model output. WM also prepared the manuscript with contributions from all co-authors.
The contact author has declared that none of the authors has any competing interests.
The scientific results and conclusions, as well as any views or opinions expressed herein, are those of the authors and do not necessarily reflect those of NOAA or the Department of Commerce.
Publisher's note: Copernicus Publications remains neutral with regard to jurisdictional claims made in the text, published maps, institutional affiliations, or any other geographical representation in this paper. The authors bear the ultimate responsibility for providing appropriate place names. Views expressed in the text are those of the authors and do not necessarily reflect the views of the publisher.
This article is part of the special issue “The Radio Occultation Modeling EXperiment (ROMEX): observational quality, processing, and numerical weather prediction (NWP) applications”. It is a result of the ROMEX-2 Workshop, Darmstadt, Germany, 25–27 February 2025.
The authors thank the four anonymous reviewers whose insightful comments led to improvement of this manuscript. GPS dropsonde data were provided by the NOAA Atlantic Oceanographic and Meteorological Laboratory Hurricane Research Division in Miami, FL (USA). HAFS-A experiments were run on NOAA's Hera supercomputer (https://www.noaa.gov/organization/information-technology/hera, last access: 13 July 2026). The authors also acknowledge the University of Maryland supercomputing resources (https://hpcc.umd.edu, last access: 13 July 2026) used for performing additional analysis reported in this paper.
This research has been supported by the National Oceanic and Atmospheric Administration (grant nos. NA19NES4320002 and NA24NESX432C0001, Cooperative Institute for Satellite Earth System Studies – CISESS) at the University of Maryland).
This paper was edited by Benjamin Ruston and reviewed by four anonymous referees.
Anthes, R. A., Sjoberg, J., Feng, X., and Syndergaard, S.: Comparison of COSMIC and COSMIC-2 radio occultation refractivity and bending angle uncertainties in August 2006 and 2021, Atmosphere, 13, 790, https://doi.org/10.3390/atmos13050790, 2022.
Anthes, R. A., Marquardt, C., Ruston, B., and Shao, H.: Radio Occultation Modeling Experiment (ROMEX): Determining the impact of radio occultation observations on numerical weather prediction, Bull. Amer. Meteor. Soc., 105, 1552–1568, https://doi.org/10.1175/BAMS-D-23-0326.1, 2024.
Blake, E. S.: Tropical cyclone report: Hurricane Earl (AL062022), National Hurricane Center, Tech. Rep., 18 pp., https://www.nhc.noaa.gov/data/tcr/AL062022_Earl.pdf (last access: 13 July 2026), 2023.
Bonavita, M.: On some aspects of the impact of GPSRO observations in global numerical weather prediction, Q. J. Roy. Meteor. Soc., 140, 2546–2562, https://doi.org/10.1002/qj.2320, 2014.
Bowler, N. E.: Revised GNSS-RO observation uncertainties in the Met Office NWP System, Q. J. Roy. Meteor. Soc., 146, 2274–2296, https://doi.org/10.1002/qj.3791, 2020.
Braun, S. A., Sippel, J. A., and Nolan, D. S.: The impact of dry midlevel air on hurricane intensity in idealized simulations with no mean flow, J. Atmos. Sci., 69, 236–257, https://doi.org/10.1175/JAS-D-10-05007.1, 2012.
Bucci, L., Alaka, L., Hagen, A., Delgado, S., and Beven, J.: Tropical cyclone report: Hurricane Ian (AL092022), National Hurricane Center, Tech. Rep., 72 pp., https://www.nhc.noaa.gov/data/tcr/AL092022_Ian.pdf (last access: 13 July 2026), 2023.
Cangialosi, J. P.: Tropical cyclone report: Hurricane Julia (AL132022), National Hurricane Center, Tech. Rep., 23 pp., https://www.nhc.noaa.gov/data/tcr/AL132022_EP182022_Julia.pdf (last access: 13 July 2026), 2023.
Chan, J. C. L. and Gray, W. M.: Tropical cyclone movement and surrounding flow relationships, Mon. Wea. Rev., 110, 1354–1374, https://doi.org/10.1175/1520-0493(1982)110<1354:TCMASF>2.0.CO;2, 1982.
Chavas, D. R., Knaff, J. A., and Klotzbach, P.: A simple model for predicting tropical cyclone minimum central pressure from intensity and size, Wea. Forecasting, 40, 333–346, https://doi.org/10.1175/WAF-D-24-0031.1, 2025.
Chen, S.-Y., Kuo, Y.-H., and Huang, C.-Y.: The impact of GPS RO data on predicting tropical cyclogenesis using a nonlocal observation operator: an initial assessment, Mon. Wea. Rev., 148, 2701–2717, https://doi.org/10.1175/MWR-D-19-0286.1, 2020.
Chen, X., Wang, Y., Fang, J., and Xue, M.: A numerical study on rapid intensification of Typhoon Vicente (2012) in the South China Sea. Part II: Roles of inner-core processes, J. Atmos. Sci., 75, 235–255, https://doi.org/10.1175/JAS-D-17-0129.1, 2018.
Christophersen, H., Sippel, J., Aksoy, A., and Baker, N. L.: Recent advancements for tropical cyclone data assimilation, Ann. NY Acad. Sci., 1517, 25–43, https://doi.org/10.1111/nyas.14873, 2022.
Cram, T. A., Persing, J., Montgomery, M. T., and Braun, S. A.: A Lagrangian trajectory view on transport and mixing processes between the eye, eyewall, and environment using a high-resolution simulation of Hurricane Bonnie (1998), J. Atmos. Sci., 64, 1835–1856, https://doi.org/10.1175/JAS3921.1, 2007.
Cucurull, L.: Implementation of a quality control for radio occultation observations in the presence of large gradients of atmospheric refractivity, Atmos. Meas. Tech., 8, 1275–1285, https://doi.org/10.5194/amt-8-1275-2015, 2015.
Cucurull, L. and Purser, R. J.: An improved one-dimensional bending angle forward operator for the assimilation of radio occultation profiles in the lower troposphere, Mon. Wea. Rev., 151, 1093–1108, https://doi.org/10.1175/MWR-D-22-0073.1, 2023.
Cucurull, L., Derber, J. C., and Purser, R. J.: A bending angle forward operator for global positioning system radio occultation measurements, J. Geophys. Res.-Atmos., 118, 14–28, https://doi.org/10.1029/2012JD017782, 2013.
DeMaria, M.: The effect of vertical shear on tropical cyclone intensity change, J. Atmos. Sci., 53, 2076–2088, https://doi.org/10.1175/1520-0469(1996)053<2076:TEOVSO>2.0.CO;2, 1996.
DeMaria, M., Mainelli, M., Shay, L. K., Knaff, J. A., and Kaplan, J.: Further improvements to the Statistical Hurricane Intensity Prediction Scheme (SHIPS), Wea. Forecasting, 20, 531–543, https://doi.org/10.1175/WAF862.1, 2005.
Desroziers, G., Berre, L., Chapnik, B., and Poli, P.: Diagnosis of observation, background and analysis-error statistics in observation space, Q. J. Roy. Meteor. Soc., 131, 3385–3396, https://doi.org/10.1256/qj.05.108, 2005.
Doyle, J. D., Reynolds, C. A., Amerault, C., and Moskaitis, J.: Adjoint sensitivity and predictability of tropical cyclogenesis, J. Atmos. Sci., 69, 3535–3557, https://doi.org/10.1175/JAS-D-12-0110.1, 2012.
Dutta, S., Vandenberghe, F., Shao, H., Zhang, H., and Doe, J.: Assessment of radio-occultation from multiple GNSS platforms: Operational and non-operational, JCSDA Quarterly, 62, 33–37, https://doi.org/10.25923/w2dh-ep66, 2019.
Frank, W. M. and Ritchie, E. A.: Effects of vertical wind shear on the intensity and structure of numerically simulated hurricanes, Mon. Wea. Rev., 129, 2249–2269, https://doi.org/10.1175/1520-0493(2001)129<2249:EOVWSO>2.0.CO;2, 2001.
Galarneau, T. J. Jr. and Davis, C. A.: Diagnosing forecast errors in tropical cyclone motion, Mon. Wea. Rev., 141, 405–430, https://doi.org/10.1175/MWR-D-12-00071.1, 2013.
Harnisch, F., Healy, S. B., Bauer, P., and English, S. J.: Scaling of GNSS radio occultation impact with observation number using an ensemble of data assimilations, Mon. Wea. Rev., 141, 4395–4413, https://doi.org/10.1175/MWR-D-13-00098.1, 2013.
Hazelton, A., Alaka Jr., G. J., Gramer, L., Ramstrom, W., Ditchek, S., Chen, X., Liu, B., Zhang, Z., Zhu, L., Wang, W., Thomas, B., Shin, J., Wang, C.-K., Kim, H.-S., Zhang, X., Metro, A., Marks, F., and Gopalakrishnan, S.: 2022 real-time hurricane forecasts from an experimental version of the Hurricane Analysis and Forecast System (HAFSV0.3S), Front. Earth Sci., 11, 1264969, https://doi.org/10.3389/feart.2023.1264969, 2023.
Healy, S. B., Eyre, J. R., Hamrud, M., and Thépaut, J.-N.: Assimilating GPS radio occultation measurements with two-dimensional bending angle observation operators, Q. J. Roy. Meteor. Soc., 133, 1213–1227, https://doi.org/10.1002/qj.63, 2007.
Ho, S.-P., Anthes, R. A., Ao, C. O., Healy, S., Horanyi, A., Hunt, D., Mannucci, A. J., Pedatella, N., Randel, W. J., Simmons, A., Steiner, A., Xie, F., Yue, X., and Zeng, Z.: The COSMIC/FORMOSAT-3 radio occultation mission after 12 years: Accomplishments, remaining challenges, and potential impacts of COSMIC-2, Bull. Amer. Meteor. Soc., 101, E1107–E1136, https://doi.org/10.1175/bams-d-18-0290.1, 2020a.
Ho, S.-P., Zhou, X., Shao, X., Zhang, B., Adhikari, L., Kireev, S., He, Y., Yoe, J. G., Xia-Serafino, W., and Lynch, E.: Initial Assessment of the COSMIC-2/FORMOSAT-7 Neutral Atmosphere Data Quality in NESDIS/STAR using in-situ and satellite data, Remote Sens., 12, 4099, https://doi.org/10.3390/rs12244099, 2020b.
Jarvinen, B. R., Neumann, C. J., and Davis, M. A. S.: A tropical cyclone data tape for the North Atlantic basin, 1886–1983: Contents, limitations, and uses, NOAA Tech. Memo. NWS NHC 22, 21 pp., https://www.nhc.noaa.gov/pdf/NWS-NHC-1988-22.pdf (last access: 13 July 2026), 1984.
Jones, S. C.: The evolution of vortices in vertical shear. I: Initially barotropic vortices, Q. J. Roy. Meteor. Soc., 121, 821–851, https://doi.org/10.1002/qj.49712152406, 1995.
Kaplan, J. and DeMaria, M.: Large-scale characteristics of rapidly intensifying tropical cyclones in the North Atlantic basin, Wea. Forecasting, 18, 1093–1108, https://doi.org/10.1175/1520-0434(2003)018<1093:LCORIT>2.0.CO;2, 2003.
Kuo, Y. H., Wee, T. K., Sokolovskiy, S., Rocken, C., Schreiner, W., Hunt, D., and Anthes, R. A.: Inversion and error estimation of GPS radio occultation data, J. Meteorol. Soc. Jpn., 82, 507–531, https://doi.org/10.2151/jmsj.2004.507, 2004.
Kursinski, E. R., Hajj, G. A., Schofield, J. T., Linfield, R. P., and Hardy, K. R.: Observing Earth's atmosphere with radio occultation measurements using the Global Positioning System, J. Geophys. Res., 102, 23429–23465, https://doi.org/10.1029/97JD01569, 1997.
Lien, G.-Y., Lin, C.-H., Huang, Z.-M., Teng, W.-H., Chen, J.-H., Lin, C.-C., Ho, H.-H., Huang, J.-Y., Hong, J.-S., Cheng, C.-P., and Huang, C.-Y.: Assimilation impact of early FORMOSAT-7/COSMIC-2 GNSS radio occultation data with Taiwan's CWB Global Forecast System, Mon. Wea. Rev., 149, 2171–2191, https://doi.org/10.1175/MWR-D-20-0267.1, 2021.
Liu, H., Anderson, J., and Kuo, Y.-H.: Improved analyses and forecasts of Hurricane Ernesto's genesis using radio occultation data in an ensemble filter assimilation system, Mon. Wea. Rev., 140, 151–166, https://doi.org/10.1175/MWR-D-11-00024.1, 2012.
Liu, Q., Zhang, X., Tong, M., Zhang, Z., Liu, B., Wang, W., Zhu, L., Zhang, B., Xu, X., Trahan, S., Bernardet, L., Mehra, A., and Tallapragada, V.: Vortex initialization in the NCEP operational hurricane models, Atmosphere, 11, 968, https://doi.org/10.3390/atmos11090968, 2020.
Lonitz, K., Marquardt, C., Bowler, N., and Healy, S.: Final Technical Note of “Impact assessment of commercial GNSS-RO data”, ESA Contract Report No. 4000131086/20/NL/FF/a, https://www.ecmwf.int/sites/default/files/elibrary/2021/20240-final-technical-note-impact-assessment-commercial-gnss-ro-data_2.pdf (last access: 13 July 2026), 2021.
Miller, W. J., Chen, Y., Ho, S.-P., and Shao, X.: Evaluating the impacts of COSMIC-2 GNSS RO bending angle assimilation on Atlantic hurricane forecasts using the HWRF Model, Mon. Wea. Rev., 151, 1821–1847, https://doi.org/10.1175/mwr-d-22-0198.1, 2023.
Miller, W. J., Chen, Y., Ho, S.-P., and Shao, X.: Exploring the Value of Spire GNSS Radio Occultation bending angle assimilation for improving HWRF model forecasts of Atlantic hurricane intensity, Wea. Forecasting, 40, 809–827, https://doi.org/10.1175/WAF-D-24-0092.1, 2025.
Molinari, J., Frank, J., and Vollaro, D.: Convective bursts, downdraft cooling, and boundary layer recovery in a sheared tropical storm, Mon. Wea. Rev., 141, 1048–1060, https://doi.org/10.1175/MWR-D-12-00135.1, 2013.
Montgomery, M. T. and Smith, R. K.: Paradigms for tropical cyclone intensification, Aust. Meteor. Oceanogr. J., 64, 37–66, https://doi.org/10.22499/2.6401.005, 2014.
Nolan, D. S.: What is the trigger for tropical cyclogenesis?, Aust. Meteor. Mag., 56, 241–266, https://doi.org/10.1071/es06025, 2007.
Pasch, R. J., Reinhart, B. J., and Alaka, L.: Tropical cyclone report: Hurricane Fiona (AL072022), National Hurricane Center Tech. Rep., 60 pp., https://www.nhc.noaa.gov/data/tcr/AL072022_Fiona.pdf (last access: 13 July 2026), 2023.
Poli, P., Healy, S. B., and Dee, D. P.: Assimilation of Global Positioning System radio occultation data in the ECMWF ERA-Interim reanalysis, Q. J. Roy. Meteor. Soc., 136, 1972–1990, https://doi.org/10.1002/qj.722, 2010.
Rotunno, R. and Emanuel, K. A.: An Air–Sea Interaction Theory for Tropical Cyclones. Part II: Evolutionary Study Using a Nonhydrostatic Axisymmetric Numerical Model, J. Atmos. Sci., 44, 542–561, https://doi.org/10.1175/1520-0469(1987)044<0542:AAITFT>2.0.CO;2, 1987.
Schreiner, W. S., Weiss, J.-P., Anthes, R. A., Braun, J., Chu, V., Fong, J., Hunt, D., Kuo, Y.-H., Meehan, T., Serafino, W., Sjoberg, J., Sokolovskiy, S., Talbot, E., Wee, T. K., and Zeng, Z.: COSMIC-2 radio occultation constellation: First results, Geophys. Res. Lett., 47, e2019GL086841, https://doi.org/10.1029/2019GL086841, 2020.
Simpson, R. H. and Riehl, H.: Mid-tropospheric ventilation as a constraint on hurricane development and maintenance, Proc. Tech. Conf. on Hurricanes, Miami, FL, Amer. Meteor. Soc., D4.1–D4.10, 1958.
Teng, H.-F., Kuo, Y.-H., and Done, J. M.: Importance of midlevel moisture for tropical cyclone formation in easterly and monsoon environments over the western North Pacific, Mon. Wea. Rev., 149, 2449–2469, https://doi.org/10.1175/MWR-D-20-0313.1, 2021.
Teng, H.-F., Kuo, Y.-H., and Done, J. M.: Potential impacts of radio occultation data assimilation on forecast skill of tropical cyclone formation in the Western North Pacific, Geophys. Res. Lett., 50, 1–10, https://doi.org/10.1029/2021GL096750, 2023.
Trahan, S. and Sparling, L.: An analysis of NCEP tropical cyclone vitals and potential effects on forecasting models, Wea. Forecasting, 27, 744–756, https://doi.org/10.1175/WAF-D-11-00063.1, 2012.
Wang, X., Parrish, D., Kleist, D., and Whitaker, J.: GSI 3DVar-based ensemble-variational hybrid data assimilation for NCEP Global Forecast System: Single-resolution experiments, Mon. Wea. Rev., 141, 4098–4117, https://doi.org/10.1175/MWR-D-12-00141.1, 2013.
Zhang, D.-L., Liu, Y., and Yau, M. K.: A multiscale numerical study of Hurricane Andrew (1992). Part IV: Unbalanced flows, Mon. Wea. Rev., 129, 92–107, https://doi.org/10.1175/1520-0493(2001)129<0092:AMNSOH>2.0.CO;2, 2001.
- Abstract
- Introduction
- Datasets and Methods
- GNSS RO Data Assimilation Statistics
- HAFS-A Forecast Verification Statistics
- ROMEX Observation Impacts on the Structure and Intensity of Hurricane Fiona (2022)
- Summary and Conclusions
- Code and data availability
- Author contributions
- Competing interests
- Disclaimer
- Special issue statement
- Acknowledgements
- Financial support
- Review statement
- References
- Abstract
- Introduction
- Datasets and Methods
- GNSS RO Data Assimilation Statistics
- HAFS-A Forecast Verification Statistics
- ROMEX Observation Impacts on the Structure and Intensity of Hurricane Fiona (2022)
- Summary and Conclusions
- Code and data availability
- Author contributions
- Competing interests
- Disclaimer
- Special issue statement
- Acknowledgements
- Financial support
- Review statement
- References