the Creative Commons Attribution 4.0 License.
the Creative Commons Attribution 4.0 License.
 | 07 Dec 2020
Improvement of numerical weather prediction model analysis during fog conditions through the assimilation of ground-based microwave radiometer observations: a 1D-Var study
Pauline Martinet
Domenico Cimini
Frédéric Burnet
Benjamin Ménétrier
Yann Michel
Vinciane Unger
This paper investigates the potential benefit of ground-based microwave radiometers (MWRs) to improve the initial state (analysis) of current numerical weather prediction (NWP) systems during fog conditions. To this end, temperature, humidity and liquid water path (LWP) retrievals have been performed by directly assimilating brightness temperatures using a one-dimensional variational technique (1D-Var). This study focuses on a fog-dedicated field-experiment performed over winter 2016–2017 in France. In situ measurements from a 120 m tower and radiosoundings are used to assess the improvement brought by the 1D-Var analysis to the background. A sensitivity study demonstrates the importance of the cross-correlations between temperature and specific humidity in the background-error-covariance matrix as well as the bias correction applied on MWR raw measurements. With the optimal 1D-Var configuration, root-mean-square errors smaller than 1.5 K (respectively 0.8 K) for temperature and 1 g kg−1 (respectively 0.5 g kg−1) for humidity are obtained up to 6 km altitude (respectively within the fog layer up to 250 m). A thin radiative fog case study has shown that the assimilation of MWR observations was able to correct large temperature errors of the AROME (Application of Research to Operations at MEsoscale) model as well as vertical and temporal errors observed in the fog life cycle. A statistical evaluation through the whole period has demonstrated that the largest impact when assimilating MWR observations is obtained on the temperature and LWP fields, while it is neutral to slightly positive for the specific humidity. Most of the temperature improvement is observed during false alarms when the AROME forecasts tend to significantly overestimate the temperature cooling. During missed fog profiles, 1D-Var analyses were found to increase the atmospheric stability within the first 100 m above the surface compared to the initial background profile. Concerning the LWP, the RMSE with respect to MWR statistical regressions is decreased from 101 g m−2 in the background to 27 g m−2 in the 1D-Var analysis. These encouraging results led to the deployment of eight MWRs during the international SOFOG3D (SOuth FOGs 3D experiment for fog processes study) experiment conducted by Météo-France.
- Article
(5966 KB) - Full-text XML
- BibTeX
- EndNote


Each year large human and economical losses are due to fog episodes, which, by the large reduction of visibility, affect air, marine, and land transportation (Gultepe et al., 2007). Fog forecasts remain quite inaccurate due to the complexity, non-linearities and fine scale of the physical processes taking part in the fog life cycle. Fog results from a combination of radiative, turbulent and microphysical processes as well as interactions with surface heterogeneities which will drive the relative importance of local and large-scale circulations. Recently, three-dimensional models have replaced one-dimensional models to forecast fog in most national weather services. Currently, convective-scale numerical weather prediction (NWP) models run with a horizontal resolution of approximately 1 km with frequent data assimilation cycles. While the importance of vertical resolution (Philip et al., 2016), aerosol activation (Mazoyer et al., 2019) or water deposition (Tav et al., 2018) have recently been highlighted to improve fog forecasts, fog is also known to be highly sensitive to initial conditions (Bergot and Guedalia, 1994; Bergot et al., 2005; Hu et al., 2014). Therefore, accurate initial temperature, humidity and wind profiles are crucial to successfully forecast fog. However, the atmospheric boundary layer (ABL) has also been identified as a part of the atmosphere which is undersampled by observations. Even though satellite data enable global coverage all over the world, they provide limited information on the ABL due to the attenuation by clouds and degraded vertical resolution in the ABL. Additionally, uncertainties in surface properties (such as skin temperature and emissivity) limit the assimilation of surface-sensitive channels over land (Guedj et al., 2011). Recently, an observing system simulation experiment (OSSE) by Hu et al. (2017) has demonstrated that temperature and moisture at the surface have a larger impact on fog forecast than surface wind observations, concluding that temperature and humidity profilers could potentially play a major role in the improvement of fog forecast initialization. Ground-based microwave radiometers (MWRs) are robust instruments providing continuous observations of temperature and humidity profiles as well as integrated liquid and water contents during all-sky weather conditions. Even if their vertical resolution degrades with altitude (Cimini et al., 2006), most of their information content resides in the ABL (Löhnert and Maier, 2012) and their high temporal resolution (few minutes) makes them suitable to monitor the evolution of fog. Despite the potential impact of MWRs in NWP models, assimilation experiments of their data have been limited to a few attempts. The first preliminary study of Vandenberghe and Ware (2002) has demonstrated a positive impact of the assimilation of a single MWR unit into the 10 km horizontal resolution MM5 (https://www2.mmm.ucar.edu/mm5/, last access: 17 November 2020) mesoscale model in the context of a winter fog event. The impact of a simulated network of 140 MWRs through an OSSE was also investigated by Otkin et al. (2011) and Hartung et al. (2011) on a winter storm case. This study confirmed a positive impact on temperature and humidity analyses as well as up to 12 h forecasts on moisture flux. More recently, a real network of 13 MWRs was assimilated by Caumont et al. (2016) into the 2.5 km horizontal resolution convective-scale model AROME in the context of heavy-precipitation events in the western Mediterranean. The impact of this network was found to be neutral on temperature and humidity fields but positive on quantitative precipitation forecasts up to 18 h. In addition, Martinet et al. (2015, 2017) have demonstrated the positive impact that could be expected on NWP temperature profile analyses by the direct assimilation of MWR brightness temperatures into the AROME model with a one-dimensional variational framework (1D-Var). All these studies showed an encouraging positive impact of the assimilation of MWR observations into NWP, though they are limited to single deep-convection case studies on low-resolution limited-area models or restricted to temperature analyses only. The purpose of this article is to evaluate the expected benefit of MWRs on kilometre-scale NWP analyses during fog events on an extended dataset over a 6-month fog experiment. This expands the studies by Martinet et al. (2015, 2017) to humidity and liquid water path retrievals and evaluates the impact of new tools developed to optimize the assimilation of MWRs during COST Actions TOPROF (Illingworth et al., 2019) and PROBE (Cimini et al., 2020). A fog-dedicated field experiment was carried out in the north-east of France during the winter 2016–2017 during which a 14-channel MWR has been operated. The impact of MWR brightness temperatures on temperature, humidity and liquid water content profiles forecast by AROME has been evaluated during the 6-month period against in situ data collected during intensive observation periods (IOPs) and continuous measurements deployed on a 120 m instrumented tower. This paper begins with an overview of the dataset and the AROME model and a description of the 1D-Var settings in Sect. 2. A sensitivity study of the 1D-Var retrievals to the background-error-covariance matrix and bias correction to select the optimal configuration is presented in Sect. 3. Section 4 presents a case study of the first IOP showing large AROME errors during a thin radiative fog event that are corrected when using the 1D-Var retrieval. Section 5 generalizes the results obtained in Sect. 4 through a statistical evaluation of 1D-Var retrieval errors and expected impact on the AROME analyses. Section 6 presents the deployment of a regional-scale MWR network for fog forecast improvement as continuity of this study, while finally Sect. 7 summarizes the main conclusions.
2.1 Instrumentation
Data sampled during a field experiment dedicated to fog process studies carried out at the ANDRA (the French national radioactive waste management agency) atmospheric platform located in Houdelaincourt (48.5623∘ N, 5.5055∘ E) in the north-east of France during the winter 2016–2017 are used in this study. The experimental site was chosen due to the high occurrence of fog and the possibility to take advantage of a 120 m instrumented tower. A large range of in situ instrumentation was deployed during the 6-month experiment: visibility sensors, liquid water content and droplet size distribution measurements, and temperature and relative humidity measurements at different levels above ground (10, 50, 120 m). In addition to in situ measurements, a 14-channel HATPRO MWR (Rose et al., 2005) manufactured by Radiometer Physics GmbH (RPG) was deployed on site during the experiment. The HATPRO MWR is a passive instrument measuring the naturally emitted downwelling radiance in two spectral ranges: 22.24 to 31 GHz to retrieve humidity profiles with a low resolution but highly accurate integrated water vapour (IWV) content and liquid water path (LWP) and 51 to 58 GHz range, located in the 60 GHz O2 absorption complex line, to retrieve temperature profiles. Elevation scans from 5.4 to 90∘ were used to improve the vertical resolution of temperature profiles, assuming that horizontal homogeneity in the vicinity of the instrument is respected. A ceilometer (Vaisala CL31) was deployed during October to December 2016 and replaced by a Vaisala CT25K from January to April 2017 to determine the cloud base altitude. In addition, 21 Vaisala RS92 radiosondes with an expected accuracy of 0.5 K in temperature and 5 % in relative humidity were launched during IOPs. Tethered balloon measurements were also carried out with the deployment of a cloud particle probe and a turbulence probe.
2.2 The AROME NWP model
In this study 1 h forecasts from the French convective-scale model AROME (Application of Research to Operations at MEsoscale; Seity et al., 2011) are used as a priori profiles or “backgrounds”. AROME is a limited-area model covering western Europe with non-hydrostatic dynamical core. Since beginning in 2015, the horizontal resolution of AROME has been increased from 2.5 to 1.3 km as well as the number of vertical levels from 60 to 90 (Brousseau et al., 2016). Vertical levels follow the terrain in the lowest layers and isobars in the upper atmosphere. The detailed physics of AROME are inherited from the research Meso-NH model (Lafore et al., 1997). Deep convection is assumed to be resolved explicitly, but shallow convection is parameterized following Pergaud et al. (2009). A bulk one-moment microphysical scheme (Pinty and Jabouille, 1998) governs the equations of the specific contents of six water species (humidity, cloud liquid water, precipitating liquid water, pristine ice, snow and graupel). This new version also performs 3D-Var analyses every hour instead of every 3 h to optimize the use of frequent observations. All conventional observations are assimilated together with wind profilers, winds from space-borne measurements (Atmospheric Motion Vectors and scatterometers), Doppler winds (Montmerle and Faccani, 2009) and reflectivity (Wattrelot et al., 2014) from ground-based weather radars, satellite radiances and ground-based GPS measurements (Mahfouf et al., 2015).
2.3 1D-Var framework
To retrieve temperature and humidity profiles and evaluate the impact on AROME analyses, a 1D-Var framework similar to the one described in Martinet et al. (2017) is used. Based on the optimal estimation theory by Rodgers (2000), MWR observations are optimally combined with an a priori estimation of the atmospheric state which, in this study, refers to 1 h AROME forecasts. To this end, the two sources of information are weighted by their corresponding uncertainty that is called the background-error-covariance matrix (B) for the a priori profile and the observation-error-covariance matrix (R) for the observation to find the optimal state. In order to find the optimal state minimizing the distance to the observation, a radiative transfer model is needed to compute the equivalent observation from the a priori data. The method iteratively modifies the state vector x from the a priori xb to minimize the following cost function:
where H represents the observation operator (radiative transfer model and interpolations from model space to observation space), symbol “T” represents the transpose operator and “−1” the inverse operator. The observation-error-covariance matrix R should take into account representativeness and forward model errors as well as radiometric noise. Throughout the article, the atmospheric state minimizing the cost function is called the “analysis” (xa), “increment” refers to the difference between the a priori xb and the analysis, and “innovation” refers to the difference between the observation and the a priori xb.
For the first time, the fast radiative transfer model RTTOV-gb (De Angelis et al., 2016; Cimini et al., 2019), developed specifically to simulate MWR observations for operational applications during the Cost Action TOPROF, is used within the 1D-Var package maintained by the NWP Satellite Application Facility (NWPSAF; https://www.nwpsaf.eu/site/software/1d-var/, last access: 17 November 2020). To this end, the 1D-Var has been adapted to the ground-based sensing configuration of MWRs and interfaced with RTTOV-gb. In this study the control vector x consists of temperature and the natural logarithm of specific humidity on the same 90 levels as defined in AROME. These levels cover the atmospheric range from the ground up to 30 km, with the vertical resolution decreasing with altitude: 20–100 m below 1 km, 100–200 m from 1 to 5 km and around 400 m at 10 km. In addition to temperature and humidity, the liquid water path is also included in the control vector. Following the current implementation of the NWPSAF 1D-Var, no correlation between the LWP and the other variables is assumed in the B matrix. The observation vector y consists of brightness temperatures (BT) in all K-band1 and V-band channels2 at zenith and only opaque channels (above 54 GHz) at low elevation angles: 42, 30, 19.2, 10.2 and 5.4∘. Transparent channels are not used at low elevation angles due to the violation of the assumption of horizontal homogeneity.
3.1 Background errors
In variational data assimilation (either 1D-Var or 3D/4D-Var), the accuracy of the analysis will depend on the background-error-covariance matrix B. This matrix specifies how much weight is given to the a priori profile compared to the observation, specifies how the information from the localized observation is spread in the model space both vertically and horizontally (for 3D/4D-Var assimilation), and imposes the balance between the model control variables. However, due to difficulties in measuring the “true” state, this B matrix has to be modelled. Currently, climatological, spatially homogeneous and isotropic background-error covariances are used operationally in the AROME model (Brousseau et al., 2011). They are computed from 3 h range forecast differences from an ensemble data assimilation over long time periods and the whole model domain. As demonstrated by Ménétrier and Montmerle (2011), climatological covariances are inadequate for fog areas which exhibit a much stronger positive coupling between temperature and humidity and attenuated vertical correlations above the fog layer. For this study, a similar approach as the one described in Ménétrier and Montmerle (2011) has thus been used to infer background-error covariances adapted to fog layers and to the AROME configuration and the time period of the experiment. To this end, the AROME ensemble data assimilation (AROME EDA) schemes that mimic in a variational context the approach taken in the stochastic ensemble Kalman filter (Evensen, 2003) has been used. The EDA explicitly perturbs the observations, the model and the boundary conditions and gives in return estimates of analysis and background-error covariance (Fisher, 2003; Zagar et al., 2005). The AROME EDA consists of running an ensemble of 3D-Var analyses in parallel, where the observations are perturbed according to their prescribed error statistics. The model perturbations are represented by an online multiplicative inflation scheme (Raynaud and Bouttier, 2015). The inflation factor is derived from the skill over spread ratio. The perturbed boundary conditions are taken from the global EDA (Raynaud et al., 2011). The EDA configuration used for this study corresponds to the operational implementation since July 2018 with a horizontal resolution set to 3.2 km and an ensemble size of 25 members.
Firstly, using this AROME EDA, a so-called “climatological” B was obtained by computing the forecast differences, , between members k and l for all grid points of the whole AROME domain and all assimilation cycles on the 28 October 2016 (IOP1). A specific fog B matrix was then computed by applying a fog mask in order to only select grid points for which most of the EDA members forecast fog. According to the discussion on the fog-model predictor used in Ménétrier and Montmerle (2011), the fog mask was based on the presence of liquid water contents above 10−6 kg kg−1 in the first three layers of the model. Several fog B matrices have been computed using different assimilation cycles. The fog B matrix showing the best results in terms of root-mean-square errors (RMSEs) with respect to radiosoundings has then been selected for this study. Similarly to Brousseau et al. (2016), background-error standard deviations are multiplied by a factor α<1 in order to take into account the forecast error reduction while the background range decreases from 3 to 1 h (as the AROME EDA provides 3 h forecasts, whereas the 1D-Var deals with 1 h forecasts). Based on comparison with in situ measurements, an optimal value of α=0.7 was found. This multiplicative factor is only applied on background-error standard deviations, while cross-correlations are assumed to be the same at the 1 and 3 h forecast ranges. Figure 1 compares background-error standard deviations for temperature and the natural logarithm of specific humidity computed for the climatological and fog B matrices. Similar shape and magnitude are observed between the two B matrices for the natural logarithm of specific humidity. However, in the case of temperature, background errors in fog areas are found to be larger within the first 500 m with a maximum of 0.7 K at 250 m. On the other hand, the climatological B matrix shows values below 0.5 K within the whole fog layer. Figure 2 shows the cross-correlations between specific humidity and temperature. Similarly to Ménétrier and Montmerle (2011), a strong positive coupling appears in the fog layer within the first 200 m. This coupling implies that a positive temperature error will be translated into a positive specific-humidity error (and vice versa) due to saturated conditions. This structure significantly differs from the one observed in climatological conditions with almost no coupling between the two variables in the boundary layer. The fog layer is also uncoupled with atmospheric layers above the fog top which exhibit a negative coupling between temperature and humidity.
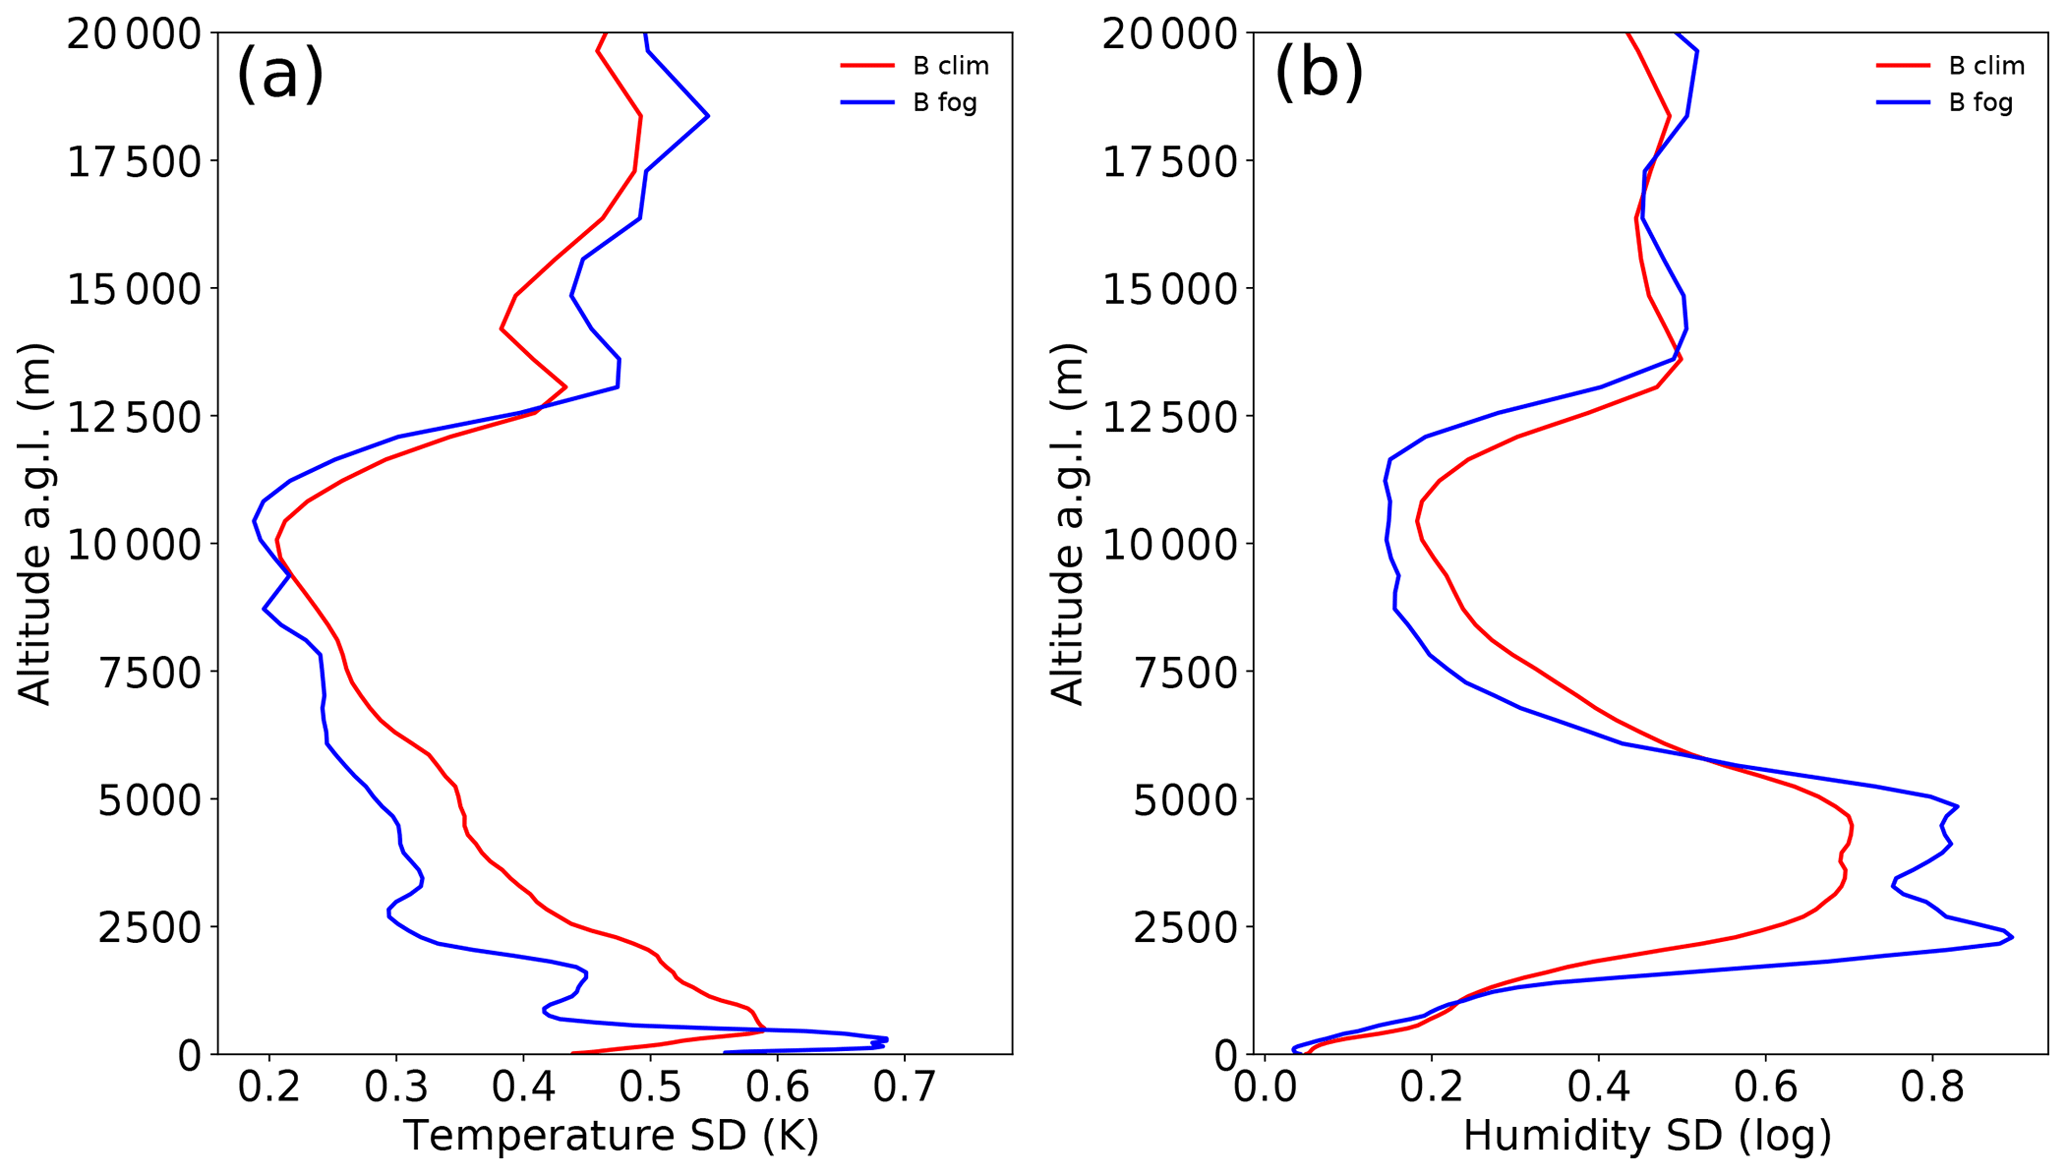
Figure 1Background error standard deviations for temperature (a) and the natural logarithm of specific humidity (b) for a climatological B matrix (red line) or a specific fog B matrix (blue line).
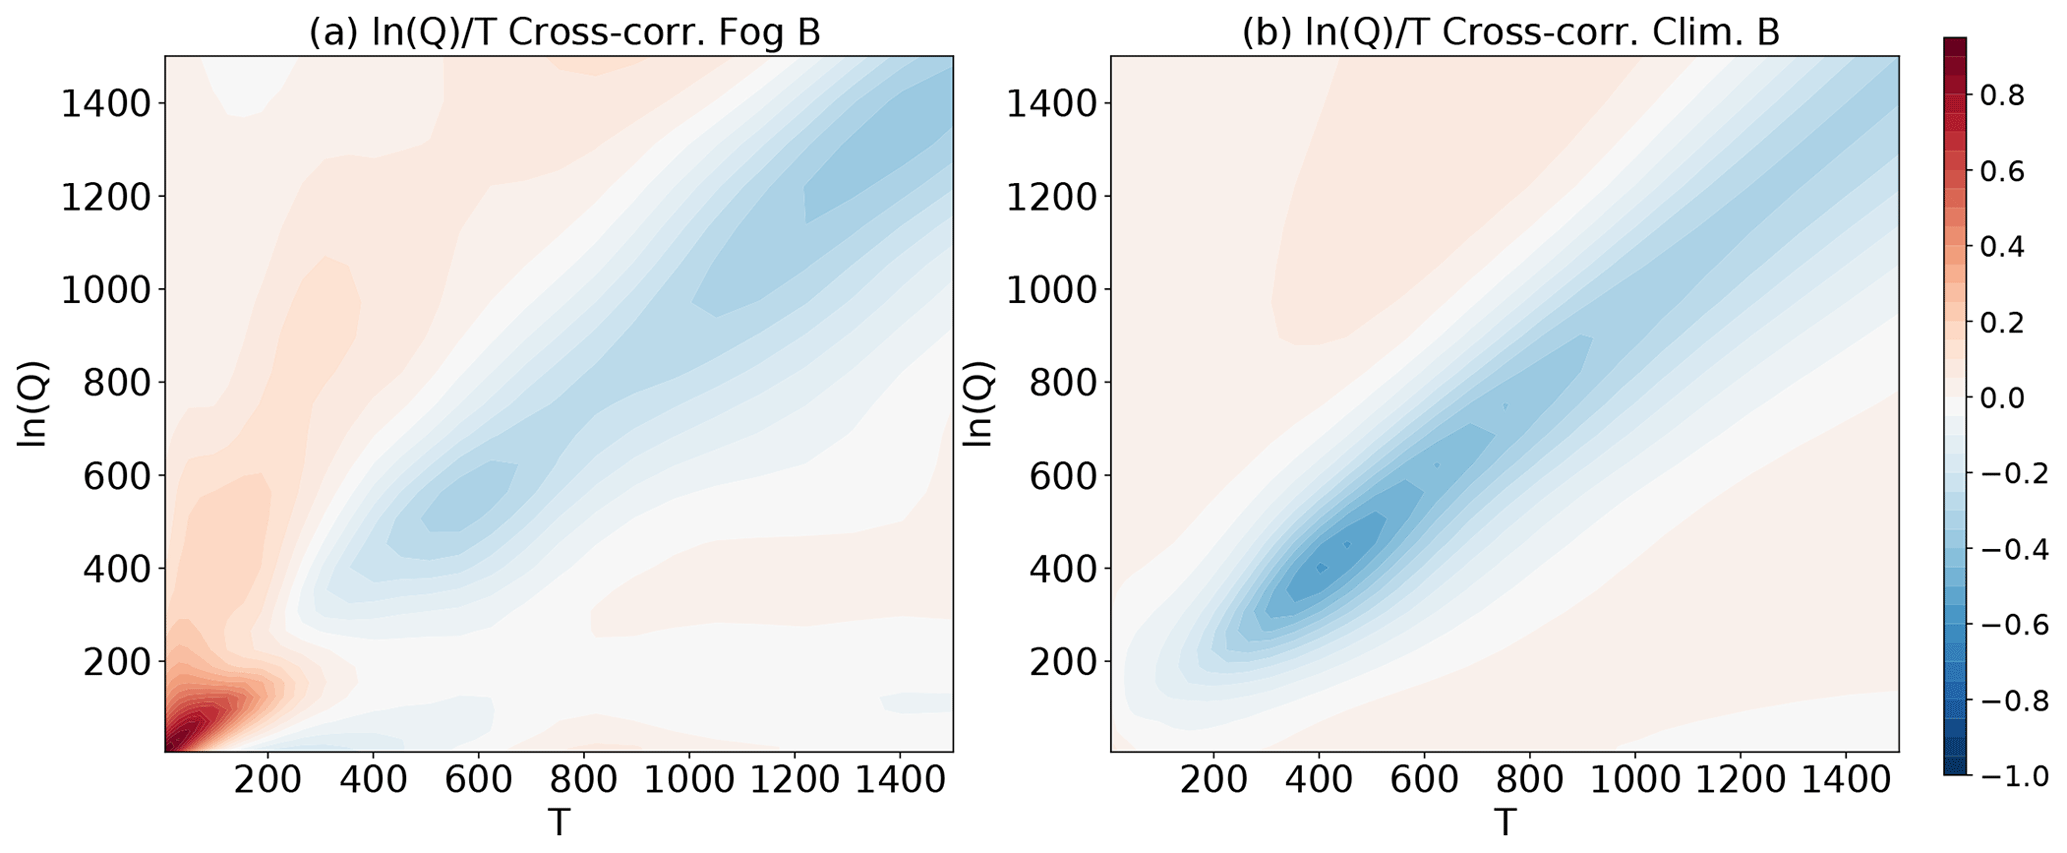
Figure 2Cross-correlations between the natural logarithm of specific humidity (y axis) and temperature (x axis) for a fog B matrix (a) or a climatological B matrix (b). The x axis and y axis are labelled according to altitude above ground in metres.
3.2 Optimal configuration of 1D-Var retrievals
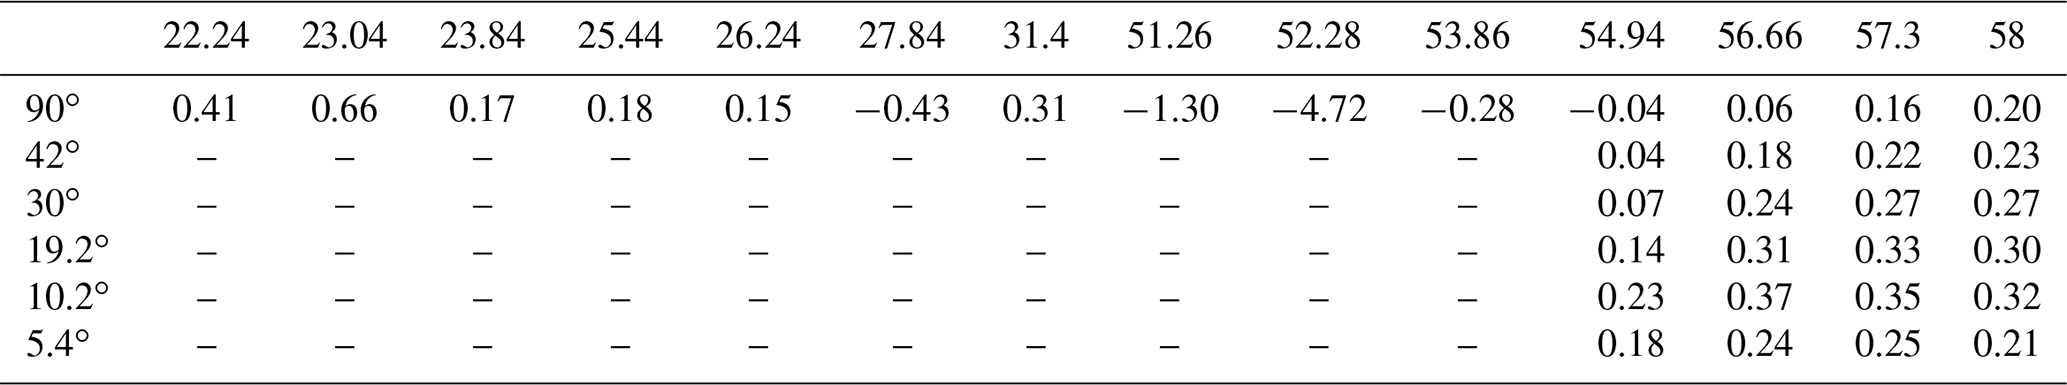
The accuracy of 1D-Var retrievals depends not only on the background-error-covariance matrix but also on an adequate specification of the observation-error-covariance matrix. Observation errors are assumed to follow Gaussian distributions with zero mean. A similar method as described in Martinet et al. (2015), De Angelis et al. (2017) and Cimini et al. (2020) has been used to implement a bias correction of BT measurements based on 6-month differences between MWR observations and BTs simulated from AROME 1 h forecasts with the use of RTTOV-gb (so-called “O-B monitoring”). Table 1 reports the biases obtained for each channel at 90∘ and the most opaque channels at low elevation angles. The values are consistent with those reported in De Angelis et al. (2017). A static bias correction of all channels based on Table 1 has been applied to the measurements.
Table 1Bias of the observation minus background departures computed from AROME forecasts for all frequencies at 90∘ elevation angle and only the most opaque channels (54.94 to 58 GHz) at lower elevation angles.
Observation errors due to liquid nitrogen calibration and spectroscopic errors in radiative transfer models were updated according to recent studies from Maschwitz et al. (2013) and Cimini et al. (2018). Therefore, in addition to commonly used values of instrumental noise (0.5 K for transparent channels and 0.2 K for the most opaque channels), the individual errors defined by Maschwitz et al. (2013) and Cimini et al. (2018) were added in quadrature:
with σtot the total observation errors, σnoise the uncertainty due to noise, σcalib calibration uncertainties and σFM the uncertainty due to spectroscopic errors in the radiative transfer model. It is important to note that calibration errors of modern MWRs are lower than the ones used in this study due to new developments in the manufacturer software and liquid nitrogen target used for the radiometer calibration. Table 2 summarizes the total observation uncertainty for each channel.
Table 2Observation uncertainties (K) prescribed in the observation-error-covariance matrix for each channel.

In order to define the best configuration of 1D-Var retrievals in terms of background-error-covariance matrix and bias correction, statistics have been performed over the 6-month period by comparison with the 120 m tower measurements. For each altitude instrumented with a weather station (50 and 120 m altitude) and each variable (temperature and specific humidity), the error reduction brought by the analysis over the background is defined as
with RMSExa the root-mean-square errors of the 1D-Var retrieved profiles with respect to the mast measurements and RMSExb the root-mean-square errors of the background profiles with respect to the mast measurements. It is important to note that, given the relative low vertical resolution of MWR retrievals, the retrievals at 50 and 120 m are likely to be highly correlated.
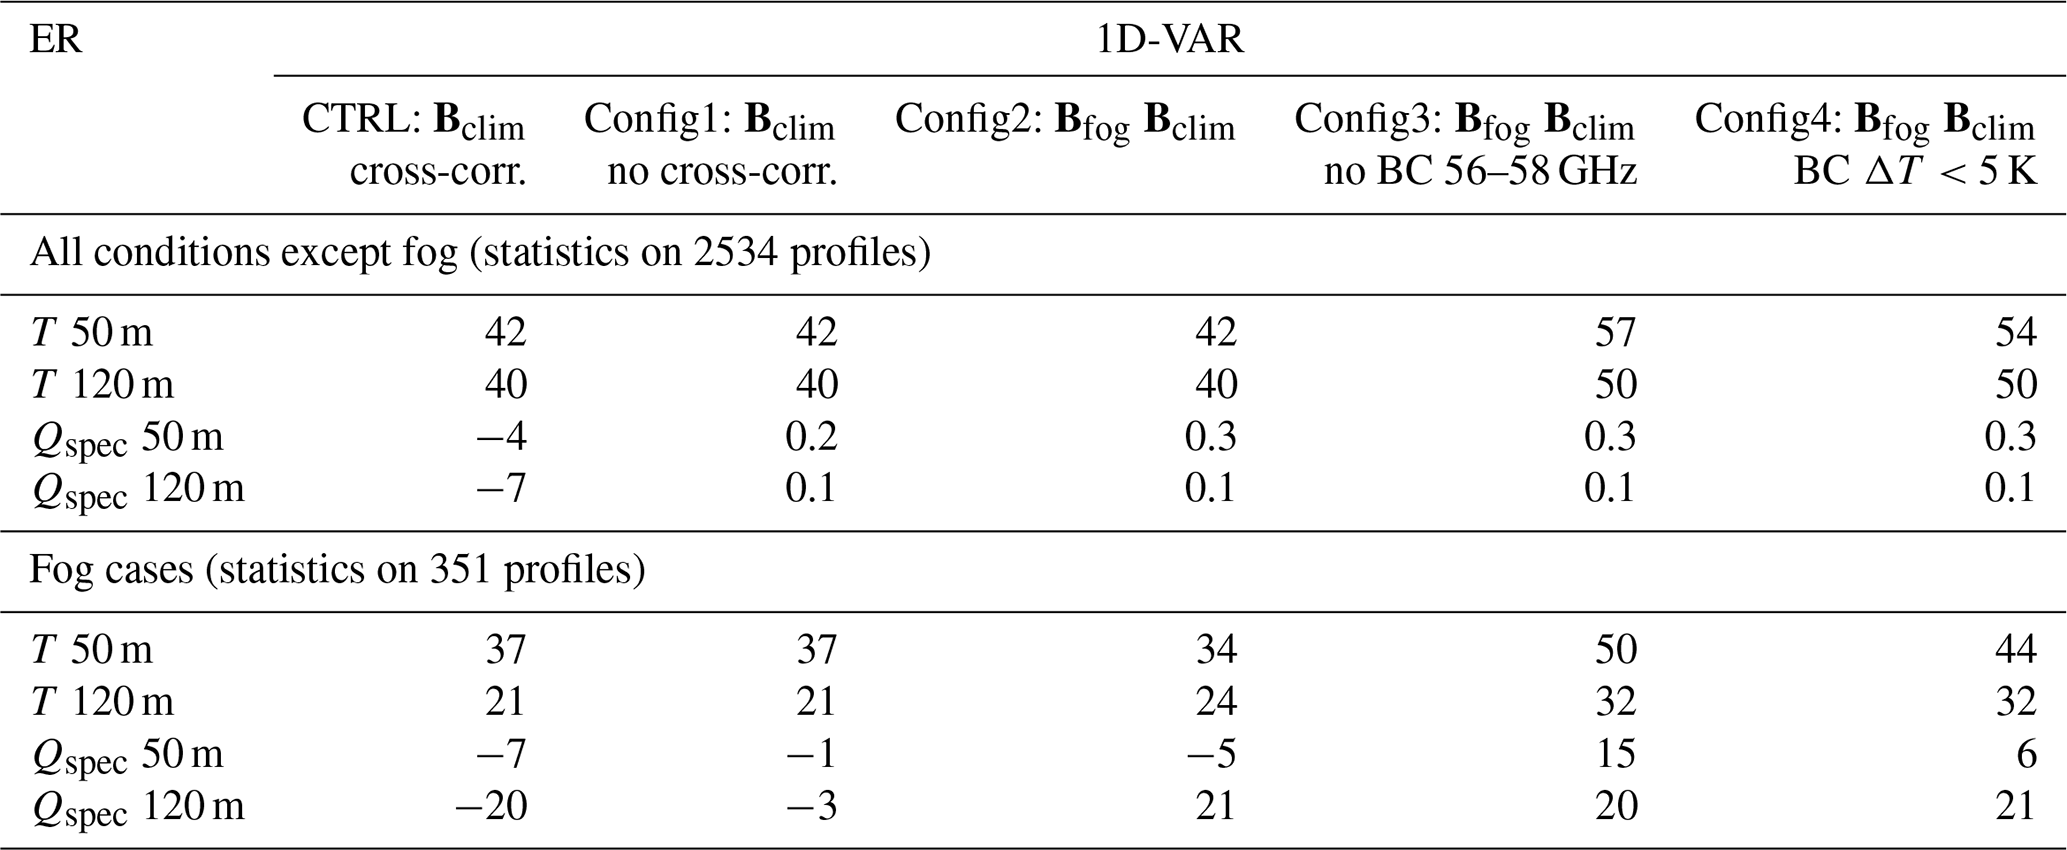
Table 4 reports the calculated error reduction for each variable, each altitude and each 1D-Var configuration. The 1D-Var configuration maximizing each ER will be selected as the best configuration. Statistics are divided between fog profiles only (lower part) or all weather conditions except fog (upper part). In addition to tower measurements limited to only two levels, the different 1D-Var configurations were also evaluated in terms of bias and RMSE against 21 radiosondes (Fig. 3). Radiosondes were launched during IOPs in different atmospheric conditions: the majority was under stratus cloud and fog conditions and a few of them in clear-sky conditions. Table 3 gives a list of the different configurations evaluated in this section. The three first configurations aim at evaluating the impact of the background-error-covariance matrix, while the last two configurations focus on the bias correction.

Table 4Reduction in the RMSE with respect to tower measurements after the 1D-Var analysis (RMSExa) compared to the background (RMSExb) for all weather conditions (upper part) or only fog events (lower part): (%). Statistics performed on temperature (T, K) and specific humidity (Qspec, kg kg−1) at 50 and 120 m altitude.
3.2.1 Sensitivity to the background-error-covariance matrix
In order to evaluate the impact of the background-error-covariance matrix, three experiments have been designed. The CTRL run mimics the configuration of the operational AROME 3D-Var data assimilation system with a climatological B matrix, taking into account cross-correlations between temperature and specific humidity. As cross-covariances highly depend on the weather conditions (Hólm et al., 2002; Michel et al., 2011) and the use of fixed covariances is not optimal when dealing with different atmospheric scenarios, Config1 aims at evaluating the impact of the cross-correlations between temperature and humidity on the retrievals. To this end, Config1 corresponds to the same configuration but removing the cross-correlations between temperature and specific humidity. It can be noted that this approach is still used in various 3D/4D-Var operational schemes (Barker et al., 2004). Config2 mimics the use of a flow-dependent B matrix during fog conditions only with a fully correlated fog-specific B matrix during fog events but a non-correlated climatological B matrix for all other weather conditions. For these three configurations, the bias correction based on clear-sky O-B monitoring is applied to the raw BT measurements.
The worst results are obtained with the CTRL configuration, which considers a climatological B matrix, taking into account cross-correlations between temperature and humidity. With this configuration, the specific-humidity RMSE with respect to tower measurements is degraded by up to 20 % (respectively 7 %) at 120 m altitude during fog conditions (respectively all weather conditions). This demonstrates the importance of the B matrix cross-correlations on 1D-Var accuracy and particularly in the case of observations with low information content on the vertical structure (as MWRs are mainly sensitive to the total column water vapour content due to vertically quasi-constant weighting functions). The humidity profile degradation is significantly reduced to less than 3 % thanks to the use of a block diagonal B matrix in Config1. Humidity profiles are finally improved by up to 21 % in RMSE at 120 m during fog conditions with the use of a specific fog B matrix adapted to the meteorological conditions. Figure 3 confirms that the best configuration in terms of B matrix corresponds to Config2 compared to the CTRL configuration. In fact, the use of a climatological B matrix with cross-correlations degrades both temperature and humidity retrievals but more significantly specific humidity up to 4 km. Overall, these results confirm that, for MWRs, humidity increments in the lowest levels are significantly driven by the cross-correlations between temperature and humidity. These correlations (sign and amplitude) being highly dependent on the weather conditions, the B matrix should ideally be updated for each profile. When it is not possible, the use of a block diagonal B matrix might be preferable to avoid degradation in the retrievals due to inaccurate cross-correlations. This result is in line with the study of Dee and Da Silva (2003), which showed that, when humidity is less adequately observed than temperature, it is more accurate to neglect humidity–temperature error covariances. However, when an adapted flow-dependent B matrix is used, the specific-humidity analysis is improved. In the future, the use of ensemble data assimilation schemes should enable deriving optimal B matrices evolving in time and space to be consistent with the weather conditions in order to optimize specific-humidity retrievals.
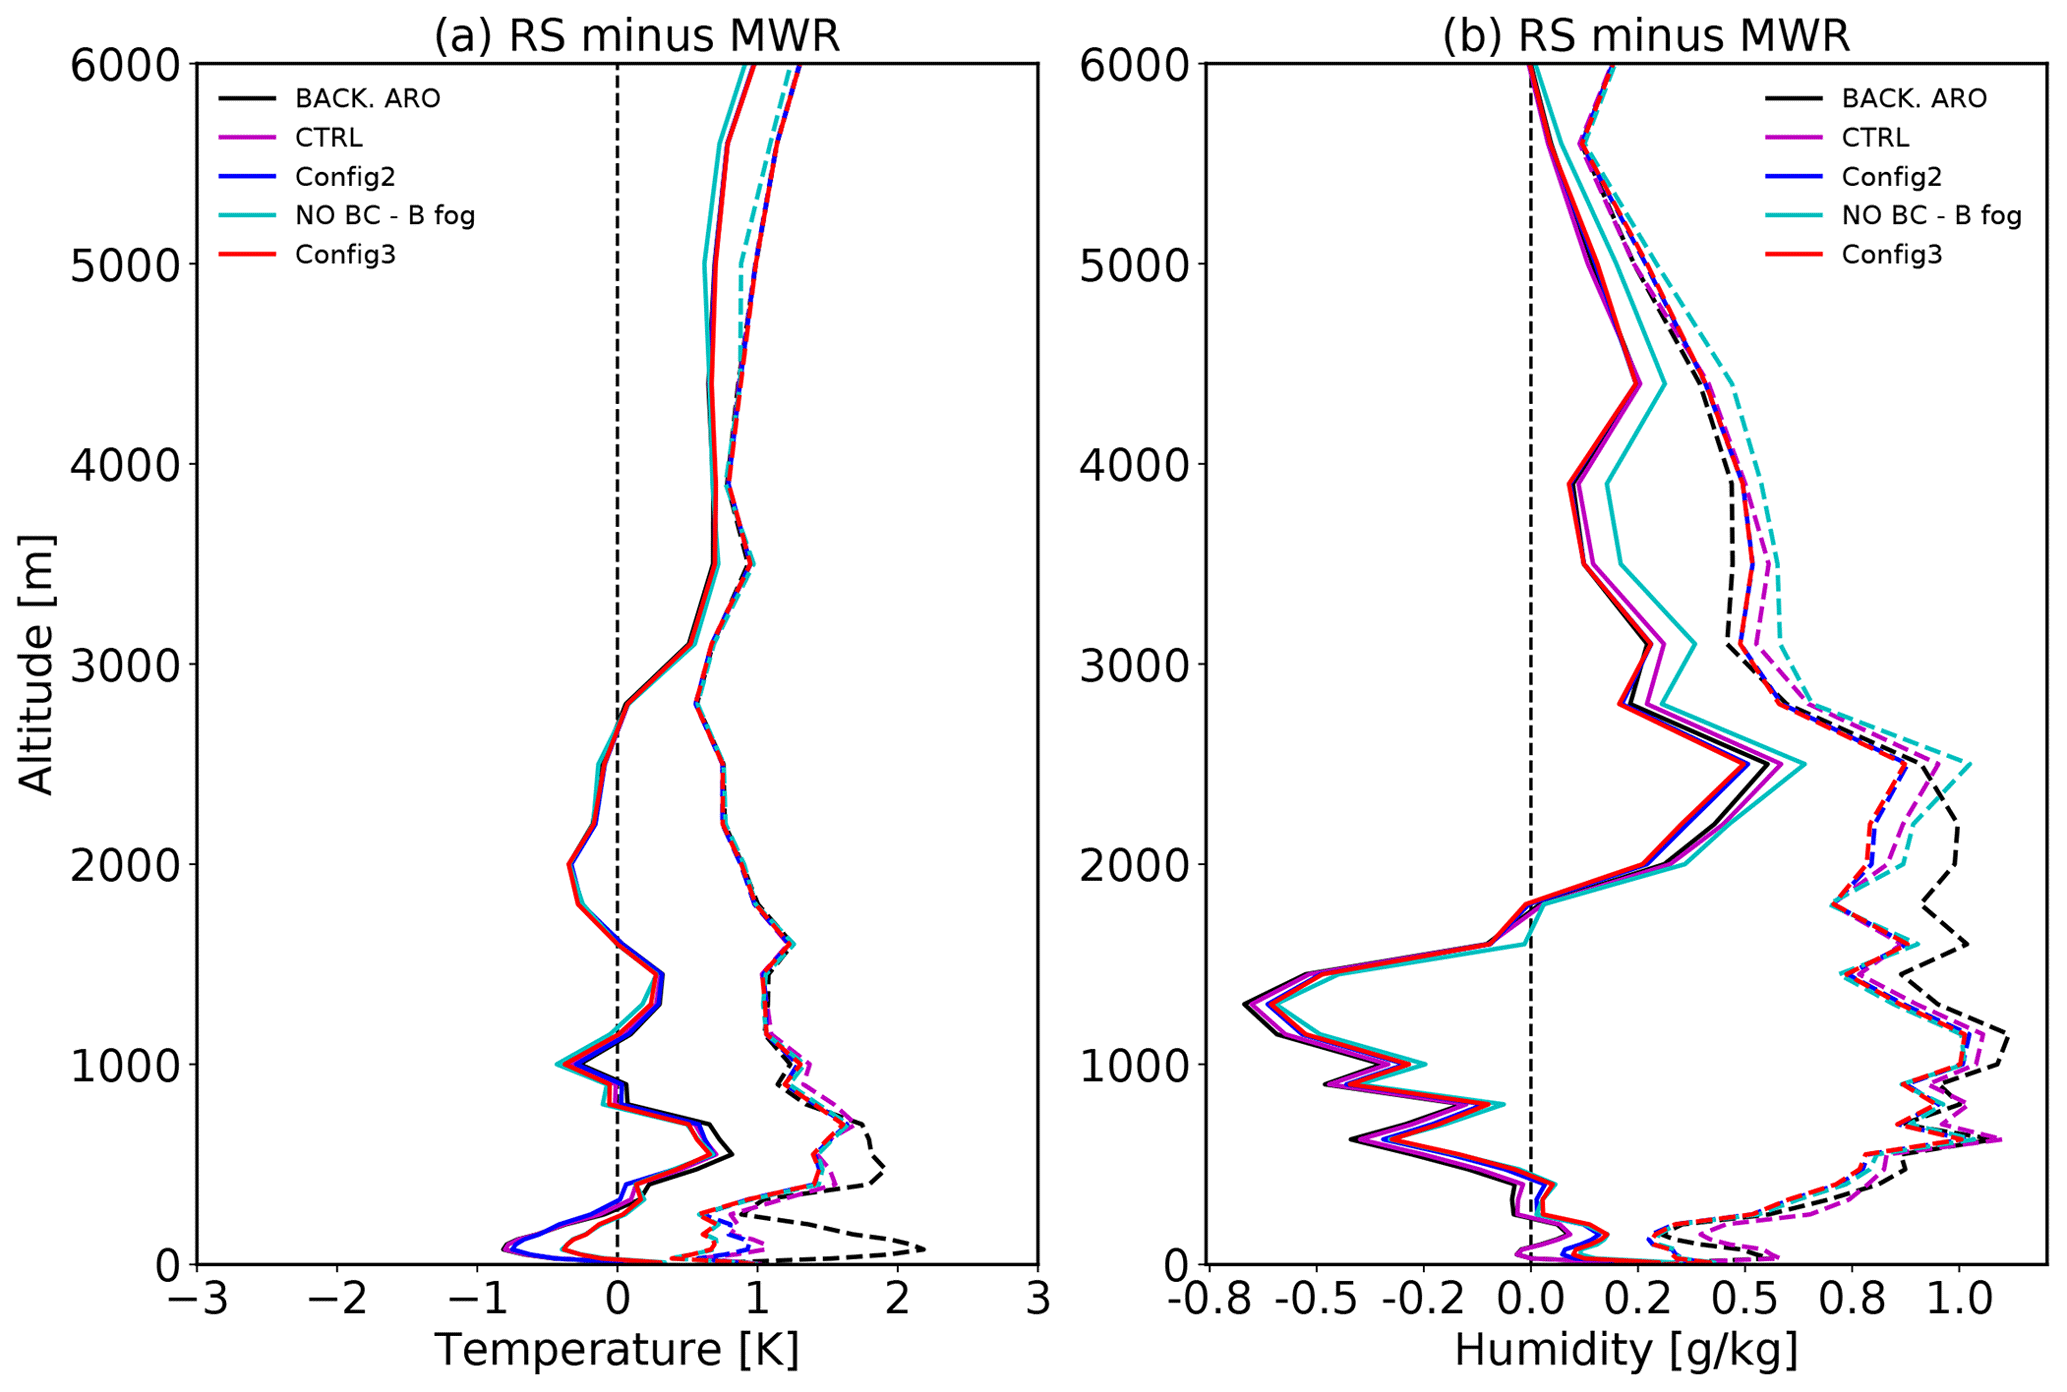
Figure 3Vertical profiles of (a) temperature and (b) specific-humidity bias (solid line) and root-mean-square errors (dashed lines) of 1D-Var retrievals (coloured lines) and AROME backgrounds (black line) against 21 radiosondes launched during IOPs: 1D-Var retrievals from AROME 1 h forecasts with bias correction and a cross-correlated climatological B matrix (CTRL, magenta), with bias correction and a cross-correlated dedicated fog B matrix (Config2, blue), with bias correction except channels 11–14 and a cross-correlated dedicated fog B matrix (Config3, red), without any bias correction and a cross-correlated dedicated fog B matrix (cyan).
3.2.2 Sensitivity to the bias correction applied on opaque channels
One other source of errors in the lowest levels could come from the bias correction applied on the most opaque channels. In fact, the bias correction has been inferred from differences with respect to the AROME model which is known for larger errors in the boundary layer below 2 km altitude (Martinet et al., 2015, 2017). Two additional configurations have thus been designed to evaluate the impact of the bias correction applied on raw measurements. Config3 is similar to Config2 except that the bias correction is not applied on the last four most opaque channels (54–58 GHz range). Config4 is similar to Config2 except that the bias correction applied to all channels is based on statistics of O-B departures made on clear-sky profiles with a temperature gradient between 500 m altitude and surface smaller than 5 K. Table 4 shows that 1D-Var retrievals are already improved with Config4 in fog conditions. Consequently, removing larger model errors during very stable conditions in the O-B monitoring leads to an improved estimation of the bias correction. The best scores are finally obtained with Config3 with improved temperature retrievals by 15 % at 50 m. Figure 3 confirms that if the bias correction based on the AROME monitoring is applied to the 54–58 GHz channels, a significant degradation in the temperature retrievals is observed in the first 500 m. Removing the bias correction applied to transparent channels causes a significant degradation of the specific-humidity retrievals above 2 km altitude. This result demonstrates that, even though the bias correction of MWR BT measurements can be computed from AROME short-term forecasts for transparent channels, this method is not optimal for opaque channels without a thorough screening of the O-B innovations. In fact, the bias correction of opaque channels depends on the accuracy of the forecast model within the boundary layer, which is known to be degraded during stable conditions. Similar conclusions are found in Martinet et al. (2017), despite the larger period of O-B monitoring (6 months instead of 2 months) and a less complex terrain.
Figure 3 finally shows that the best performance is obtained with Config3 through the whole atmospheric column (both for temperature and humidity). For temperature, with this best configuration, RMSE is smaller than 0.6 K within the fog layer and below 1.6 K when considering the whole atmospheric profile up to 6 km altitude. The 1D-Var analysis outperforms the background in the first 800 m with a maximum improvement observed within the fog layer (RMSE decreased from 2.2 to 0.6 K at 75 m). As expected, most of the information from the MWR observations are located below 2000 m and mainly below 1000 m. For humidity, RMSE accuracies are less than 1 g kg−1 for the best scenario. Most of the improvement brought to the background is located below 3000 m with a maximum RMSE decrease reaching 0.2 g kg−1 at 75 and 1800 m. Config3 is used in the following sections.
This section focuses on a thin radiative fog case observed on 28 October 2016. Figure 4 shows the cloud base height retrieved from a CL31 ceilometer (top panel), the visibility measurements on the instrumented tower at 10 and 120 m altitude (blue and green lines, respectively, middle panel), and the 1 h AROME forecasts of liquid water content (LWC) for the same day (bottom panel). During the whole period, fog is only observed at 10 m altitude during 40 min at midnight and then during 4 h from 05:00 to 09:00 UTC. A stratus cloud is then observed from 10:00 UTC until midnight with a cloud base height between 300 and 500 m. The AROME backgrounds simulate a continuous thick fog event from 00:00 to 13:00 UTC, which is then lifted until 15:00 UTC into a stratus cloud at 500 m altitude. The stratus cloud is then dissipated to appear again after 20:00 UTC. In this example, two main deficiencies in the AROME 1 h forecasts are observed: a temporally longer and vertically thicker fog event and the erroneous dissipation of the stratus cloud between 15:00 and 20:00 UTC.
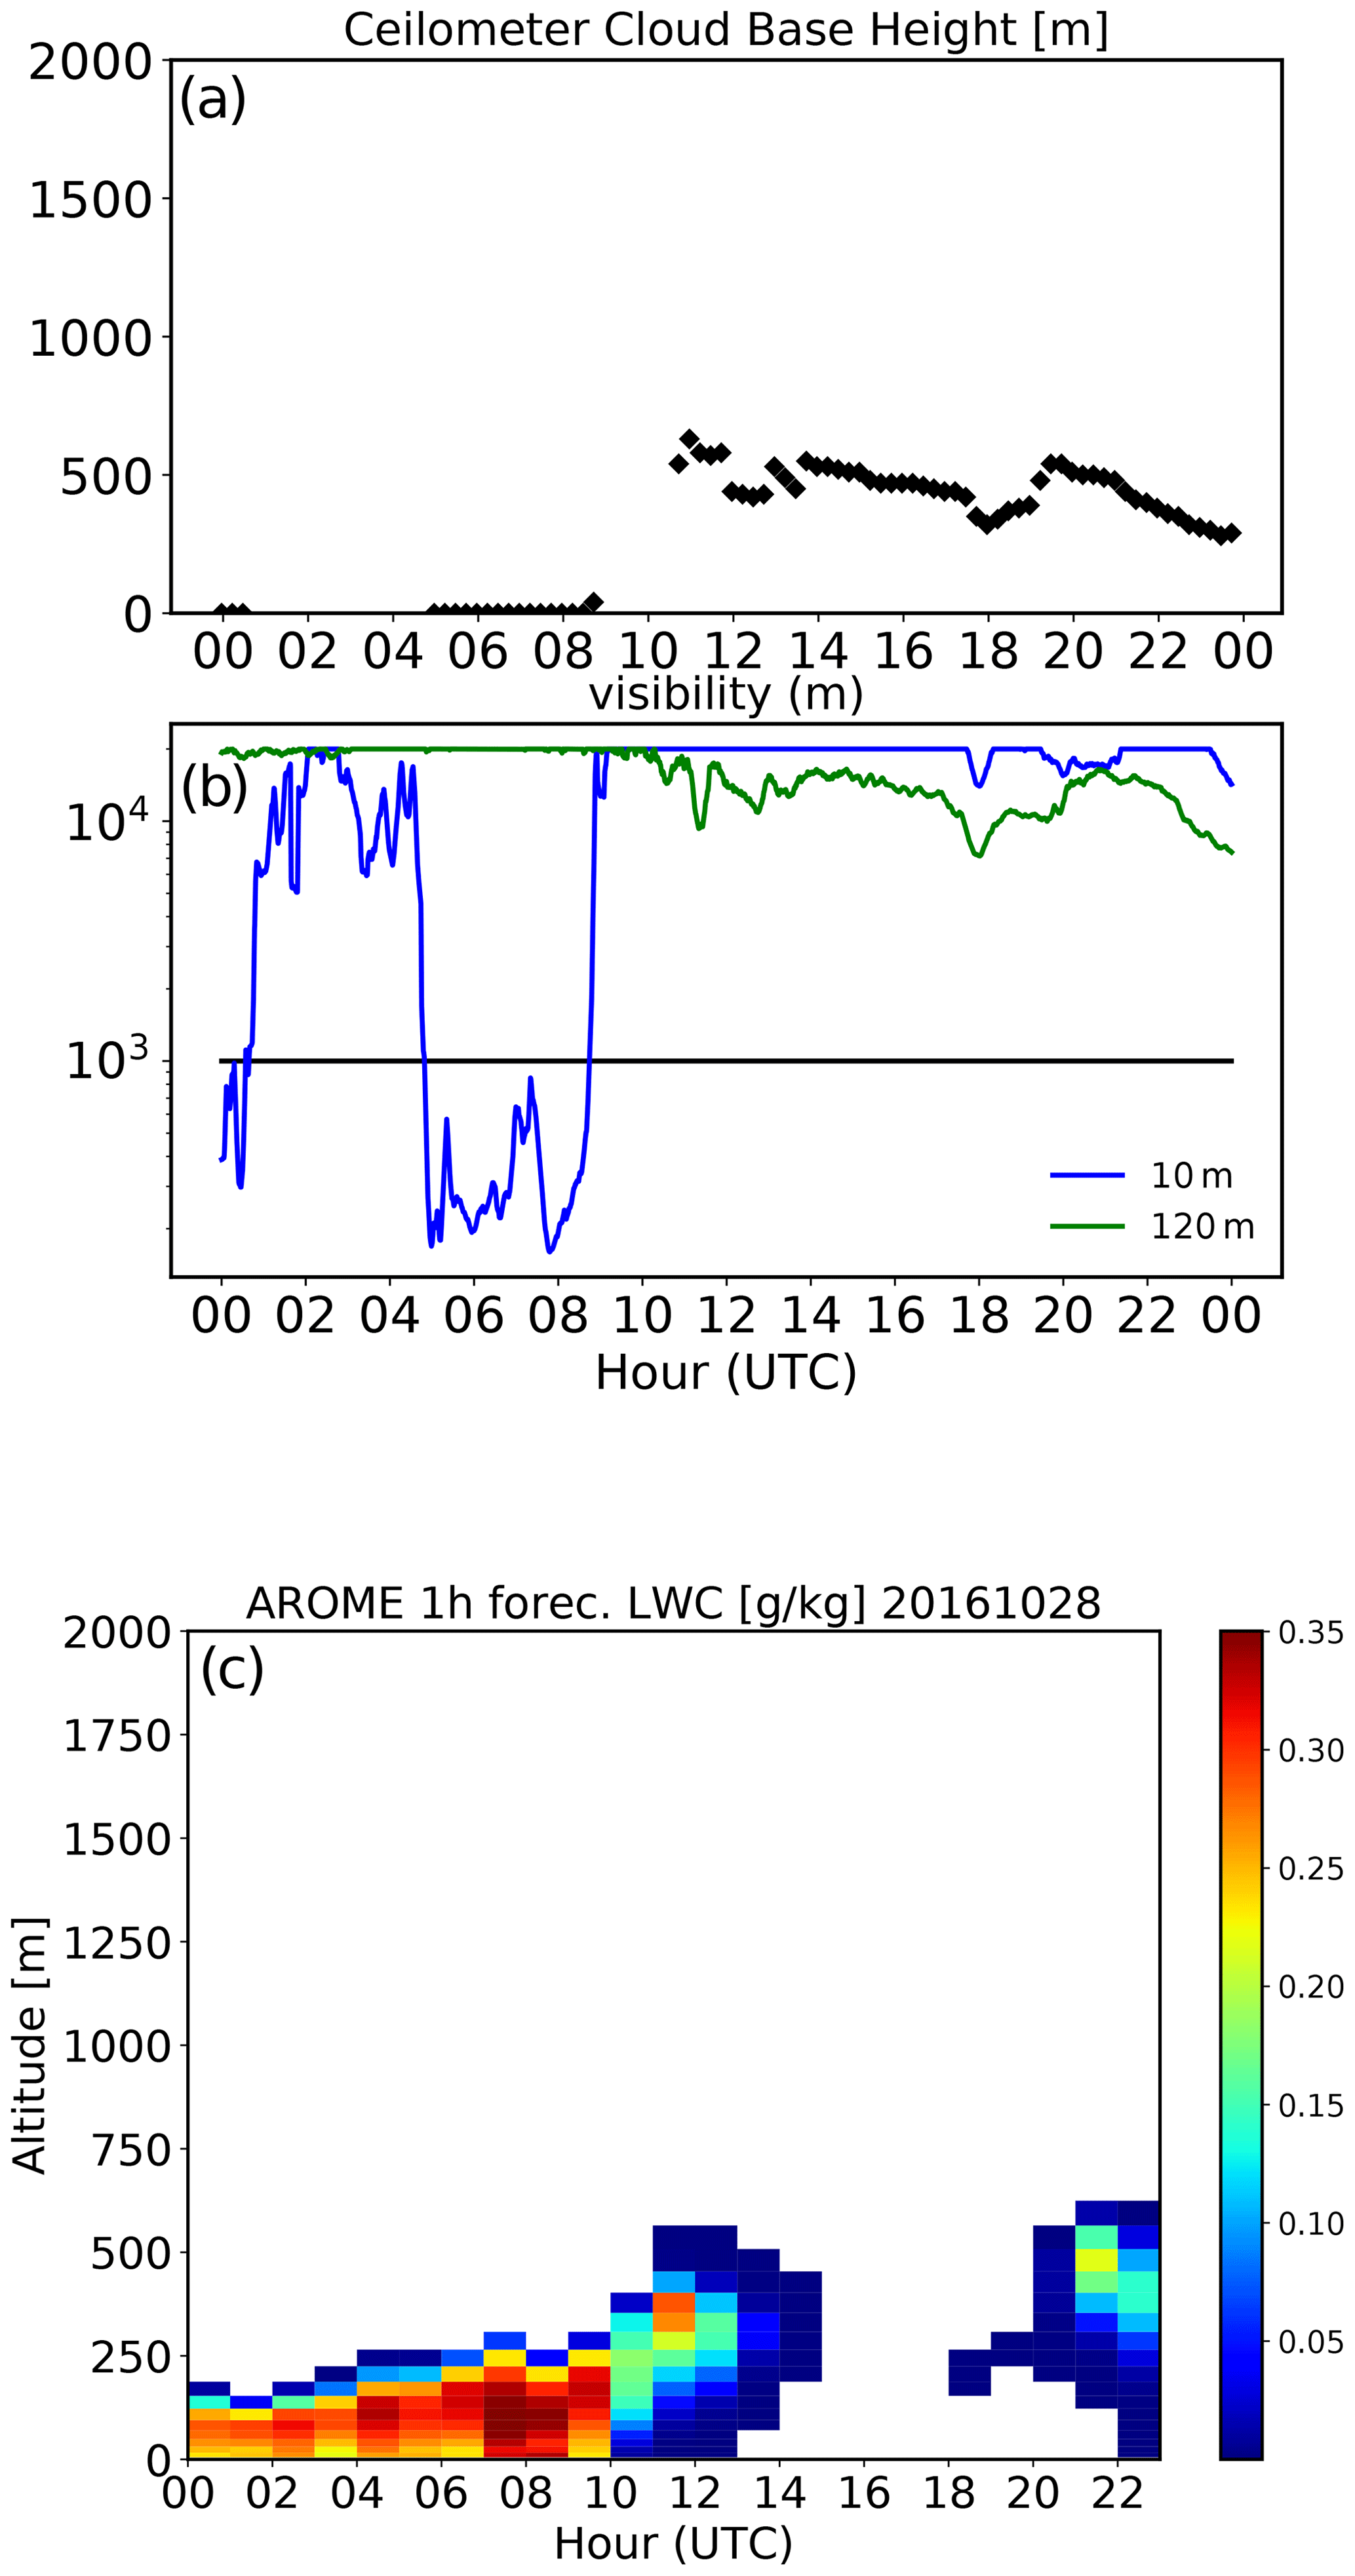
Figure 4(a) Cloud base height (m) derived from the CL31 ceilometer measurements; (b) visibility at 10 m (blue) and 120 m (green line); (c) AROME 1 h forecasts of liquid water content (in g kg−1) on 28 October 2016.
Figure 5 compares the time series of temperature profiles (top panels) and specific-humidity (bottom panels) forecast by AROME (left panels) and retrieved with the 1D-Var scheme using the optimal configuration. We can note the large temperature increment by up to 5 K from 00:00 to 12:00 UTC essentially in the first 250 m after 1D-Var is applied; this is the period when the model simulates a thick fog event not confirmed by the observations. This is followed by a temperature cooling within 2 K during the stratus cloud (16:00 to 24:00 UTC). The specific humidity is only modified during the fog event (05:00 to 09:00 UTC) with an increase of 1 g kg−1 in the first 1500 m.
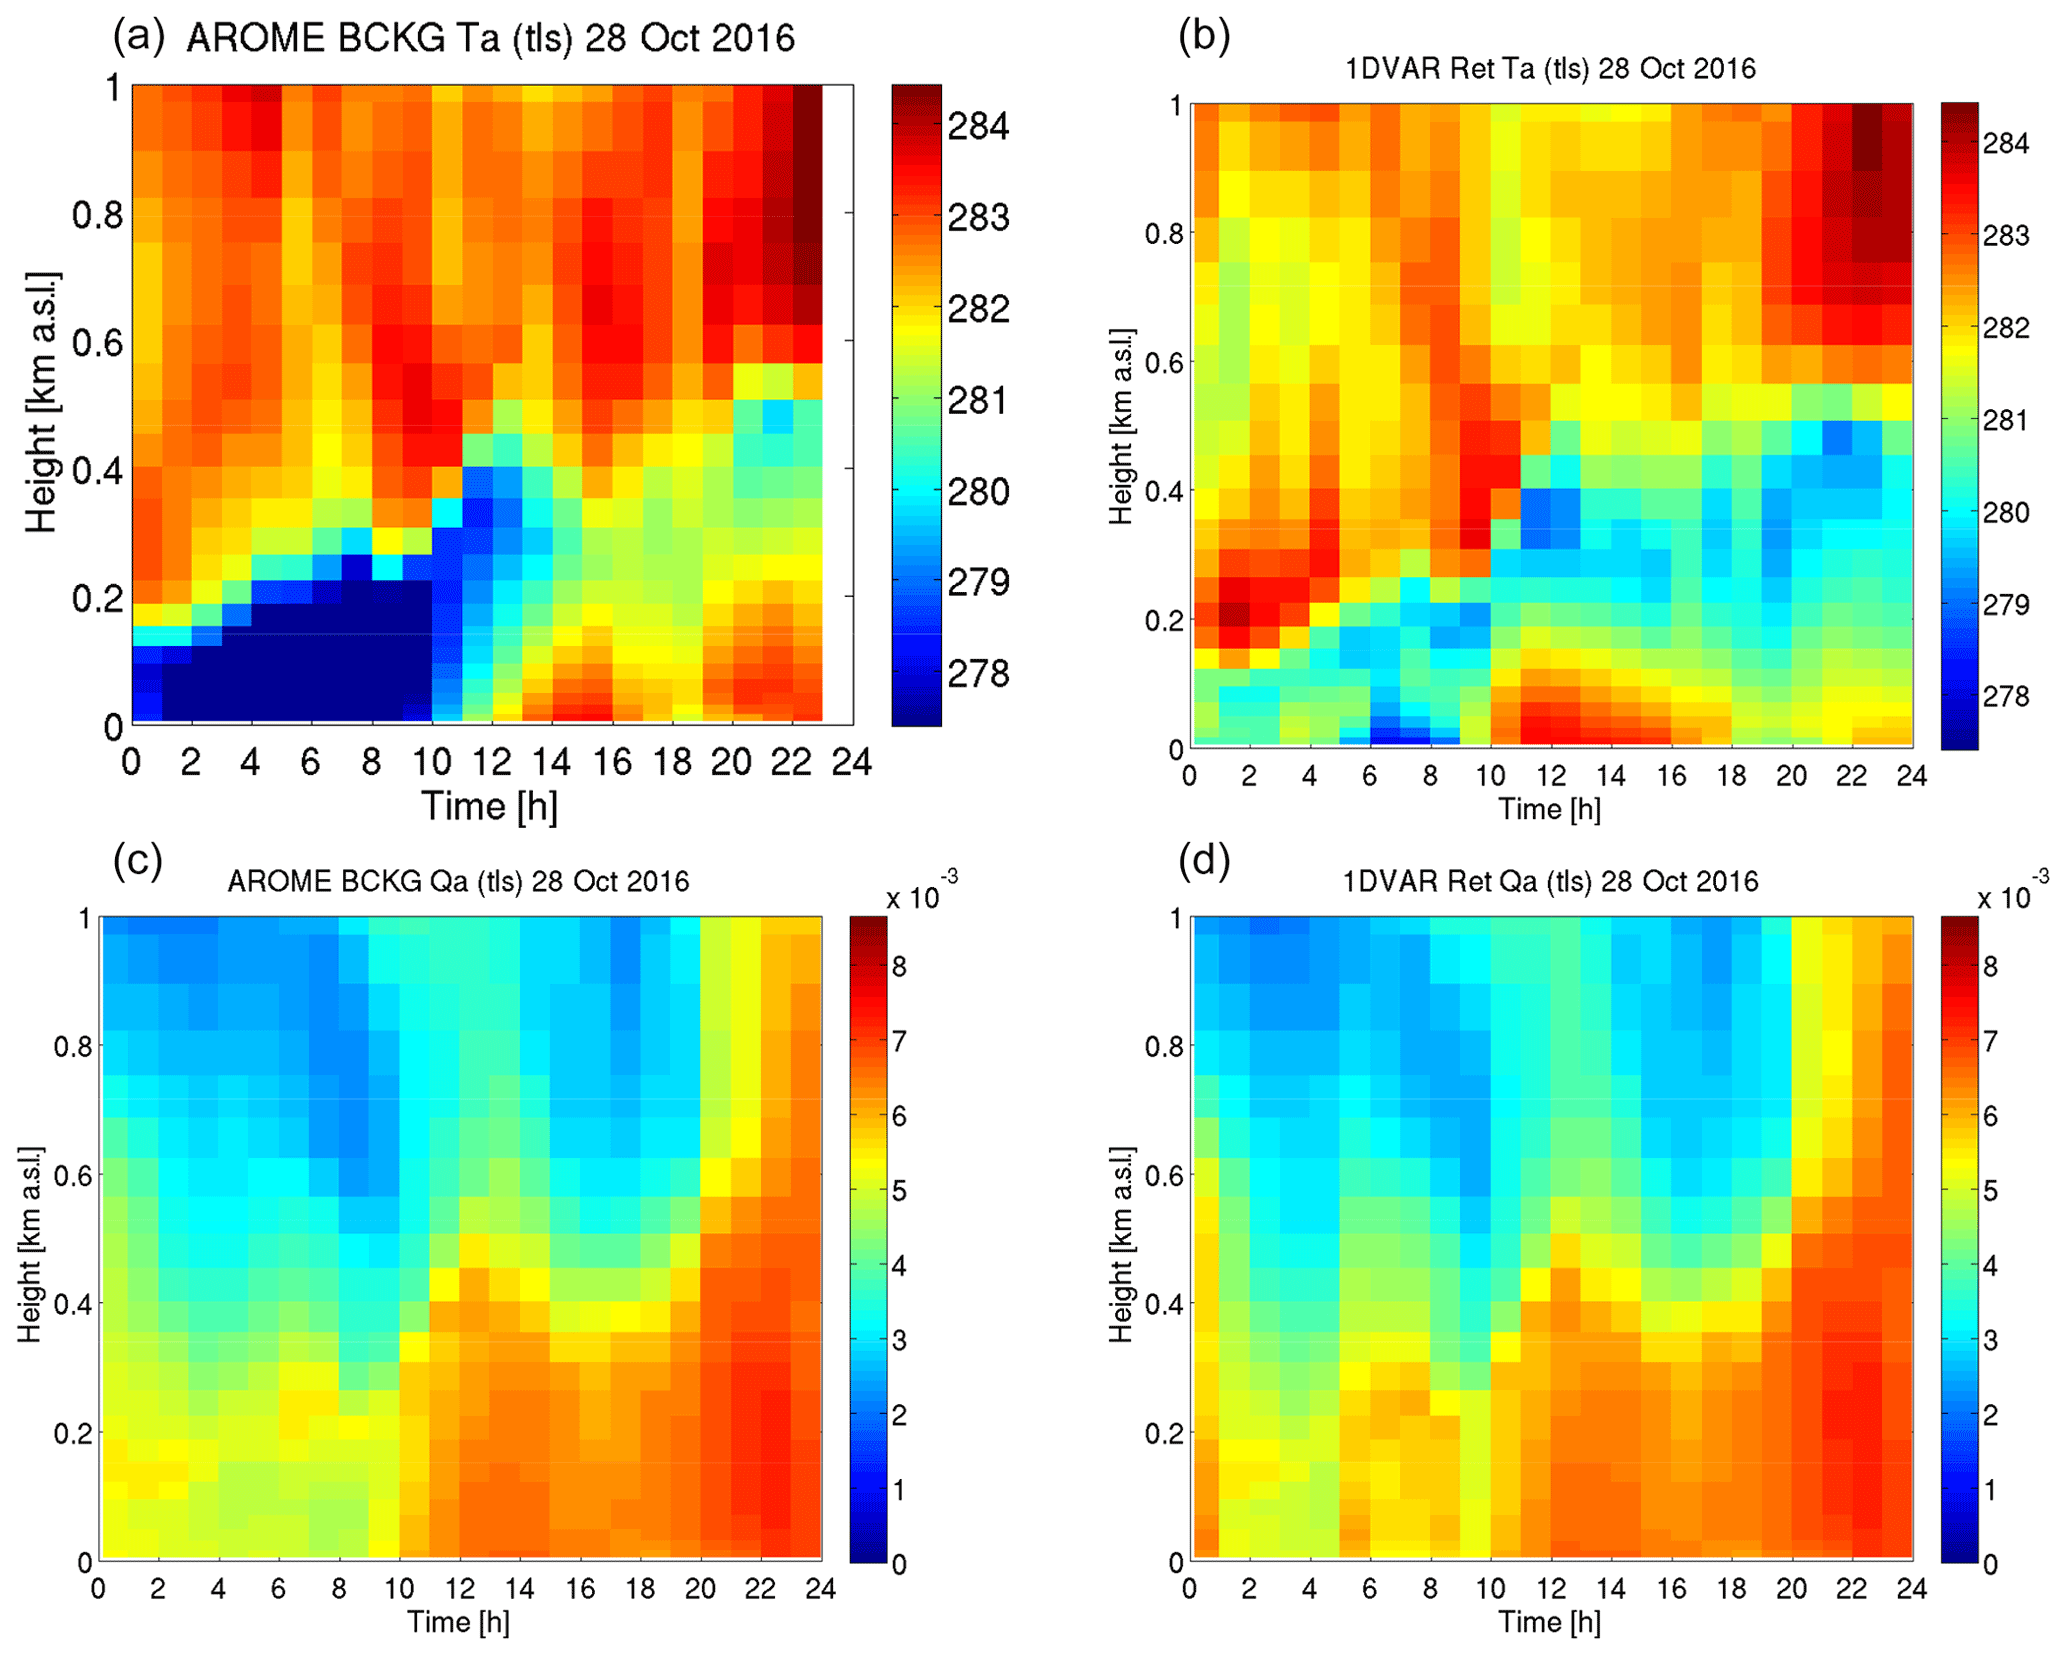
Figure 5Time series of temperature profiles (a, b) and specific-humidity (c, d) forecast by AROME (a, c) and retrieved with the 1D-Var scheme with the optimal configuration (Config3, b, d) on 28 October 2016.
In order to quantify the accuracy of the 1D-Var increments in this specific fog case, Fig. 6 evaluates the corresponding diurnal evolution of temperature, specific humidity and relative humidity at 50 and 120 m altitude. A large underestimation of the temperature by 4 to 6 K is observed in the AROME forecasts by night until 13:00 UTC. AROME forecasts are also found to be too warm by 2 K after 18:00 UTC. The assimilation of MWR brightness temperatures in a 1D context greatly improves the model background (temperature) during the night-time fog event with temperature errors smaller than 2 K after assimilation. The 1D-Var retrievals almost perfectly fit the in situ observations after 13:00 UTC for temperature (both at 50 and 120 m altitude).
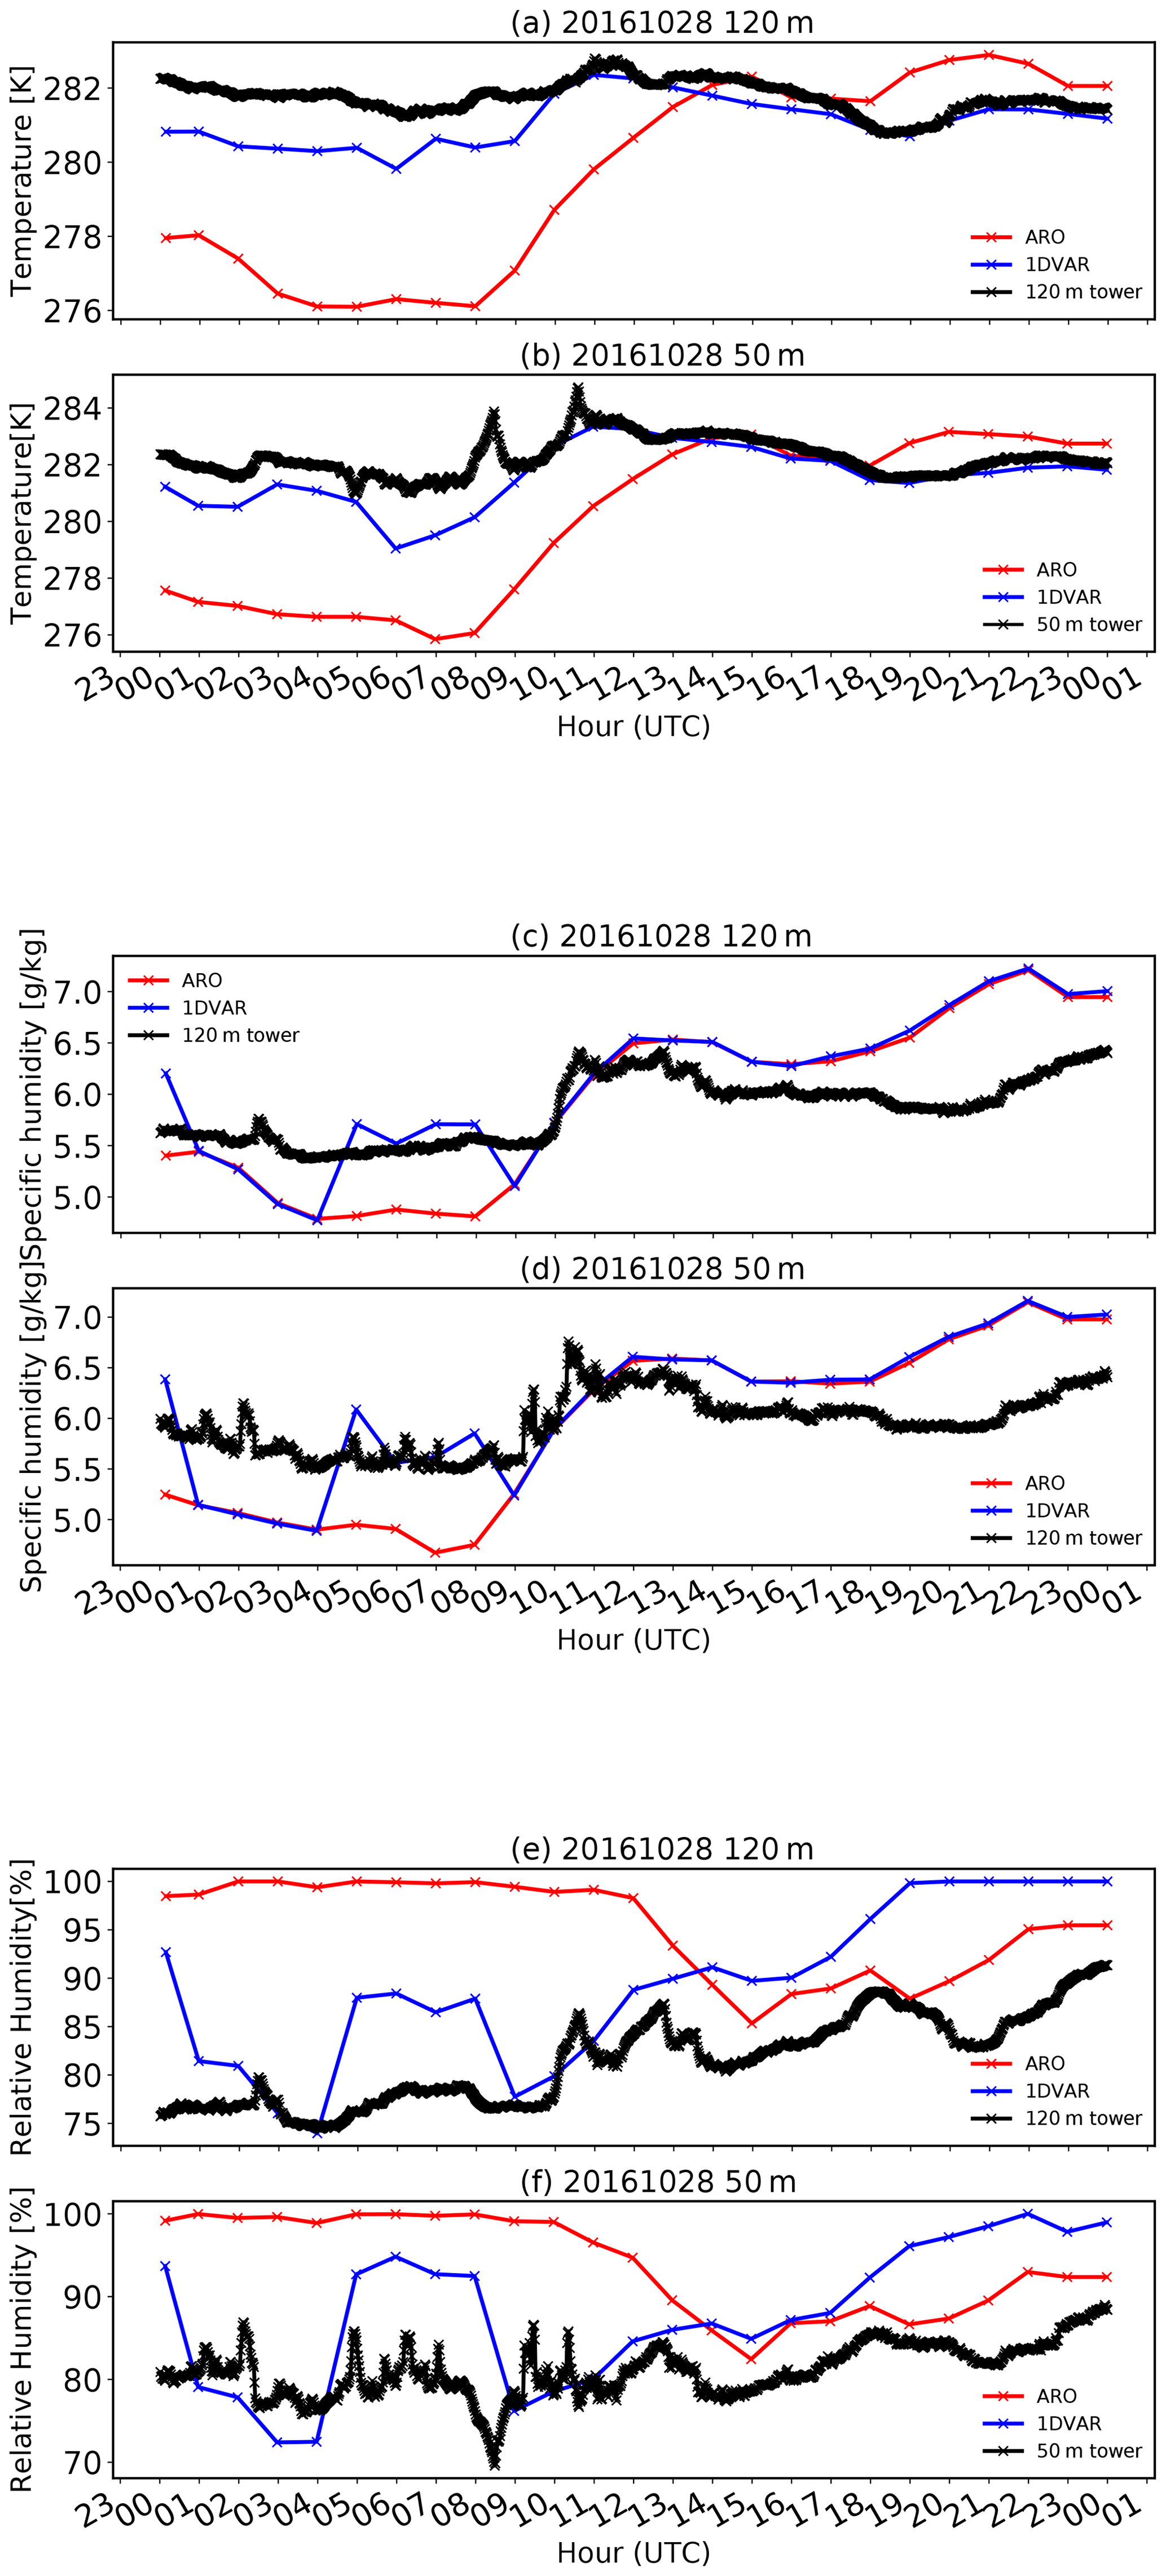
Figure 6Diurnal evolution of temperature (a, b), specific humidity (c, d) and relative humidity (e, f) forecast by AROME (red), measured by weather station (black) and retrieved by the 1D-Var algorithm (blue) on 28 October 2016.
In terms of specific humidity, AROME tends to underestimate the specific humidity at night-time probably due to an overestimation of the saturation. Indeed, as the fog layer was thicker in AROME than in the observations, we believe the model converts too much water vapour into liquid erroneously, which makes it underestimate specific humidity. On the contrary, the specific humidity is overestimated in the afternoon. After 1D assimilation of MWR measurements, specific humidity is nearly identical to the AROME forecasts except during the longest fog event (between 04:00 and 09:00 UTC) where the 1D analysis is closer to the tower measurements than the background. This is likely due to the use of the cross-correlated fog B matrix under these conditions as opposite to the use of a block diagonal B matrix when fog is not observed. Most of the model increment is thus produced by the B matrix cross-covariances. Background errors are reduced from 0.5 to 0.1 g kg−1. Although closer to the in situ observations, 1D-Var retrievals slightly overestimate specific humidity between 04:00 and 09:00 UTC. This is most likely due to over-estimated positive cross-correlations between temperature and humidity in the B matrix. In terms of relative humidity, the temperature warming by night leads to the effect that the fog layer is not saturated any more in agreement with the tower in situ measurements. However, this field is degraded after 13:00 UTC. In fact, the 1D-Var scheme correctly reduces the temperature but is not able to decrease the specific humidity. The relative humidity is thus wrongly increased by the 1D-Var analysis.
In view of the future inclusion of hydrometeors in the data assimilation control variables, the information brought by MWRs to the liquid water path (LWP) could also be very valuable. Figure 7 shows the time series of LWP forecast by AROME, retrieved through the 1D-Var and retrieved from a quadratic regression applied on BT measurements. It can be seen that the AROME model clearly overestimates the fog LWP with a maximum reaching 90 g m−2 at 07:00 UTC. This value, however, decreased down to 25 g m−2 after the 1D assimilation of MWR brightness temperatures. During the period when the model fails to simulate the stratus cloud, the LWP is significantly increased in the 1D-Var analysis with values between 30 and 80 g m−2 even if the background profile has no cloud layer between 14:00 and 20:00 UTC. These LWP modifications brought by the 1D-Var are consistent with the in situ observations on the instrumented tower as well as ceilometer observations.
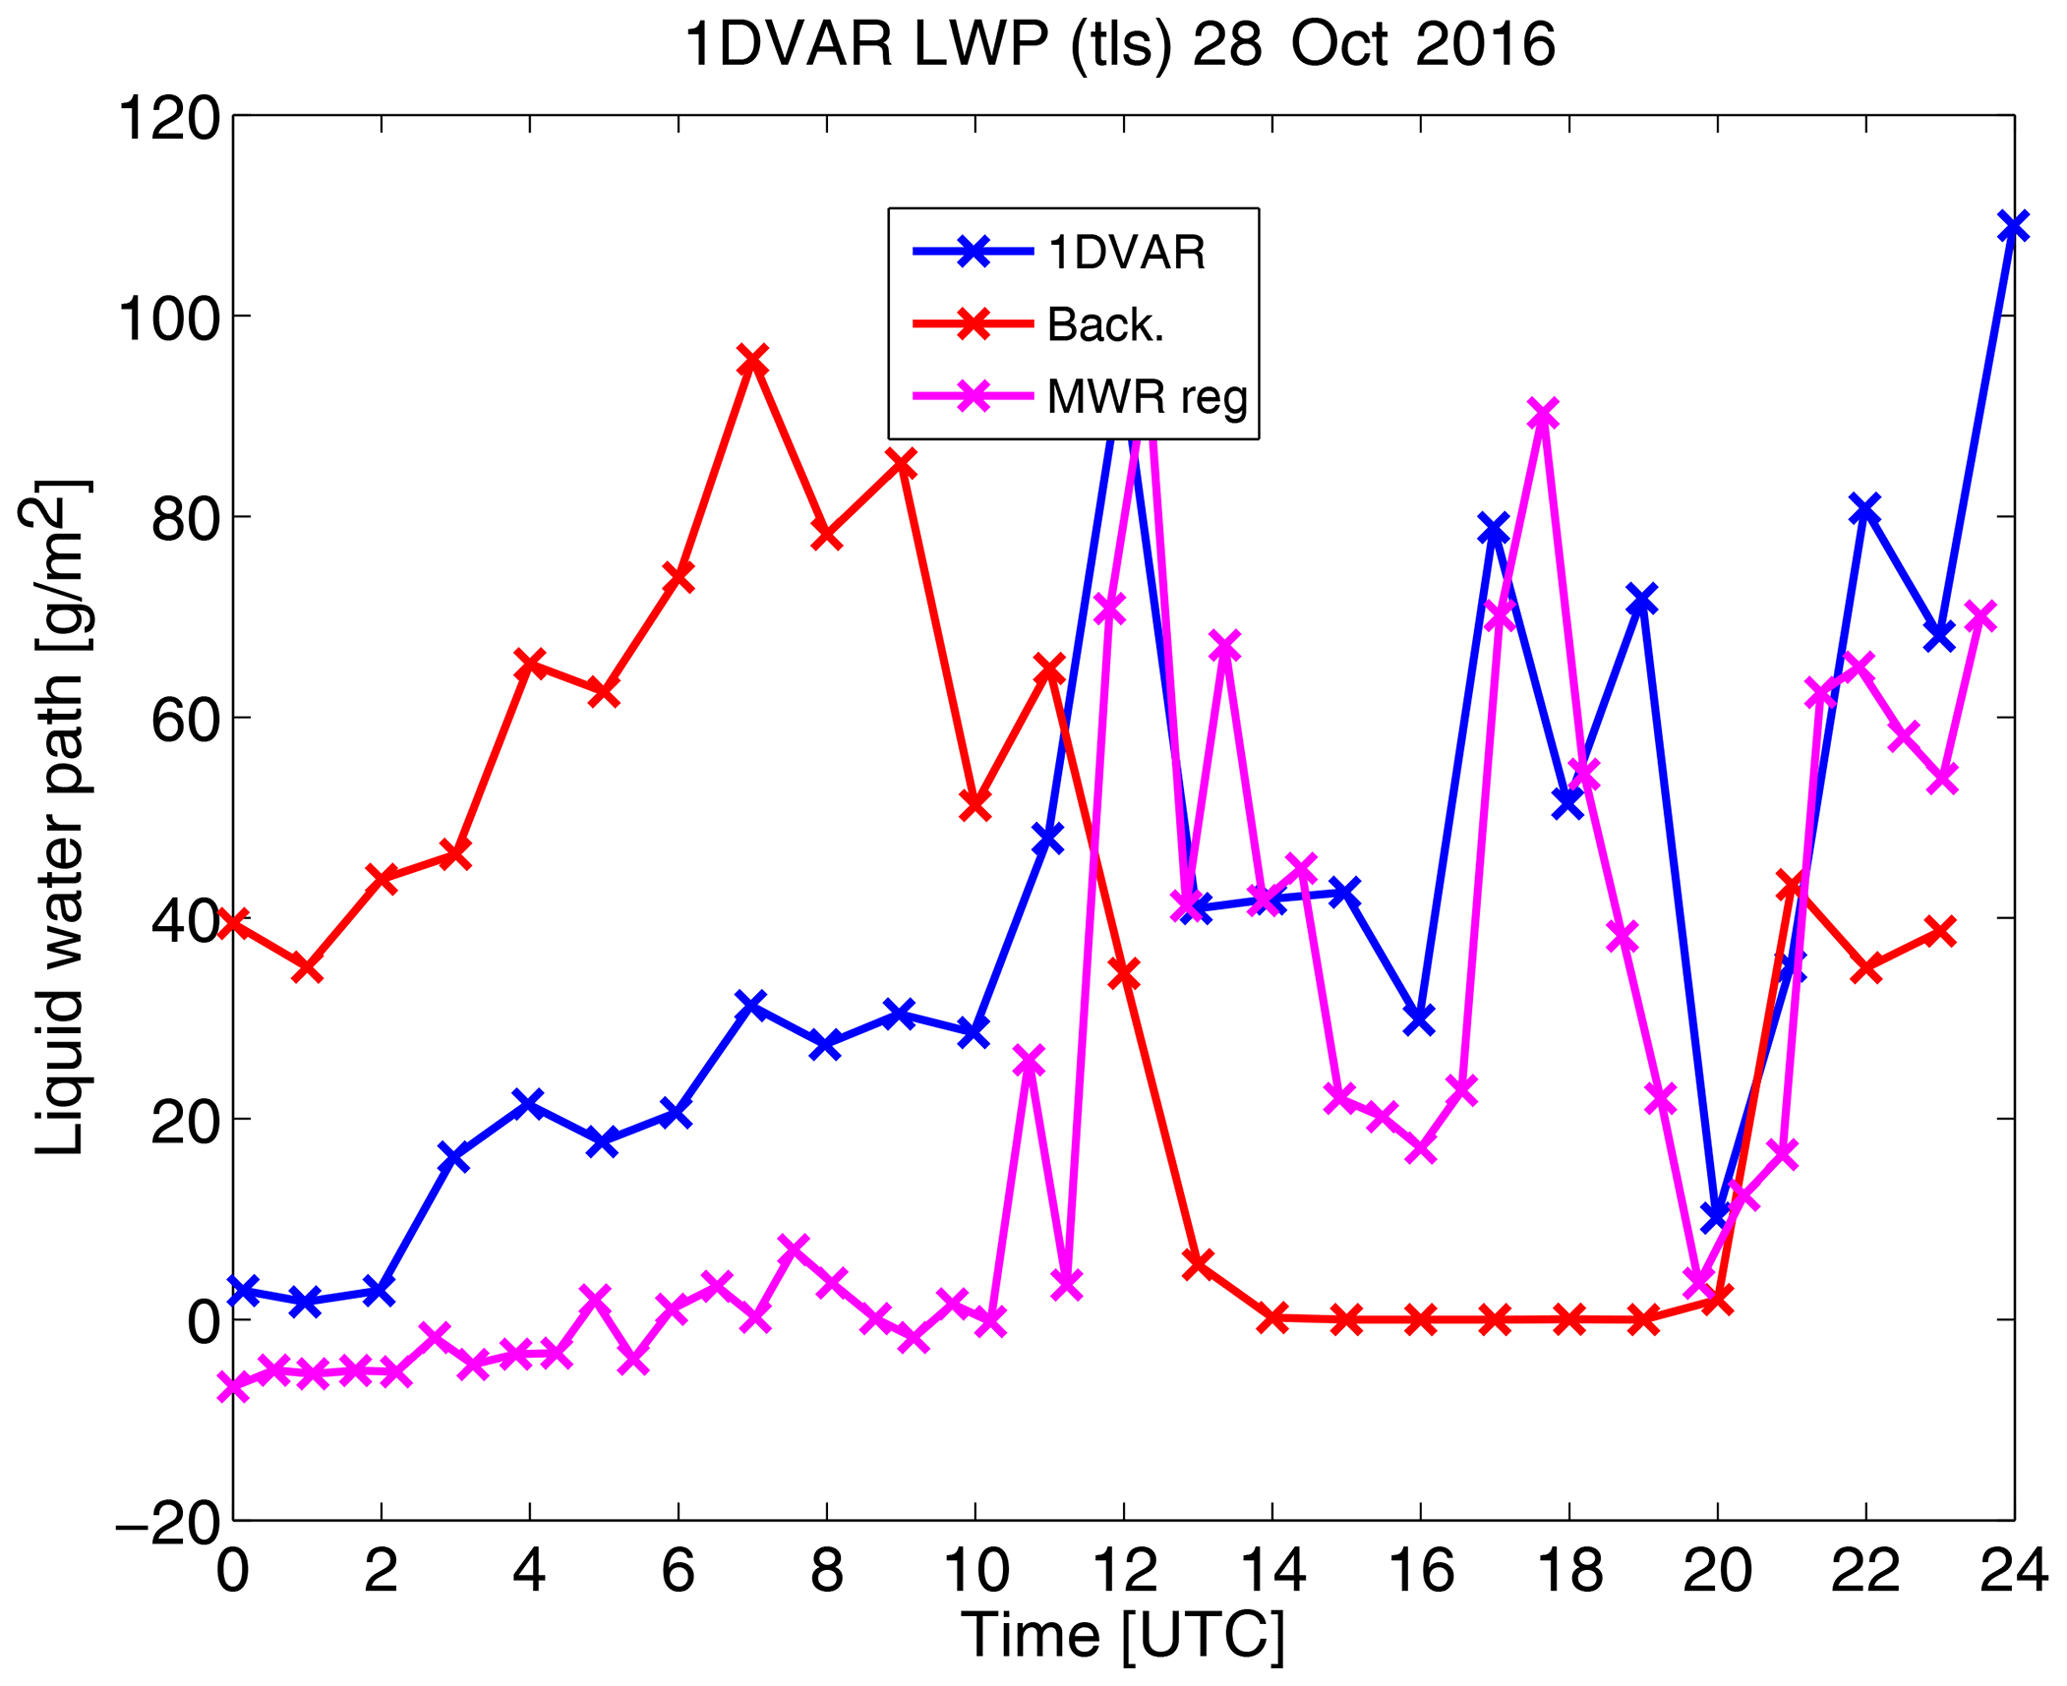
Figure 7Time series of liquid water path forecast by AROME (red), retrieved by the 1D-Var algorithm (blue) or retrieved from the MWR alone through a quadratic regression (magenta) on 28 October 2016.
While the previous section focuses on an extreme fog case, this section aims at more general conclusions on the expected impact of MWR BTs assimilation on AROME analysis. To this end, a statistical evaluation of the expected model increments (analysis minus background differences) after assimilating MWR measurements has been conducted using the tower measurements during the 6-month period. The 1D-Var retrievals have been performed using the optimal configuration described in Sect. 3.2. A total of 351 h of fog (rain events have been removed) could be observed with the MWR. In order to evaluate the performance of the AROME background profiles (1 h forecast) to accurately forecast fog events, statistics based on the hit ratio (HR), false alarm rate (FAR), frequency bias index (FBI) and critical success index (CSI) were computed. If GD (good detection) is the number of fog profiles well detected, ND (not detected) is the number of undetected fog profiles and FA is the number of false alarms, then these scores are defined by
To detect fog profiles in the model space, a new visibility diagnosis specifically developed for the AROME model has been used (Ingrid Dombrowski-Etchevers, personal communication, July 2020). In this new diagnosis, the visibility is directly deduced from the liquid water content at ground. It was computed through a statistical regression between hourly maximum of liquid water content forecast by AROME and observed minimum of visibility on 100 ground stations during 5 months. A hit ratio of 73 % and a false alarm rate of 58 % was found. A FBI of 1.77 means that the AROME background profiles tend to forecast too many fog events. CSI equal to 0.35 means that only 35 % of fog events (observed and/or predicted) are correctly forecast by the model. These statistics emphasize that quite large errors are observed in the AROME 1 h forecasts of fog with an excessive number of false alarms. In order to evaluate the potential benefit of MWR observations to adjust the AROME background profiles, the statistical study of model increments is split between the good detections, missed fog profiles and false alarms. Firstly, the frequency distributions of differences of 1D-Var analysis and background with tower measurements at 50 m are displayed in Fig. 8 (both for temperature and specific humidity). For temperature and for all subsets, the distributions of 1D-Var analysis errors are more centred and more symmetric compared to the background-error distributions. Thus, the largest background errors (above 2 K in absolute values) are successfully corrected by the 1D-Var analysis. Background error distributions also present a larger tail towards negative values with a secondary peak centred around −4 K in the case of false alarms and to a smaller extent in the case of good fog detections. The largest temperature improvement is observed in the case of false alarms with only 35 % of the background errors being within −0.5 to 0.5 K, which is against 69 % for the analysis. RMSEs with respect to tower measurements are also significantly improved with values between 1.3 and 1.9 K in the background against 0.6 K in the analysis. The frequency distribution of specific humidity errors for 1D-Var analysis and background are close, with similar bias and RMSE for good detections and false alarms. A slight degradation is observed for missed fog detections with a RMSE of 0.33 g kg−1 in the analysis against 0.25 g kg−1 in the background. Overall, the impact on humidity is less evident than on temperature at 50 m altitude.
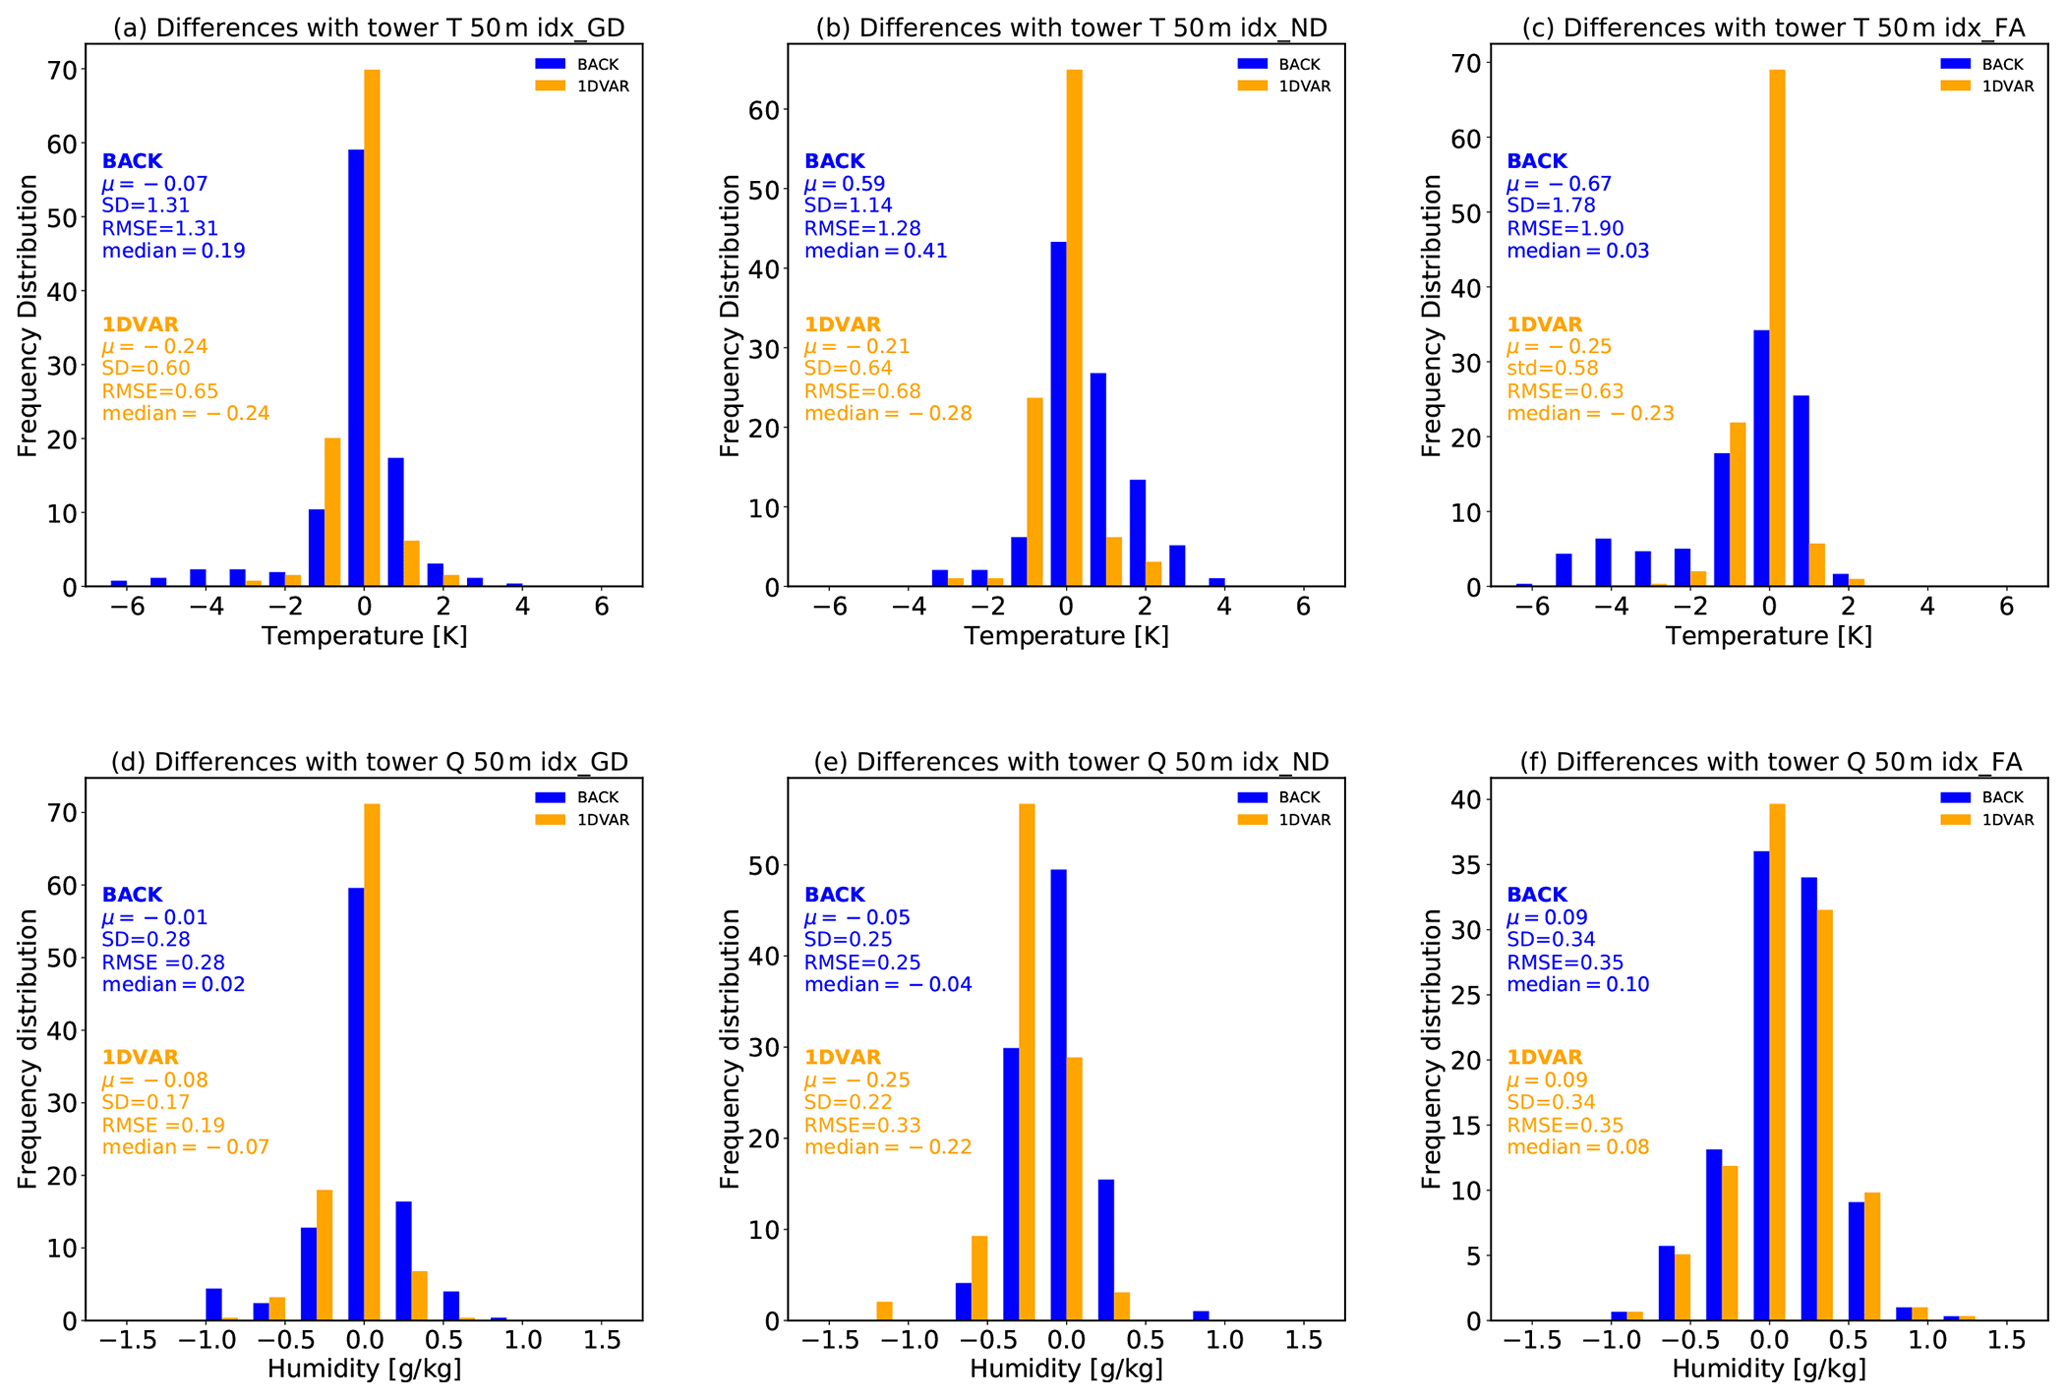
Figure 8 Frequency distribution of 1D-Var analyses (orange) and background (blue) differences compared to tower measurements for temperature (a–c) and specific humidity (d–f) at 50 m altitude. Statistics performed over 255 profiles of good fog detection (a, d), 95 profiles of undetected fog (b, e) and 368 profiles of false alarms (c, f).
To get a vertical perspective, Fig. 9 shows the profiles of the frequency distribution of analysis minus background differences. As more than 90 % of the water vapour increments are within 1 g kg−1 up to 1500 m altitude, only the impact on temperature is discussed. For each vertical bin, the frequency of the temperature increments within a given range of values is shown. The frequency distribution of 1D-Var increments has been separated between cases of correct fog detection, missed fog and false alarms. For all of the dataset, most of the temperature analysis increments are observed below 750 m and span the range −5 to 5 K. The largest increments are observed between 100 and 300 m altitude for which around 20 % of the analysis minus background differences are larger than 2 K in absolute values. We can note significant differences in the shape of the increment distributions depending on the forecast score. While the distribution of good detections is quite symmetric, it is not the case for missed fog profiles and false alarm distributions. In the case of missed fog events, the distribution is negatively skewed close to the ground, whereas it is positively skewed above 100 m altitude. This asymmetry means that the largest analysis increments in magnitude tend to decrease the temperature close to the ground and increase the temperature above 100 m. Consequently, we can expect 1D-Var analyses to increase the atmospheric stability in the first 150 m, which is key for fog formation. In the case of false alarms, the distribution is positively skewed for all vertical levels. This asymmetry means that the largest analysis increments, though less frequent in the distribution, occur when the AROME forecasts tend to significantly overestimate the temperature cooling. By limiting the temperature cooling, the 1D-Var analyses might limit the erroneous saturation leading to false alarms in the background.

Figure 9Vertical profiles of the frequency distribution of temperature increments (analysis minus background differences). Statistics performed over 255 profiles of good fog detection (a), 95 profiles of undetected fog (b) and 368 profiles of false alarms (c).
The additional value of MWR data for NWP forecasts and process studies is in the LWP product. In fact, MWR is one of the most reliable sources for this variable (Crewell and Löhnert, 2003), which is key for better understanding the microphysics of fog life cycle and limiting the forecast spin-up (i.e. the unbalance of thermodynamic profiles with microphysical variables during the analysis). In fact, as hydrometeors are currently not included in the control variables of most operational variational data assimilation schemes; these fields are kept unchanged during the analysis. Thus, the analysed hydrometeor fields correspond to the previous background. Consequently, in the following statistics, the background values of LWP correspond in fact to the LWP in the operational AROME analysis. These fields are then modified according to the updated temperature and humidity analyses in the first time steps of the forecast through the model physics. The statistical study performed here is also useful to evaluate the expected impact on the AROME analyses if MWR observations were assimilated and the LWP included in the control variables. To this end, Fig. 10 investigates the frequency distribution of LWP increments split by forecast skill (good detections, undetected fog, false alarms). Firstly, we can note that the LWP increments are higher than 50 g m−2 in absolute values for approximately 50 % of good detections and missed fog profiles and 30 % of false alarms. During false alarms, 95 % of the background LWP values are below 20 g m−2 (not shown), which is close to the MWR sensitivity which might explain smaller 1D-Var increments during false alarms. The mean increment is the highest in the case of missed fog events (57 g m−2) and the smallest in the case of false alarms (15 g m−2). It is important to note that during false alarms, the LWP increment might be positive due to the presence of cloud layers, though we would expect the 1D-Var analysis to decrease the LWP within the fog layer. If we restrict the statistics to false alarms without cloud aloft, the mean increment is reduced to −2 g m−2. As expected, large positive increments occur more often in fog cases undetected by AROME with 47 % of the distribution showing increments above 50 g m−2 against 35 % in good detections and 22 % in false alarms (8 % for false alarms without cloud layers aloft). To further investigate the LWP increments and retrieved values, more in situ data are necessary, e.g. from the cloud droplet probe mounted on the tethered balloon or cloud radar measurements. However, the lack of cloud radar measurements to differentiate the LWP within the fog layer and cloud aloft makes this evaluation complex. Too few cases during which MWR observations were co-located with an entire sounding of the fog layer with the tethered balloon have been sampled to make an independent evaluation of this product. This is why we use the LWP derived from the MWR alone through a quadratic regression as a reference. The expected accuracy of this product is 15 to 20 g m−2 according to Crewell and Löhnert (2003). To this end, Fig. 12 shows the scatterplot between the LWP retrieved with the MWR alone (through multichannel regressions provided by the manufacturer) and the 1D-Var analyses or background profiles (left panel). We can note the large improvement in correlation between the LWP forecast by the background (0.72) versus the 1D-Var analysis (0.98) with respect to the MWR multichannel retrieval. This is of course expected as the 1D-Var minimization tends to get closer to the MWR brightness temperatures which are also used in the multichannel retrieval. However, this evaluation is a good sanity check, showing the good behaviour of the 1D-Var algorithm and its capability to extract the information from the observation even with very large errors in the first-guess background profiles. The mean error of the AROME LWP is −49 g m−2 and is reduced to −2 g m−2 after 1D assimilation. The root-mean-square error is significantly reduced from 102 to 27 g m−2.
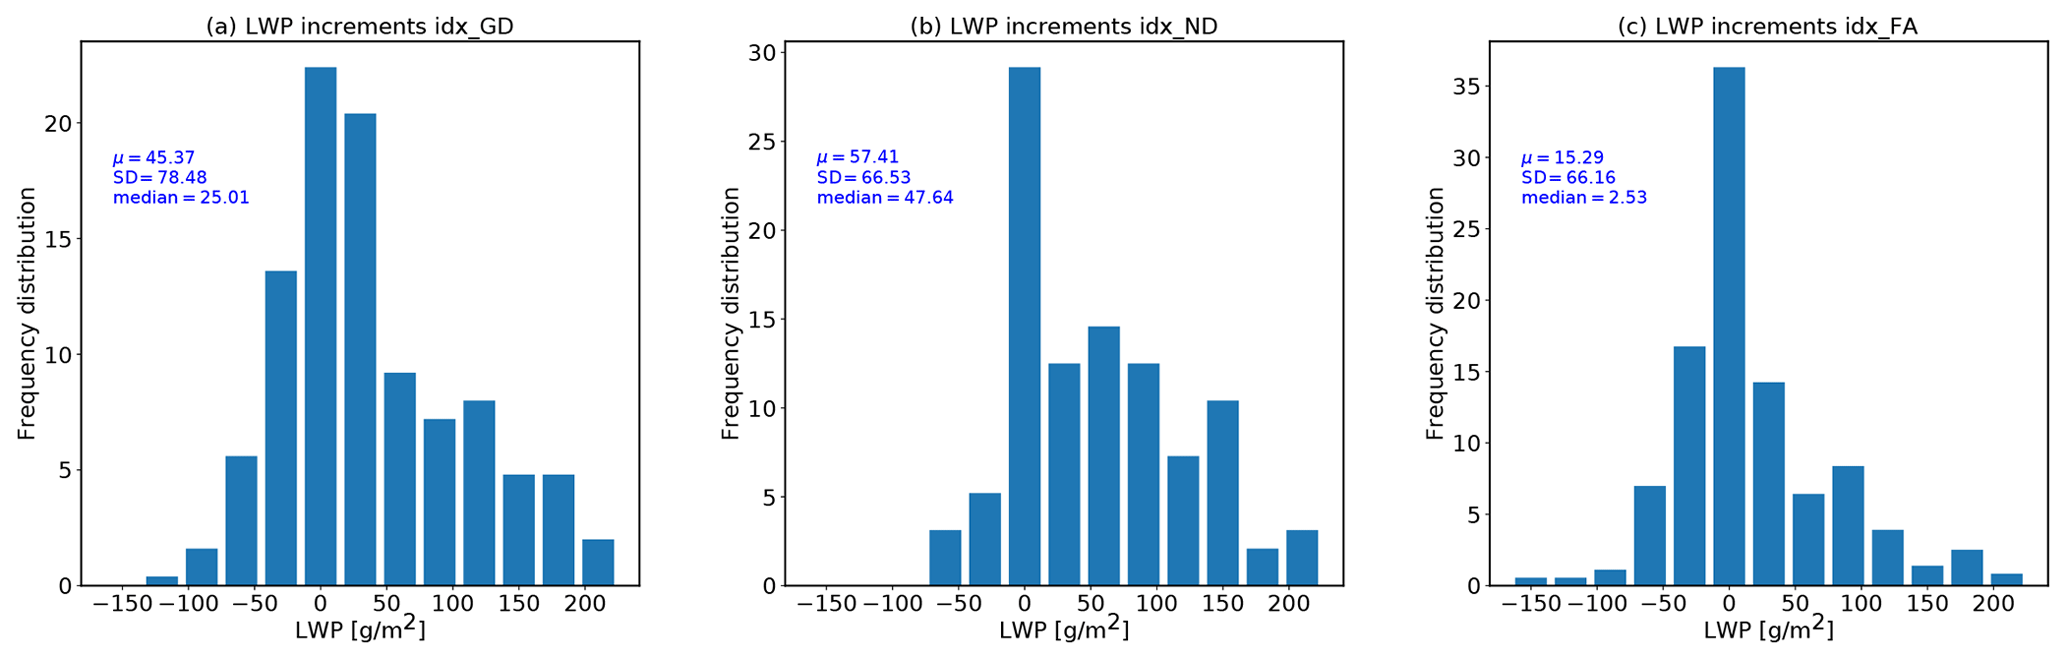
Figure 10 Frequency distributions of 1D-Var LWP increments (g m−2). Statistics performed over 255 profiles of good fog detection (a), 95 profiles of undetected fog (b) and 368 profiles of false alarms (c).
The same evaluation has been carried out on the IWV (Figs. 11 and 12). Since MWRs are more sensitive to column integral than vertical distribution, a more significant impact is expected on IWV than specific humidity profiles. The IWV increments span from −4 to 4 kg m−2, which correspond to a change in the background IWV of up to 30 %. The distribution of IWV increments is positively skewed for correct fog detection, meaning that the largest increments in magnitude are observed when the background underestimates the integrated water vapour content. On the contrary, it is negatively skewed for missed fog profiles, meaning that the largest increments occur when the model overestimates the integrated water vapour content. It is more symmetric in the case of false alarms. The correlation coefficient with respect to the MWR multichannel retrieval (Fig. 12) is slightly increased from 0.97 to 1. The RMSE is improved from 1.30 to 0.71 kg m−2. The impact of MWR observations is thus positive on IWV, though the good quality of AROME humidity forecast leaves little room for improvement. This could be explained by the assimilation of observations sensitive to the total column water vapour like Global Navigation Satellite System (GNSS) zenith total delay. Further investigation on multiple sites would be needed to confirm this hypothesis.
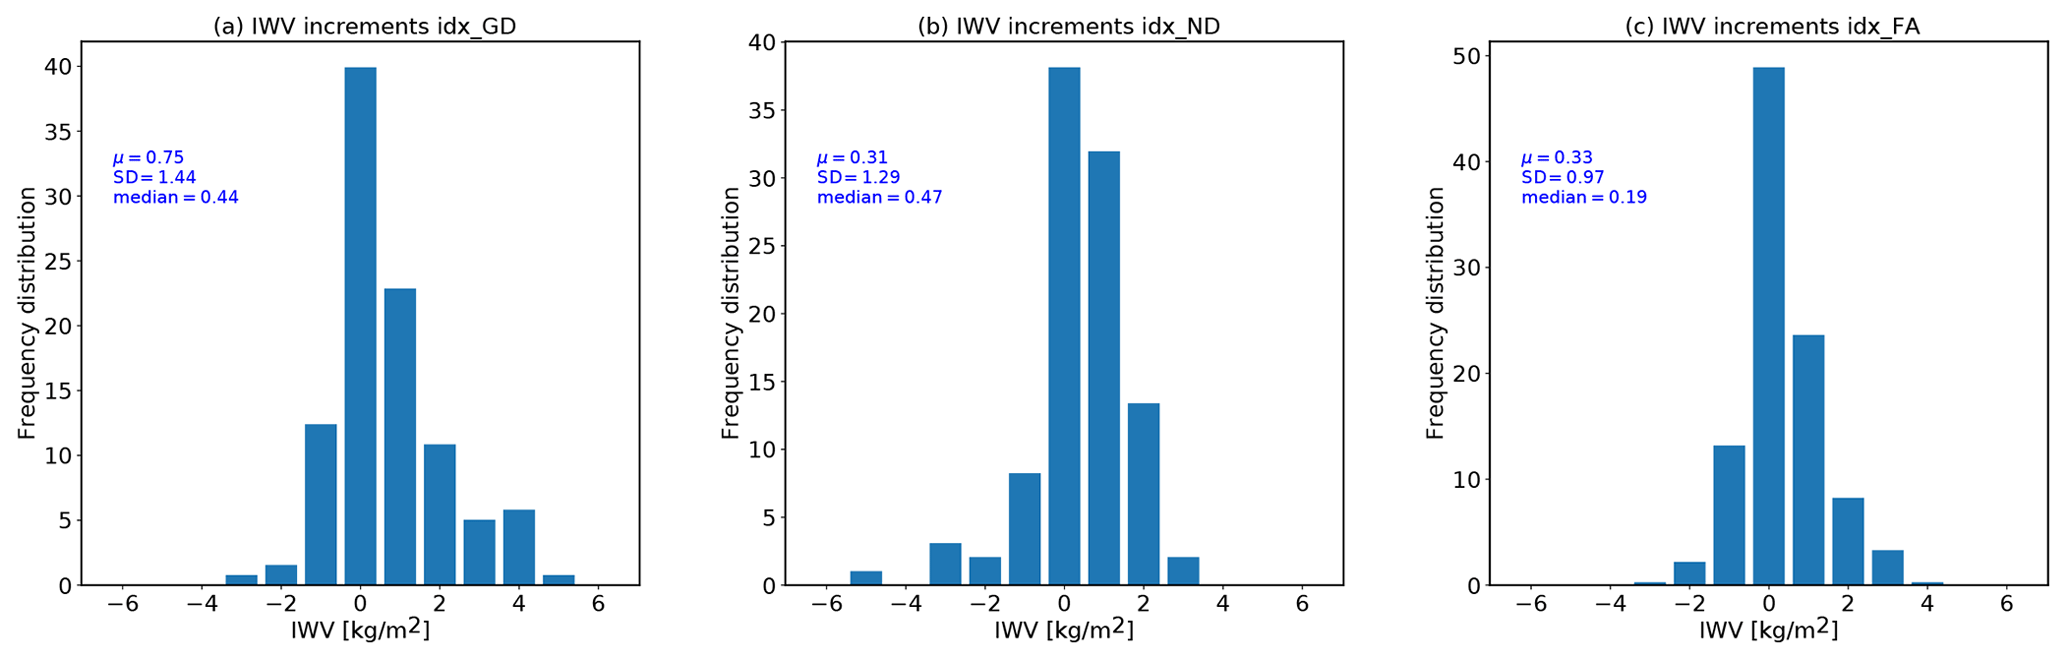
Figure 11 Frequency distributions of 1D-Var IWV increments (kg m−2). Statistics performed over 255 profiles of good fog detection (a), 95 profiles of undetected fog (b) and 368 profiles of false alarms (c).

Figure 12 Scatterplot between a multichannel regression based on MWR observations (y axis) and the background forecast by AROME (red dots) or the 1D-Var analysis (blue dots) for LWP (a) and IWV (b). Statistics performed over 351 observed fog profiles.
The next natural step of this study would be to calculate updated scores of fog detections with the new 1D-Var analyses compared to the background profiles. However, forecast scores are only based on the LWC at ground, whereas the 1D-Var works on the liquid water path without information on the cloud vertical structure. During false alarms, conclusions on the impact on forecast scores are complexified by the presence of cloud layers above fog in a majority of false alarms, which can cause an increase in LWC at ground. As for the hit ratio, it is increased from 73 % in the background to 81 % in the analysis. The rate of missed fog events is also decreased from 27 % in the background to 19 % in the 1D-Var analysis. However, as this evaluation is only based on the LWC change at the ground, it is necessary to evaluate the impact of the new temperature and humidity fields on the LWC after a few time steps of forecasts, but this is beyond the scope of this paper. This investigation into the forecast impact will be studied in the future within the framework of the SOFOG3D experiment (Sect. 6).
This study has proved MWRs to be potential good candidates to be assimilated into current mesoscale models with a special focus on fog forecast improvement. However, our conclusions are currently limited by the small dataset (only one winter at one site) and the lack of impact studies on fog forecast. Although, a positive impact is expected on the analysis of the ABL temperature profile and the LWP and, to a smaller extent, to the IWV; the next step will be to quantify the impact of a more accurate initial state on fog forecast capability. Among the huge number of observations currently assimilated into operational models, the assimilation of only one MWR unit would probably not be efficient to effectively constrain the boundary layer in the model analysis and to keep the valuable information brought by this local observation over the forecast range. In order to go further into this evaluation, the deployment of a dense network of MWRs is necessary to perform a data assimilation study into the operational AROME 3D-Var assimilation system. Thanks to the strong European collaboration built in the framework of the COST Action TOPROF (https://www.cost.eu/actions/ES1303/#tabs|Name:overview, last access: 17 November 2020), pursued by the COST Action PROBE (PROfiling the atmospheric Boundary layer at European scale; Cimini et al., 2020), an unprecedented regional-scale network of eight MWR units has been deployed in the south-west of France during the period October 2019 to April 2020. This work will serve the data assimilation experiment, fog process studies and model evaluation of the international SOFOG3D (SOuth FOGs 3D experiment for fog processes study) experiment led by Météo-France. Figure 13 shows the domain of the dedicated 500 m horizontal resolution AROME version in test for evaluation during SOFOG3D and the location of the eight MWR units deployed for the experiment. MWR locations have been chosen for an homogeneous spread over the AROME domain at sites known for their high frequency of fog occurrence. An increased density of MWRs is found at the super-site with two co-located MWRs and a third humidity profiler deployed approximately 7 km away from the super-site to document the impact of surface heterogeneities on fog characteristics. The methodology introduced in this paper will be extended to the eight MWRs deployed during SOFOG3D. This large dataset will help with quantifying the spatio-temporal variability of fog parameters (thermodynamics and microphysics) between the different sites; better understand the main processes playing a role in fog formation, dissipation, and development; and run real data assimilation experiments using the operational 3D-Var assimilation scheme of the AROME model to quantify the expected fog forecast improvement thanks to ground-based MWRs.
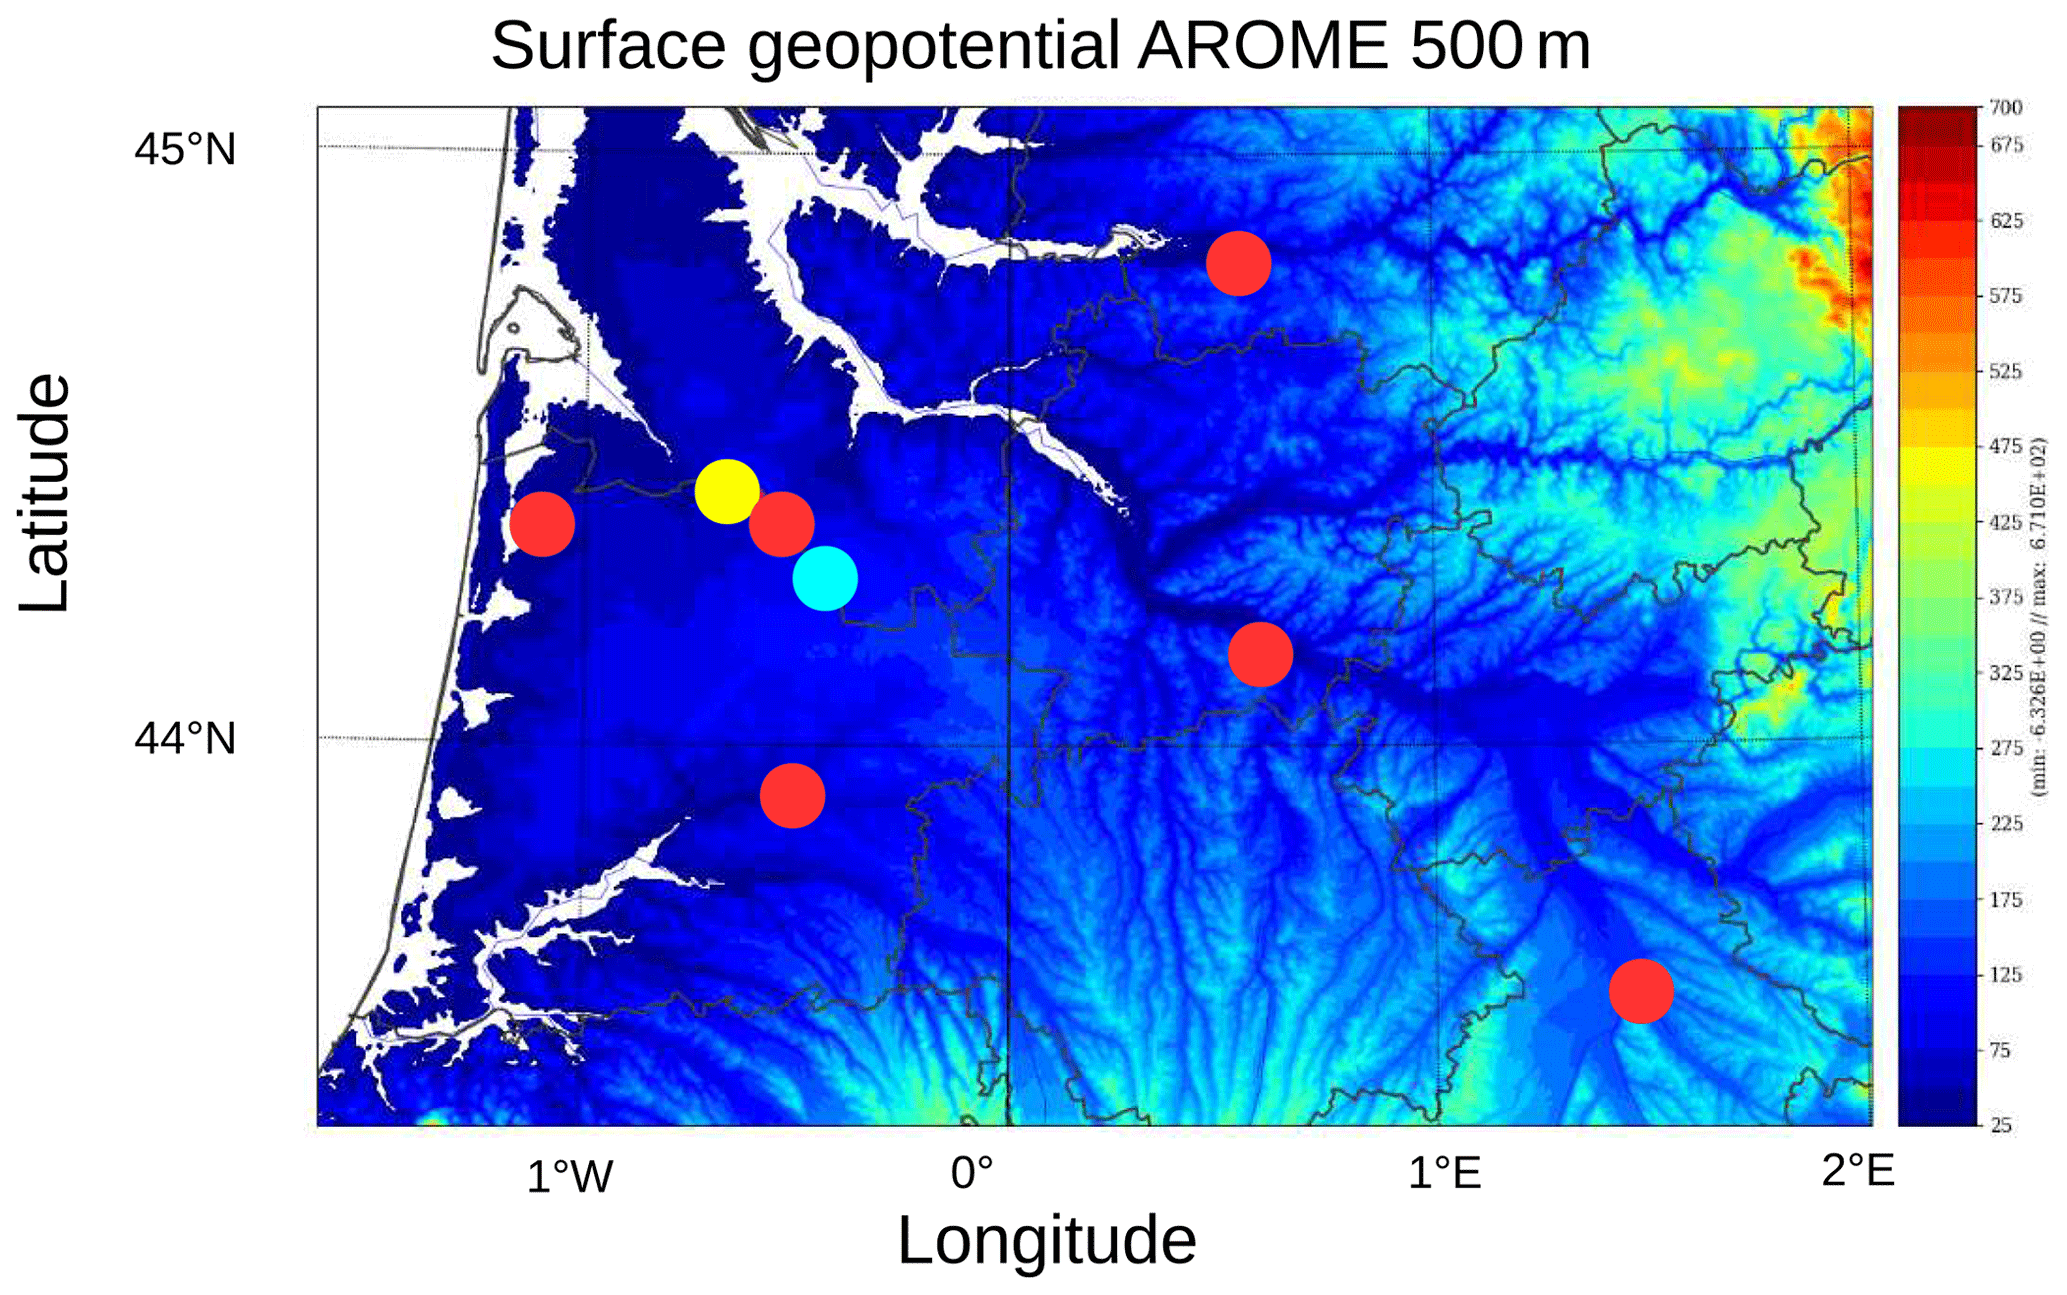
Figure 13 Surface geopotential and domain of the AROME 500m dedicated to the SOFOG3D experiment. Locations of the MWR sites are shown with the filled circles (red indicate temperature and humidity profilers, yellow only humidity retrievals and cyan only temperature retrievals.)
In this study, the expected benefit of ground-based MWRs on NWP analyses during fog conditions has been investigated with a 1D-Var technique. Temperature, humidity and LWP have been retrieved through the optimal combination of short-term forecasts and MWRs brightness temperatures. In this study, a new retrieval algorithm, combining the NWPSAF 1D-Var and the fast radiative transfer model RTTOV-gb, has been evaluated on a 6-month period spanning 351 h of fog conditions. The first part of this work aimed at deriving an optimal background-error-covariance matrix for fog conditions with the use of the newly developed AROME EDA. Similarly to Ménétrier and Montmerle (2011), background-error standard deviations were found to be approximately 40 % larger within the first 250 m for temperature compared to a commonly used climatological B matrix. For specific humidity, similar standard deviations were observed. Most of the differences between a climatological B matrix and a fog B matrix were observed in the cross-correlations between temperature and specific humidity, with a strong positive coupling within the fog layer and uncoupling between the fog layer and atmospheric layers above. The impact of the B matrix and bias correction has been investigated through a statistical evaluation of the retrieval accuracy with respect to the in situ measurements on the instrumented tower at 50 and 120 m altitude. The optimal configuration has been defined through the definition of the error reduction brought by the analysis over the background for each variable (temperature and specific humidity) and each altitude. The best scenario mimics the use of a “flow-dependent” B matrix by using a cross-correlated fog B matrix when fog is detected by visibility measurements and an uncorrelated climatological B matrix during the other conditions. The retrievals of specific humidity at 120 m altitude are the most impacted: contrary to the significant degradation of the background by around 20 % with a suboptimal B matrix, an improvement of 21 % of the background is obtained with an optimal B matrix. This demonstrates the crucial role of the B matrix cross-correlations when assimilating observations with low information content on the vertical structure. Consequently, the ongoing development of a 3D-EnVar scheme for the AROME model (Montmerle et al., 2018) is a necessary step to optimally assimilate MWR observations into the AROME model. The use of a static bias correction based on the monitoring of observation minus background innovations was also evaluated. Biases of less than 0.5 K were observed for K-band and opaque V-band channels and up to −4.7 K for the most transparent V-band channels. The found bias is similar to previous studies; its correction applied to BT measurements improves humidity retrievals above 2000 m but degrades temperature retrievals in the first 200 m. This degradation is most likely due to well-known larger model errors in the boundary layer during stable conditions, which are incorrectly included in the bias correction. Restricting the computation of the bias correction to clear-sky unstable conditions was found to remove most of the degradation. Overall, with the best configuration (flow-dependent fog B matrix and no bias correction for most opaque channels), temperature and humidity profiles could be retrieved with RMSE below 1.6 K and 1 g kg−1 up to 6 km in the troposphere.
A thin radiative fog sampled during the first IOP of the experiment was then described. For this specific case, the AROME model was found to simulate a temporally longer and vertically thicker fog event and is not able to maintain the stratus cloud in the afternoon. After 1D assimilation of MWR observations, a large warming up to 5 K is observed within the first 500 m during the fog event associated with an increase in specific humidity and a decrease of LWP by 40 to 70 g m−2 consistent with in situ measurements showing the large impact brought by MWR observations to modify the initial state of the model in fog conditions.
Finally, a statistical evaluation of the expected model increments after assimilating MWR measurements has been conducted using tower measurements. Large forecast errors were observed in the AROME backgrounds with a tendency to overestimate the presence of fog. During missed fog profiles, 1D-Var increments pull towards lower temperatures close to the ground and higher temperatures above 100 m altitude, i.e. higher atmospheric stability. The largest analysis increments and background errors are observed during false alarms when the AROME forecasts tend to significantly overestimate the temperature cooling. Overall, RMSE values from 1.3 to 1.9 K are observed in the background against 0.6 K in the analysis. For specific humidity, analysis increments are small and below 1 g kg−1 within the fog layer. On the contrary, a large impact has been found on the LWP with increments up to 200 g m−2 in extreme missed fog events. A larger impact was found on the IWV than the humidity profile with a RMSE with respect to tower measurements that decreased from 1.3 to 0.7 kg m−2 during observed fog profiles. However, it was noted that the AROME backgrounds are more accurate for the IWV compared to temperature and LWP, which leaves less chances for improvement.
Using for the first time the RTTOV-gb fast radiative transfer model, this study investigated the impact of assimilating MWR observations in the AROME model during fog conditions. This evaluation, previously limited to temperature profiles only, was extended to humidity and LWP. Promising results are shown, with significant positive impact on temperature and LWP and small but slightly positive impact on humidity. In order to confirm the results obtained in a 1D-Var framework, the next step is now to assimilate a real network of ground-based MWRs through a 3D-Var or 3D-EnVar data assimilation scheme. Following the recommendations of Caumont et al. (2016) and thanks to the strong European collaboration built within the TOPROF and PROBE COST Actions, eight MWRs have been deployed in the south-west of France from October 2019 to April 2020 in the context of the international fog campaign SOFOG3D. The locations of the MWR units have been chosen to optimize their impact in the model specifically for fog forecast evaluation. A 1D-Var plus 3D-EnVar approach will be used to assimilate profiles retrieved through the 1D-Var algorithm presented here, taking the most out of the lessons learnt in this work.
AROME forecasts are available on request to pauline.martinet@meteo.fr. Instrumental data are available on request to frederic.burnet@meteo.fr.
PM supervised the MWR deployment during the field experiment, processed all the data, led the scientific analysis and wrote the paper. DC participated in the development of the 1D-Var algorithm and scientific analysis of the results. FB supervised the field experiment and participated in the scientific analysis of the results. VU was in charge of the technical deployment of the MWR during the experiment. BM developed and provided the support for the software used to derive background-error-covariance matrices from ensemble data assimilation. YM provided the AROME ensemble data assimilation outputs to compute the background-error-covariance matrix and participated in the redaction of Sect. 3.1.
The authors declare that they have no conflict of interest.
This article is part of the special issue “Tropospheric profiling (ISTP11) (AMT/ACP inter-journal SI)”. It is a result of the 11th edition of the International Symposium on Tropospheric Profiling (ISTP), Toulouse, France, 20–24 May 2019.
This article is based upon work from COST Actions ES1303 (TOPROF) and CA18235 (PROBE), supported by COST (European Cooperation in Science and Technology) – http://www.cost.eu (last access: 17 November 2020). The authors thank ANDRA for providing access to the atmospheric platform observations. The deployment of the SOFOG3D MWR network was funded by the ANR SOFOG3D (SOuth west FOGs 3D experiment for processes study, ANR-18-CE01-0004). Thomas Rieutord is thanked for helpful discussions on statistical analysis. Yann Seity is thanked for providing the map of the AROME 500 m domain. We acknowledge the helpful comments from two anonymous reviewers to improving the article.
This research has been supported by COST Actions (TOPROF (grant no. ES1303) and PROBE (grant no. CA18235)), and ANR (grant no. ANR-18-CE01-0004 SOFO3D).
This paper was edited by E. J. O'Connor and reviewed by two anonymous referees.
Barker, D. M., Huang, W., Guo, Y.-R., Bourgeois, A., and Xiao, Q.: A three-dimensional variational data assimilation system for MM5: Implementation and initial results, Mon. Weather Rev., 132, 897–914, 2004. a
Bergot, T. and Guedalia, D.: Numerical forecasting of radiation fog. Part I: Numerical model and sensitivity tests, Mon. Weather Rev., 122, 1218–1230, 1994. a
Bergot, T., Carrer, D., Noilhan, J., and Bougeault, P.: Improved site-specific numerical prediction of fog and low clouds: A feasibility study, Weather Forecast., 20, 627–646, 2005. a
Brousseau, P., Berre, L., Bouttier, F., and Desroziers, G.: Background-error covariances for a convective-scale data-assimilation system: AROME–France 3D-Var, Q. J. Roy. Meteor. Soc., 137, 409–422, 2011. a
Brousseau, P., Seity, Y., Ricard, D., and Léger, J.: Improvement of the forecast of convective activity from the AROME-France system, Q. J. Roy. Meteor. Soc., 142, 2231–2243, https://doi.org/10.1002/qj.2822, 2016. a, b
Caumont, O., Cimini, D., Löhnert, U., Alados-Arboledas, L., Bleisch, R., Buffa, F., Ferrario, M. E., Haefele, A., Huet, T., Madonna, F., and Pace, G.: Assimilation of humidity and temperature observations retrieved from ground-based microwave radiometers into a convective-scale NWP model, Q. J. Roy. Meteor. Soc., 142, 2692–2704, 2016. a, b
Cimini, D., Hewison, T. J., Martin, L., Güldner, J., Gaffard, C., and Marzano, F. S.: Temperature and humidity profile retrievals from ground-based microwave radiometers during TUC, Meteorol. Z., 15, 45–56, 2006. a
Cimini, D., Rosenkranz, P. W., Tretyakov, M. Y., Koshelev, M. A., and Romano, F.: Uncertainty of atmospheric microwave absorption model: impact on ground-based radiometer simulations and retrievals, Atmos. Chem. Phys., 18, 15231–15259, https://doi.org/10.5194/acp-18-15231-2018, 2018. a, b
Cimini, D., Hocking, J., De Angelis, F., Cersosimo, A., Di Paola, F., Gallucci, D., Gentile, S., Geraldi, E., Larosa, S., Nilo, S., Romano, F., Ricciardelli, E., Ripepi, E., Viggiano, M., Luini, L., Riva, C., Marzano, F. S., Martinet, P., Song, Y. Y., Ahn, M. H., and Rosenkranz, P. W.: RTTOV-gb v1.0 – updates on sensors, absorption models, uncertainty, and availability, Geosci. Model Dev., 12, 1833–1845, https://doi.org/10.5194/gmd-12-1833-2019, 2019. a
Cimini, D., Haeffelin, M., Kotthaus, S., Löhnert, U., Martinet, P., O'Connor, E., Walden, C., Collaud-Cohen, M., and Preissler, J.: Towards the profiling of the atmospheric boundary layer at European scale – Introducing the COST Action PROBE, Bulletin of Atmospheric Science and Technology, 1, 23–42, https://doi.org/10.1007/s42865-020-00003-8, 2020. a, b, c
Crewell, S. and Löhnert, U.: Accuracy of cloud liquid water path from ground-based microwave radiometry 2. Sensor accuracy and synergy, Radio Sci., 38, 7–1, 2003. a, b
De Angelis, F., Cimini, D., Hocking, J., Martinet, P., and Kneifel, S.: RTTOV-gb – adapting the fast radiative transfer model RTTOV for the assimilation of ground-based microwave radiometer observations, Geosci. Model Dev., 9, 2721–2739, https://doi.org/10.5194/gmd-9-2721-2016, 2016. a
De Angelis, F., Cimini, D., Löhnert, U., Caumont, O., Haefele, A., Pospichal, B., Martinet, P., Navas-Guzmán, F., Klein-Baltink, H., Dupont, J.-C., and Hocking, J.: Long-term observations minus background monitoring of ground-based brightness temperatures from a microwave radiometer network, Atmos. Meas. Tech., 10, 3947–3961, https://doi.org/10.5194/amt-10-3947-2017, 2017. a, b
Dee, D. P. and Da Silva, A. M.: The choice of variable for atmospheric moisture analysis, Mon. Weather Rev., 131, 155–171, 2003. a
Evensen, G.: The Ensemble Kalman Filter: theoretical formulation and practical implementation, Ocean Dynam., 53, 343–367, 2003. a
Fisher, M.: Background error covariance modelling, in: ECMWF Seminar on recent developments in data assimilation for atmosphere and ocean, ECMWF, Shinfield Park, Reading, available at: https://www.ecmwf.int/en/elibrary/9404-background-error-covariance-modelling (last access: 23 November 2020), 2003. a
Guedj, S., Karbou, F., and Rabier, F.: Land surface temperature estimation to improve the assimilation of SEVIRI radiances over land, J. Geophys. Res., 116, D14107, https://doi.org/10.1029/2011JD015776, 2011. a
Gultepe, I., Tardif, R., Michaelides, S., Cermak, J., Bott, A., Bendix, J., Müller, M. D., Pagowski, M., Hansen, B., Ellrod, G., Jacobs, W., Toth, G., and Cober, S. G.: Fog research: A review of past achievements and future perspectives, Pure and Appl. Geophys., 164, 1121–1159, 2007. a
Hartung, D., Otkin, J., Petersen, R., Turner, D., and Feltz, W.: Assimilation of surface-based boundary-layer profiler observations during a cool- season weather event using an observing system simulation experiment. Part II: Forecast assessment, Mon. Weather Rev., 139, 2327–2346, https://doi.org/10.1175/2011MWR3623.1, 2011. a
Hólm, E., Andersson, E., Beljaars, A., Lopez, P., Mahfouf, J.-F., Simmons, A., and Thépaut, J.-N.: Assimilation and Modelling of the Hydrological Cycle: ECMWF's Status and Plans, ECMWF, Technical Memorandum No. 383, 2002. a
Hu, H., Zhang, Q., Xie, B., Ying, Y., Zhang, J., and Wang, X.: Predictability of an advection fog event over North China. Part I: Sensitivity to initial condition differences, Mon. Weather Rev., 142, 1803–1822, 2014. a
Hu, H., Sun, J., and Zhang, Q.: Assessing the impact of surface and wind profiler data on fog forecasting using WRF 3DVAR: an OSSE Study on a dense fog event over North China, J. Appl. Meteorol. Clim., 56, 1059–1081, 2017. a
Illingworth, A. J., Cimini, D., Haefele, A., Haeffelin, M., Hervo, M., Kotthaus, S., Löhnert, U., Martinet, P., Mattis, I., O'Connor, E., and Potthast, R.: How Can Existing Ground-Based Profiling Instruments Improve European Weather Forecasts?, B. Am. Meteorol. Soc., 100, 605–619, 2019. a
Lafore, J. P., Stein, J., Asencio, N., Bougeault, P., Ducrocq, V., Duron, J., Fischer, C., Héreil, P., Mascart, P., Masson, V., Pinty, J. P., Redelsperger, J. L., Richard, E., and de Arellano J., V.-G.: The Meso-NH atmospheric simulation system. Part I: Adiabatic formulation and control simulations, Ann. Geophys., 16, 90–109, 1997. a
Löhnert, U. and Maier, O.: Operational profiling of temperature using ground-based microwave radiometry at Payerne: prospects and challenges, Atmos. Meas. Tech., 5, 1121–1134, https://doi.org/10.5194/amt-5-1121-2012, 2012. a
Mahfouf, J.-F., Ahmed, F., Moll, P., and Teferle, F. N.: Assimilation of zenith total delays in the AROME France convective scale model: a recent assessment, Tellus A, 67, 26106, https://doi.org/10.3402/tellusa.v67.26106, 2015. a
Martinet, P., Dabas, A., Donier, J. M., Douffet, T., Garrouste, O., and Guillot, R.: 1D-Var temperature retrievals from microwave radiometer and convective scale model, Tellus A, 67, 27925, https://doi.org/10.3402/tellusa.v67.27925, 2015. a, b, c, d
Martinet, P., Cimini, D., De Angelis, F., Canut, G., Unger, V., Guillot, R., Tzanos, D., and Paci, A.: Combining ground-based microwave radiometer and the AROME convective scale model through 1DVAR retrievals in complex terrain: an Alpine valley case study, Atmos. Meas. Tech., 10, 3385–3402, https://doi.org/10.5194/amt-10-3385-2017, 2017. a, b, c, d, e
Maschwitz, G., Löhnert, U., Crewell, S., Rose, T., and Turner, D. D.: Investigation of ground-based microwave radiometer calibration techniques at 530 hPa, Atmos. Meas. Tech., 6, 2641–2658, https://doi.org/10.5194/amt-6-2641-2013, 2013. a, b
Mazoyer, M., Burnet, F., Denjean, C., Roberts, G. C., Haeffelin, M., Dupont, J.-C., and Elias, T.: Experimental study of the aerosol impact on fog microphysics, Atmos. Chem. Phys., 19, 4323–4344, https://doi.org/10.5194/acp-19-4323-2019, 2019. a
Ménétrier, B. and Montmerle, T.: Heterogeneous background-error covariances for the analysis and forecast of fog events, Q. J. Roy. Meteor. Soc., 137, 2004–2013, 2011. a, b, c, d, e
Michel, Y., Auligné, T., and Montmerle, T.: Heterogeneous convective-scale background error covariances with the inclusion of hydrometeor variables, Mon. Weather Rev., 139, 2994–3015, 2011. a
Montmerle, T. and Faccani, C.: Mesoscale assimilation of radial velocities from Doppler radars in a preoperational framework, Mon. Weather Rev., 137, 1939–1953, 2009. a
Montmerle, T., Michel, Y., Arbogast, E., Ménétrier, B., and Brousseau, P.: A 3D ensemble variational data assimilation scheme for the limited-area AROME model: Formulation and preliminary results, Q. J. Roy. Meteor. Soc., 144, 2196–2215, https://doi.org/10.1002/qj.3334, 2018. a
Otkin, J., Hartung, D., Turner, D., Petersen, R., Feltz, W., and E, J.: Assimilation of surface-based boundary layer profiler observations during a cool-season weather event using an observing system simulation experiment. Part I: Analysis impact, Mon. Weather Rev., 139, 2309–2326, https://doi.org/10.1175/2011MWR3622.1, 2011. a
Pergaud, J., Masson, V., Malardel, S., and Couvreux, F.: A parameterization of dry thermals and shallow cumuli for mesoscale numerical weather prediction, Bound.-Lay. Meteorol., 132, 83–106, 2009. a
Philip, A., Bergot, T., Bouteloup, Y., and Bouyssel, F.: The impact of vertical resolution on fog forecasting in the kilometric-scale model arome: a case study and statistics, Weather Forecast., 31, 1655–1671, 2016. a
Pinty, J. and Jabouille, P.: A mixed-phase cloud parameterization for use in mesoscale non-hydrostatic model: simulations of a squall line and of orographic precipitations, in: Conf. on Cloud Physics, Amer. Meteor. Soc Everett, WA, 217–220, 1998. a
Raynaud, L. and Bouttier, F.: Comparison of initial perturbation methods for ensemble prediction at convective scale, Q. J. Roy. Meteor. Soc., 142, 854–866, 2015. a
Raynaud, L., Berre, L., and Desroziers, G.: An extended specification of flow-dependent background error variances in the Météo-France global 4D-Var system, Q. J. Roy. Meteor. Soc., 137, 607–619, https://doi.org/10.1002/qj.795, 2011. a
Rodgers, C. D.: Inverse methods for atmospheric sounding: theory and practice, vol. 2, World Scientific, 2000. a
Rose, T., Crewell, S., Löhnert, U., and Simmer, C.: A network suitable microwave radiometer for operational monitoring of the cloudy atmosphere, Atmos. Res., 75, 183–200, 2005. a
Seity, Y., Brousseau, P., Malardel, S., Hello, G., Bénard, P., Bouttier, F., Lac, C., and Masson, V.: The AROME-France convective-scale operational model, Mon. Weather Rev., 139, 976–991, 2011. a
Tav, J., Masson, O., Burnet, F., Paulat, P., Bourrianne, T., Conil, S., and Pourcelot, L.: Determination of Fog-Droplet Deposition Velocity from a Simple Weighing Method, Aerosol Air Qual. Res., 18, 103–113, 2018. a
Vandenberghe, F. and Ware, R.: 4-dimensional variational assimilation of ground-based microwave observations during a winter fog event, in: Proceedings International Symposium on Atmospheric Sensing with GPS, Tsukuba Japan, 14–17 January 2002. a
Wattrelot, E., Caumont, O., and Mahfouf, J.-F.: Operational implementation of the 1D+ 3D-Var assimilation method of radar reflectivity data in the AROME model, Mon. Weather Rev., 142, 1852–1873, 2014. a
Zagar, N., Andersson, E., and Fisher, M.: Balanced tropical data assimilation based on a study of equatorial waves in ECMWF short-range forecast errors, Q. J. Roy. Meteor. Soc., 131, 987–1011, https://doi.org/10.1256/qj.04.54, 2005. a
- Abstract
- Introduction
- Dataset and methodology
- Evaluation of 1D-Var retrievals
- Thin radiative fog case study
- The 6-month statistics
- A regional-scale MWR network for fog process studies: the SOFOG3D experiment
- Conclusions
- Data availability
- Author contributions
- Competing interests
- Special issue statement
- Acknowledgements
- Financial support
- Review statement
- References