the Creative Commons Attribution 4.0 License.
the Creative Commons Attribution 4.0 License.
 | 22 Nov 2023
MIPAS ozone retrieval version 8: middle-atmosphere measurements
Maya García-Comas
Bernd Funke
Thomas von Clarmann
Norbert Glatthor
Udo Grabowski
Sylvia Kellmann
Michael Kiefer
Alexandra Laeng
Andrea Linden
Gabriele P. Stiller
We present a new version of O3 data retrieved from the three Michelson Interferometer for Passive Atmospheric Sounding (MIPAS) observation modes that we refer to for simplicity as the modes of the middle atmosphere (middle atmosphere, MA; upper atmosphere, UA; and noctilucent cloud, NLC). The O3 profiles cover altitudes from 20 up to 100 km for the daytime and up to 105 km at nighttime, for all latitudes, and the period 2005 until 2012. The data have been obtained with the IMK–IAA (Institute of Meteorology and Climate Research and Instituto de Astrofísica de Andalucía) MIPAS level-2 data processor and are based on ESA version-8 re-calibrated radiance spectra with improved temporal stability. The processing included several improvements with respect to the previous version, such as the consistency of the microwindows and spectroscopic data with those used in the nominal-mode V8R data, the O3 a priori profiles, and updates of the non-local thermodynamic equilibrium (non-LTE) parameters and the nighttime atomic oxygen. In particular, the collisional relaxation of O3(v1,v3) by the atomic oxygen was reduced by a factor of 2 in order to obtain a better agreement of nighttime mesospheric O3 with “non-LTE-free” measurements. Random errors are dominated by the measurement noise with 1σ values for single profiles for the daytime of < 5 % below ∼ 60 km, 5 %–10 % between 60 and 70 km, 10 %–20 % at 70–90 km, and about 30 % at 95 km. For nighttime, they are very similar below 70 km but smaller above (10 %–20 % at 75–95 km, 20 %–30 % at 95–100 km and larger than 30 % above 100 km). The systematic error is ∼ 6 % below ∼ 60 km (dominated by uncertainties in spectroscopic data) and 8 %–12 % above ∼ 60 km, mainly caused by non-LTE uncertainties. The systematic errors in the 80–100 km range are significantly smaller than in the previous version. The major differences with respect to the previous version are as follows: (1) the new retrievals provide O3 abundances in the 20–50 km altitude range that are larger by about 2 %–5 % (0.2–0.5 ppmv); (2) O3 abundances were reduced by ∼ 2 %–4 % between 50 and 60 km in the tropics and mid-latitudes; (3) O3 abundances in the nighttime O3 minimum just below 80 km were reduced, leading to a more realistic diurnal variation; (4) daytime O3 concentrations in the secondary maximum at the tropical and middle latitudes (∼ 40 %, 0.2–0.3 ppmv) were larger; and (5) nighttime O3 abundances in the secondary maximum were reduced by 10 %–30 %. The O3 profiles retrieved from the nominal mode (NOM) and the middle-atmosphere modes are fully consistent in their common altitude range (20–70 km). Only at 60–70 km does daytime O3 of NOM seem to be larger than that of MA/UA by 2 %–10 %. Compared to other satellite instruments, MIPAS seems to have a positive bias of 5 %–8 % below 70 km. Noticeably, the new version of MIPAS data agrees much better than before with all instruments in the upper mesosphere–lower thermosphere, reducing the differences from 20 % to 10 %. Further, the diurnal variation in O3 in the upper mesosphere (near 80 km) has been significantly improved.
- Article
(25228 KB) - Full-text XML
-
Supplement
(2139 KB) - BibTeX
- EndNote


Ozone is an essential variable of the atmosphere. In addition to absorbing the harmful solar UV radiation, it also plays key roles in the energy balance and chemistry of the middle and upper atmosphere (Brasseur and Solomon, 2005). Because of its importance, it has been extensively measured in the stratosphere and the mesosphere using different techniques. Kaufmann et al. (2003) and Smith et al. (2013) have provided very comprehensive reviews of O3 observations; the former focused on those carried out before 2003, and the latter concentrated on the satellite observations performed more recently. Measurements that cover the three typical ozone maxima and, simultaneously, O3 diurnal variation with global latitudinal coverage are, however, scarce.
The Michelson Interferometer for Passive Atmospheric Sounding (MIPAS), a high-spectral-resolution limb sounder on board the Envisat satellite, measured the atmospheric O3 from March 2002 until April 2012. The MIPAS interferometer had a spectral coverage of 4.1 to 14.7 µm (685–2410 cm−1) and a very high spectral resolution. It was operated at 0.025 cm−1 during 2002–2004 and at 0.0625 cm−1 from 2005 until April 2012, scanning the atmosphere from pole to pole during the day (10:00 local time (LT; the time zone for all instances in the text is LT)) and night (22:00) (Fischer et al., 2008). As its major objective was to understand the stratospheric chemistry and dynamics, most of the time it observed the 6–68 km altitude range (the so-called nominal mode or “NOM”). However, mainly after 2005, it also regularly pointed to higher altitudes in its middle-atmosphere (MA), noctilucent-cloud (NLC) and upper-atmosphere (UA) measurement modes (De Laurentis, 2005; Oelhaf, 2008).
The retrieval of ozone from the NOM mode has been carried out, among others, by the Institute of Meteorology and Climate Research and Instituto de Astrofísica de Andalucía (IMK–IAA) (Glatthor et al., 2006), and the most recent retrieval version from level-1b V8.03 MIPAS spectra is described by Kiefer et al. (2023). The retrieval of O3 from the MIPAS middle- and upper-atmosphere modes (including MA, UA and NLC), version V5R_O3_m22,1 has been reported by López-Puertas et al. (2018). The major difference between the retrievals of the NOM and the middle-/upper-atmosphere modes is the necessity of incorporating accurate non-local thermodynamic equilibrium (non-LTE) into the radiative transfer calculations for the latter.
In 2018, a new version of MIPAS level-1b spectra became available, V8.03. This version supersedes the preceding versions. In particular, version 5, the latest used in the middle-/upper-atmosphere retrievals, suffered from an inadequate non-linearity correction of the gain calibration that led to an artificial drift in ozone (Eckert et al., 2014; Kiefer et al., 2023). For that reason, together with the fact that this version would possibly be the last one for some time, we reprocessed the MIPAS middle- and upper-atmosphere O3 data. Thus, this paper aims to document the new ozone dataset, V8R_O3_m61, covering measurements recorded in the MA, UA and NLC measurement modes. For simplicity, we refer to all three of these datasets as “MIPAS middle-atmosphere” data. They cover the period from 2005 to 2012 and the altitude ranges of 20–102 km for MA, 40–102 km for UA and 40–102 km for NLC.
The characteristics of the new level-1b V8.03 spectra are discussed in Kleinert et al. (2018) and Kiefer et al. (2021). The retrieval method of the O3 middle-atmosphere observations has already been described in Gil-López et al. (2005) and López-Puertas et al. (2018). In this version, we have also improved and updated the O3 retrieval in several respects (see Sect. 2). Some of the updates are common to the O3 retrieved from the nominal-mode measurements, obtained up to ∼ 70 km (Kiefer et al., 2023). Others are more specific to the MA, UA and NLC modes and are based mainly on the systematic differences found in the validation of V5R_O3_m22 O3 data (López-Puertas et al., 2018). These updates include the O3 a priori data, the revision of the non-LTE processes and the atomic oxygen concentration during the nighttime. We should note that having in mind the possible future merging of the middle-atmosphere and NOM O3 data, whenever possible we have maintained the same retrieval setup as in the O3 NOM dataset. A comparison of the new results with the previous version V5R_O3_m22 is presented in Sect. 5, and the consistency between the NOM and MA V8R data is presented in Sect. 6.
A comparison of the middle-atmosphere MIPAS O3 data with respect to other satellite data (SABER, GOMOS, MLS, SMILES and ACE-FTS) has been redone, including the more recent available versions of ACE-FTS and MLS (see Sect. 7).
The MIPAS middle-atmosphere V8R_O3_m61 O3 retrieval is based on a constrained non-linear least squares fitting of limb radiances. It is performed by using the IMK–IAA level-2 scientific processor (von Clarmann et al., 2003, 2009) supplemented with the algorithm GRANADA (Generic RAdiative traNsfer AnD non-LTE population Algorithm; Funke et al., 2012) to account for non-LTE emissions. The different aspects of the retrieval, including the basic equations, error estimates, averaging kernels, the iteration and convergence criteria, and the regularization method, are described in von Clarmann et al. (2003, 2009) with recent updates in Kiefer et al. (2021, 2023). The details of the retrieval under non-LTE conditions are described by Funke et al. (2001) and the detailed non-LTE model for the O3 vibrational levels in López-Puertas et al. (2018).
As mentioned above, the major motivation of this version of O3 middle-atmosphere data is the availability of the new level-1b radiance spectra of ESA, version 8.03, hereafter “V8”, while in the previous version, we used version V5 (5.02/5.06) of the ESA-calibrated spectra. The major changes applied to ESA V8 level-1b data are described in Kiefer et al. (2021, 2023). One of the major improvements is a better calibration introduced by a more adequate correction of the detector's non-linearities in the gain calibration. Time series of O3 retrieved in the previous version V5R were shown to be affected by unrealistically large and negative drifts (Eckert et al., 2014; Hubert et al., 2020). The drifts of the ozone interim version 7, based on level-1 data that already accounted for a more adequate treatment of the gain calibration, were partially reduced but over-corrected (Laeng et al., 2018). The use of level-1b V8 spectra is expected to ameliorate this.
We recall that the MIPAS spectra used here, taken in the MA, UA and NLC modes, cover limb tangent heights of 20–102 km at 3 km steps for MA, of 42–172 km at 3 km steps below 102 km and at 5 km above for UA, and of 39–102 km with 3 km steps in the 39–78 km and 87–102 km ranges and 1.5 km at 78–87 km for the NLC mode (De Laurentis, 2005; Oelhaf, 2008).2 The MIPAS horizontal field of view (FOV) is approximately 30 km, and the vertical field of view is ∼ 3 km. All the measurements in the MA, UA and NLC modes were taken at the “reduced” spectral resolution (before apodization) of 0.0625 cm−1, and for clarity, we add “R” to the level-1b version, e.g. “V8R” and “V5R”.
2.1 Retrieval updates common to the nominal and middle-atmosphere measurement modes
Many of the updates applied to the ozone retrieval from the nominal-mode measurements (Kiefer et al., 2023) apply also to the middle-atmosphere retrievals presented here. For completeness, they are briefly described in this section. Those more specific to the middle-atmosphere modes (MA, UA, NLC) are described in Sect. 2.2.
2.1.1 Retrieved temperatures
Following the usual sequence of retrieval steps, the temperature and the tangent altitude information retrieved in a previous step from V8R spectra are included in the O3 retrieval. This version of the temperature retrieval includes, in addition to the level-1b spectra, several updates and improvements with respect to the V5R version. Among them, the most important are as follows: the a priori temperature above 43 km (updated from NRLMSISE-00 to SD-WACCM4), the atomic oxygen (updated from the NRLMSISE-00 model to the SD-WACCM4 model at MIPAS geolocations and corrected with MIPAS V5R climatology) and the CO2 concentration now taken from the SD-WACCM4 climatology (see Kiefer et al., 2021, and García-Comas et al., 2023, for more details).
In nominal-mode retrievals, where high-altitude temperatures depend largely on a priori assumptions, the new temperature retrieval led to a significant improvement in polar lower-mesosphere O3 during large stratospheric warnings (Kiefer et al., 2023). This effect, however, is small in the current MA-mode O3, because in this mode the retrieved temperature at higher altitudes does not depend that much on a priori assumptions.
A further improvement of the preceding retrieval of temperature in V8R is the inclusion of its variability along the line of sight (LOS). This was considered by including an a priori 3D field with its horizontal structure provided by a priori information and its vertical structure scaled by the retrieved temperature (Kiefer et al., 2021). Following our sequential retrieval approach, the resulting 3D temperature field was used in the forward calculations of O3 limb radiances. Likewise, this temperature field was used to correct the non-LTE populations along the LOS. In the previous O3 version, the variations in temperature along the LOS were implemented more approximately by retrieving a linear horizontal temperature gradient around the tangent point (Kiefer et al., 2021).
2.1.2 Background continuum, radiance offset and water vapour interference
The IMK–IAA processor retrieves, jointly with the O3 abundance, a background continuum radiation and a zero-level calibration offset. Both the continuum and the offset are retrieved at each microwindow (MW) and altitude.
The uppermost altitude of the continuum retrieval has been extended from 50 to 60 km. The background continuum is strongly constrained to zero above 60 km (we used 50 km in the previous version), and the vertical-offset profiles for the microwindows in band A (MW nos. 1–30) and band AB (MW nos. 31–38) (see Table A1) are strongly regularized towards the a priori values taken from the empirically determined offset correction profiles by Kleinert et al. (2018). See more details in Kiefer et al. (2023).
Further, in this version, the abundance of H2O is also jointly retrieved with those parameters. This is done in order to avoid the propagation of uncertainties in the a priori H2O. Note, however, that these jointly retrieved H2O profiles are not used further because they are of sub-optimal quality since the spectral range was selected for the retrieval of ozone but not for H2O (Kiefer et al., 2023).
2.1.3 Microwindows and spectroscopy
As for temperature and other gases, in the retrieval of O3 we use small spectral regions (microwindows) covering ro-vibrational emissions of the main O3 isotope. These MWs vary with tangent altitudes in order to minimize errors and optimize computation time. Glatthor et al. (2018) have shown that the O3 spectroscopic data in MIPAS band A (685–980 cm−1) and those in the AB band (1010–1180 cm−1) are inconsistent. Further, Laeng et al. (2014, 2015) found that the use of microwindows in the AB band, instead of in band A, leads to a positive bias in MIPAS ozone profiles in the upper troposphere and lower stratosphere. Thus, whenever possible, we used MWs in band A. However, in the mesosphere and lower thermosphere, the O3 lines in band A are too weak and the spectra are noisy; hence the use of MWs in the AB band was necessary.
The MWs used in this version are essentially the same as in the previous version and are listed in Table A1 for easy reference. Only minor changes were made. In particular, MW no. 8 (720.75–723.688 cm−1) was excluded due to CO2 line mixing, and MW nos. 37 and 38 near 1053 and 1055 cm−1 were slightly reduced to remove the radiance contribution of CO2 laser band lines. The MWs used below 50 km are the same as those used in the NOM O3 retrieval (all located in the A band), and those used between 50 and 70 km are very similar (both from the AB band) (Kiefer et al., 2023).
The O3 spectroscopic data from the HITRAN 2008 database (Rothman et al., 2009) used in the previous version of the O3 retrieval were replaced with those of the MIPAS pf3.2 database (Flaud et al., 2003a, b). This change was motivated by the MIPAS spectroscopic database having smaller inconsistencies between the line strengths in the spectral range of the MIPAS A and AB bands and by there being, in the HITRAN dataset, an unrealistically large change in the air-broadening coefficients near 797 cm−1 (Glatthor et al., 2018). For the interfering species, we used HITRAN2016 (Gordon et al., 2017). CO2 line-mixing coefficients have been re-calculated for the new spectroscopic data.
2.1.4 Other changes in the forward model and input parameters
Another less important change included in this version is the different concentrations of the interfering species. While in the previous version we used a specifically tailored climatology, here we constructed the interfering species dataset based on previous V5R version results (see Kiefer et al., 2021). The CO2 concentration is taken from the SD-WACCM4 climatologies (see Kiefer et al., 2021, and García-Comas et al., 2023).
In the current version, we used an internal spectroscopic grid in the forward model, wgrid, of 0.0009765625 cm−1, instead of the finer grid of 5 × 10⁻⁴ cm−1 used in the previous version. For convenience, wgrid was chosen as that which is closer to 10−3 cm−1 and fulfils the criterion that = 2N, where 0.0625 (cm−1) is the spectral resolution before apodization and N is an integer number; N = 6 in our case. Tests performed show that the use of that coarser spectral grid has a negligible effect on the retrieved O3. That is, it adequately accounts for the mesospheric O3 Doppler line shape. In turn, it allows us to reduce the CPU time consumed by the retrieval. On the other hand, the wider frequency range for the Norton–Beer “strong” apodization (Norton and Beer, 1976) of calculated spectra used now contributes to increasing the CPU time.
2.2 Retrieval updates specific to middle-atmosphere measurement modes
In this section, we describe the updates which are more relevant or exclusive to the retrieval of O3 from the MA, UA and NLC observation modes and hence are more relevant for the O3 retrieved above ∼ 70 km.
2.2.1 Regularization
The retrievals are performed from the surface to 120 km over a fixed altitude grid of 1 km up to 50 km, at 72–75 km and at 77–88 km; of 2 km at 50–72, 75–77 and 88–102 km; and of 5 km from 105 up to 120 km. Contrary to the retrievals from the nominal observation mode (Kiefer et al., 2023), which are linear in the volume mixing ratio (VMR), in the middle-atmospheric measurement modes we retrieve the logarithm of VMR. Forward calculations are performed using the same grid. As this grid is finer than the MIPAS vertical sampling of 3 km (except in the NLC mode at 78–87 km, where it is 1.5 km), we used a regularization, a Tikhonov-type first-order smoothing constraint in our case (Tikhonov, 1963). The regularization used in this version has not changed since version 5.
2.2.2 A priori O3
The a priori O3 in the mesosphere and lower thermosphere has changed significantly and affects principally the upper-mesosphere daytime O3 mixing ratio. We recall that the Tikhonov regularization chosen does not systematically push the retrieved ozone profile towards the a priori but only constrains the shape of the vertical profile.
In the previous version we used the 2D field from Garcia and Solomon (1994), which had the O3 daytime secondary maximum at altitudes lower than those of recent measurements (López-Puertas et al., 2018). Here, the O3 a priori is essentially a MIPAS O3 V5R zonal-mean climatology (obtained from MA and UA monthly composites, 10∘ resolution, and linearly interpolated in between). This climatology has been modified to account for the poorer MIPAS vertical resolution in the upper mesosphere by correcting with O3,corr = O3,uncorr × , where O3,W is taken from the SD-WACCM4 climatology, the Whole Atmosphere Community Climate Model Version 4 (WACCM4) simulations (Marsh, 2011; Marsh et al., 2013) of a specified dynamics run (Garcia et al., 2017), and O3,W_AK is the same O3,W climatology but with the MIPAS averaging kernels applied. With this correction, the MIPAS climatology remains essentially unaltered below ∼ 70 km. Above, the overall magnitude of the MIPAS V5R ozone abundances is maintained, while unresolved profile features are incorporated from the Whole Atmosphere Community Climate Model (WACCM) climatology.
2.2.3 Non-LTE: collisional and reaction rates
The ozone non-LTE model used in this version is described in detail by López-Puertas et al. (2018); see Sect. 2 and Tables 1 and 2 in that work. We describe here the major changes in the model that apply to this version. First, we discuss the collisional rates and, later on, the species abundances required by the non-LTE model and not measured by MIPAS, i.e. the atomic oxygen and hydrogen concentrations.
Funke et al. (2012)Table 1Major photochemical reactions affecting O3 in the mesosphere and lower thermosphere and processes affecting the population of the O3 vibrational levels.
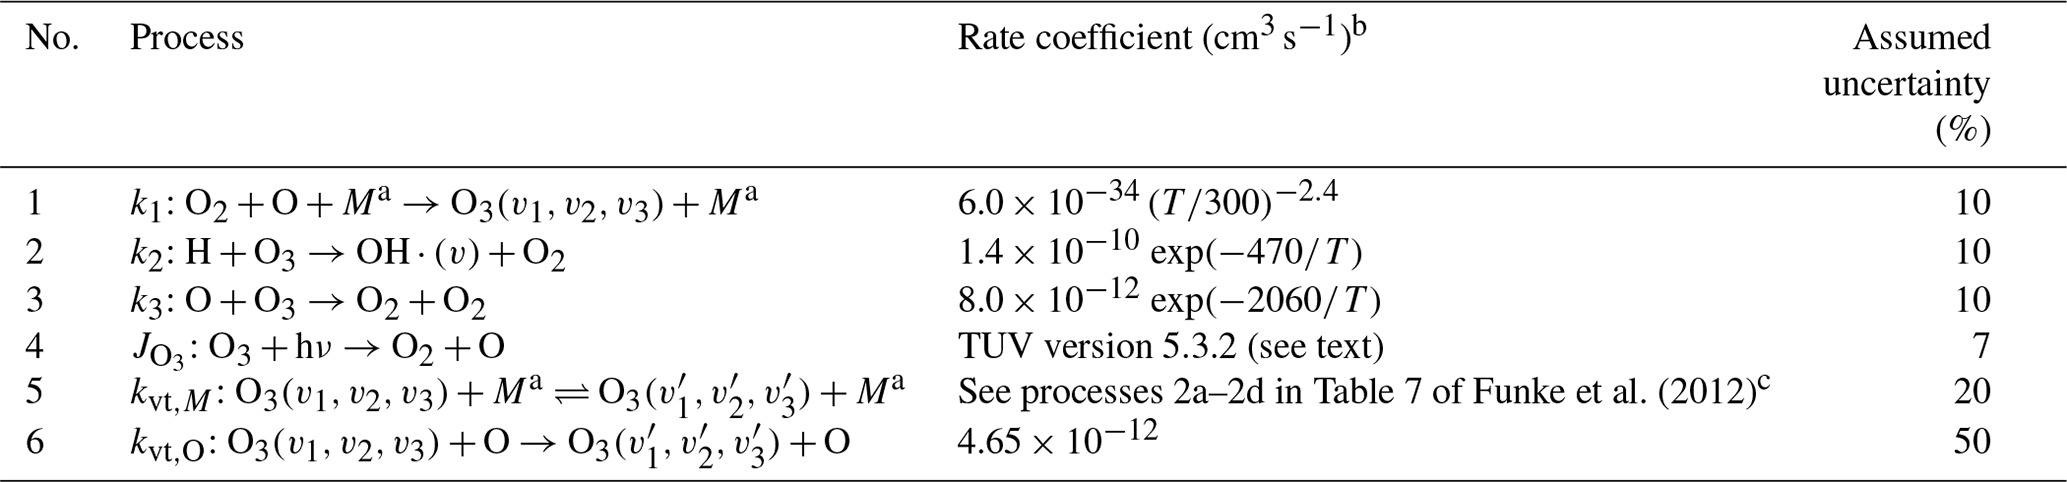
a M represents N2 and O2. b Except for k1 that is in cm6 s−1. Note that the energy of the level is larger than that of . c kd (process 2c) is limited to a minimum value of 4 × 10⁻¹⁶ cm3 s−1 at temperatures below 200 K (López-Puertas et al., 2018).
The major uncertainty in the O3 non-LTE model is the deactivation of O3(v1,v3) by atomic oxygen, either by chemical quenching, , or by inelastic collisions, , process kvt,O in Table 1. The uncertainty comes not only from the rates themselves but also from the uncertain amount of atomic oxygen, which is not measured but derived or constrained by the retrieved O3 in an iterative process (López-Puertas et al., 2018; Mlynczak et al., 2013). For larger rates or larger O concentrations, the deactivation is stronger, which leads to lower populations for the emitting O3 states and hence larger O3 abundances.
In the validation of the previous version of O3, we found that the nighttime upper-mesosphere O3 was larger by ∼ 20 % than in most of the other instruments (López-Puertas et al., 2018). Thus, to obtain a better agreement, we reduced the relaxation of O3 by O, , kvt,O, by a factor of 2, i.e. 4.65 × 10⁻¹² cm3 s−1. Note that the chemical quenching, , was already neglected in the previous version, as suggested by West et al. (1978). The assumed rate is within the uncertainties in the laboratory measurements but at the lower limit measured by West et al. (1976) (see the discussion in López-Puertas et al., 2018). More recently, Castle et al. (2014) have measured the thermal relaxation of the lower-energy v2 mode3 in collisions with O at room temperature, finding a value of (2.2 ± 0.5) × 10−12 cm3 s−1. Our selected value is still reasonable because, although still larger, it is closer to the relaxation of the lower-energy v2 mode, whose relaxation is expected to be more efficient.
2.2.4 Trace gas concentrations relevant for non-LTE modelling
As shown above, the retrieval of O3 mixing ratios under non-LTE conditions requires knowledge of the atomic oxygen concentration, [O]. In our retrieval, we constrain [O] by assuming that O3 is in photochemical equilibrium with O and using the O3 abundance retrieved in the previous iteration of the inversion (daytime) or from the previous version (nighttime). This is a reasonable approach above around 60 km during the daytime and ∼ 80 km at nighttime because of the rapid timescales for ozone production and loss in this region. Below those altitudes, collisions with O are negligible.
Daytime
Taking into account the major photochemical reactions affecting O3 in the mesosphere and lower thermosphere (see Table 1), the O concentration for daytime conditions can be well approximated by
where the chemical loss of O3 by H has been neglected. In summary, for the daytime, the required [O] is computed by using this equation and the O3 retrieved in the previous iteration.
The photo-absorption coefficient is calculated by using the TUV model version 5.3.2,4 which includes the MIP6 solar spectral irradiance. In the previous version, we used TUV version 4.2, which uses the less variable SUSIM (Solar Ultraviolet Spectral Irradiance Monitor) solar spectral radiance. The new coefficient is ∼ 10 % smaller below 100 km, which leads to a daytime [O] ∼ 10 % smaller below 90 km and is very similar near 100 km. As explained above, the effect of this change in the non-LTE model tends to decrease the retrieved O3.
Nighttime
During the nighttime, the photochemical equilibrium of O3 leads to
In the previous version we calculated [O]n from Eq. (2) and taking [H] from the NRLMSIS-00 model (Picone et al., 2002). Here [H] was inferred from MIPAS daytime and nighttime O3 measurements in the altitude range where the O VMR is free of photochemically induced diurnal variations (above ∼ 80 km). In that region, the atomic oxygen VMR has no significant diurnal variations except those caused by tides, which we consider related by , where ft is a tidal correction factor. Thus, by combining Eqs. (1) and (2); using ft; and defining the chemical losses for the daytime (10:00), , and nighttime (22:00), , we obtain
where we consider different densities and temperatures for the daytime and nighttime. The tidal correction factor ft for atomic oxygen can be constructed by making use of the pressure difference Δp between 10:00 and 22:00 at a given potential temperature level by
Unfortunately, MIPAS did not measure daytime and nighttime O3 at the same geolocations. This means that information on [H]n can be obtained from MIPAS only on a climatological basis, e.g. from O3 VMR day- and nighttime climatologies. In order to incorporate the transient variability, we employ SD-WACCM4 simulations (see Sect. 2.2.2) sampled at MIPAS geolocations, , e.g.
where, to be consistent with the climatological MIPAS [H]n, they were corrected by the climatological MIPAS-to-WACCM ratio
This method for generating the a priori [H] has two caveats. First, SD-WACCM4 is free-running above the stratopause, resulting in deviations from the observed meteorology. However, larger perturbations of mesosphere and lower-thermosphere dynamics caused by wave propagation from the lower atmosphere, which may have a noticeable impact on atomic hydrogen, are still represented reasonably well in comparison to a merely climatological a priori. Secondly, the correction factor fc is based mainly on MIPAS V5R O3 data. It might change if derived from the V8R reprocessed ozone data, which would then raise the necessity for iteration. To sort this out, we computed fc factors from the resulting V8R ozone data. Differences in the updated fc are generally smaller than 15 %, except in the tropics, where deviations can be as large as 30 %. The nighttime [H] concentration derived from MIPAS V5R data in the 80–100 km altitude range agrees well, within 20 %–25 %, with the [H] from the NRLMSIS 2.0 empirical model (Emmert et al., 2021) for all latitudes and seasons, except in the tropics where the differences are within 20 % and 50 %, with [H] derived from MIPAS being smaller.
The atomic oxygen described above is available in the region where we retrieve O3. Above approximately 97 km, we used the atomic oxygen from SD-WACCM4 simulations (see García-Comas et al., 2023).
Even if we tried to avoid CO2 lines in the MW selection (see above), to be on the safe side, we also included the contribution of CO2 lines in the forward model. The CO2 bands are also considered in non-LTE. A detailed description of the CO2 non-LTE model and all the required input parameters can be found in Jurado-Navarro et al. (2016).
Ozone is reliably retrieved from 20 km in the MA mode (40 km for the UA and NLC modes) up to ∼ 95 km during illuminated conditions and up to ∼ 105 km during dark conditions. Figures D1 and D2 show monthly climatologies of MIPAS V8R O3 for daytime (10:00) and nighttime (22:00) conditions, respectively, from the mid-stratosphere up to the lower thermosphere. Their major features, including their vertical and latitude distributions and diurnal variations, are discussed in detail in López-Puertas et al. (2018). The updated figures for version V8R are shown in Appendix D.
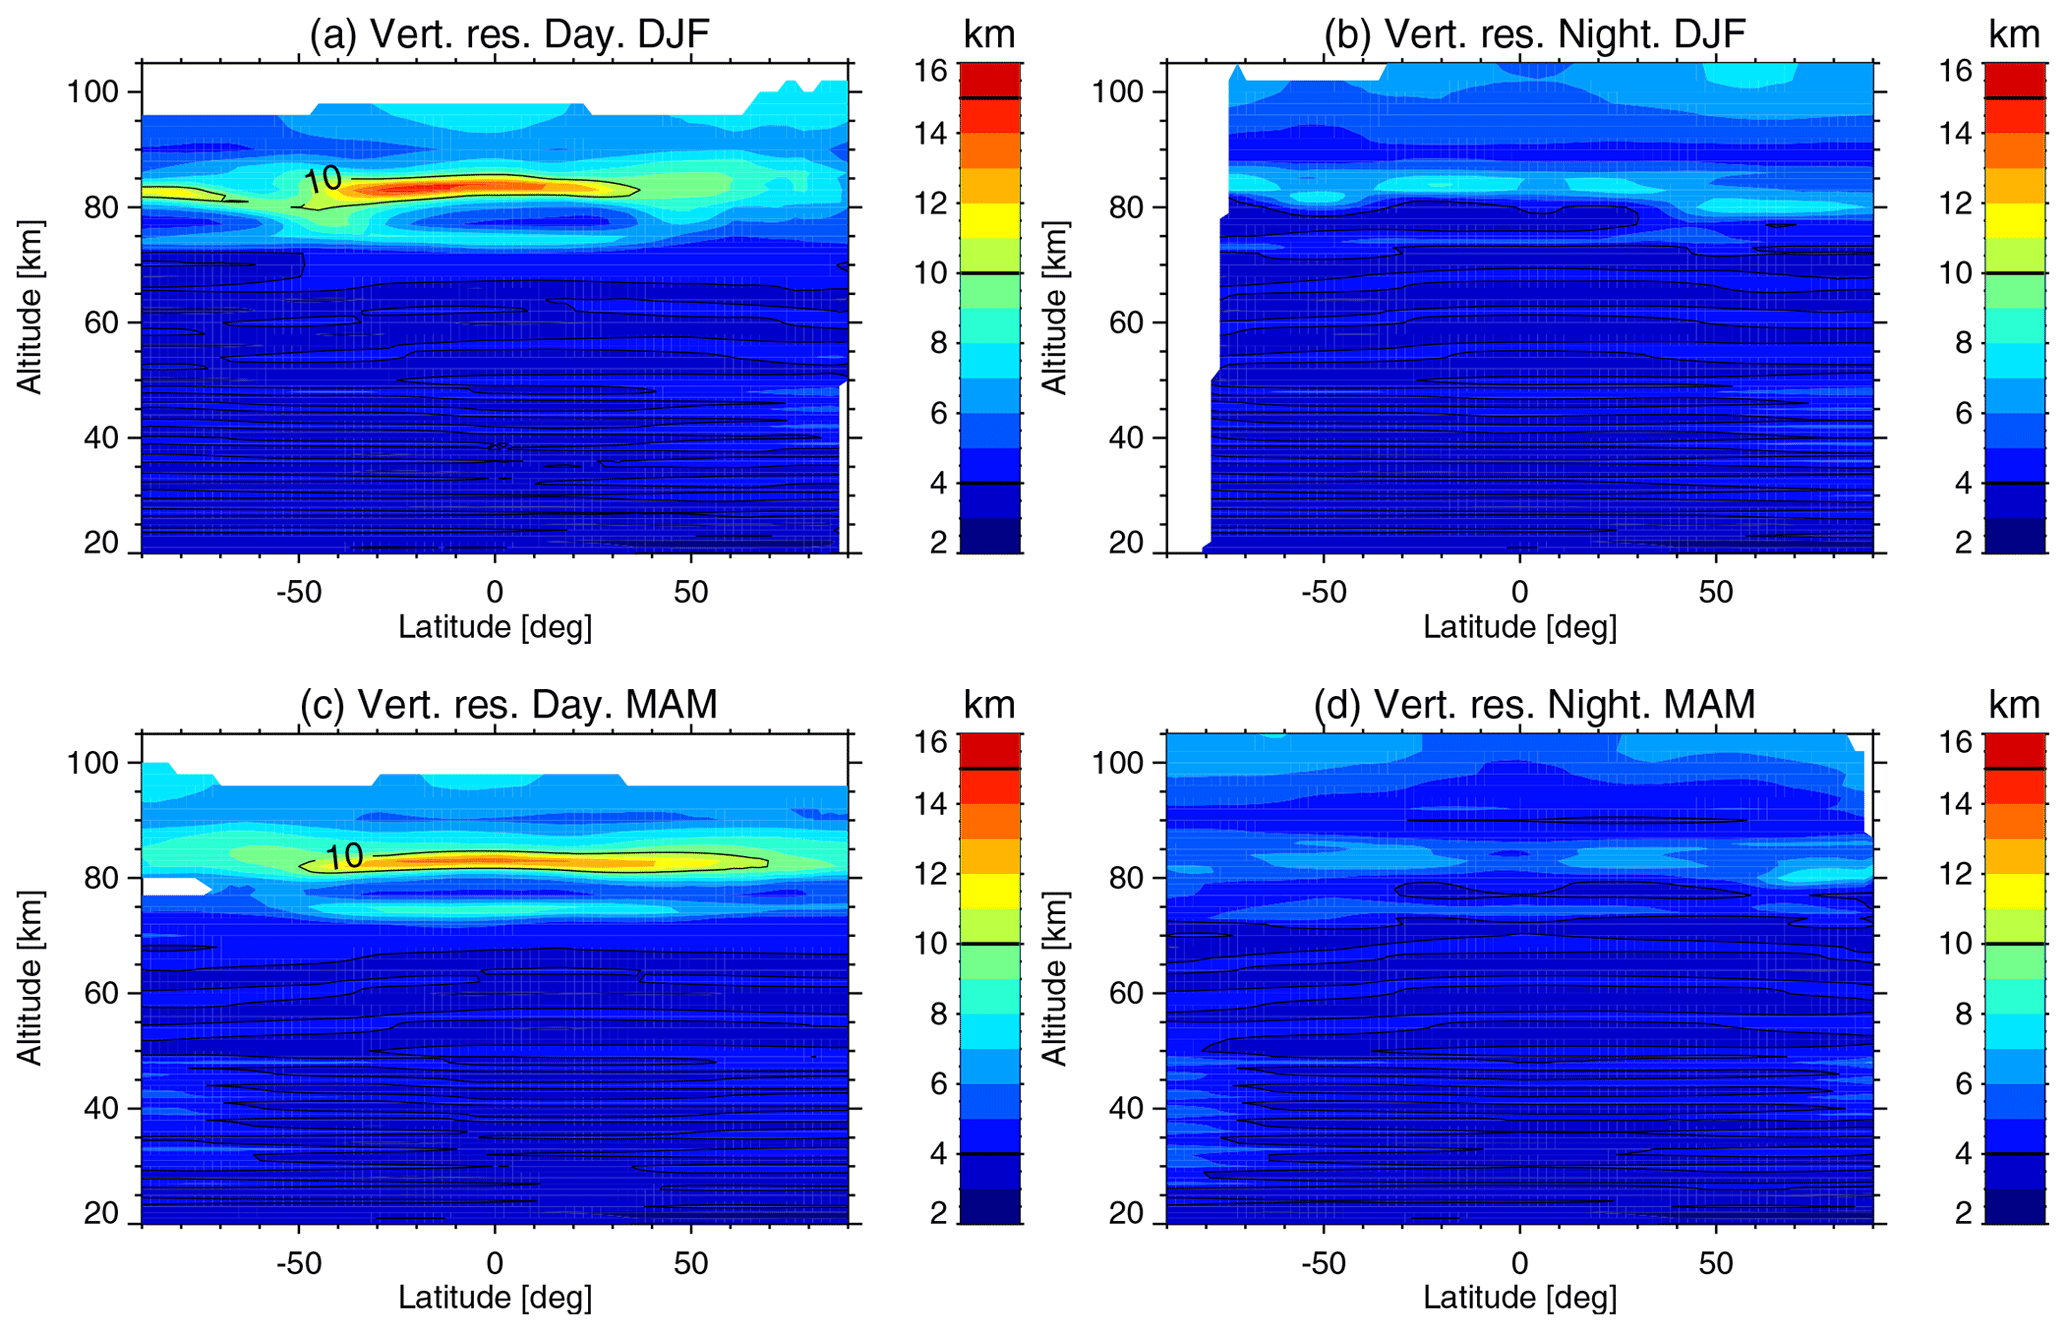
Figure 1Latitude–altitude cross sections of MIPAS MA vertical resolution for daytime (a, c) and nighttime (b, d) conditions. The top panels (a, b) are for solstice (December–January–February, DJF) and the bottom panels (c, d) are for equinox (March–April–May, MAM). The means include all measurements from 2005 to 2012. White areas denote regions where the retrieved O3 is not significant. Contour lines are marked in the colour bar scale.
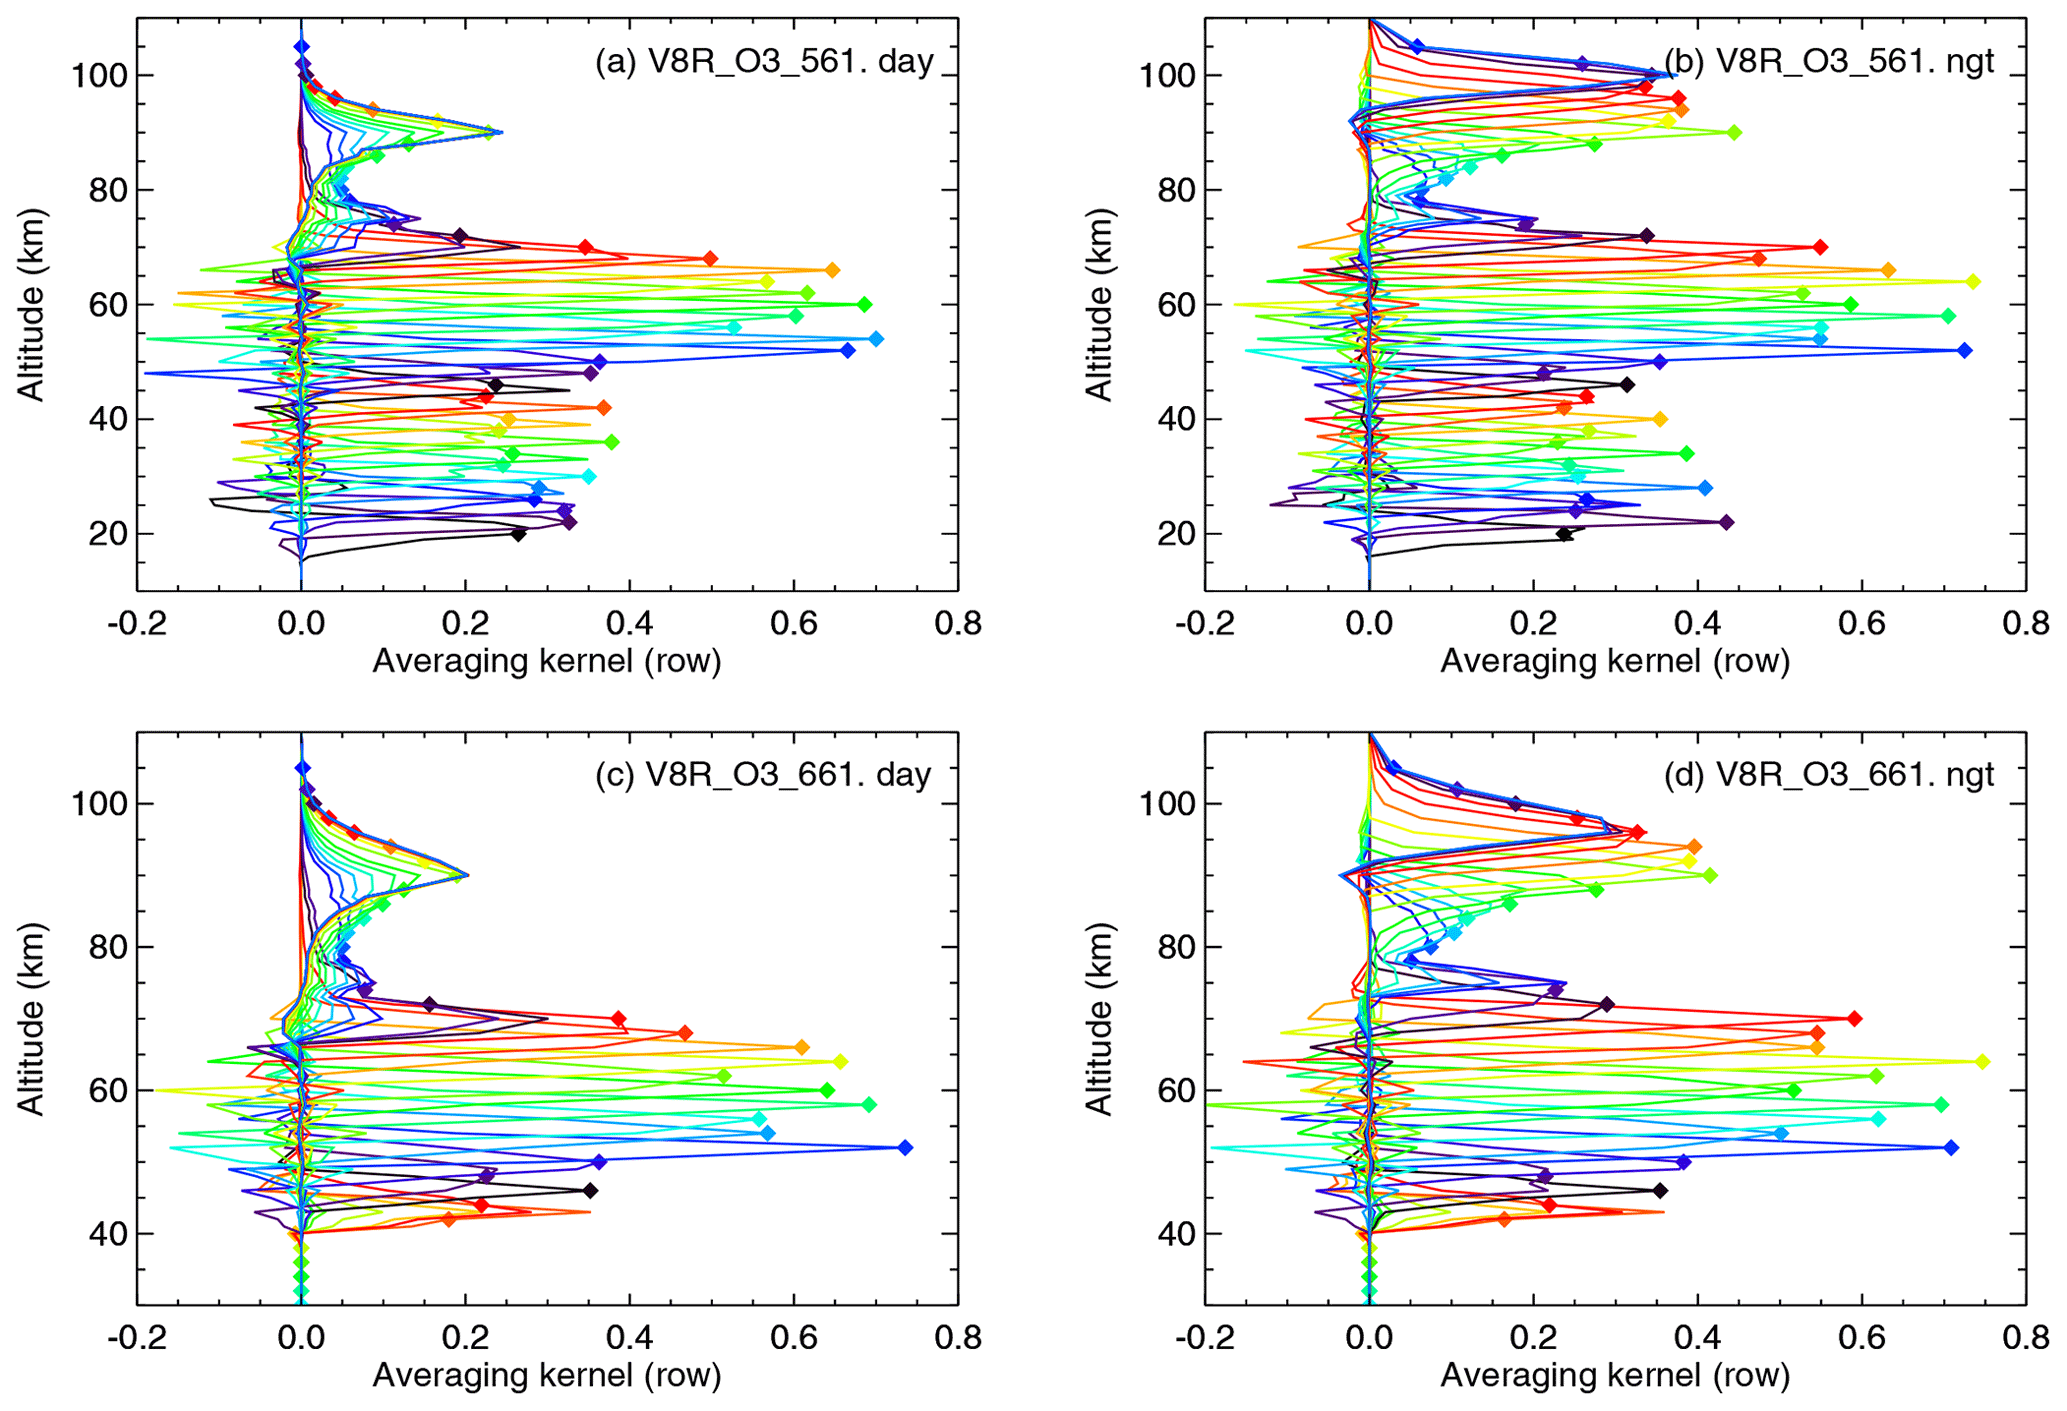
Figure 2Rows of the averaging kernel matrix for ozone profiles recorded during the MA (a, b) and UA (c, d) measurement period. The corresponding averaging kernel diagonal elements are indicated by symbols. The left panels (a, c) show the values for daytime conditions and the right panels (b, d) the values for nighttime conditions. Kernel rows are shown every 2 km up to 102 km and at 115 km. MA data in (a) are taken from 1 September 2009 (Envisat orbit 39234) at 49.8∘ N, 152.8∘ E, and in (b) from 10 September 2009 (Envisat orbit 39364) at 42.0∘ N, 51.1∘ W. UA data in (c) and (d) are taken from 1 September 2009 (Envisat orbit 39235) at 49.8∘ N, 127.9∘ E, and at 40.5∘ N, 46.6∘ W, respectively.
The zonal mean of the vertical resolution for the middle-atmosphere (MA) mode for solstice and equinox conditions and daytime and nighttime is shown in Fig. 1. The vertical resolution of the retrieved ozone is given by the full width at half maximum of the averaging kernels rows. These are shown for four typical examples corresponding to MA and UA for the day- and nighttime in Fig. 2. For the daytime, the vertical resolution is about 3–4 km below 70 km, 6–8 km at 70–80 km, 8–10 km at 80–90 km (coarser in tropical regions) and 5–7 km at the secondary maximum (90–100 km). For nighttime conditions, the vertical resolution is similar below 70 km, but it is better in the upper mesosphere and lower thermosphere. Overall, it is about 4–6 km at 70–100 km (except a narrow region near 80 km, where it takes values of 6–8 km), ∼ 4–5 km at the secondary maximum and 6–8 km at 100–105 km. The vertical resolution has not changed significantly from the previous version. If anything, it is slightly better now above about 80 km, more markedly during nighttime conditions. The results for the UA and NLC modes are very similar in the common retrieved region.
The criteria recommended for using the data are the same as in the previous version, which we recall here. First, the individual values of the retrieved profiles where the diagonal value (or the mean diagonal value when averaging) of the averaging kernel is less (in absolute value) than 0.03 should not be used (data with smaller values are considered non-trustworthy), and, secondly, the values corresponding to altitudes not sounded by MIPAS, which are flagged by the visibility flag, should not be used.
The evaluation of the error budget of this version of ozone is based on the error estimation scheme for MIPAS version-8 data described by von Clarmann et al. (2022), which follows the TUNER (Towards Unified Error Reporting) recommendations. The novelty (and improvement) of this scheme is that it allows accounting for error correlations which may result in error compensation. Further, it also allows the error propagation of uncertainties in parameters obtained in preceding retrievals. The errors are estimated on a profile-by-profile basis for the measurement noise and on representative atmospheric conditions for the rest of the errors. In particular, we considered 34 representative atmospheric conditions defined in terms of latitude band, season and illumination conditions, which cover most of the climatologically expected situations for the middle-atmosphere measurement mode (see Table A3 in von Clarmann et al., 2022). The attribution of a given measured profile to these representative atmospheres is given in Table A6 of von Clarmann et al. (2022). For some species, like NO, CO and CO2, we also have to consider the upper-atmosphere measurement mode scenarios and even also different solar conditions (Tables A4 and A5 in von Clarmann et al., 2022). In the case of O3, as its abundance is practically negligible above 105 km, the scenarios for UA are very similar to the middle-atmosphere one. Hence we will focus on the error estimates for the latter, but the estimates for both UA scenarios are also included in the Supplement for completeness.
In the next sections, we discuss the major error sources and the corresponding uncertainties that we assume in the estimation of the O3 errors. Following the TUNER recommendations given by von Clarmann et al. (2022) we discuss, separately, the errors thought to be of mainly random nature and those of systematic origin. The methodology of the error estimation for both types of errors is described in detail in von Clarmann et al. (2022). All estimated errors are given as standard deviations (1σ). A detailed analysis of the errors affecting the retrieved O3 below about 70 km is already given in Kiefer et al. (2023). Nevertheless, for completeness, we briefly describe them here and focus on the middle/upper mesosphere and lower thermosphere where non-LTE errors are very relevant.
4.1 Error sources and uncertainties
Again, based on the nomenclature of von Clarmann et al. (2022), we considered the following types of errors: measurement errors, parameter errors and model errors. The measurement errors comprise essentially the measurement (spectral) noise and, additionally, those errors related to the instrument's state which are not well known (see Sect. 4.1.1). The atmospheric state parameters, which are not known perfectly but not so little as to be considered unknowns of the retrieval, fall within the category of parameter errors (see Sect. 4.1.2). In this type, we also include those which cannot be retrieved from the measurements because the measurements do not contain enough information about them. Lastly, we consider model errors the uncertainties in the spectroscopic data and the non-LTE parameters (see Sects. 4.1.3 and 4.1.4). Note that the latter is specific to these atmospheric modes of observations and not included in the nominal mode.
4.1.1 Measurement errors
The measurement errors include the spectral noise of MIPAS, the uncertainty in the gain calibration, the instrument line shape uncertainty, inaccuracies in the frequency calibration and pointing errors.
The propagation of the spectral noise was estimated by using Eq. (5) of von Clarmann et al. (2022). The mapping of the other measurement errors in the O3 error was evaluated from sensitivity studies performed for the representative atmospheric conditions discussed above.
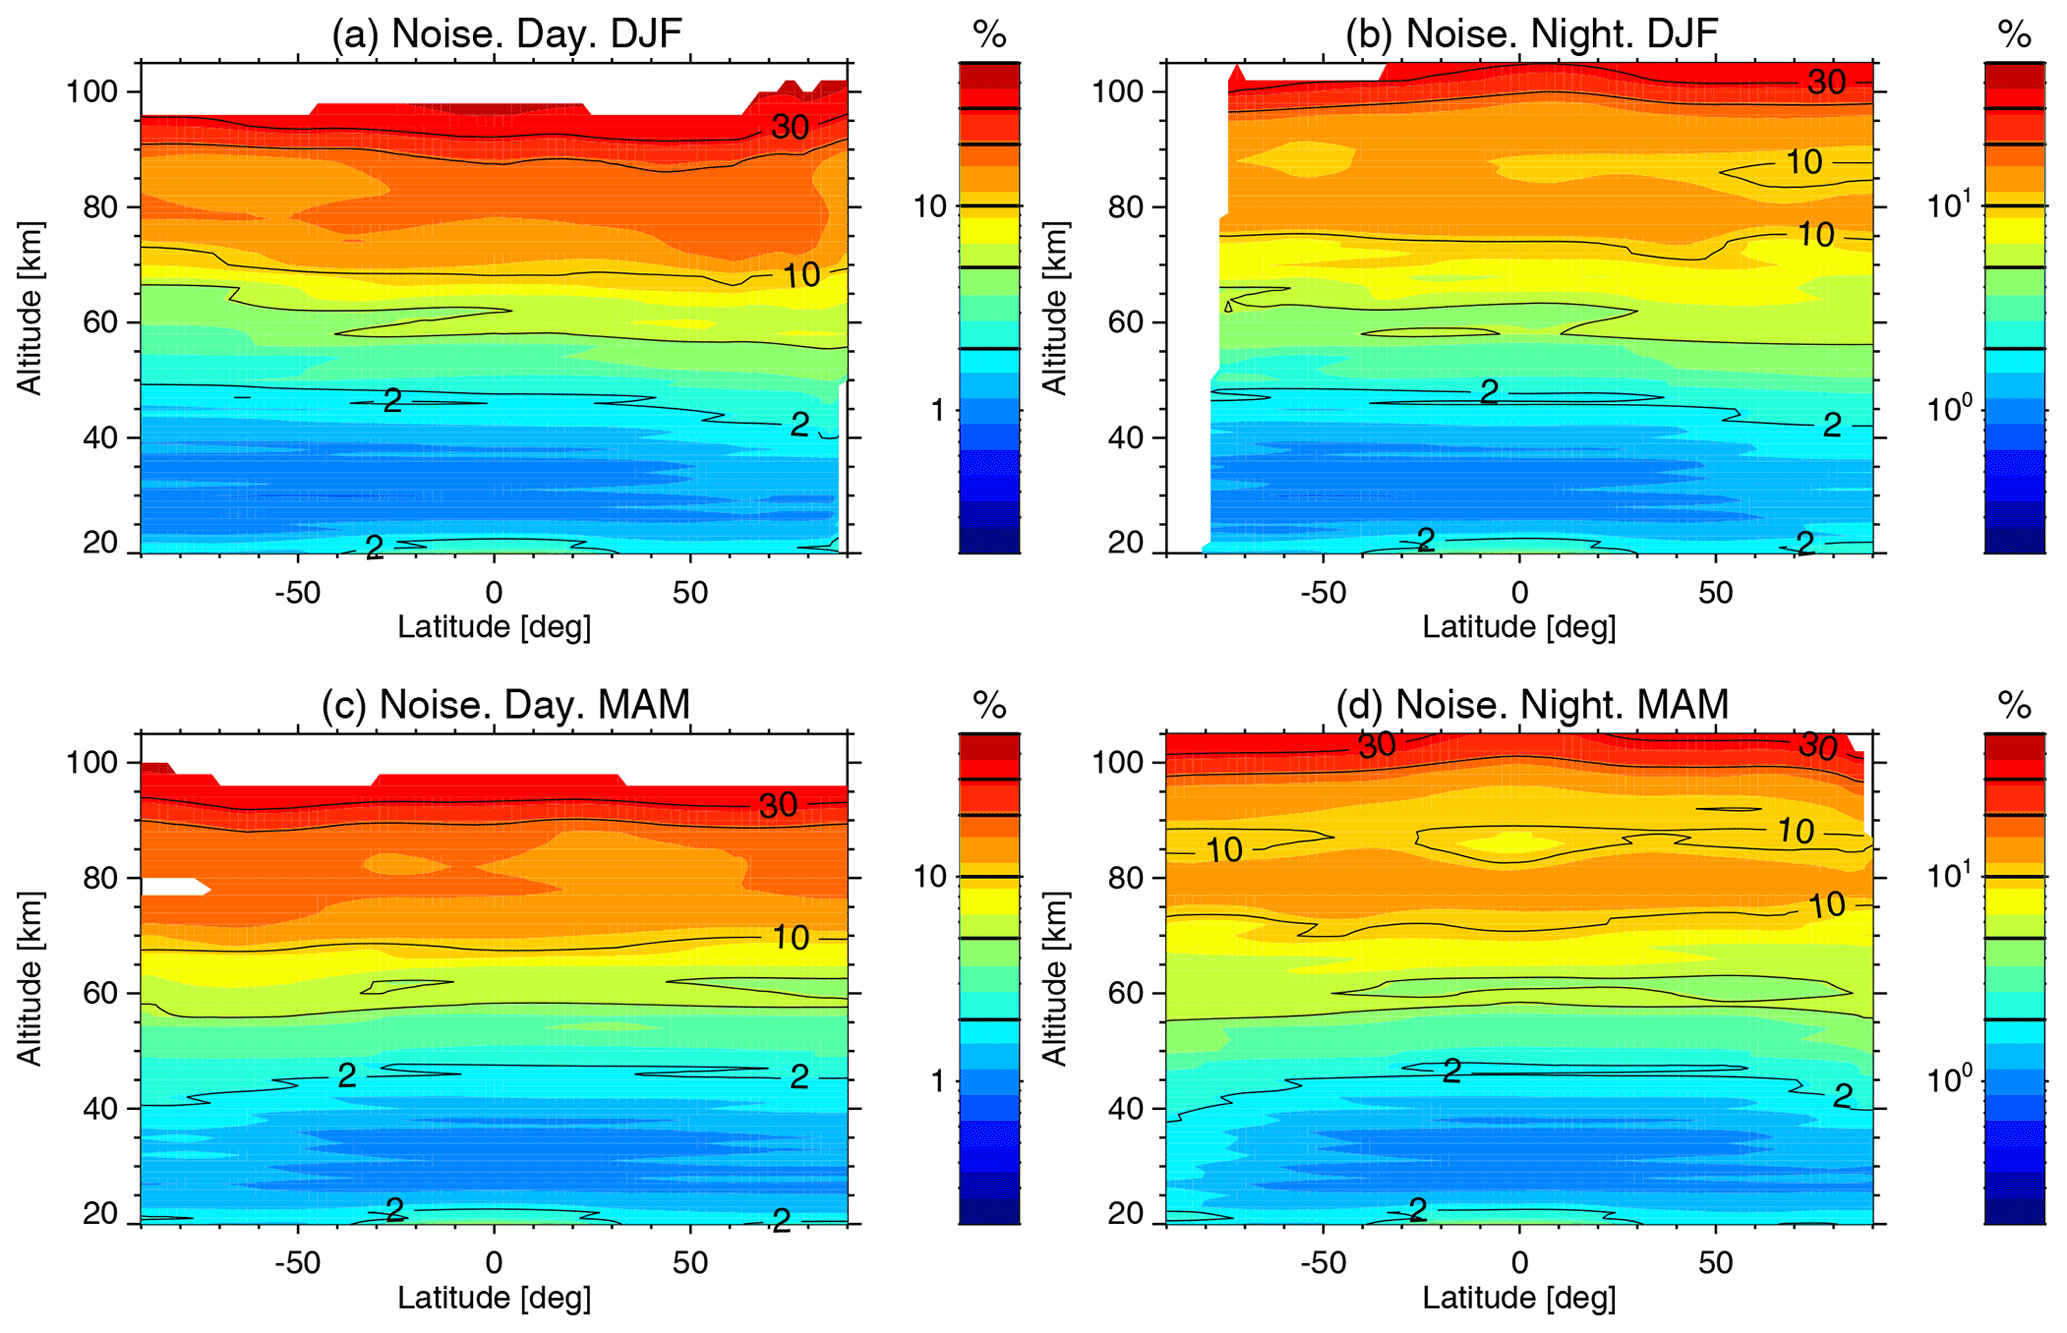
Figure 3Latitude–altitude cross sections of the noise component of the ozone uncertainty in terms of estimated standard deviations for the MA mode. The left (a, c) and right (b, d) columns are for daytime and nighttime conditions, respectively. The top panels (a, b) are for solstice conditions (northern winter, December–January–February: DJF), and the bottom panels (c, d) are for equinox conditions (northern spring, March–April–May; MAM). The means span over all measurements from 2005 to 2012. White areas denote regions where the retrieved O3 is not significant (averaging kernel diagonal < 0.03). Contour lines are marked in the colour bar scale.
The measurement noise is typically 30–33 in the MIPAS A band and 5.4–9.6 in the AB band. Both values refer to the apodized spectra. The mapping of those errors in the retrieved O3 single profiles is shown in Fig. 3 for solstice conditions (top row) and equinox conditions (bottom row). As mesospheric O3 is significantly different during the day- and nighttime, and so is MIPAS sensitivity (see Fig. 2), we distinguish between daytime (left panels) and nighttime (right panels). Typical values (1σ) for daytime (left column of Fig. 3) are smaller than 5 % below ∼ 60 km, 5 %–10 % between 60 and 70 km, 10 %–20 % at 70–90 km, and about 30 % at 95 km. For nighttime (right column of Fig. 3), the O3 noise errors are very similar to those during the daytime below around 70 km but significantly smaller above, being 10 %–20 % at 75–95 km, 20 %–30 % at 95–100 km (except near the tropics where the errors are smaller) and larger than 30 % above 100 km.
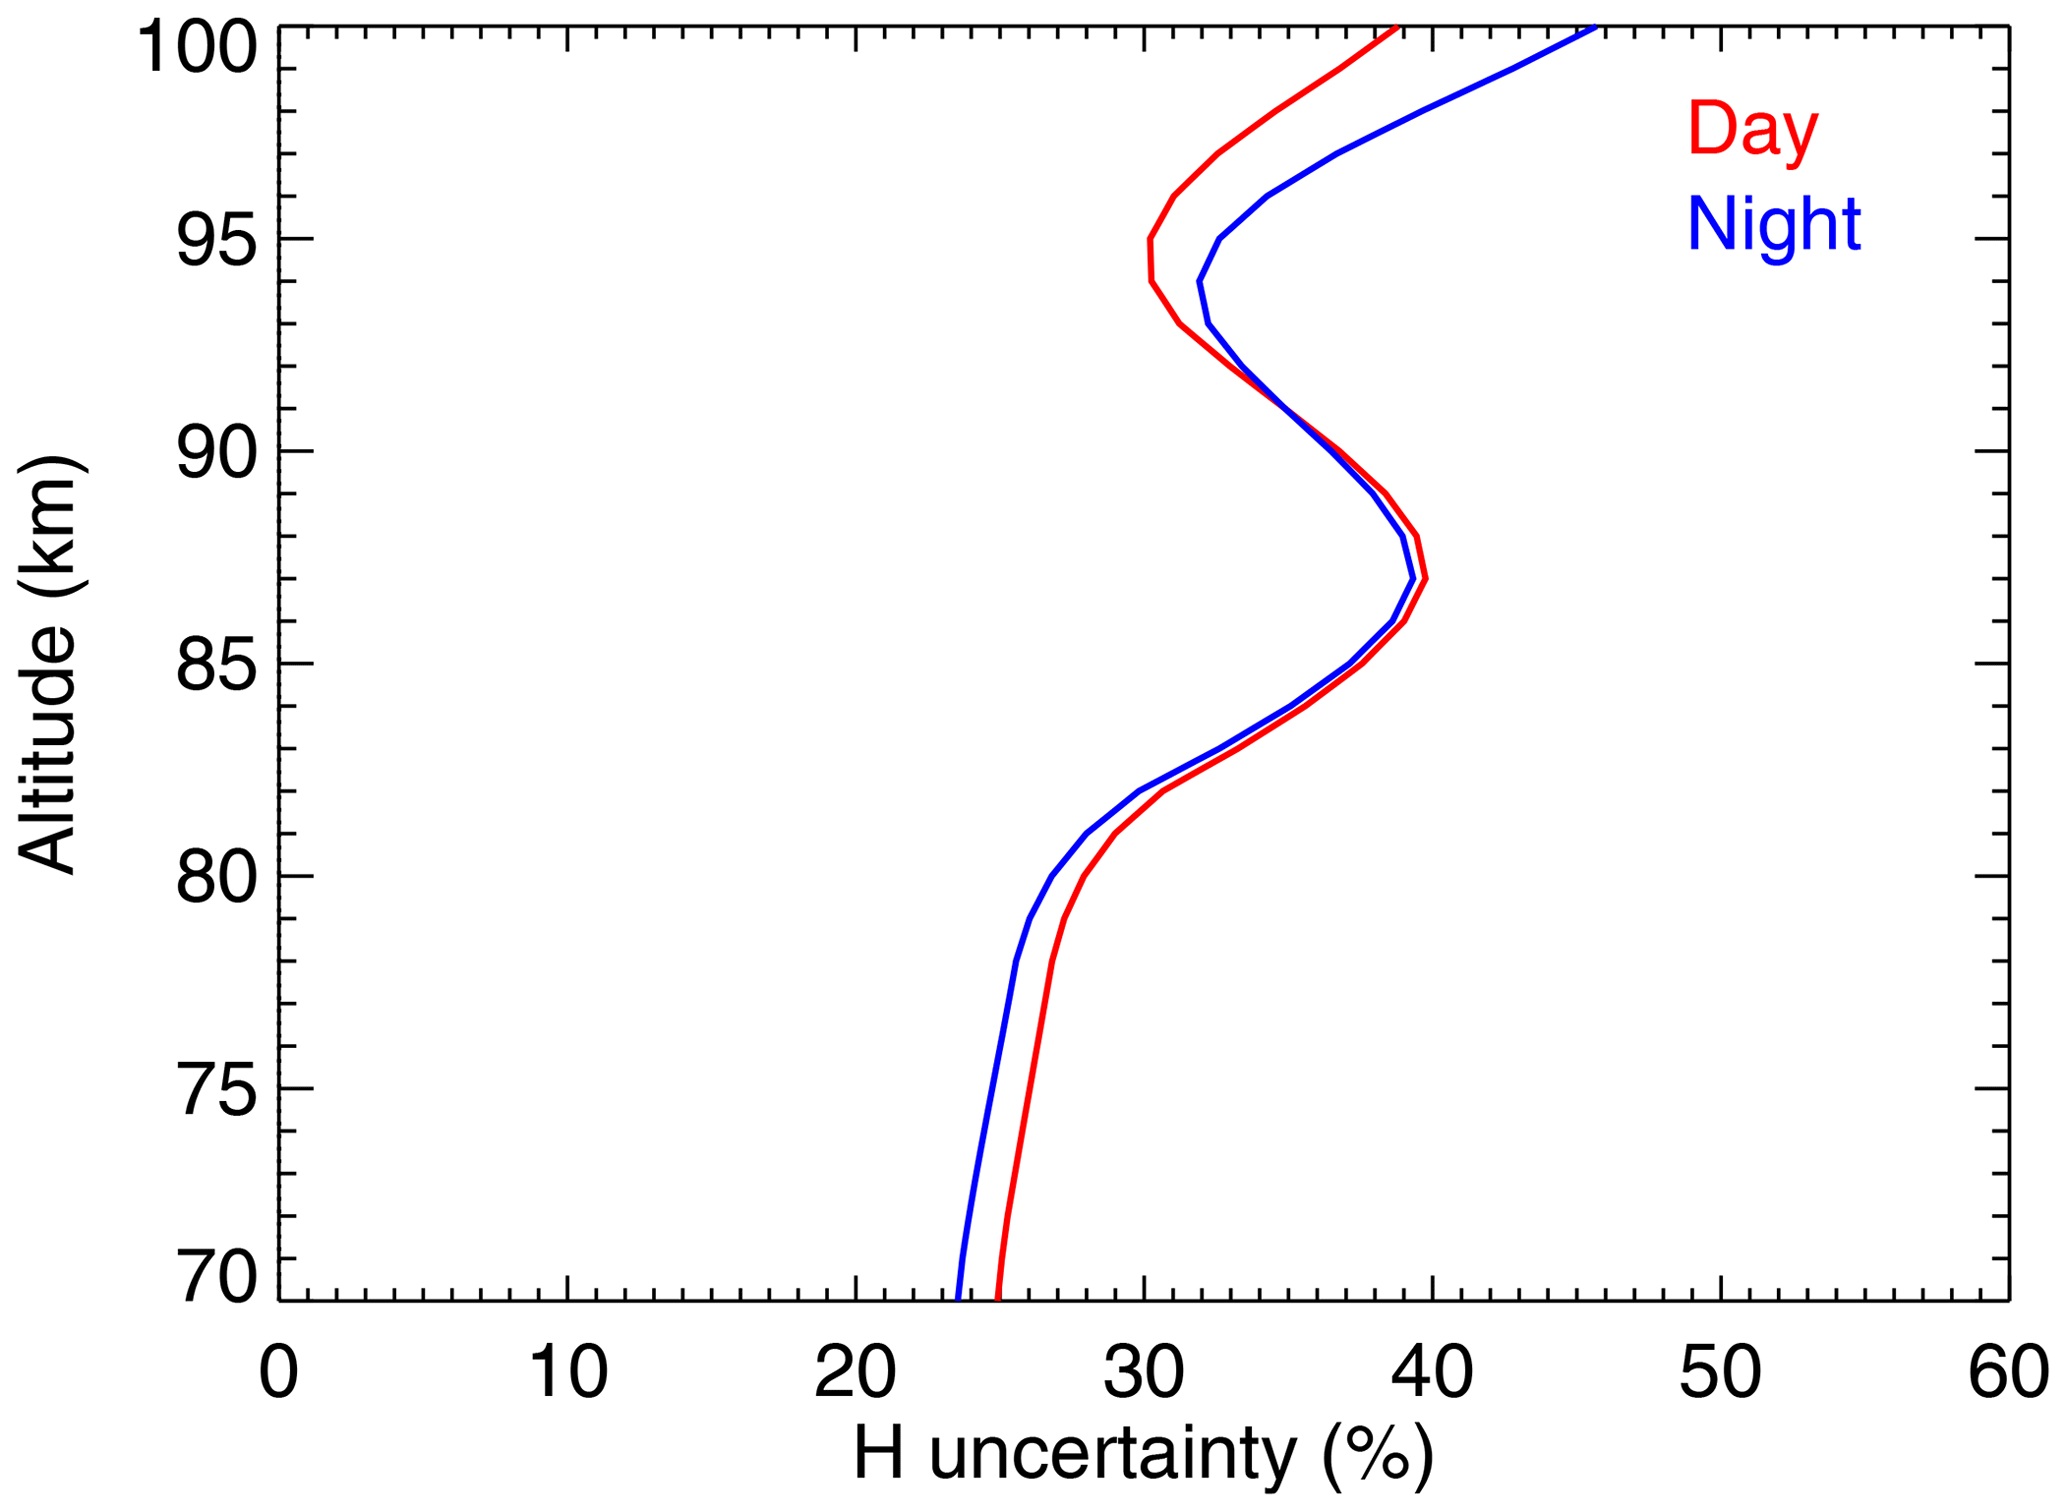
Figure 4Mean of the [H] uncertainties included in the O3 error budget for the day- and nighttime conditions.
The 1σ gain uncertainties were estimated to be 1.1 % and 0.8 % for the A and AB bands, respectively (see Kleinert et al., 2018). The response of retrieved ozone to the gain calibration is, to first order, multiplicative. Hence, in the band-A spectral region, the gain uncertainties in the retrieved ozone mostly compensate for the gain uncertainty in the temperature and tangent altitude errors, since these are retrieved from the same band. This occurs approximately for the O3 retrieved below about 50 km.
The instrument line shape (ILS) uncertainties and the spectral shift residual error have been evaluated as described in Kiefer et al. (2021) and are based on the estimates of modulation loss through self-apodization and its uncertainties. We also considered a residual frequency calibration error which resulted in 0.0003 cm−1 in bands A and AB.
4.1.2 Uncertainties in atmospheric parameters
In the ozone retrieval of the MA, UA and NLC modes, we used the information of temperature and tangent altitude previously retrieved from the 15 µm region. Thus, the different sources of errors affecting the retrieved temperature and tangent altitude (T + LOS) are implicitly taken into account by propagating their uncertainties into the O3 retrieval. The major sources of temperature are the following. The random component, mainly instrumental noise, is typically less than 1 K below 60 km, 1–3 K at 60–70 km, 3–5 K at 70–90 km, 6–8 K at 90–100 km, 8–12 K at 100–105 km and 12–20 K at 105–115 km (García-Comas et al., 2023). Its systematic part is dominated by the CO2 spectroscopic data errors below 75 km and by the uncertainties in the non-LTE model parameters and CO2 concentration above ∼ 80 km. The systematic uncertainties are smaller than 0.7 K below 55 km, 1 K at 60–80 km, 1–2 K at 80–90 km, 3 K at 95 km, 6–8 K at 100 km, 10–20 K at 105 km and 20–30 K at 115 km (García-Comas et al., 2023).
The uncertainties in the spectrally interfering molecules with ozone, i.e. N2O, CH4, NO2, NH3, HNO3, ClO, OCS, HCN, CH3Cl, H2O2, C2H2, C2H6, COF2, C2H4, F-22, CCl4, CFC-113, CFC-114, N2O5, HCFC-141b, HCFC-142b, ClONO2, CH3CCl3, CH3OH, acetone and PAN, which are not jointly fitted, as well as their vertical covariances, are estimated from the error covariance matrices of previous MIPAS data version V5R. These values are considered more accurate than the climatological mean values for the actual atmospheric conditions of the measurements. For those interfering species which are not available from previous MIPAS versions, we used climatological data and estimate the effects of their errors in the retrieved O3 from the perturbed spectra with their 1σ estimated uncertainties. We should note that, overall, the errors in O3 due to the uncertainties in the interfering species are very small. This is due to the high spectral resolution of MIPAS, which allows us to choose microwindows where essentially only O3 contributes to the measured radiance. The errors caused by the uncertainties in H2O are not explicitly included in the error budget as H2O is jointly fitted with O3 and as H2O uncertainties are implicitly taken into account during the propagation of measurement errors. Further, CO2 uncertainties contribute to the O3 error budget not only because of spectral CO2 interferences (for which we also include CO2 levels in non-LTE; see Sect. 2.2.4), but also mainly through its propagation via the preceding temperature retrieval from band A (see von Clarmann et al., 2022). CO2 was taken from WACCM4 simulations, and their 1σ uncertainties are listed in Table 3 of Kiefer et al. (2021).
In Sect. 2.2.4 we discuss the concentrations of the atomic oxygen and atomic hydrogen, which are not measured by MIPAS but required for the calculations of the non-LTE population of the O3 levels. The atomic oxygen uncertainty contributes to the O3 error budget in two ways: one, directly, through the non-LTE population of the emitting levels, as described above, and the other, indirectly through its impact on the kinetic temperature retrieval (see García-Comas et al., 2023). It is worthwhile noting that both errors are partially compensated when propagated to the retrieved O3. Thus, in the upper mesosphere, a larger [O] induces a larger retrieved kinetic temperature and hence a larger population of the O3 emitting levels. On the other hand, a larger [O] gives rise to a larger collisional deactivation of the O3(v1,v3) levels and hence lower populations. In the lower thermosphere, the effects are swapped but with a similar compensating effect.
As described above, the daytime atomic oxygen is obtained from the retrieved O3 below 95 km. It is then inherently retrieved together with O3, and it is not by itself an independent source of errors. The uncertainties incurred by this approach are those introduced by the collisional and kinetic rates, which are described below in Sect. 4.1.4. During the nighttime, the [O] uncertainty is driven by that of atomic hydrogen. The uncertainties in [H] have been estimated by using Eq. (2), and the errors in the entering parameters which have been discussed above. They result in mean values ranging between 20 % and 40 % from 70 to 100 km, being larger in the tropics (40 %–60 %) and smaller at high latitudes (10 %–30 %) (see Fig. 4).
In the region of 95–120 km, where [O] is taken from WACCM, we use the same uncertainties (5 %–30 %) as those used in the kinetic temperature retrieval (see Fig. 6 in García-Comas et al., 2023).
The “indirect” error induced by O through the temperature retrieval has been neglected. First, it is partially compensated by its direct effect on the populations of O3. Secondly, the effect of the [O] error in the temperature uncertainty is much smaller than the effects of other parameters (e.g. of ; García-Comas et al., 2023) already included. Further, we should note that the propagation of the temperature errors onto O3 is considerably weakened in the mesosphere since the emitting levels are in non-LTE, e.g. far away from the population dictated by the local kinetic temperature.
4.1.3 Uncertainties in spectroscopy
The spectroscopic errors are in general not so well characterized as would be required for a thorough error assessment of remotely sensed data. In particular, information about the confidence limits (e.g. 68 %, 95 % or other) of the error margins (1σ or 2σ) or about error covariances between spectral lines and bands is not available. The spectroscopic errors for O3 are described in detail by Kiefer et al. (2023); see Table 2 in that work. In summary, for the stronger ozone lines, we assume uncertainties in their intensities in the range of 2 %–4 %. The broadening coefficients were parameterized as a function of the rotational quantum number, and their uncertainties vary from 3.5 %, 7.5 % and 15 % to 20 %, depending on the ozone band considered. In this respect, we were rather conservative and assumed that all errors in the lines of a given band are completely correlated.
4.1.4 Uncertainties in non-LTE parameters
The uncertainties in the non-LTE model are an important source of systematic error for O3 above the mid-mesosphere. Their most important components are the uncertainties in the collisional rates and, as discussed above, uncertainties in the atomic oxygen concentration. The errors in the collisional rates were discussed in López-Puertas et al. (2018), and their values have not changed in this version. In summary, we considered the following uncertainties: (1) 10 % for the three-body reaction rate of O3 formation (k1 in Table 1); (2) 20 % for the thermal relaxation of O3(v1,v3) by N2 and O2; and (3) 50 % for the collisional relaxation (and/or chemical reaction) of O3(v1,v3) with atomic oxygen (k3 in Table 1), the latter based on West et al. (1976, 1978). The error in the photo-absorption coefficient , required in the photochemical model described above, was estimated to be 7 %.
4.2 O3 error estimates
While in the preceding section various contributions to retrieval uncertainties were reported, here we assess their effect on the retrieved ozone mixing ratios. As discussed above we distinguish between the errors which are mainly random and those of a predominantly systematic nature. All error components, both random and systematic, contributing to the O3 error budget for the 34 atmospheric conditions considered are given in the Supplement. Tables S2–S35 and Figs. S1–34 in the Supplement refer to MA measurements, while Tables S37–S70 and Figs. S35–S68 refer to UA measurements. Figure 5 shows three examples for the middle-atmosphere (MA) mode corresponding to the tropics, to northern mid-latitudes, and to polar summer and polar winter conditions. The results are shown for daytime and nighttime conditions because mesospheric ozone is very different for those situations. Some numeric values at selected altitudes and conditions are given in Tables B1–B6 for easier reference. They also list mean O3 VMRs, which can help in estimating absolute O3 errors from the given relative errors.
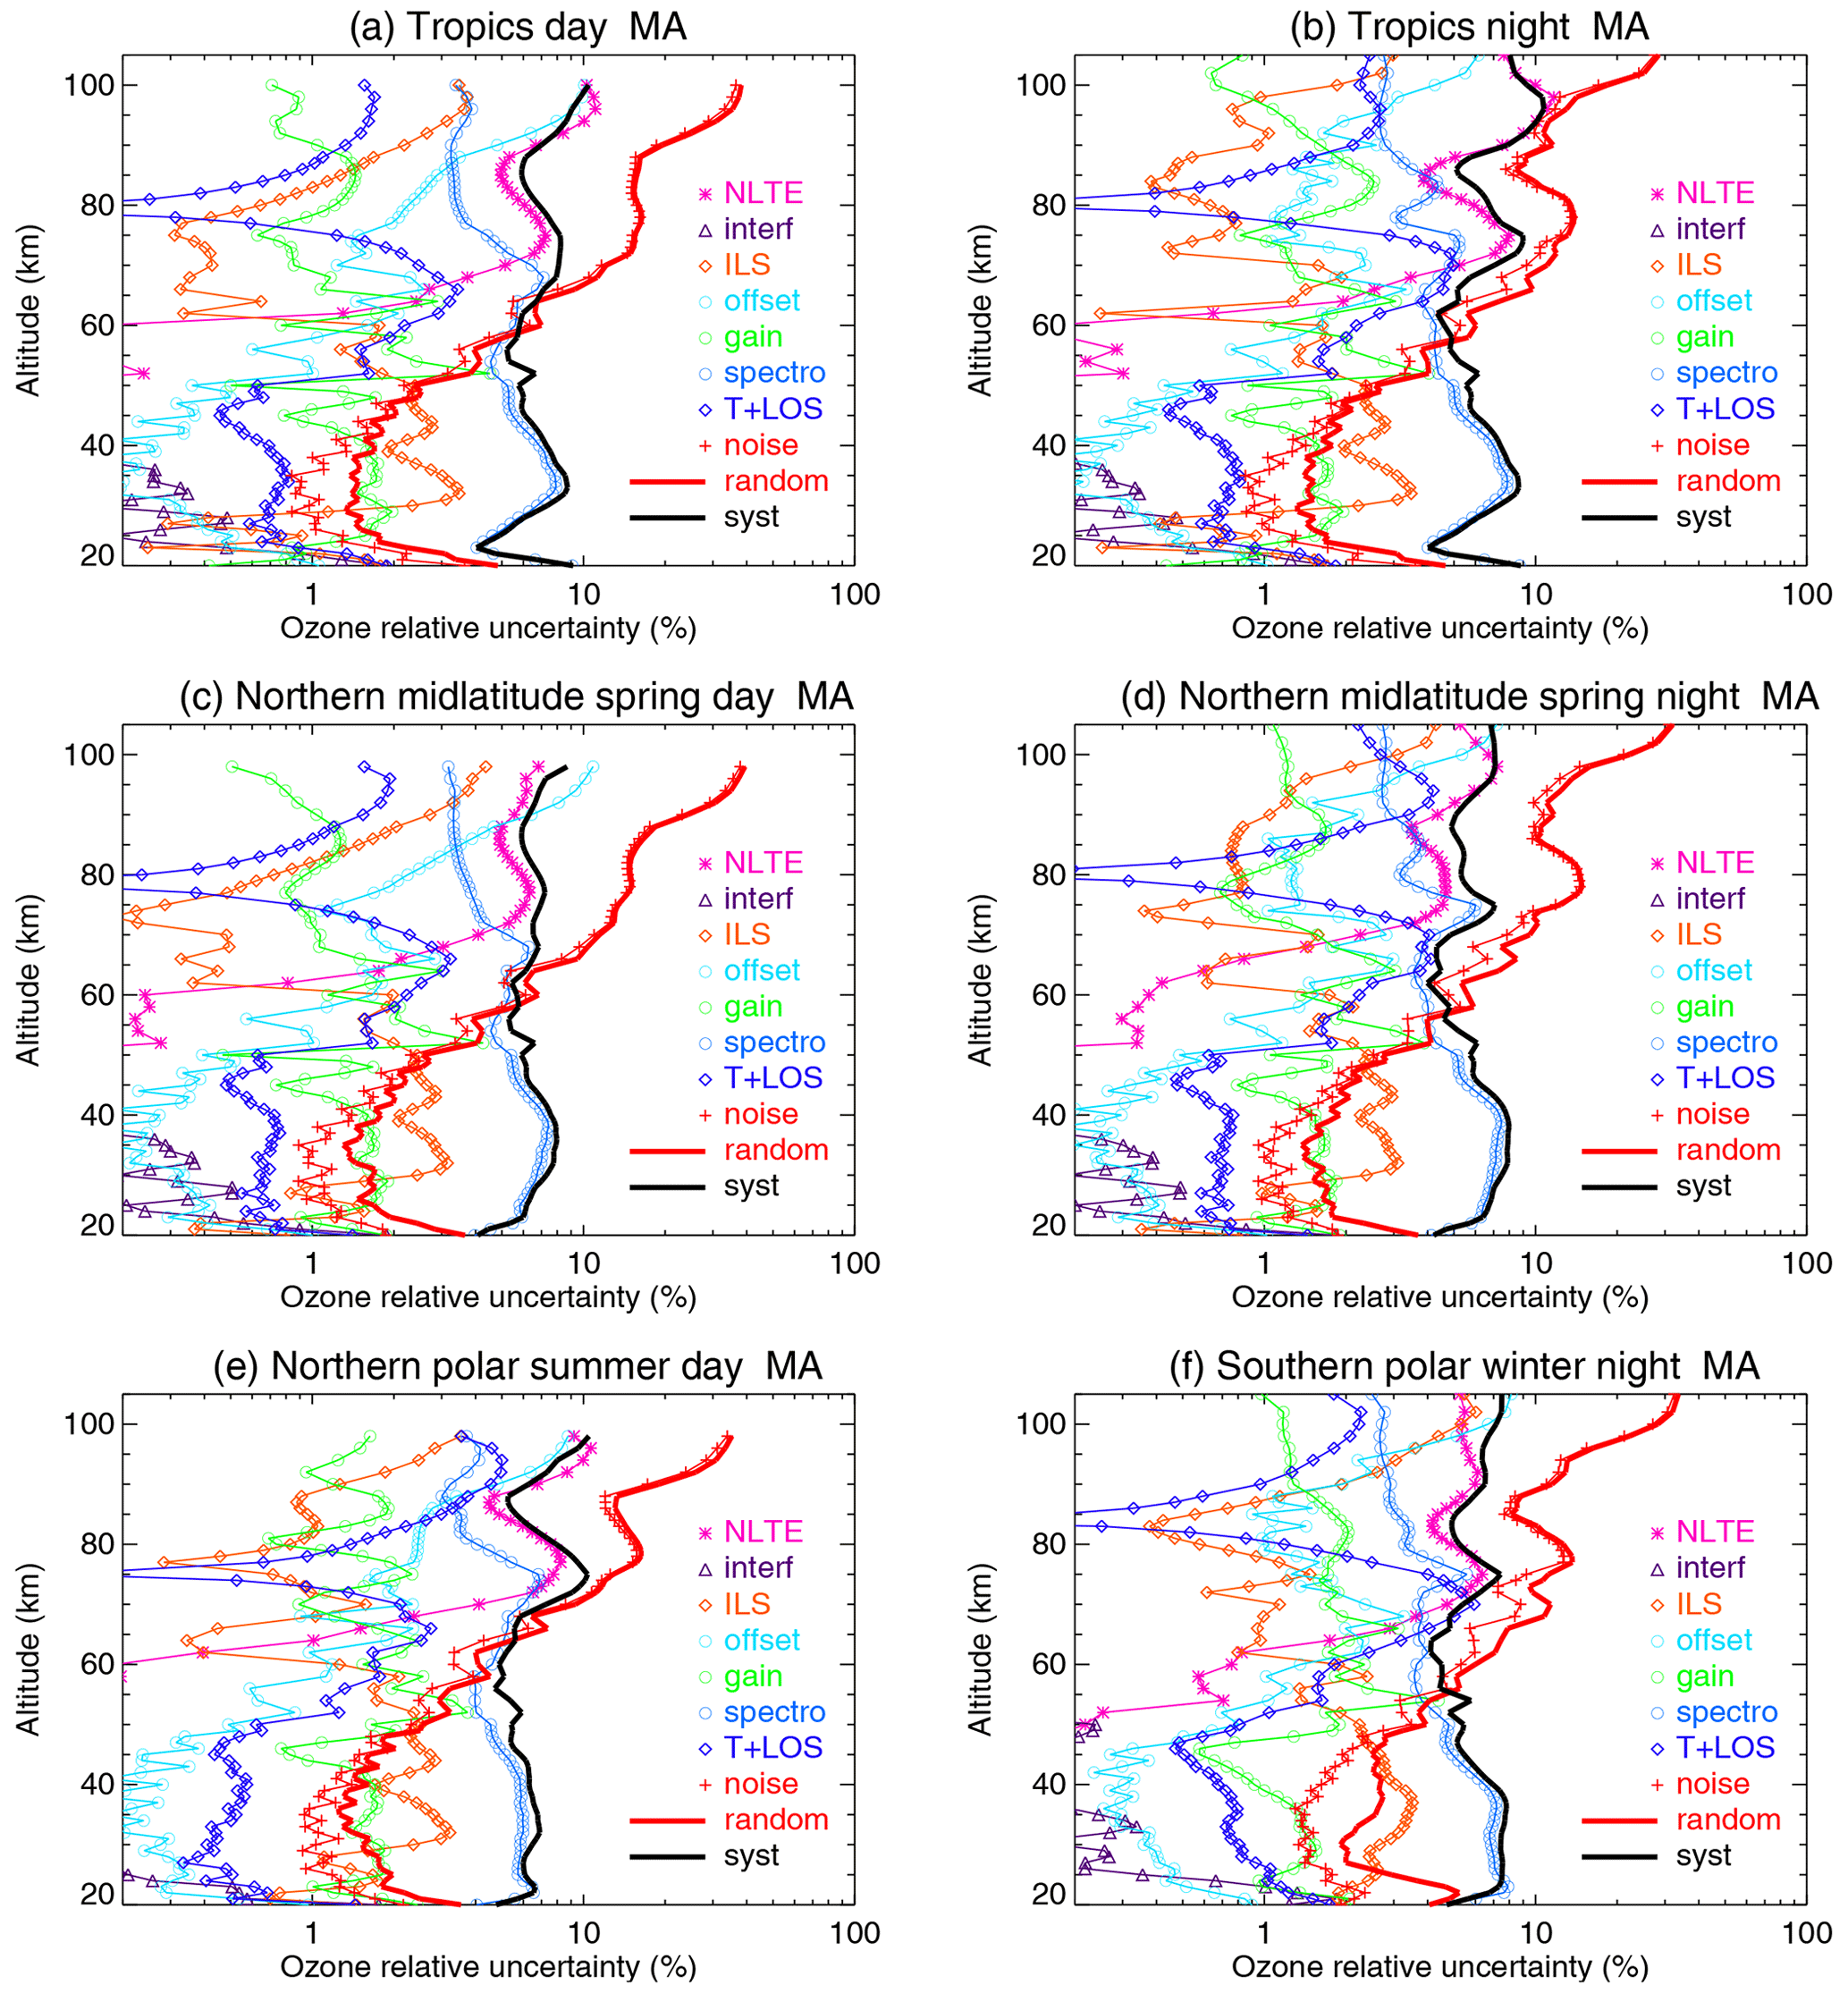
Figure 5O3 error budget for MA data for different atmospheric conditions in the tropics (a, b), northern mid-latitudes in spring (c, d) and polar regions (e, f), for daytime (a, c, e) and nighttime (b, d, f). All error estimates are 1σ uncertainties and are given in percent. Error contributions are labelled “T + LOS” for the propagated error from the T + LOS retrieval, “noise” for error due to measurement noise, “spectro” for the spectroscopic error, “gain” for gain calibration error (see text), “offset” for error due to spectral offset (see text), “ILS” for instrument line shape error (see text), “interf” for the uncertainty in the abundance of the interfering species and “NLTE” for non-LTE-related errors. The total random (“random”) and systematic (“syst”) errors are also shown.
Many error components cause both a bias and scatter and thus contribute to the random and the systematic error budget. In Fig. 5, the combined random and systematic error is shown for each error source. Both propagated measurement noise and noise-induced T + LOS errors are considered purely random. Some error sources affect the ozone retrieval via multiple pathways. First, the error affects T + LOS, and the resulting T + LOS error is further propagated to O3. Secondly, the same error affects the O3 retrieval directly. For example, radiances that are too large due to less-than-perfect gain calibration lead to high temperatures that cause lower retrieved O3 mixing ratios. Along the second pathway, radiances in the O3 band that are too large also cause higher retrieved O3 mixing ratios. In the figures, we show the net effect of both pathways, labelled by the respective error source, while the error component labelled “T + LOS” contains only the ozone error due to the propagated noise-induced T + LOS error.
In the next sections we assign the error components to the random versus the systematic category and discuss their relevance. An exception is non-LTE errors, which are very relevant in the mesosphere and above. They are analysed in a separate section, where both their random and their systematic components are discussed together.
4.2.1 Random errors
In line with the recommendation of TUNER, we consider random errors those that explain the standard deviation of the differences in co-located measurements taken by two instruments of the same state variable (von Clarmann et al., 2022).
We identified the following error sources as contributing to the random error: measurement noise, gain calibration uncertainties, offset calibration noise, T + LOS errors, uncertainties in the abundance of interfering species and the residual frequency calibration errors. Further, we also include in the random error the random variations in retrieval responses to systematic uncertainties (so-called “headache errors”; see von Clarmann et al., 2022).
The random components of the errors in Fig. 5 are shown in Fig. C1. The major component of the random error is measurement noise. Zonal-mean distributions of the ozone error due to noise for the solstice and equinox, and for the daytime and nighttime, are discussed above in Sect. 4.1.1 and are shown in Fig. 3. The noise error (+) and the total random error (thick red line) (see Fig. 5) are practically overlaid above ∼ 70 km, reflecting the predominance of noise in the random error budget at these altitudes. Above ∼ 80 km, some further contributions are made by the offset uncertainty; the random component of the NLTE error; and for some atmospheric conditions, the random component of the propagated T + LOS error. Between ∼ 70 km and ∼ 50 km, the propagation of the temperature and LOS random errors significantly contribute. Below ∼ 50 km, both T + LOS errors and the random component of the spectroscopic errors contribute significantly to the total random error.
The random component of the gain calibration error is very small, and the values shown in Fig. 5 are mainly of systematic nature. The errors induced by the uncertainties in the abundance of interfering species are significant only below about ∼ 30 km. Errors produced by the residual frequency calibration uncertainty are negligibly small and are not shown.
The total random error varies between ∼ 1 %–2 % near 30 km and increases with altitude, reaching 20 %–30 % in the upper mesosphere–lower thermosphere. In this region, it is larger in the daytime than at nighttime. In the lower stratosphere, due to the temperature decrease, it also increases (see more details in Kiefer et al., 2023). The random O3 error is generally larger than the total systematic uncertainty above around ∼ 60 km.
4.2.2 Systematic errors
The sources of systematic errors in MIPAS O3 retrievals from middle-atmosphere measurements are as follows: uncertainties in spectroscopic data, instrument line shape uncertainties, the gain calibration error and non-LTE-related uncertainties. The systematic components of the errors in Fig. 5 are shown in Fig. C2. The systematic error is dominated by the spectroscopic data error below ∼ 60 km. In this region, the ILS also contributes significantly and, to a lesser extent, the gain calibration uncertainty. Above ∼ 60 km the systematic errors are dominated by the non-LTE uncertainties, which are discussed below, but the spectroscopic data error also contributes significantly, being in some cases comparable to or even larger than the non-LTE errors. The ILS contribution is also appreciable at very high altitudes, above ∼ 90 km.
4.2.3 Non-LTE errors
The non-LTE error includes both uncertainties in the collisional and kinetic rate constants and uncertainties in the abundances of atmospheric species required for the non-LTE modelling, namely, atomic oxygen (O) and hydrogen (H). Abundances of these species are uncertain due to uncertainties in the kinetic constants of the photochemical model used to infer them or due to biases in the trace gas climatologies used. Both errors are primarily systematic, i.e. bias-generating, while their random component is less relevant. Only in a few conditions and at a few altitudes is the random component of the non-LTE significant, e.g. near 95 km during the daytime in the tropics and in the northern polar summer (see Fig. 5).
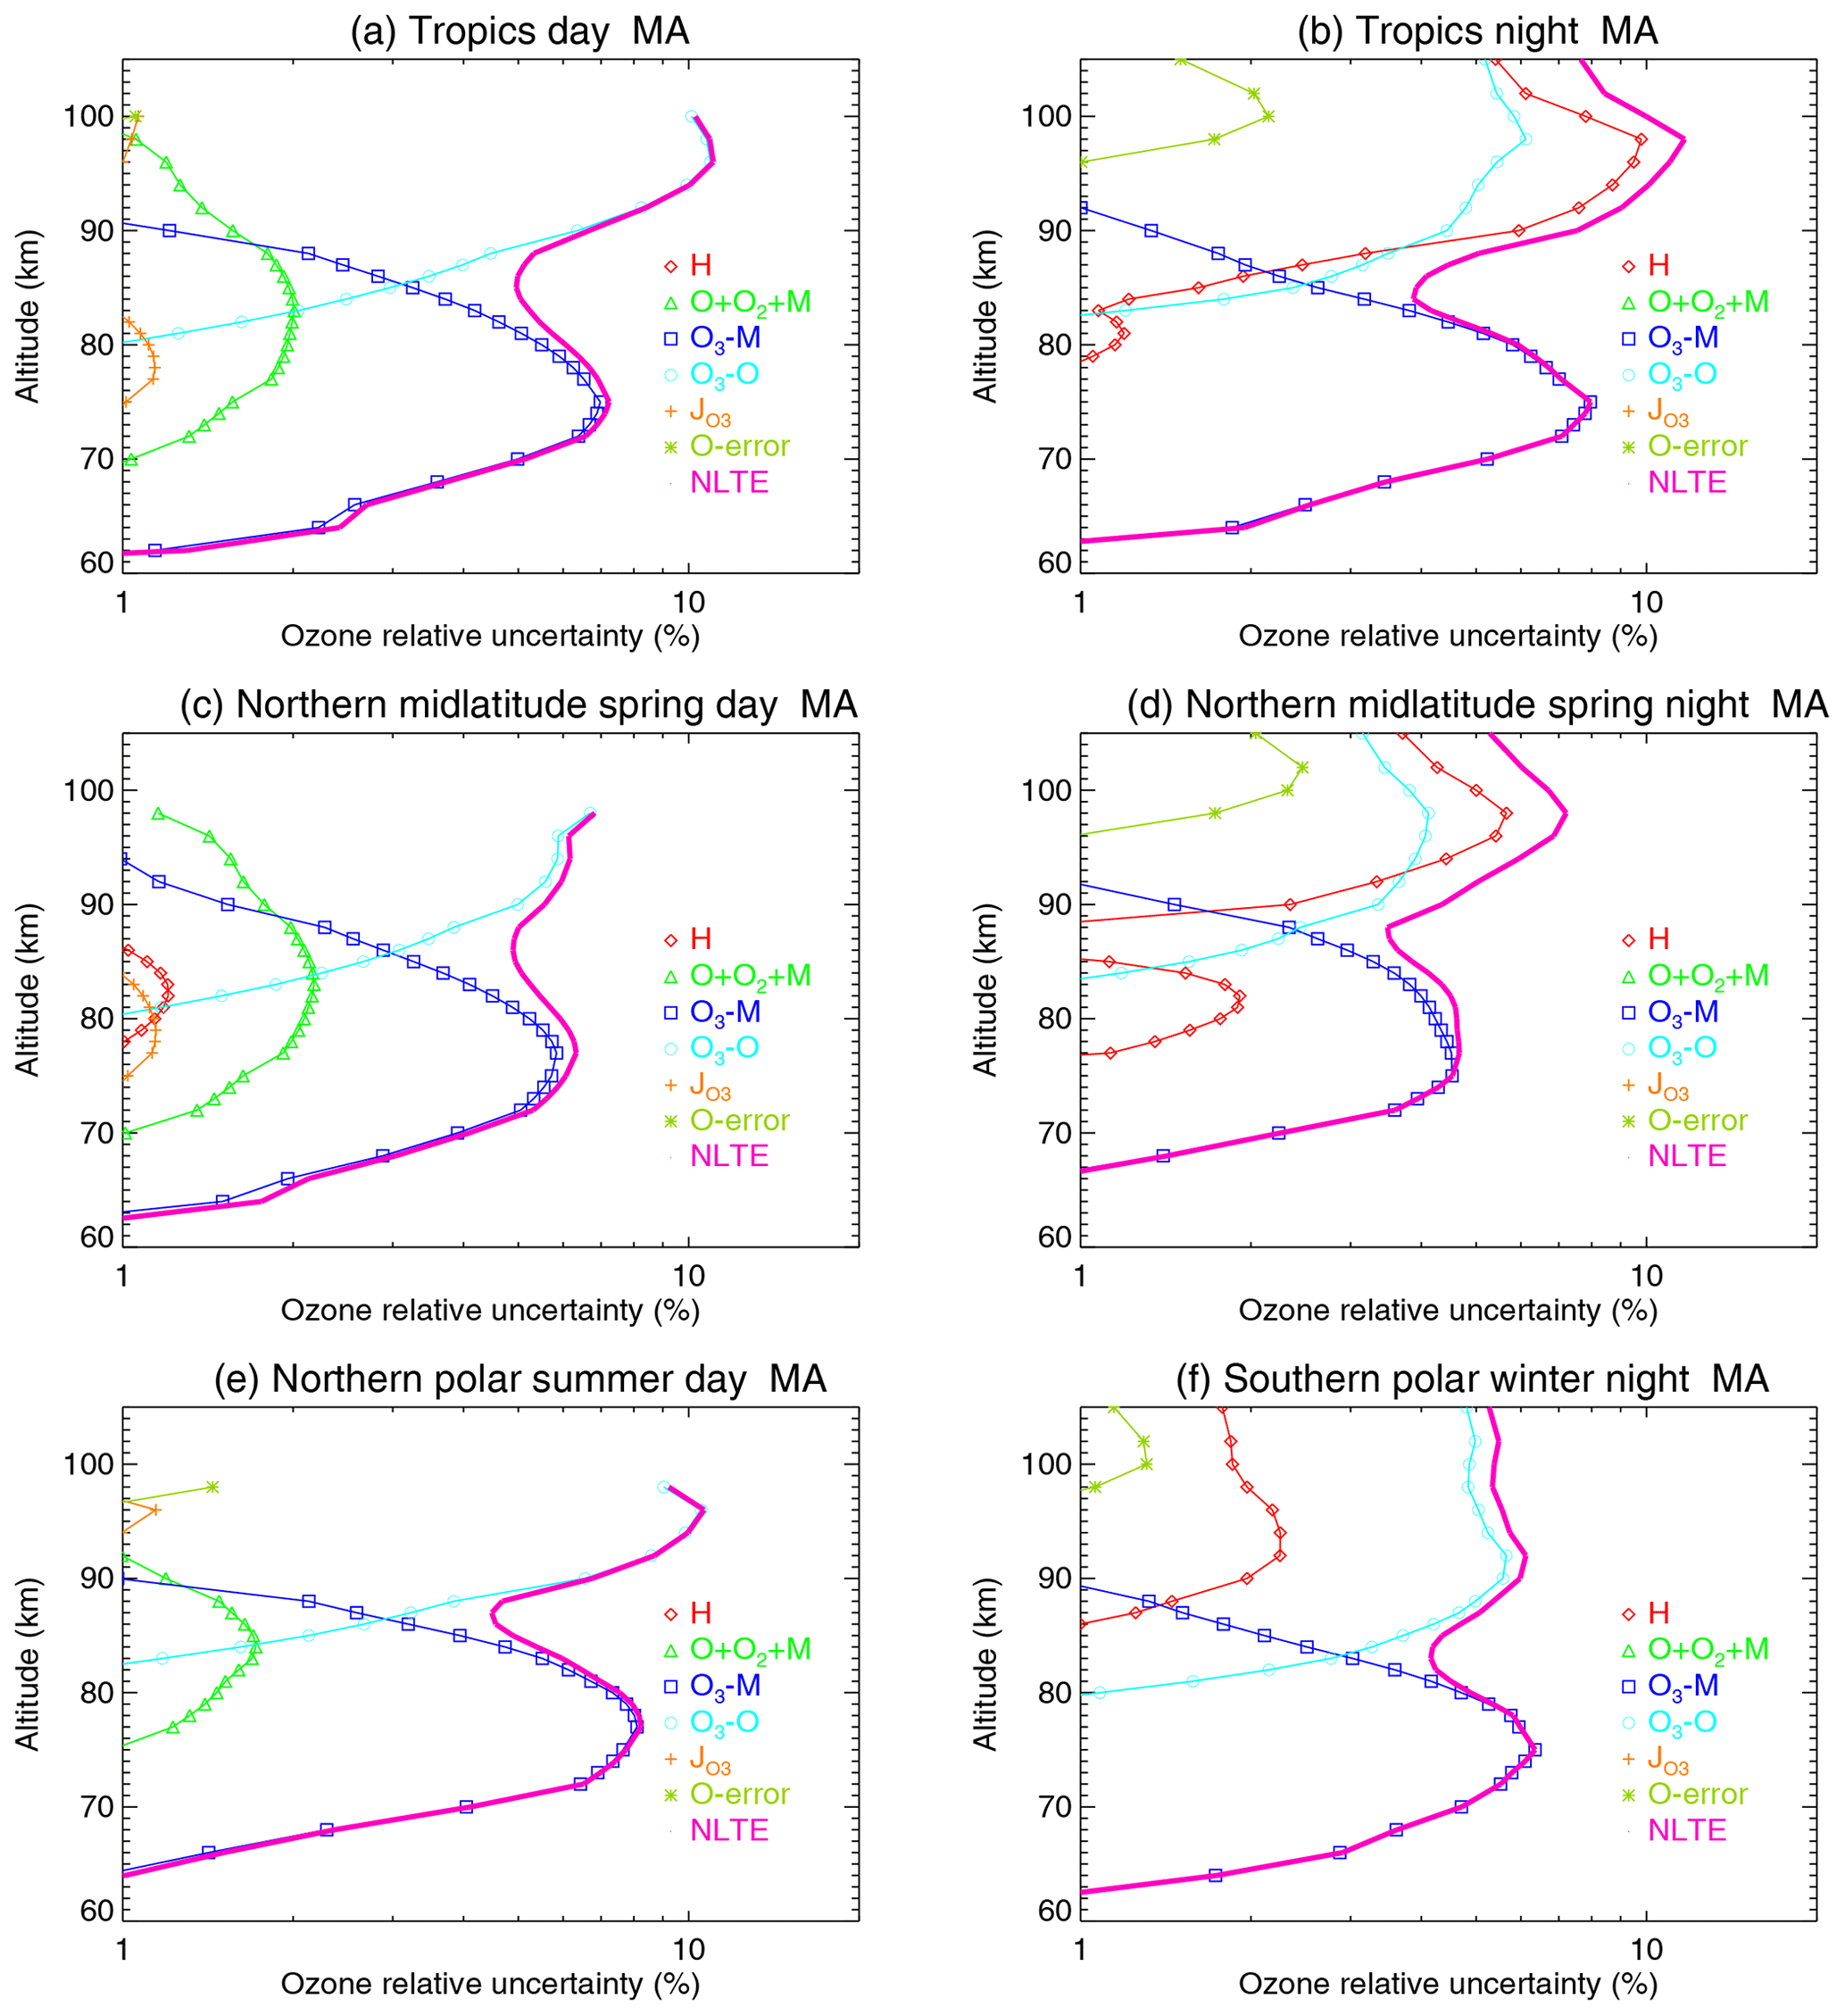
Figure 6O3 non-LTE error budget for MA data for different atmospheric conditions in the tropics (a, b), northern mid-latitudes in spring (c, d) and polar regions (e, f), for daytime (a, c, e) and nighttime (b, d, f). All error estimates are 1σ uncertainties and given in percent. Error contributions are labelled as follows: “H” the error due to [H], “O + O2 + M” the error due to k1, “O3 − M” the error due to kvt,M, “O3 − O” the error in kvt,O, “” the error in the photo-absorption coefficient , “O-error” the error in [O] above ∼ 95 km, and “NLTE” the total non-LTE contribution. See Table 1 for the different rates and their assumed errors.
The different components of the non-LTE errors corresponding to the atmospheric conditions of Fig. 5 are shown in Fig. 6. Non-LTE errors are only significant above ∼ 70 km and are in the range of 1 % to 10 %. In the region of 65–85 km the non-LTE error is dominated by the uncertainty in the thermal relaxation of O3(v1,v3) by N2 and O2, process 5, kvt,M, in Table 1, and above ∼ 85 km the non-LTE error is dominated by the errors in the collisional relaxation reaction of O3(v1,v3) with atomic oxygen, process 6, kvt,O, in Table 1, and by uncertainties in the abundances of atomic hydrogen. The latter is the largest contributor above ∼ 90 km under nighttime conditions at tropical and middle latitudes. The error component due to atomic oxygen abundances in the region where it is not retrieved (z ≳ 95 km) contributes moderately at the highest altitudes. The error contribution of the reaction rate of O3 formation (k1 in Table 1) is negligible during the nighttime and below 2 % during the daytime. The error due to the photo-absorption coefficient is hardly 1 % near 80 km during the daytime. Overall, the non-LTE errors are typically negligible (smaller than 1 %) below 60 km, 2 %–8 % at 60–85 km and slightly larger at 5 %–12 % above 85 km.
The average impact on the ozone retrieval after including the changes discussed in Sect. 2, i.e. differences between the current data version V8R_O3_m61 and the previous version V5R_O3_m22, is an increase of 2 %–5 % (0.2–0.5 ppmv) below around 50 km (see Figs. 7 and 8a). Also, there is a clear decrease by ∼ 2 %–4 % between 50 and 60 km, mainly in the tropics and mid-latitudes (see Fig. 8b). In the region between 70 and 85 km we observe an oscillating behaviour of the differences with amplitudes smaller than ∼ 10 %. The concentration of O3 at these altitudes is very small (below ∼ 0.5 ppmv); hence these differences are not of much importance in absolute terms (see left panels of Fig. 7).
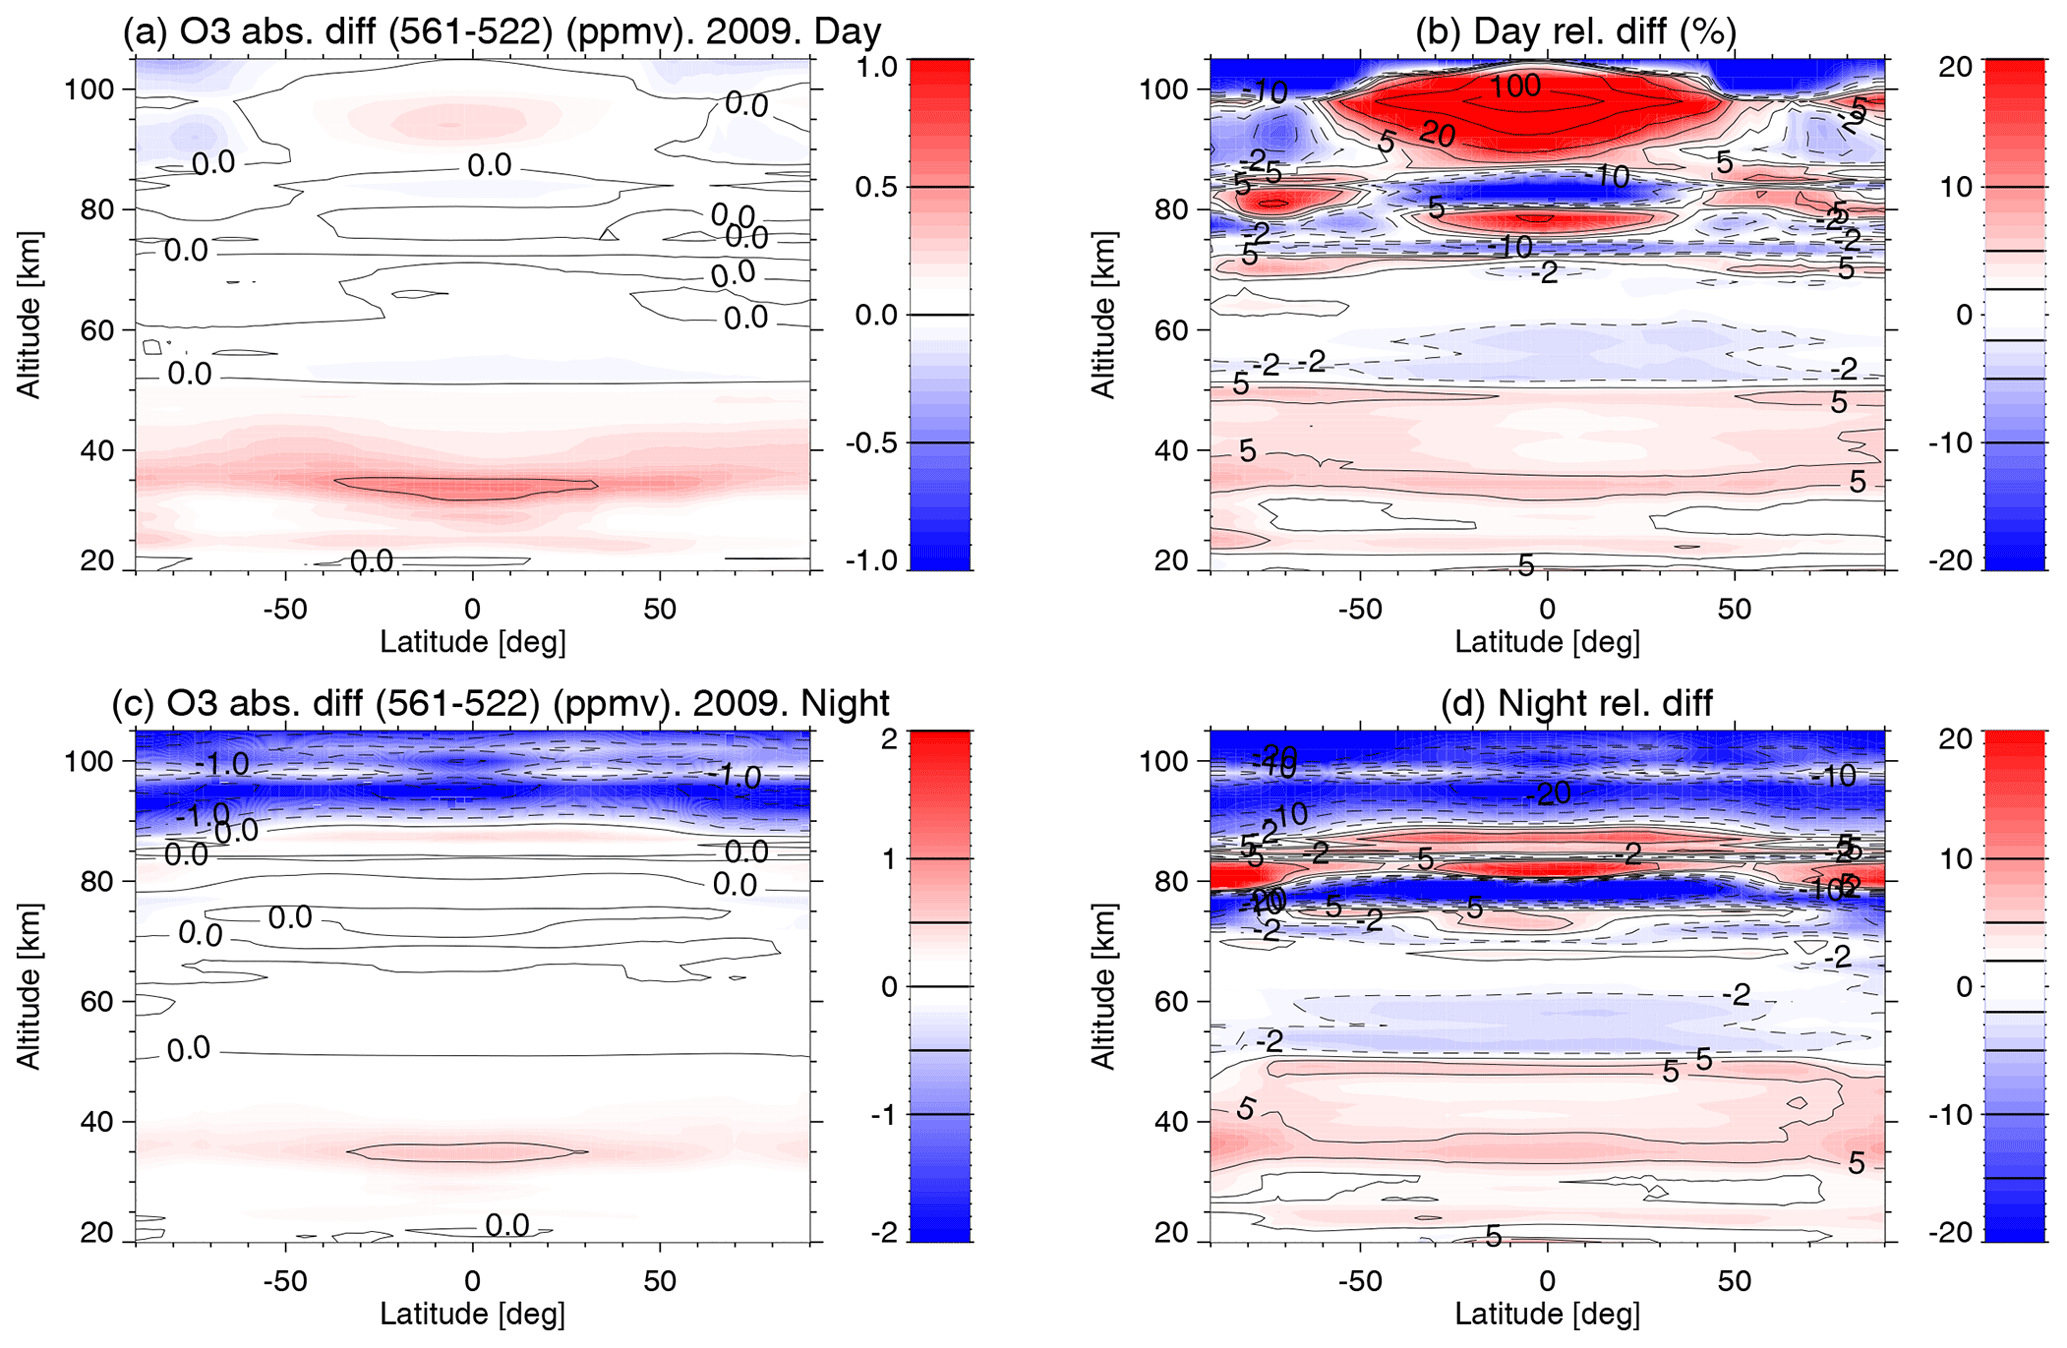
Figure 7Comparison of O3 abundance retrieved in V8R_O3_561 with the previous V5R_O3_522 version for daytime conditions (10:00) (a, b) and nighttime conditions (c, d). The plots show the mean of the differences, as a percentage of the older version, (V8R_O3_561 − V5R_O3_522) V5R_O3_522, for all data taken in 2009. Note that in panel (b) there are two contours, 50 % and 100 %, which are beyond the colour scale. That is, differences larger than 20 % are coloured with the brightest red.
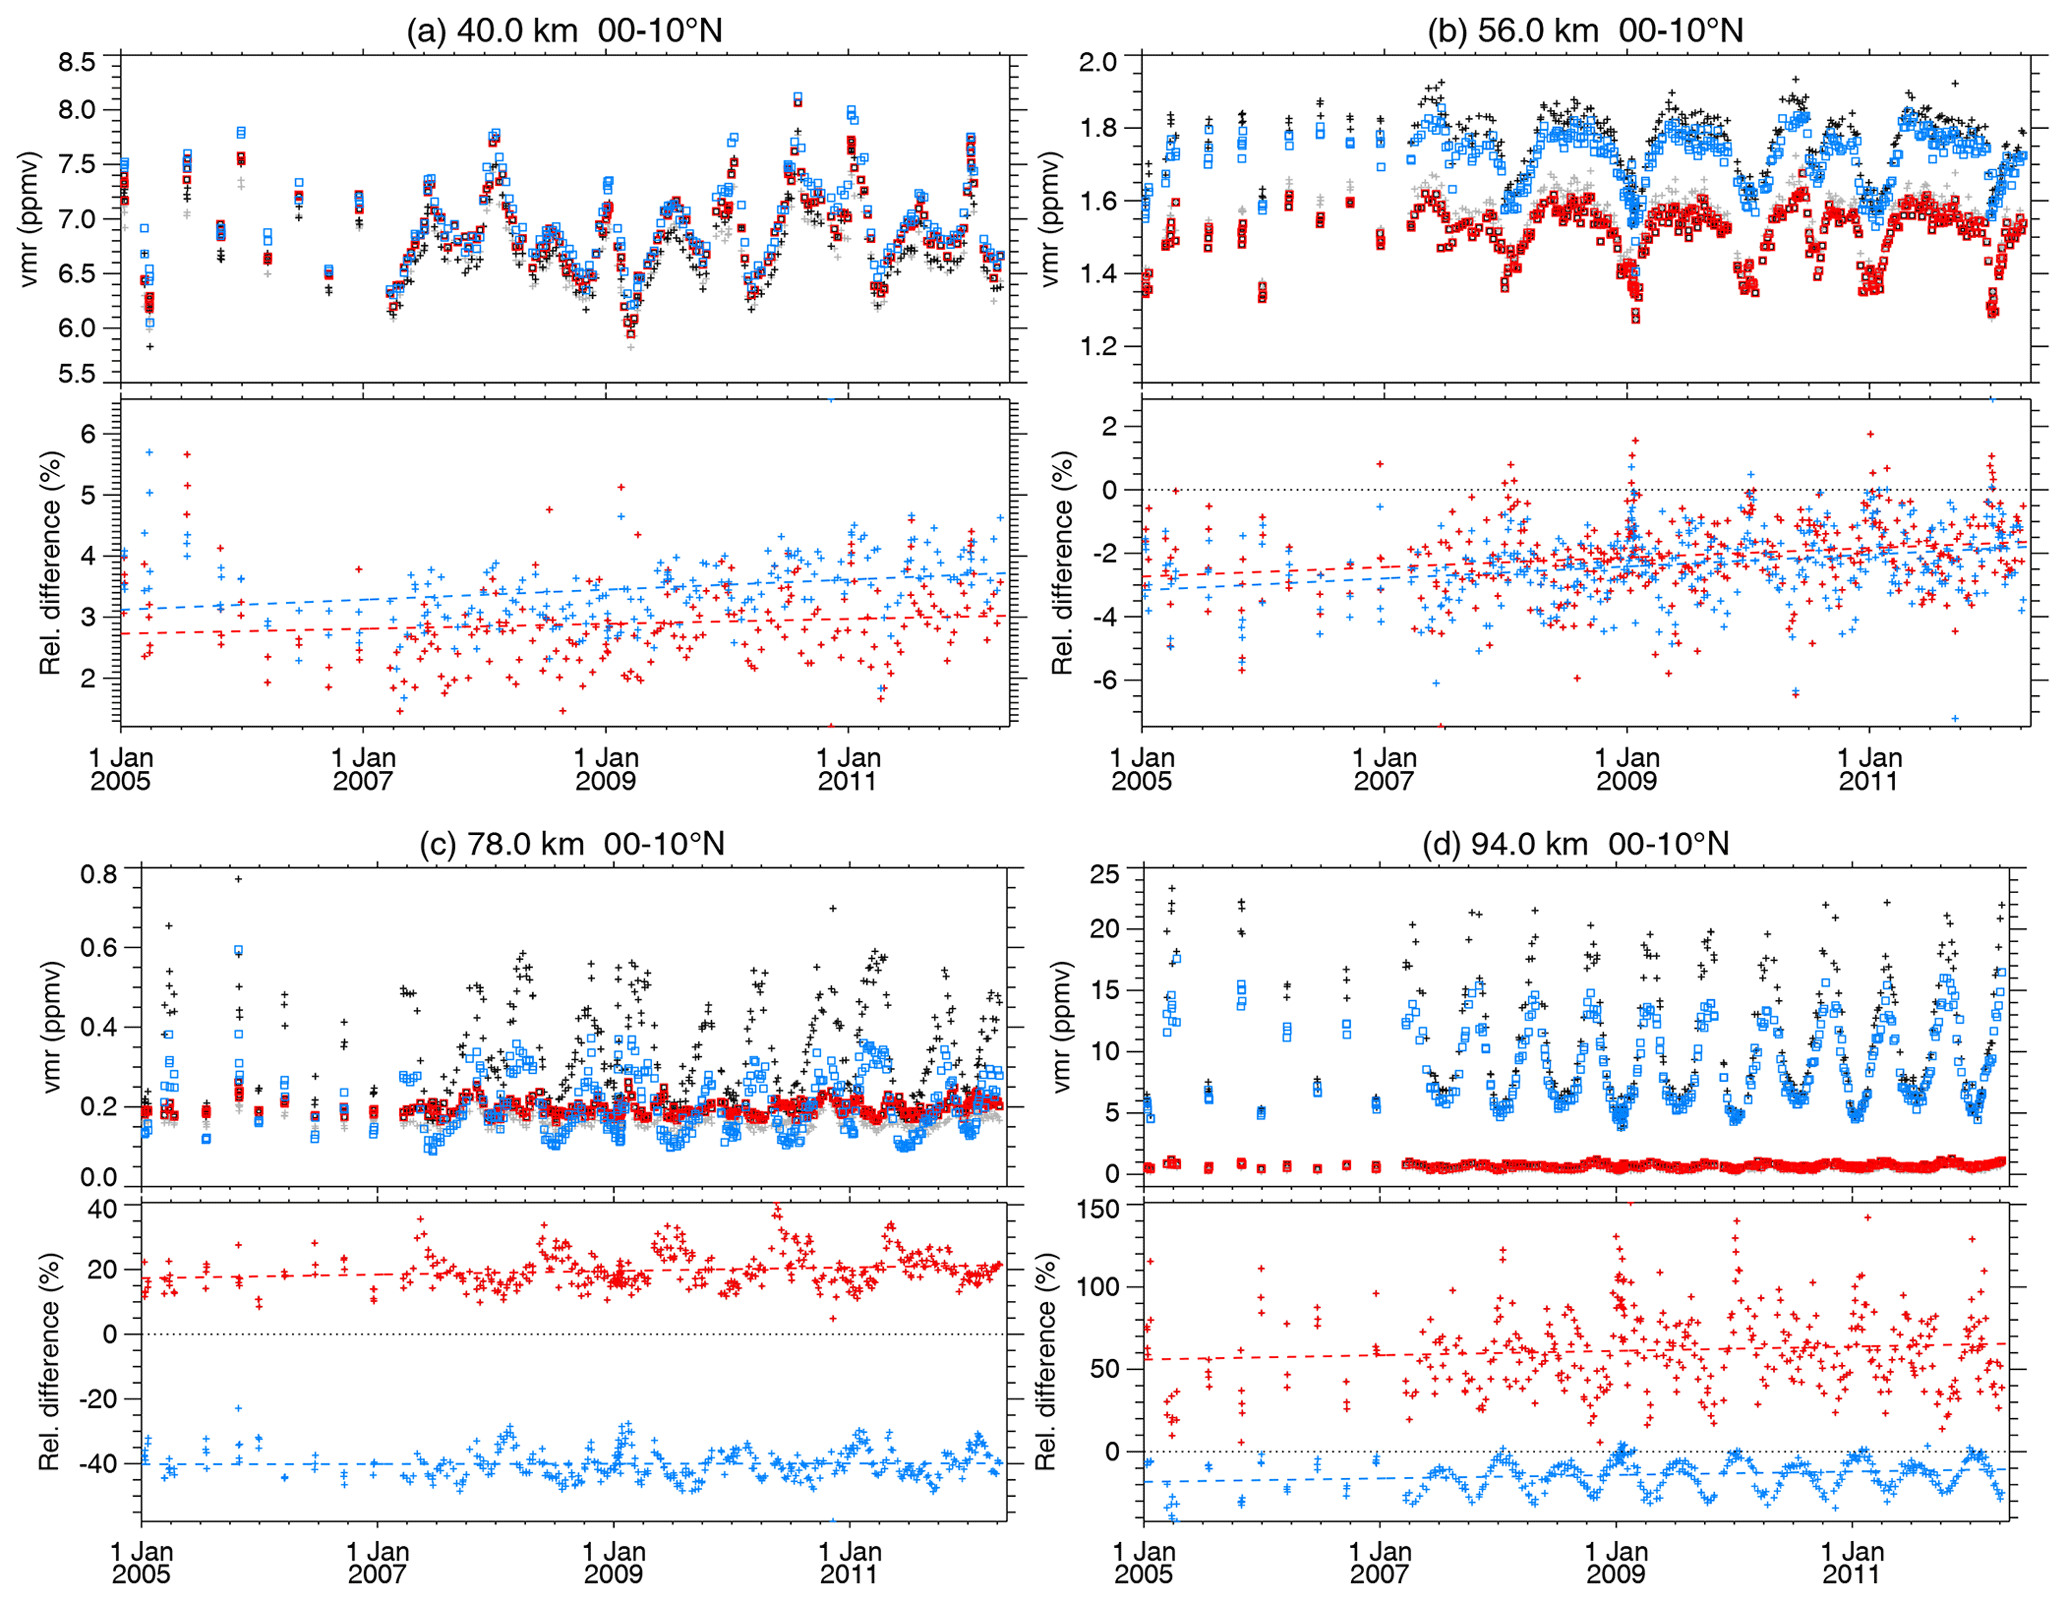
Figure 8Comparison of O3 abundance retrieved in the V8R_O3_561 version with that in the previous V5R_O3_522 version for daytime (10:00) (red, light pluses) and nighttime (22:00) (blue, dark pluses). Squares: V8R_O3_561; pluses: V5R_O3_522. The top and bottom parts of the panels show the time series of O3 VMR and of the relative differences, (V8R_O3_561 − V5R_O3_522) V5R_O3_522, respectively. Panels (a–d) are for 40, 56, 78 and 94 km, respectively, all for 0–10∘ N.
The position and magnitude of the O3 tertiary maximum, located near 70 km at high winter latitudes, are very similar in both versions, with no significant difference. This can be seen, for example, in a comparison between panels (d) and (f) in Fig. D5 with the corresponding panels in Fig. 15 of López-Puertas et al. (2018).
The nighttime O3 minimum just below 80 km is more pronounced in the new version. This is seen in Figs. 7d and 8c, as well as in a comparison in Fig. D5b with the corresponding panel in Fig. 15 of López-Puertas et al. (2018). Nevertheless, it is interesting to note that the O3 fields near 78 km show larger values in the daytime than at nighttime (see Figs. 8c and D3). This day–night difference is of a different sign than in the previous version (see Fig. 13 in López-Puertas et al., 2018) but is in agreement with both SABER measurements and WACCM predictions (see López-Puertas et al., 2017). Hence, the new O3 dataset in this region seems to have improved and shows a more realistic diurnal variation in the mesosphere.
The O3 concentration in the secondary maximum during the daytime in the tropics and mid-latitudes is about 40 % larger in the new version compared to the previous version (see Figs. 7b and 8d). In absolute terms, this difference amounts to 0.2–0.3 ppmv only. The daytime secondary maximum is also situated about 1–2 km higher than in the previous version (e.g. compare panel (a) in Fig. D5 with the same panel in Fig. 15 of López-Puertas et al., 2018). The cause of these differences is the use of a different a priori O3, the WACCM-corrected fields instead of the values of the Garcia and Solomon (1994) model, together with the relatively low vertical resolution of MIPAS in this region for daytime (see left panels of Fig. 1). This effect outweighs the smaller O3 values expected from the lower photo-absorption coefficient and the lower deactivation rate of the O3(v1,v3) states by atomic oxygen (see Sect. 2).
The most significant change in the mesosphere occurs at nighttime in the secondary maximum, where O3 in the new version is reduced by between 10 %–30 % (see Figs. 7d and 8d). This is caused mainly by the lower collisional relaxation/chemical removal rate of the O3(v1,v3) states by atomic oxygen, a factor of 2 smaller (see Sect. 2.2.3). This feature can also be appreciated very clearly when comparing Fig. D2 and Fig. 12 in López-Puertas et al. (2018), particularly near the tropics under equinox conditions, when the maximum of O3 occurs. Further, the reduced ozone abundances in the secondary maximum during the nighttime are also evident when comparing Fig. D5b and Fig. 15b of López-Puertas et al. (2018).
In order to obtain comprehensive long-term datasets for studying possible changes and trends of atmospheric state variables, it is often necessary to rely on data from different sources. In that sense, the NOM and MA/UA MIPAS O3 datasets can be used in combination. For this purpose, it is important to know the consistency between these datasets. The NOM dataset has the advantage that measurements were taken more frequently. These measurements, however, cover a limited altitude range and include non-LTE, which is expected to be important in the 50–70 km altitude range, in an approximate way only (Kiefer et al., 2023). In contrast, the MA/UA V8R dataset described here covers a wider altitude range but is rather discontinuous in time. Only about 1 of 10 d was reserved for each of these measurement modes. Differences between both datasets are shown in Fig. 9 for four seasons and separately for 10:00 and 22:00. The general pattern is that both datasets seem to be very consistent. Differences are generally within 1 %–2 %. The larger differences appear in the lower mesosphere (60–70 km) during the daytime where NOM O3 concentrations seem to be generally larger by about 2 % to 10 % compared to those of the MA/UA dataset for most latitudes. These differences are attributed to a more accurate account of non-LTE, known to be more pronounced in the daytime. One clear exception to that general feature is the tertiary maximum occurring near 60–70 km under polar winter conditions (near the North Pole during DJF and close to the South Pole in JJA). In these regions, MA/UA O3 concentrations are larger by ∼ 5 %–10 %. A similar situation occurs near the South Pole for MAM, where MA/UA O3 abundances are also larger. A candidate explanation for these differences is that NOM retrievals do not include appropriately the O3 field above its uppermost tangent height of the measured spectra (∼ 70 km). There are also other patches at high latitudes and at different altitudes where the NOM O3 concentrations are slightly larger by 2 %–3 % than those of MA/UA, but these are small and do not appear to be systematic.
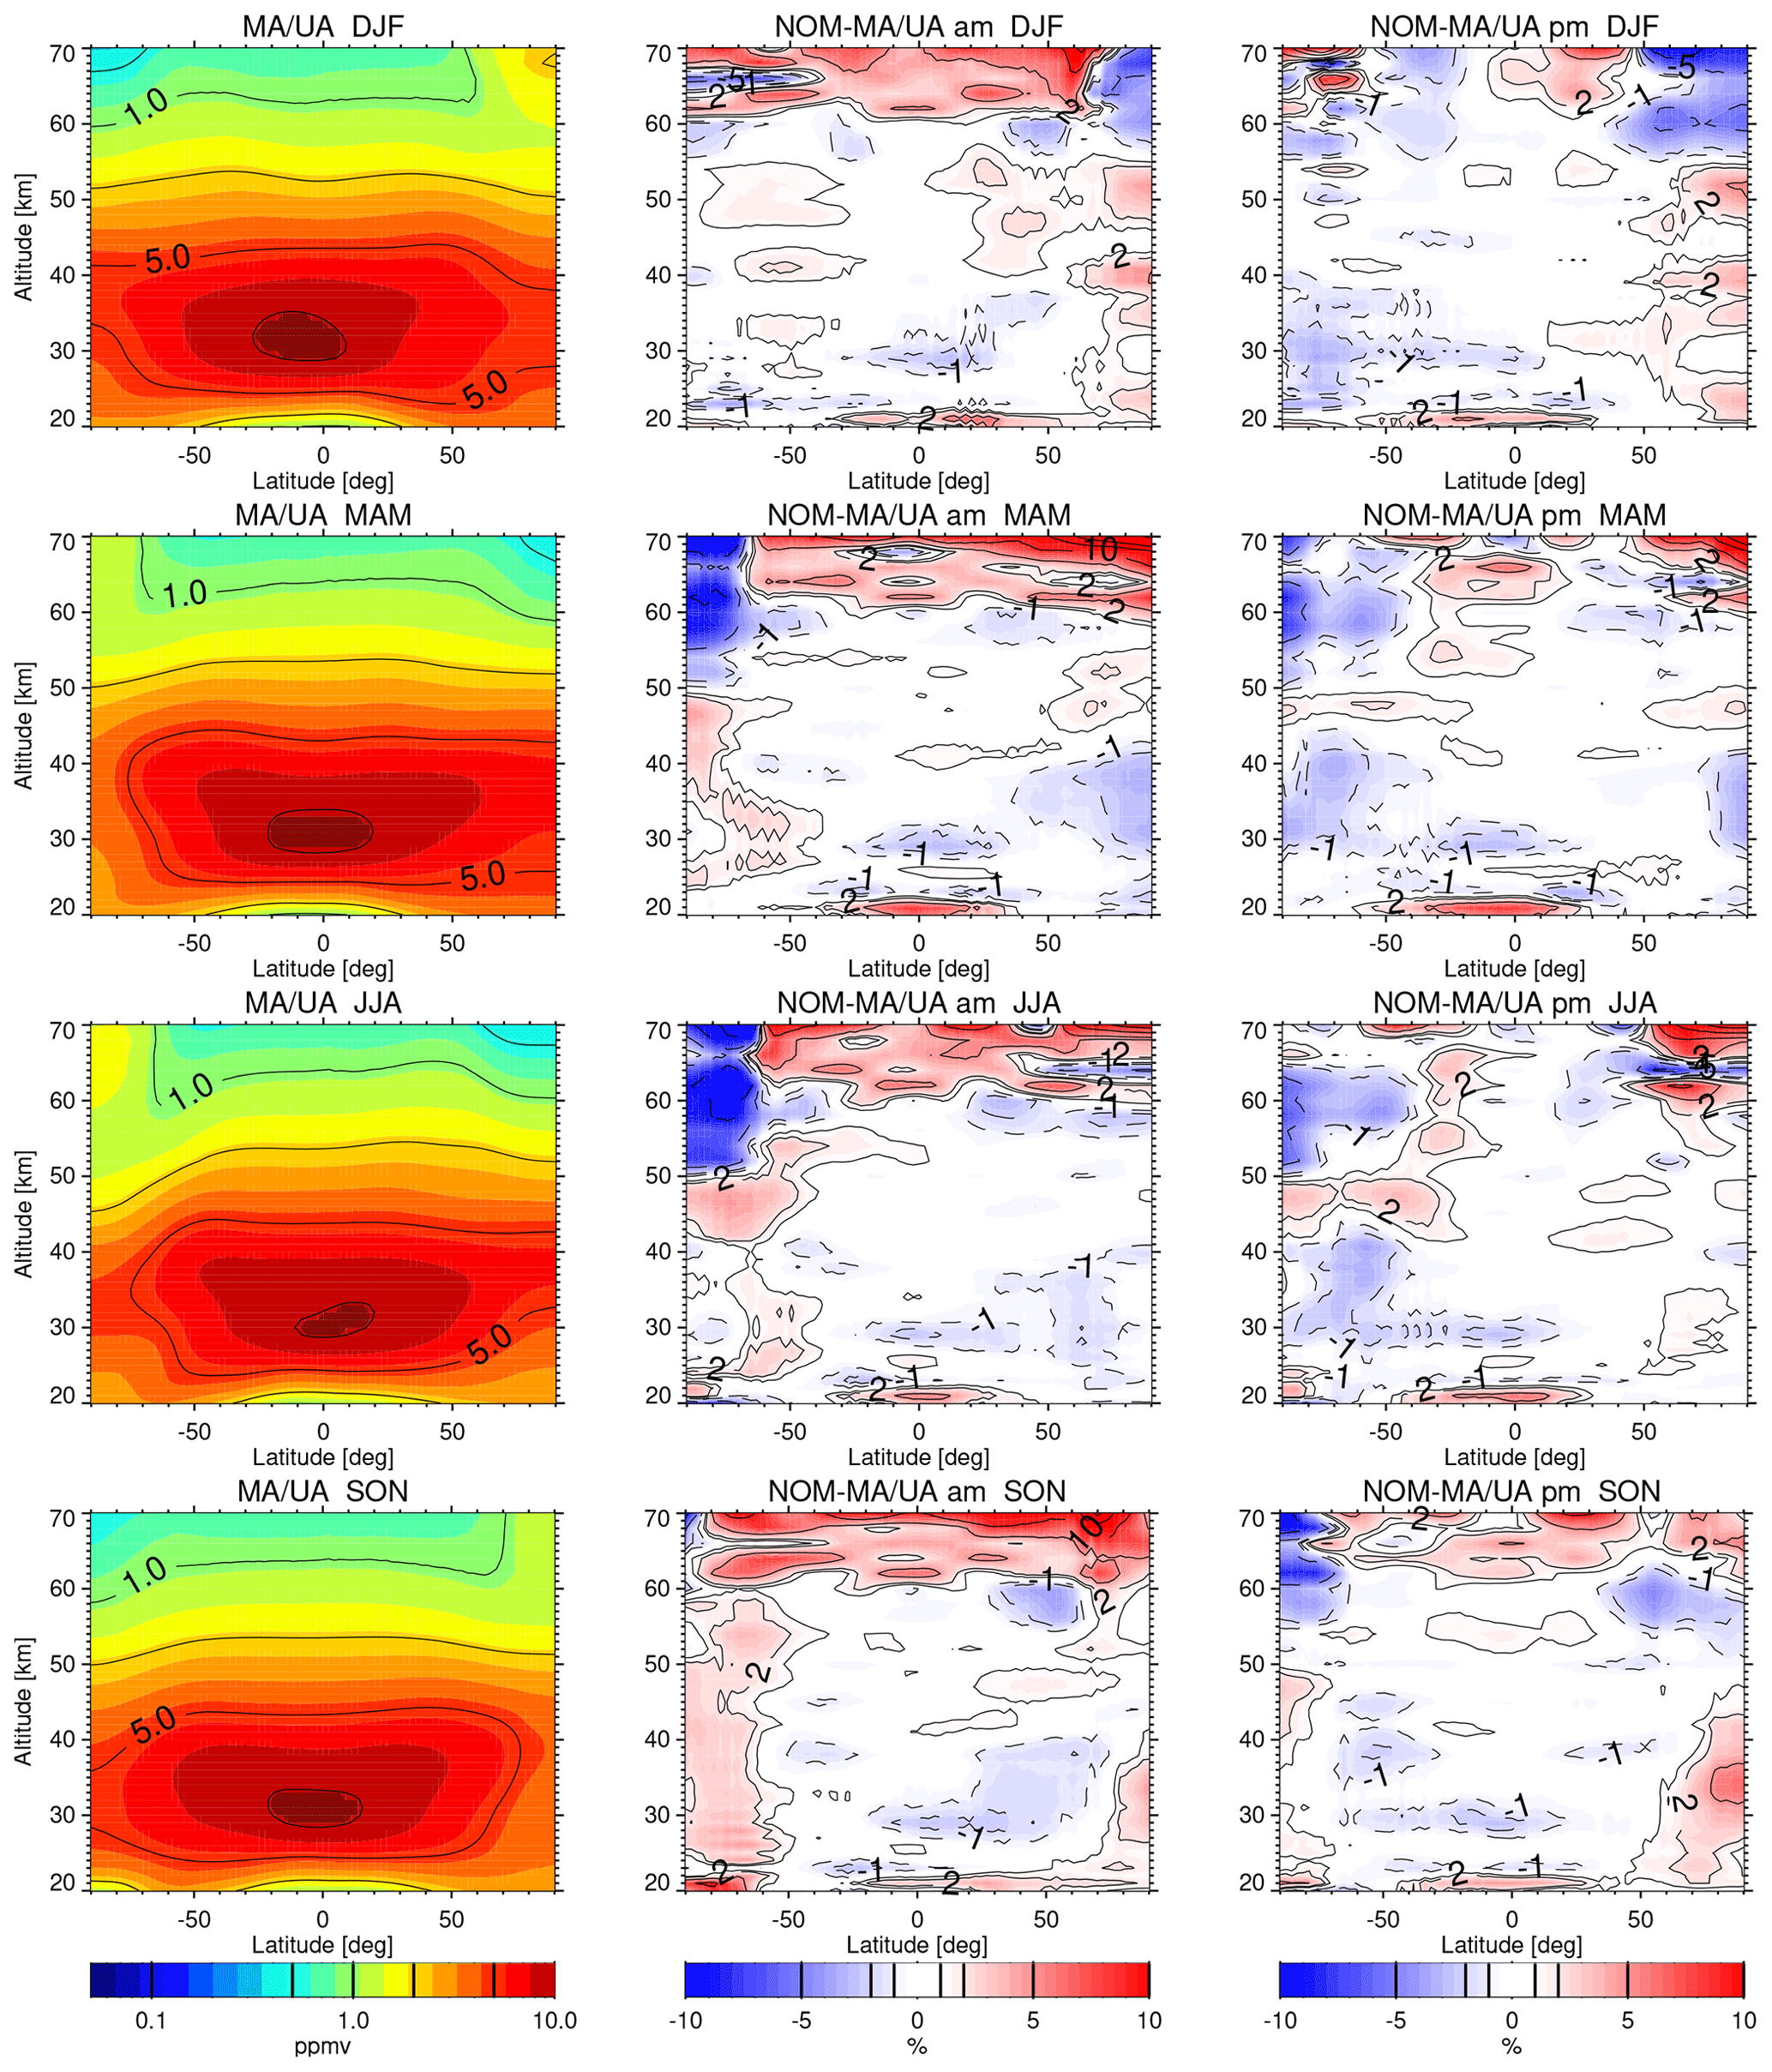
Figure 9Comparison of O3 zonal-mean abundances retrieved in the V8R MA and UA data with the V8R NOM data for four seasons (rows), from top to bottom, for the northern winter season (December–February, DJF), for the northern spring (March–May, MAM), for the northern summer winter (June–August: JJA) and for northern autumn (September–November, SON). The left panels show the zonal mean of V8R MA/UA data, including 10:00 and 22:00. The central and right panels show the NOM–MA/UA differences for daytime (10:00) and nighttime (22:00). The averages cover the measurements taken from 2006 through 2011.
We have compared MIPAS retrievals of this new version of O3, V8R_O3_m61, with co-located measurements from SABER, GOMOS, MLS, SMILES and ACE-FTS in a similar way to what we did for the previous version (López-Puertas et al., 2018). We have used more recent data versions from MLS and ACE-FTS.
Comparisons for GOMOS are only for nighttime conditions and are performed in number density. For ACE-FTS, because it is an occultation instrument and O3 has very large diurnal variations around the terminator in the middle and upper mesosphere, we compare ACE sunset and sunrise with MIPAS observations taken at solar zenith angles (SZAs) from 88 to 92∘. We kept the same co-location criteria as in the previous version; e.g. we selected pairs of profiles of the different instruments with universal time differences smaller than 2 h and distances smaller than 1000 km.
7.1 Instruments
7.1.1 SABER
SABER (Sounding of the Atmosphere using Broadband Emission Radiometry) is a broadband radiometer flying on board NASA's Thermosphere ⋅ Ionosphere ⋅ Mesosphere ⋅ Energetics and Dynamics (TIMED) satellite, launched in December 2001 and starting operations in January 2002 (Russell et al., 1999). It measures from 83∘ S to 52∘ N and from 52∘ S to 83∘ N alternatively every 2 months. A 24 h local time coverage is completed in ∼ 60 d. The instrument measures the ozone limb emission at 9.6 µm during the daytime and nighttime, and the ozone concentration is retrieved from 10 to 100 km using a non-LTE model (Mlynczak et al., 2013). Here we use version 2.0 of O3 retrieved from the 9.6 µm channel, publicly available at http://saber.gats-inc.com (last access: 9 November 2023). SABER's ozone precision is ∼ 1 %–2 % in the stratosphere and ∼ 3 %–5 % in the lower mesosphere (Rong et al., 2009). The systematic errors range from 22 % in the lower stratosphere to ∼ 10 % in the lower mesosphere. The vertical resolution of SABER ozone is approximately 2 km. Given the MIPAS O3 coarser vertical resolution, particularly in the daytime mesosphere, we used the MIPAS averaging kernels and a priori O3 to smooth SABER O3 profiles.
7.1.2 GOMOS
The Global Ozone Monitoring by Occultation of Stars (GOMOS) instrument was a stellar occultation spectrometer on board the ESA's Envisat space platform (Bertaux et al., 2010) and operated from August 2002 to April 2012. GOMOS took measurements at 250−692 nm, and O3 nighttime density profiles were derived from 10 to 110 km. The latitudinal coverage is uneven, providing data at low latitudes at around 22:00–23:00 LST and eventually reaching the poles and slightly varying throughout the year. We used here ESA Instrument Processing Facilities (IPF) version 6.01, which is described in Kyrölä et al. (2010) and Sofieva et al. (2010). These data are available from the ESA Earth Online portal (https://earth.esa.int, last access: 9 November 2023). Unreliable profiles have been removed following the recommendations of the GOMOS/6.01 Level 2 Product Quality Readme File.
GOMOS O3 vertical resolution changes from 2 km in the lower stratosphere to 3 km in the upper stratosphere and above. Because this resolution is better than that of MIPAS, we applied MIPAS averaging kernels to the GOMOS profiles. Because GOMOS provides O3 number density, we compare the GOMOS and MIPAS O3 number densities. Random errors due to measurement noise and scintillations are 0.5 %–4 % in the stratosphere and 2 %–10 % in the mesosphere. Systematic errors are smaller than 2 %, mainly induced by the O3 spectroscopic data (Tamminen et al., 2010).
7.1.3 MLS
The Microwave Limb Sounder (MLS) was launched in July 2004 on NASA's Earth Observing System Aura satellite (Waters et al., 2006). The ozone dataset used here is version 5.0–1.1a, downloaded from GES DISC (Schwartz et al., 2015) and described by Livesey et al. (2022). One of the major differences in this data version compared to previous ones is that the ozone retrieval uses larger a priori errors at high altitudes, making the retrieved O3 less dependent on the a priori. Thus, it can be used up to higher altitudes, to 0.002 to 0.001 hPa (∼ 90 km). We used here daytime and nighttime O3 profiles from the stratosphere up to 0.001 hPa (∼ 90 km; see https://mls.jpl.nasa.gov (last access: 9 November 2023). This is an important difference with respect to the previous comparison carried out by López-Puertas et al. (2018), where it was limited to ∼ 72 km.
The vertical resolution of MLS ozone profiles is 3 km in the stratosphere, 6 km in the middle mesosphere and 9 km in the upper mesosphere. The estimated systematic uncertainty is 5 %–10 % in the stratosphere, 10 %–20 % in the lower mesosphere and 20 %–40 % in the middle mesosphere (with a larger error of 100 % near 80 km) (see Table 3.18.2 in Livesey et al., 2022). Since the MLS O3 vertical resolution in the mesosphere is larger than that of MIPAS, we have applied MLS averaging kernels and a priori information to the MIPAS ozone.
7.1.4 SMILES
The Superconducting Submillimeter-Wave Limb-Emission Sounder (SMILES) on the International Space Station (ISS) operated between October 2009 and April 2010 (Kikuchi et al., 2010). It measured ozone profiles in the altitude range of 16 to 85 km during the daytime and up to 96 km during the nighttime (Mitsuda et al., 2011; Takahashi et al., 2010; Takahashi et al., 2011). The latitudinal coverage is 38∘ S and 65∘ N. Version 3.2 of the data was used here (http://darts.isas.jaxa.jp/stp/smiles/, last access: 9 November 2023). The vertical resolution is 3 km in the stratosphere, 4 km in the lower and middle mesosphere, and 6 km at 95 km. MIPAS and SMILES O3 vertical resolutions are similar, and hence no averaging kernels were applied. Previous versions of SMILES O3 (v2.2) agree with other measurements within 10 % in the stratosphere and 30 % in the mesosphere (Imai et al., 2013a, b).
7.1.5 ACE-FTS
The Atmospheric Chemistry Experiment Fourier Transform Spectrometer (ACE-FTS) is an infrared solar occultation Michelson interferometer flying on the Canadian Space Agency (CSA) Atmospheric Chemistry Experiment (ACE), launched in August 2003 (Bernath, 2017). It measures atmospheric absorption from the cloud top to 150 km at sunrise and sunset. ACE covers the tropical, mid-latitude and high-latitude regions in approximately 3 months. Ozone profiles are retrieved from microwindows between 829 and 2673 cm−1 (Boone et al., 2013). We use here version 4.1 of the data. ACE-FTS ozone retrievals are limited to a 5–95 km altitude range. The vertical resolution is 3−4 km.
7.2 Results of the comparison
Figures 10 and 11 show the mean daytime and nighttime differences, respectively, between MIPAS and the different instruments (MIPAS − instrument) for the four seasons, grouped in four latitude bins. Further, the global mean differences, including all latitudes and seasons, are plotted in Fig. 12, separated into daytime and nighttime. We have shown the systematic errors in MIPAS just as a reference.
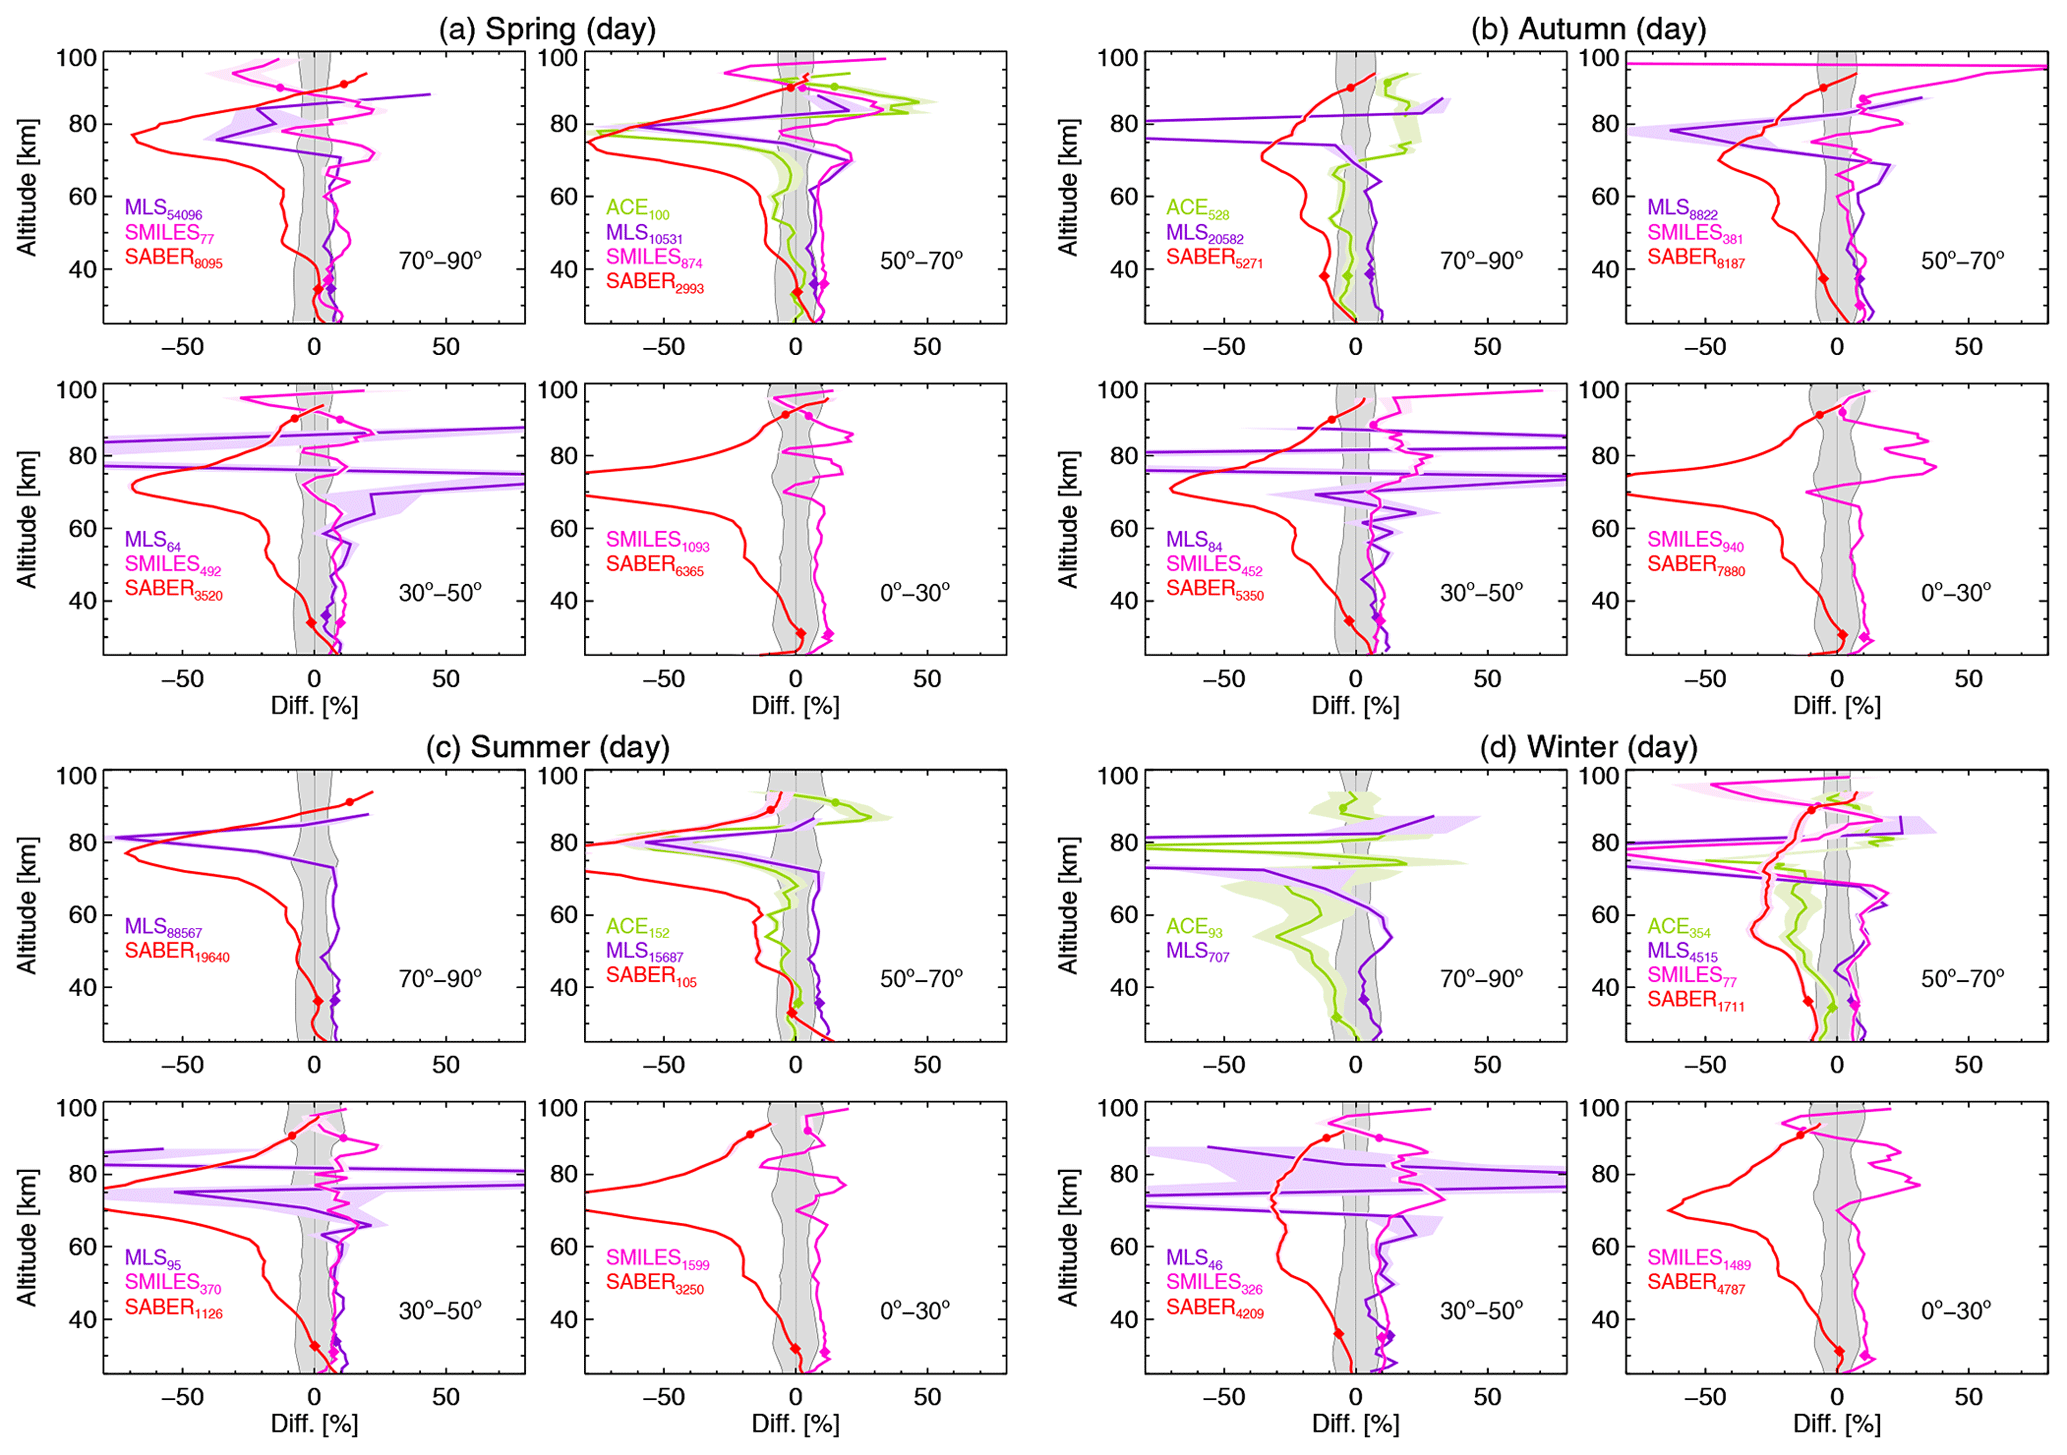
Figure 10Mean of the daytime O3 VMR differences (MIPAS − instrument) as a percentage of MIPAS between co-located pairs of measurements of MIPAS (MA mode) with ACE-FTS (green), MLS (purple), SMILES (magenta) and SABER (red) for (a) spring (MAM for the Northern Hemisphere (NH) and SON for the Southern Hemisphere (SH)), (b) autumn (SON for NH and MAM for SH), (c) summer (JJA for NH and DJF for SH) and (d) winter (DJF for NH and JJA for SH). The symbols indicate the mean altitude of the MIPAS O3 VMR primary (diamonds) and secondary (circles) maxima coincident with the respective instrument. The number of coincidences is indicated in the subscripts. The colour-shaded areas (hardly noticeable in many cases) are the standard errors of the mean of the differences. The grey-shaded area shows the MIPAS 1σ systematic errors (e.g. curve “syst” in Fig. C2).
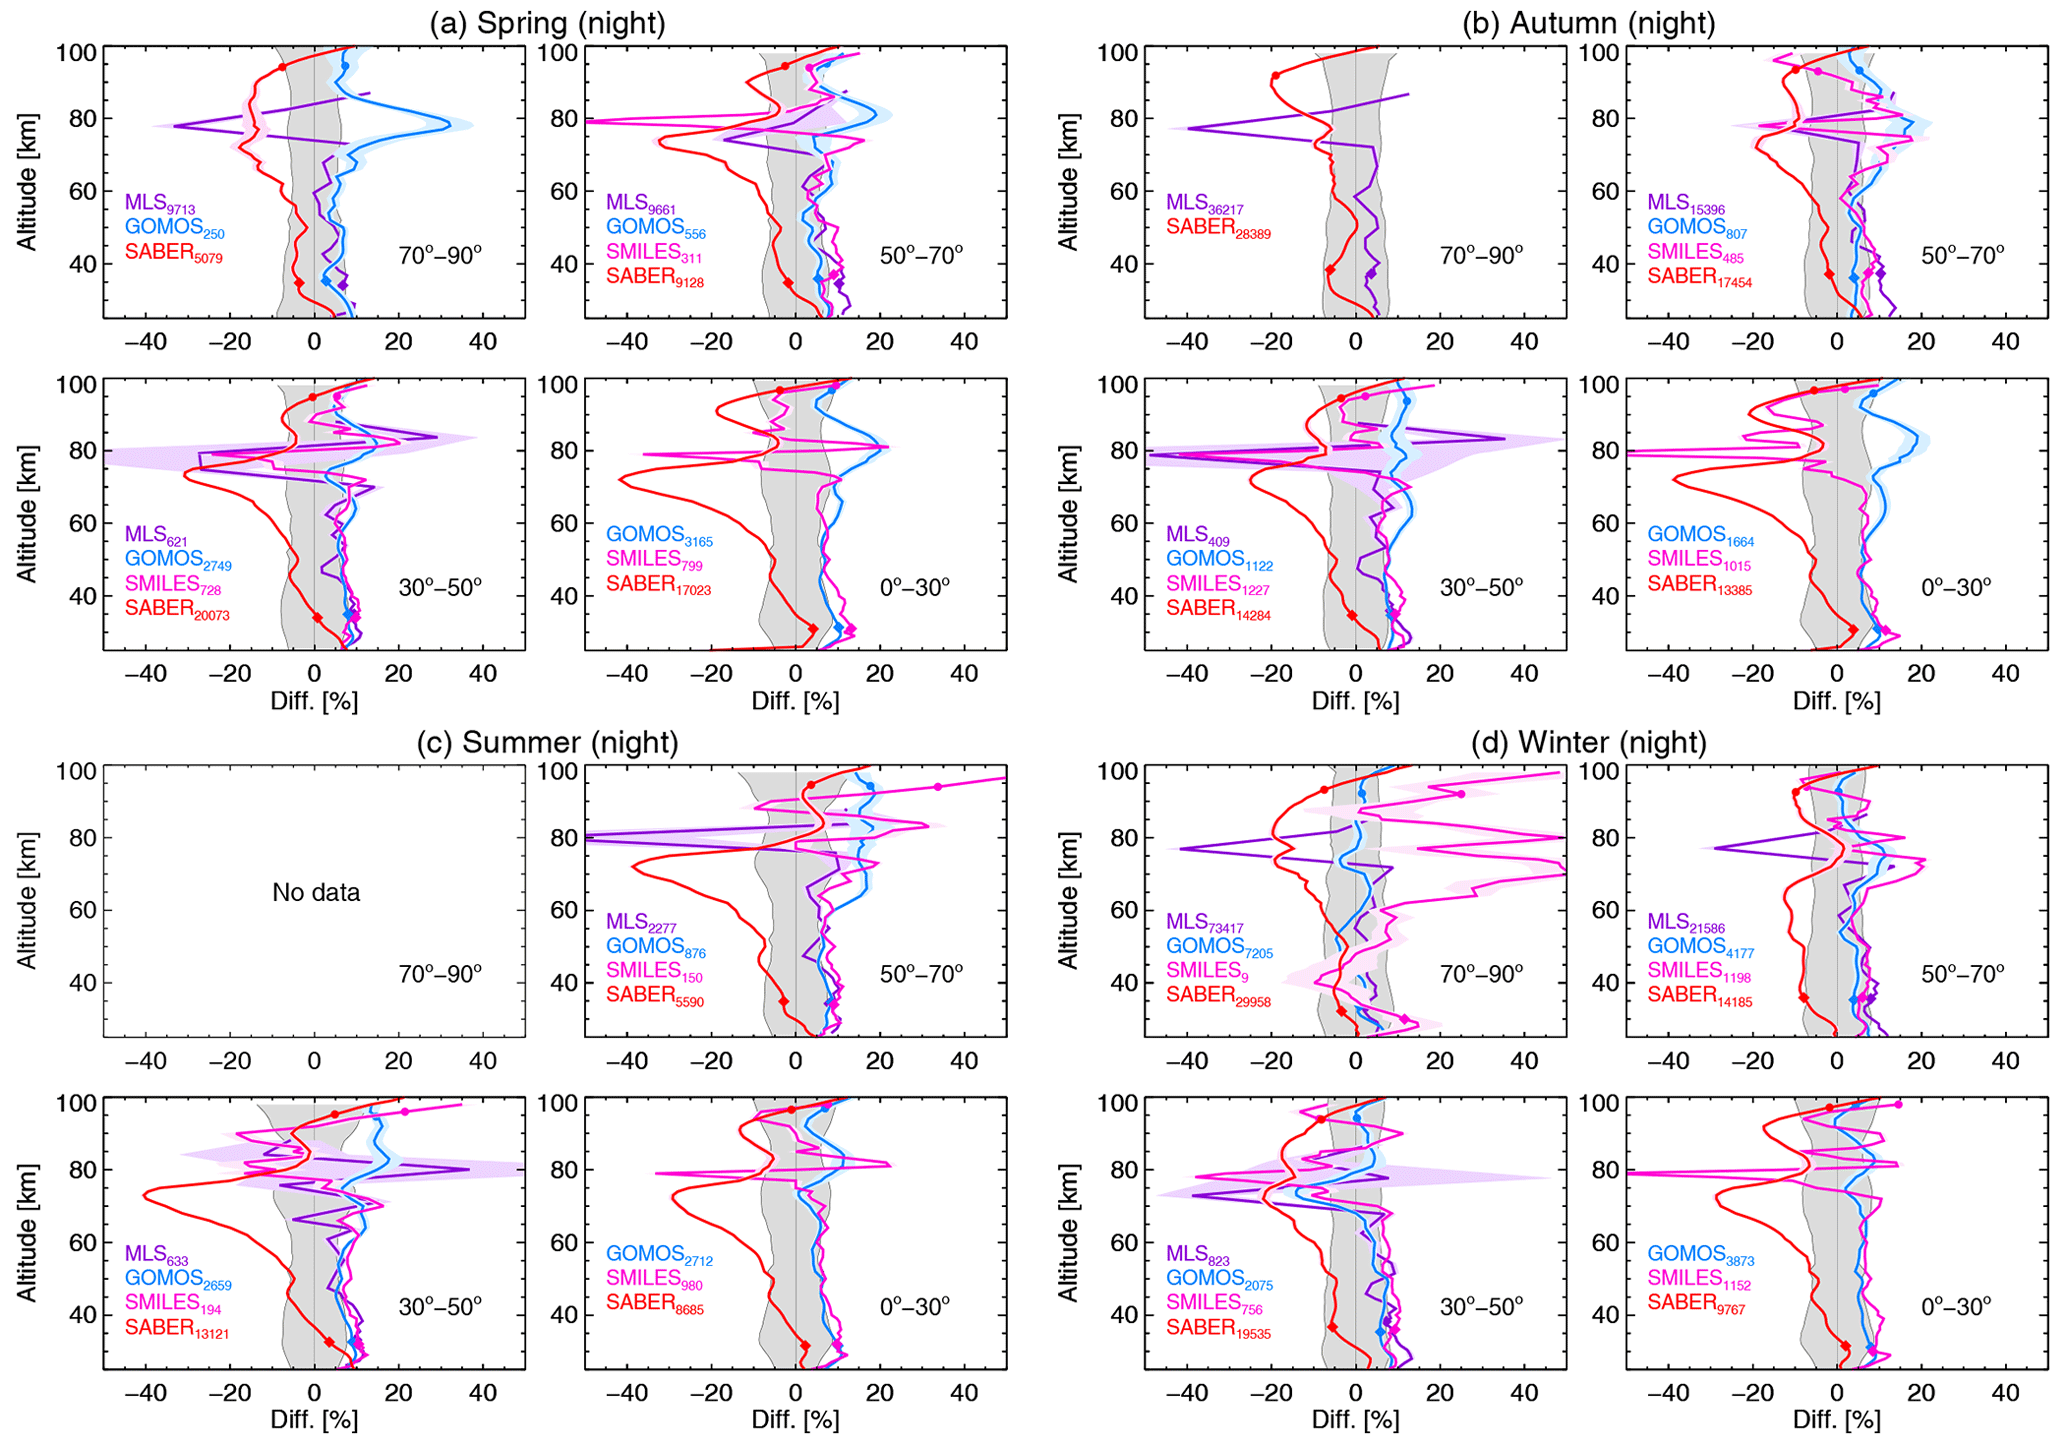
Figure 11As Fig. 10 but for nighttime O3. Instruments colours are the same except that ACE-FTS is replaced by GOMOS (light blue).
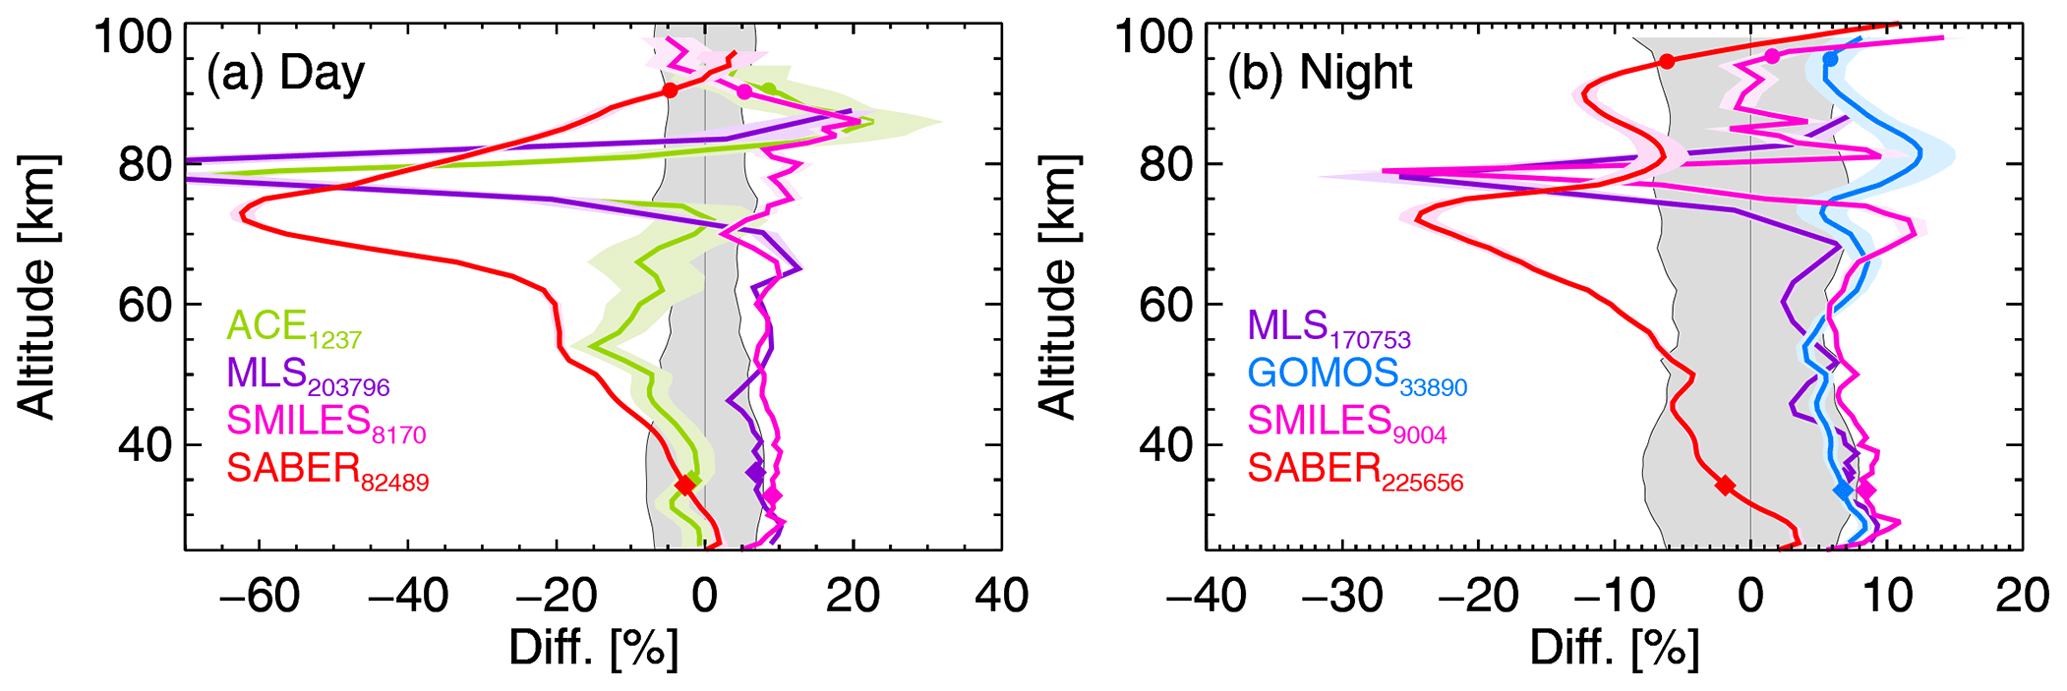
Figure 12Global mean (for all latitudes and seasons) of the daytime O3 VMR differences (MIPAS − instrument) as a percentage of MIPAS between co-located pairs of measurements of MIPAS (MA mode) with ACE-FTS (green), MLS (purple), SMILES (magenta), SABER (red) and GOMOS (light blue). For more details see the caption of Fig. 10.
We see that MIPAS compares very well with ACE in the stratosphere and lower mesosphere (up to 75 km) with differences smaller than 5 %, except for a narrow region close to 55 km, where ACE is larger by about 10 %.
The comparison with MLS and SMILES in this region is very consistent, with MIPAS O3 mixing ratios being in general larger, between 5 % and 10 %, than those of these two instruments up to altitudes of nearly 75 km. Note that the differences with respect to MLS at nighttime in this region are slightly smaller, with values close to 5 % from 45 to 75 km. The better agreement between infrared (MIPAS and ACE) instruments with respect to the microwave instruments (MLS and SMILES) suggests that the differences are caused by inconsistencies between the spectroscopic data in those spectral regions. In fact, it has been shown that O3 intensities in HITRAN2016 (the basis of ACE v4 retrievals) are too weak by about 3 % (Birk et al., 2019). This bias, although it does not fully explain the differences between ACE-FTS and MLS/SMILES of about 5 %–10 %, is consistent with this result.
MIPAS agrees well with SABER in the lower stratosphere, up to ∼ 35 km. However, above this altitude, at 40 to 60 km, SABER O3 VMR is larger than MIPAS by 20 % during the daytime and by 10 % at nighttime. The differences are larger for MLS, SMILES and GOMOS. Rong et al. (2009) found a positive bias in SABER stratospheric O3, version 1.07, which might explain these differences. Also, SABER retrieves O3 from the bands in the 10 µm region, while MIPAS uses the v2 band up to 50 km. We have discussed above that when using the microwindows of the MIPAS AB band, which include lines of the ozone 10 µm band, we retrieve larger O3 concentrations. Thus, these spectroscopic inconsistencies might partially explain the MIPAS and SABER differences in this region. Above 60 km, the differences between MIPAS and SABER increase, reaching differences at 60–85 km within 20 %–60 % in the daytime and in the range of 10 %–25 % at nighttime, with MIPAS ozone mixing ratios always being smaller. Smith et al. (2013) have already reported that daytime SABER O3 mixing ratios are overestimated in this region. One possible cause of this overestimation is the larger collisional rate (about a factor of 2) for the , O2) process used in SABER as compared to MIPAS retrievals (Mlynczak et al., 2013; López-Puertas et al., 2018). This would also explain the larger differences in the daytime as non-LTE effects are larger for these conditions (Funke et al., 2012).
The large relative differences in MIPAS with respect to ACE and MLS near 80 km are caused by the smaller concentrations of O3; the difference in absolute values is smaller than 0.1 ppmv. MIPAS, however, shows slightly larger (∼ 10 %) O3 VMR than SMILES in this region. In the daytime upper mesosphere, near 85–90 km, it seems that MIPAS has a positive bias of 10 % to 20 % with respect to ACE, MLS and SMILES, although it is smaller than the SABER O3 by similar amounts. However, the agreement between all instruments near the secondary maximum is remarkably good.
The differences between the instruments for nighttime conditions in the stratosphere and lower mesosphere (Fig. 12b) are consistent with the daytime differences. The nighttime data were also compared to GOMOS data. This comparison seems to corroborate the differences found with MLS and SMILES.
Near 60–70 km, the agreement of MIPAS with MLS is better than for the daytime and the differences between MIPAS and MLS, GOMOS and SMILES are very similar and in the range of 5 %–10 %. The larger differences and their opposite signs in the comparison with SABER have already been discussed above.
At the altitude of the secondary maximum, the agreement between the three instruments for nighttime conditions is very good, with differences within ± 10 %. MIPAS and SMILES O3 values are very similar, with GOMOS O3 concentrations being about 10 % smaller and SABER about 10 % larger. The secondary peak is practically at the same altitude, namely ∼ 95 km.
Overall, below 70 km MIPAS O3 concentrations agree within 5 %–8 % with all comparison instruments except SABER. At these altitudes, MIPAS seems to have a positive bias of 5 %–8 % with respect to MLS, SMILES and GOMOS. The agreement with ACE is better, and the differences are within 5 % except for a narrow region near 55 km, where ACE is larger by about 10 %. SABER seems to have a positive bias on the order of 20 %–60 %, which is more pronounced during the daytime. In the upper mesosphere–lower thermosphere, in the O3 secondary maximum, the agreement between those instruments is, generally, within ± (6–10) %. Near 80 km, around the O3 minimum, the nighttime relative differences are larger, within −20 % to +10 %, and are even larger in the daytime but very small in absolute terms (within 0.1 ppmv). In general, the differences between all instruments are mostly within or close to the MIPAS 1σ systematic error margin, except for SABER in the mesosphere and MLS and ACE near 80 km. The latter discrepancies, however, are caused by the very low O3 concentrations which explode the relative differences. The fact that the differences sometimes exceed the MIPAS systematic errors (grey-shaded area) does not come as a surprise because the systematic error estimates of the comparison instruments are not included.
Compared to the difference with these instruments in the previous version, V5R_O3_m22 (López-Puertas et al., 2018), we find that the differences in MIPAS V8R O3 VMR with respect to MLS, SMILES and GOMOS in the stratosphere are slightly larger (2 %–3 %) than in MIPAS V5R. This is a consequence of the effort of making the MIPAS NOM and MA/UA retrievals as consistent as possible, in particular by using the same spectroscopic database and microwindows. Conversely, the agreement with SABER in this region has been improved. The comparison with MLS at 60–70 km has improved, probably because of the new version of MLS whose retrieval has been extended up to ∼ 90 km. The agreement with ACE near the stratopause has also been improved, probably due to improvements in the new version of ACE-FTS data. Further, the agreement of the new version of MIPAS with all instruments has been significantly improved in the upper mesosphere–lower thermosphere, reducing the differences from 20 % to 10 %. In this respect, the new O3 a priori of MIPAS (particularly in the daytime) and the smaller relaxation/quenching of O3(v1,v3) by atomic oxygen are the reasons for the better agreement. In addition, the diurnal variation in O3 in the upper mesosphere (near 80 km; see Fig. D3) has also been ameliorated.
In this work, we present the most recent version of the MIPAS middle- and upper-atmosphere ozone data (versions V8R_O3_561, V8R_O3_661 and V8R_O3_761), covering altitudes from 20 up to 100/105 km, retrieved from MIPAS observations in the three middle-atmosphere modes MA, UA and NLC. This data version is based on the most recent version-8 level-1b MIPAS spectra, which were processed with a retrieval algorithm that incorporates several improvements over the previous data version (V5R_O3_m22). Among them are the following: a more accurate retrieved temperature, the treatment of the background continuum and radiance offset correction, and the selection of optimized numerical settings. Microwindows and spectroscopic data were also updated to be consistent with the O3 retrieval of the nominal (NOM) mode (Kiefer et al., 2023). Specific to the middle-/upper-atmosphere O3 are three important updates: the O3 a priori data (particularly important for the daytime), the revision of the non-LTE processes and the atomic oxygen concentration during nighttime.
Another different aspect of this version is the novel treatment of errors, following the TUNER (Towards Unified Error Reporting) recommendations (von Clarmann et al., 2022), where the different components (random or systematic) of a given error source were propagated independently and where correlations and compensation effects caused by the propagation of uncertainties in parameters obtained in preceding retrieval steps, such as temperature, were taken into account. The random component of the O3 error is dominated by the measurement noise. Typical values (1σ for single profiles) for the daytime are smaller than 5 % below ∼ 60 km, 5 %–10 % between 60 and 70 km, 10 %–20 % at 70–90 km, and about 30 % at 95 km. For nighttime, they are very similar to those for daytime below 70 km but significantly smaller above, with values of 10 %–20 % at 75–95 km, 20 %–30 % at 95–100 km and larger than 30 % above 100 km. The random O3 error is generally larger than the total systematic uncertainty above around ∼ 60 km.
The systematic error is dominated by the uncertainties in spectroscopic data below ∼ 60 km (∼ 6 %), with a significant contribution of the ILS and, to a lesser extent, the persistent part of the gain calibration uncertainty. Above ∼ 60 km the systematic errors are dominated by the non-LTE uncertainties, but the spectroscopic data error also contributes significantly under certain conditions. The non-LTE errors are smaller than 1 % below 60 km, 2 %–8 % at 60–85 km and 5 %–12 % above 85 km. The ILS contribution is also appreciable at above ∼ 90 km. As a consequence of the new TUNER method, which takes compensation effects of errors that act via multiple pathways into account, the estimates of systematic errors in the 80–100 km range are significantly smaller than those of version V5R_O3_m22 (see Fig. 5 and Table 4 in López-Puertas et al., 2018). On one hand, non-LTE errors are smaller because of a proper propagation of the atomic oxygen abundance, but also the O3 errors incurred by the uncertainties in temperature and in the systematic component of the gain are smaller, as they are partially compensated.
When making a comparison with the previous V5R_O3_m22 version, we note the following: (1) O3 abundance is larger by about 2 %–5 % (0.2–0.5 ppmv) at 20–50 km; (2) there is a decrease by ∼ 2 %–4 % between 50 and 60 km, mainly in the tropics and mid-latitudes; (3) there is a more pronounced nighttime O3 minimum just below 80 km leading to a more realistic diurnal variation in this region; (4) there is a larger (∼ 40 %, 0.2–0.3 ppmv) O3 concentration in the secondary maximum during the daytime in the tropical and middle latitudes; and (5) there is a 10 %–30 % decrease in the O3 abundance in the secondary maximum at nighttime.
We found that the O3 fields retrieved from the nominal mode (NOM) and the middle-atmosphere modes in their common altitude range (20–70 km) are fully consistent, with differences generally being within 1 %–2 %. This is essential for studies involving a combined dataset. Only in the lower mesosphere (60–70 km) during the daytime does O3 NOM seem to be larger than O3 MA/UA by 2 %–10 % for most latitudes.
The comparison performed with the most recent data versions of SABER, GOMOS, MLS, SMILES and ACE-FTS shows that MIPAS O3 is within 5 % and 8 % below 70 km with all instruments except SABER. In this region, MIPAS seems to have a positive bias of 5 %–8 % with respect to MLS, SMILES and GOMOS. The agreement with ACE is better, and the differences are within 5 % except for a narrow region near 55 km, where ACE is larger by about 10 %. SABER seems to have a positive bias on the order of 20 %–60 %, which is more pronounced during daytime.
In the upper mesosphere–lower thermosphere, the agreement between those instruments is, generally, within ± 6 %–10 %. Near the O3 minimum around 80 km, the nighttime relative differences are larger (within −20 to +10 %), and they are also larger in the daytime but very small in absolute terms (within 0.1 ppmv).
In general, the differences between all instruments are mostly within or near the 1σ systematic error margin of MIPAS, except for SABER in the mesosphere and MLS and ACE near 80 km. The latter, however, is due to the very low O3 abundance.
Comparing these differences with those reported by López-Puertas et al. (2018) for the previous version, V5R_O3_m22 (López-Puertas et al., 2018), we find that the differences with MLS, SMILES and GOMOS are slightly larger (2 %–3 %) in the stratosphere. This is the result of using a different spectroscopic database in this version. Conversely, the agreement with SABER in this region has been improved. The comparison with MLS at 60–70 km has improved, probably because the new version of MLS has been extended up to ∼ 90 km. The agreement with ACE near the stratopause has also improved (likely caused by the new version of ACE). Noticeably, the new version of MIPAS agrees much better than before with all instruments in the upper mesosphere–lower thermosphere, reducing the differences from 20 % to 10 %. Further, the diurnal variation in O3 in the upper mesosphere (near 80 km) has been significantly improved.
Table A1 lists the microwindows and altitude ranges used in the retrieval of MIPAS ozone V8R_O3_m61.
Table A1Microwindows and altitude ranges used in the retrieval of MIPAS ozone V8R_O3_m61. Microwindow nos. 1–30 fall within band A (685–980 cm−1) of MIPAS and microwindow nos. 31–38 within band AB (1010–1180 cm−1).
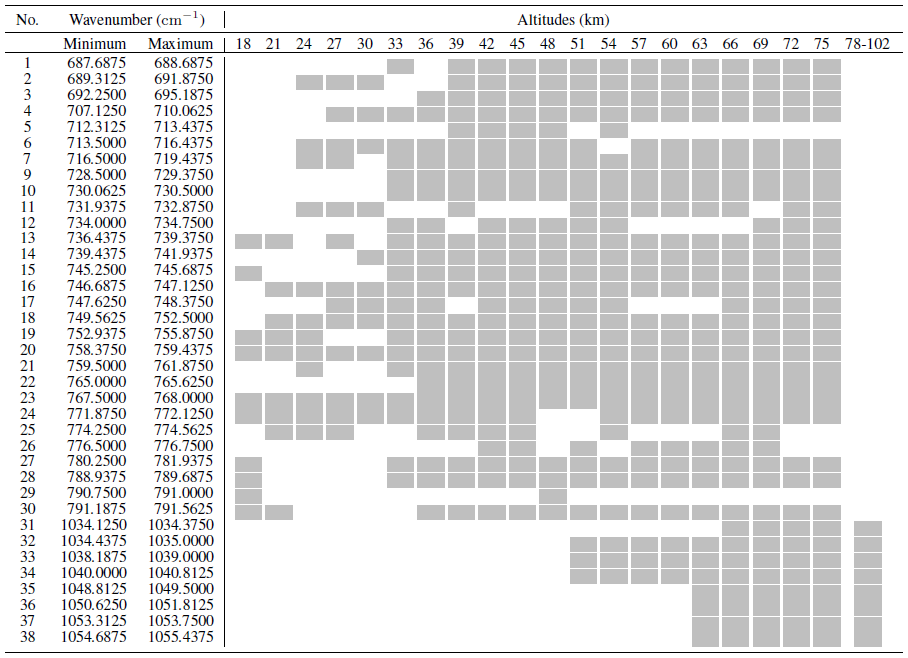
In this section we include tables of the O3 error budget for the atmospheric conditions at selected altitudes discussed in Sects. 4.2.1 and 4.2.2.
Table B1Ozone error budget for the tropics in the day, MA. All uncertainties are 1σ. See the caption of Fig. 5 for definitions of abbreviations used in Tables B1–B6.
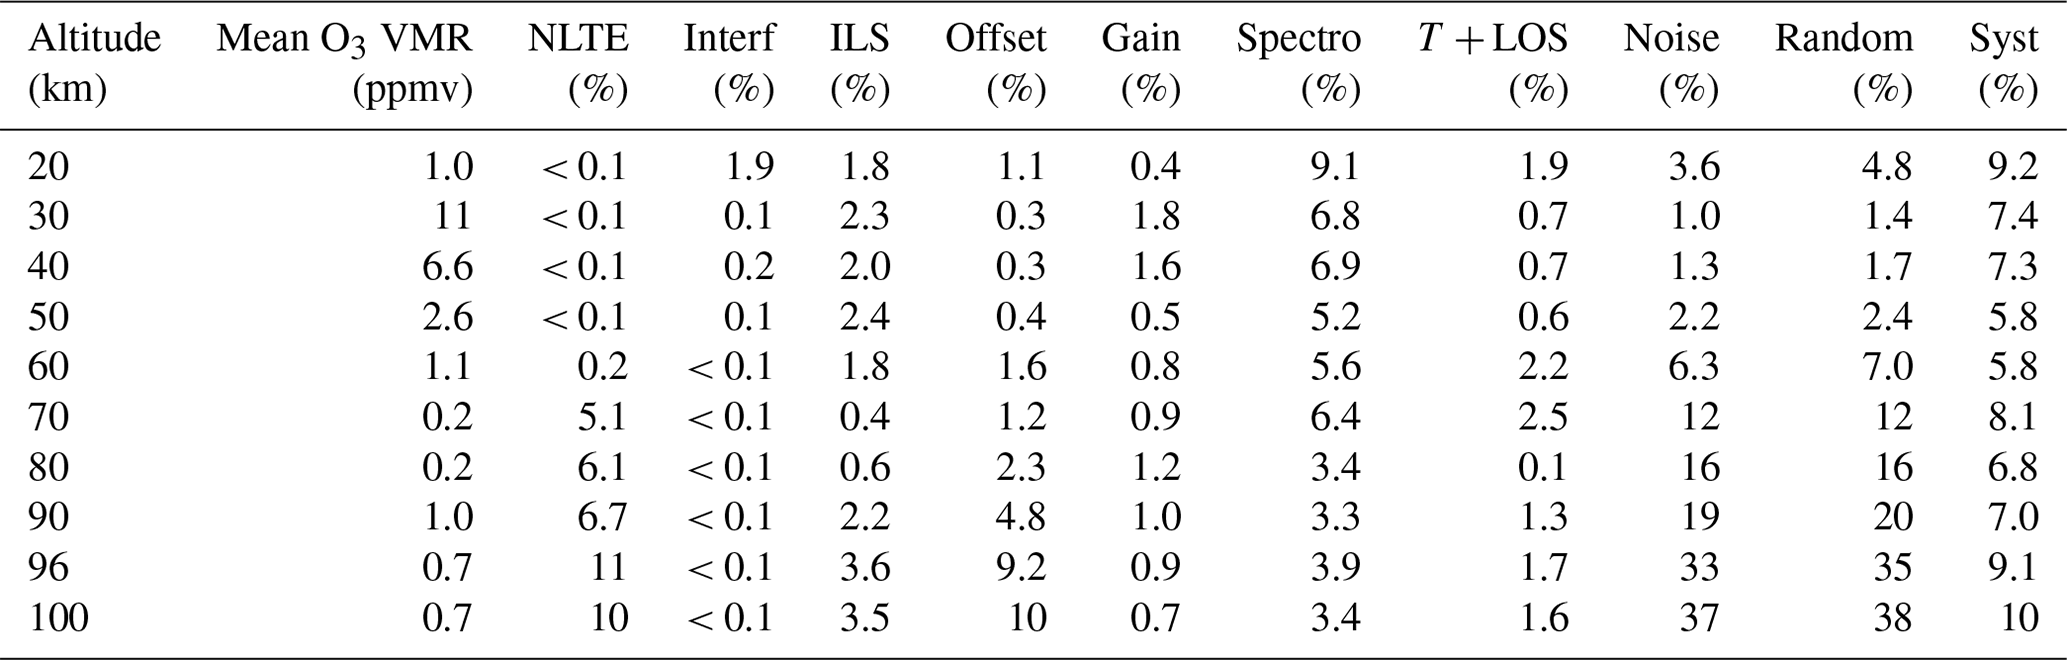
Table B2Ozone error budget for the tropics at night, MA. All uncertainties are 1σ.
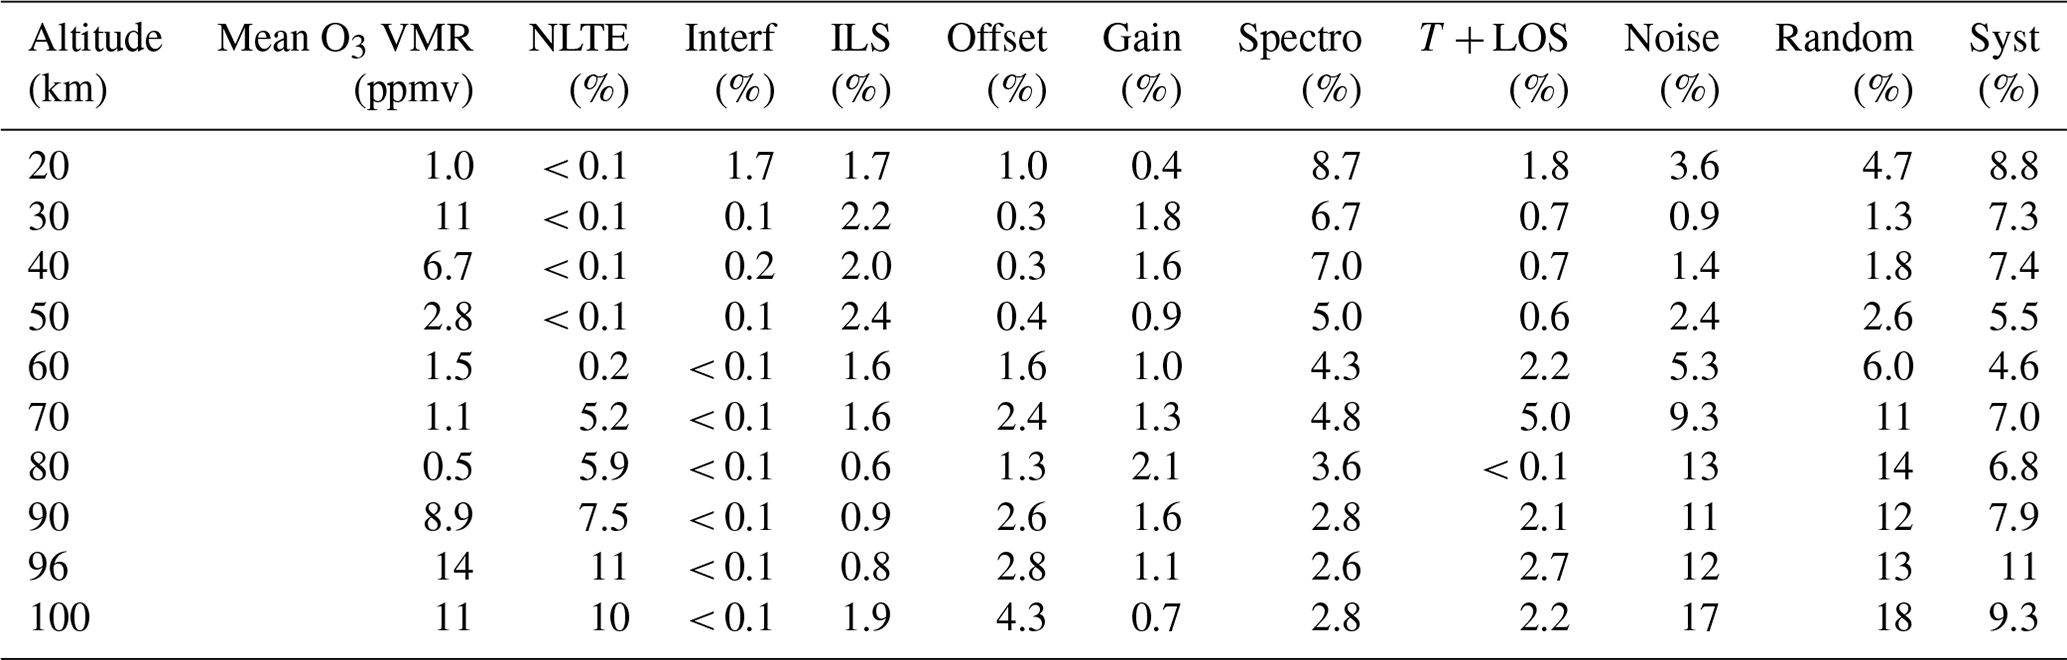
Table B3Ozone error budget for northern mid-latitude spring in the day, MA. All uncertainties are 1σ.
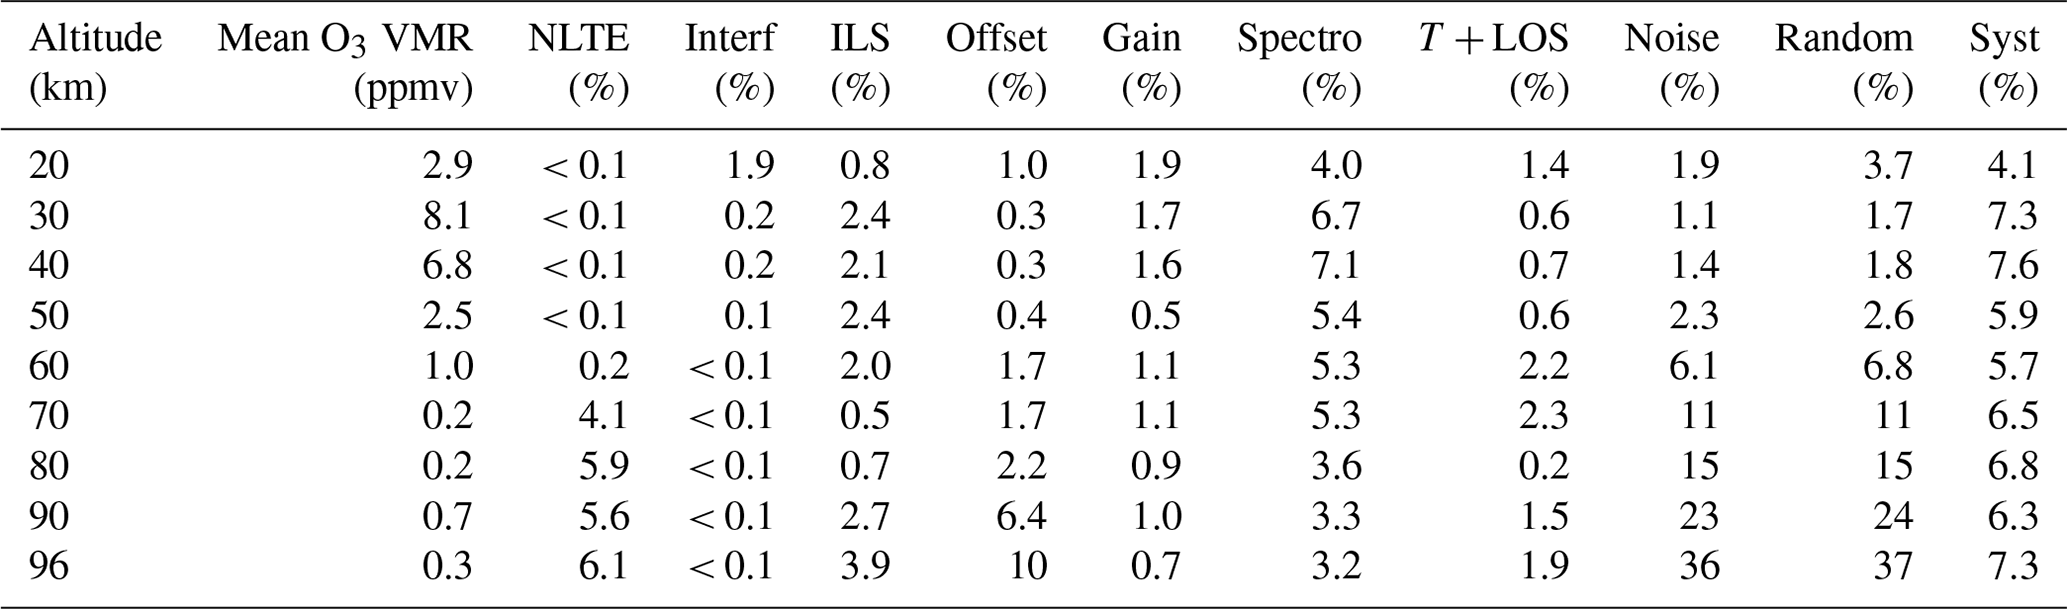
Table B4Ozone error budget for northern mid-latitude spring at night, MA. All uncertainties are 1σ.
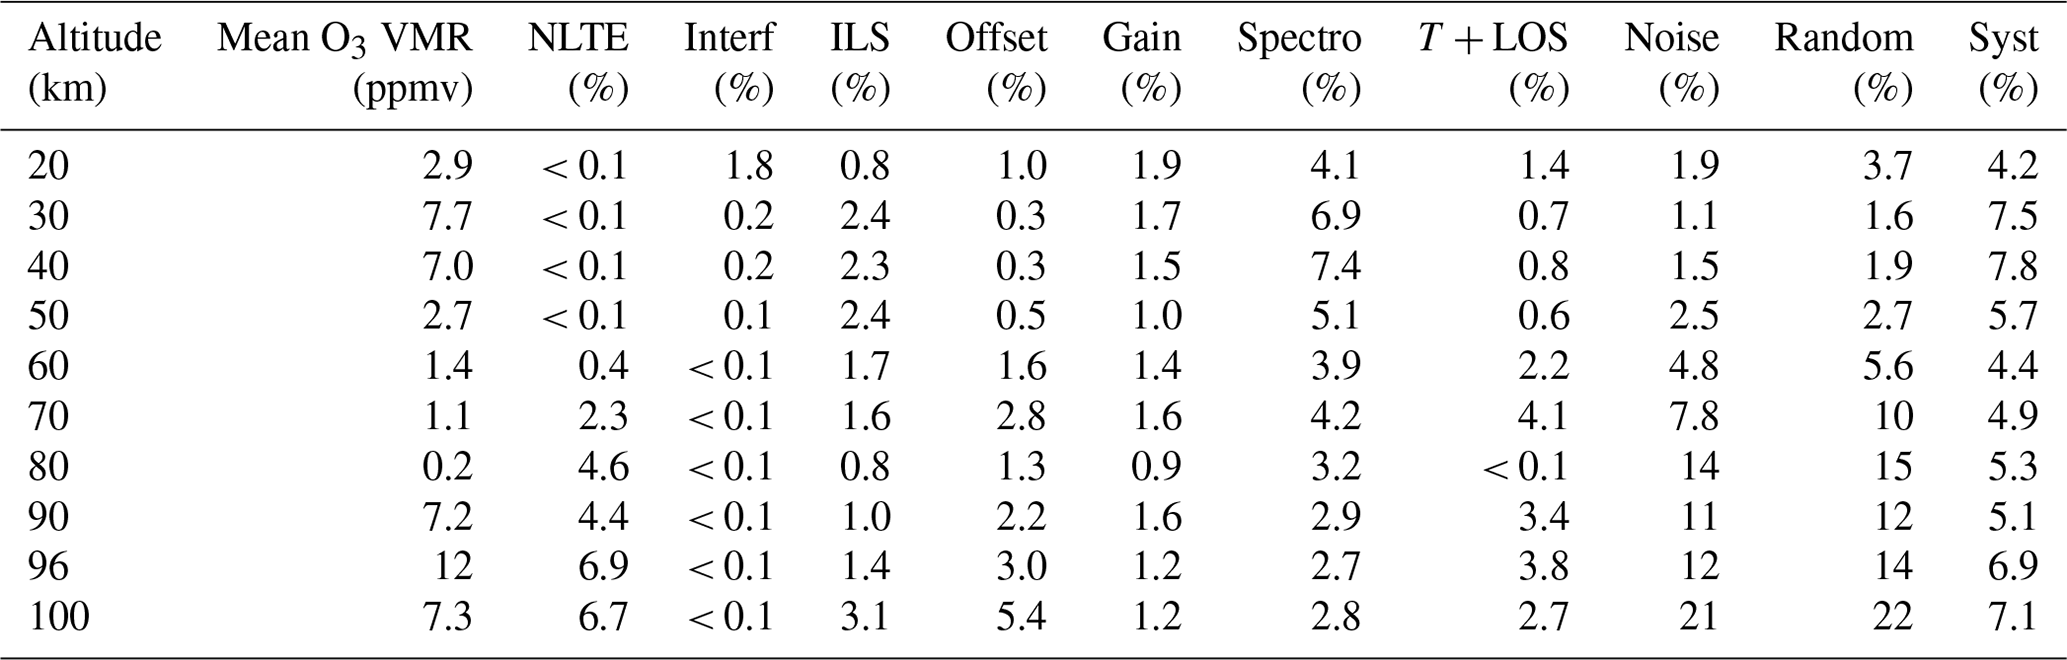
Table B5Ozone error budget for northern polar summer in the day, MA. All uncertainties are 1σ.
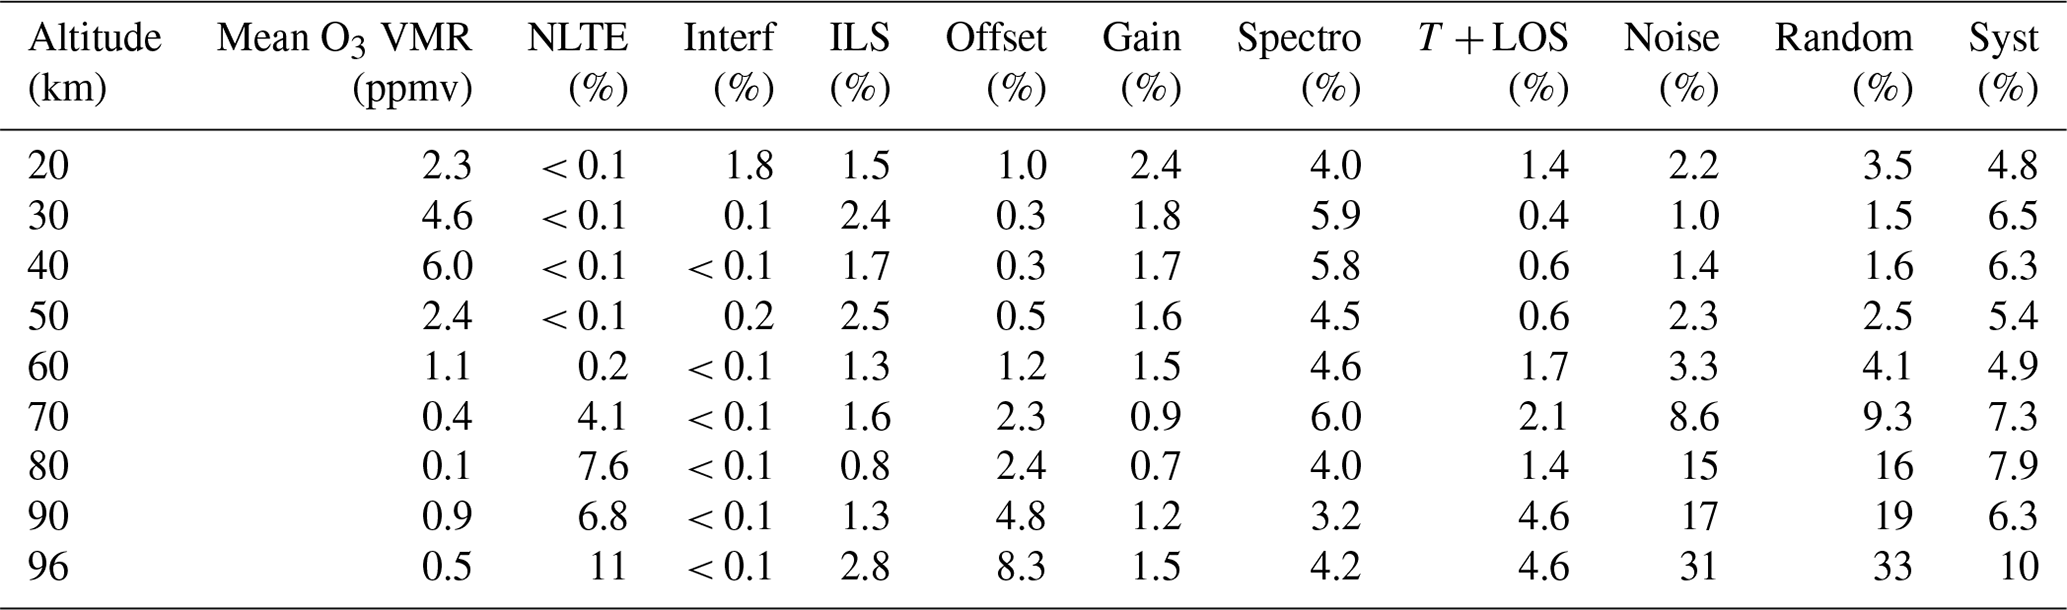
Table B6Ozone error budget for southern polar winter at night, MA. All uncertainties are 1σ.
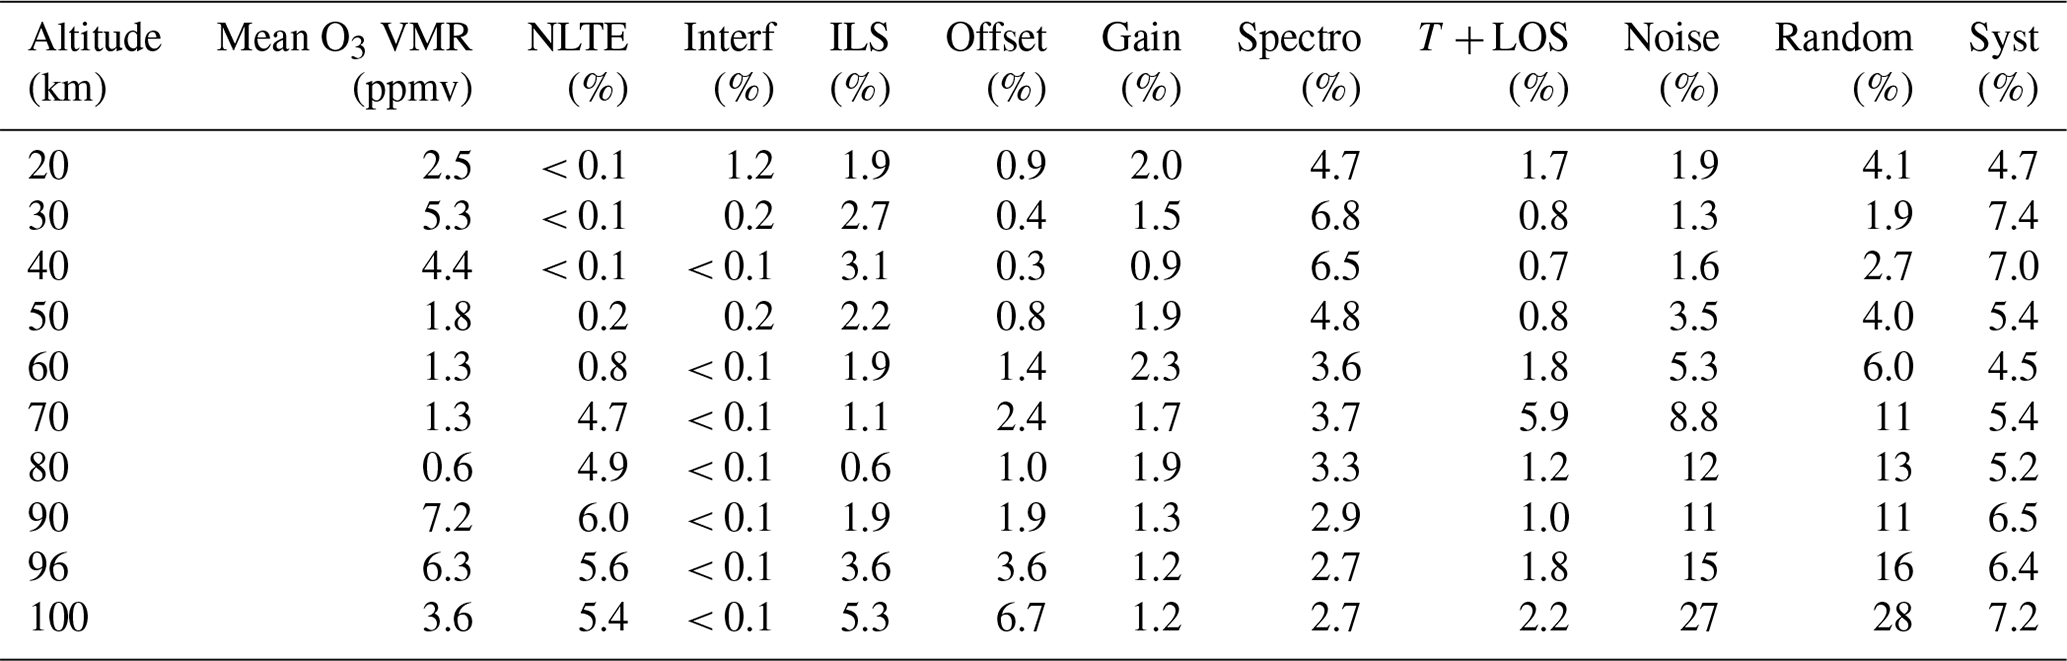
We show in this section the random and systematic components of the different error sources shown in Fig. 5 and discussed in Sects. 4.2.1 and 4.2.2.
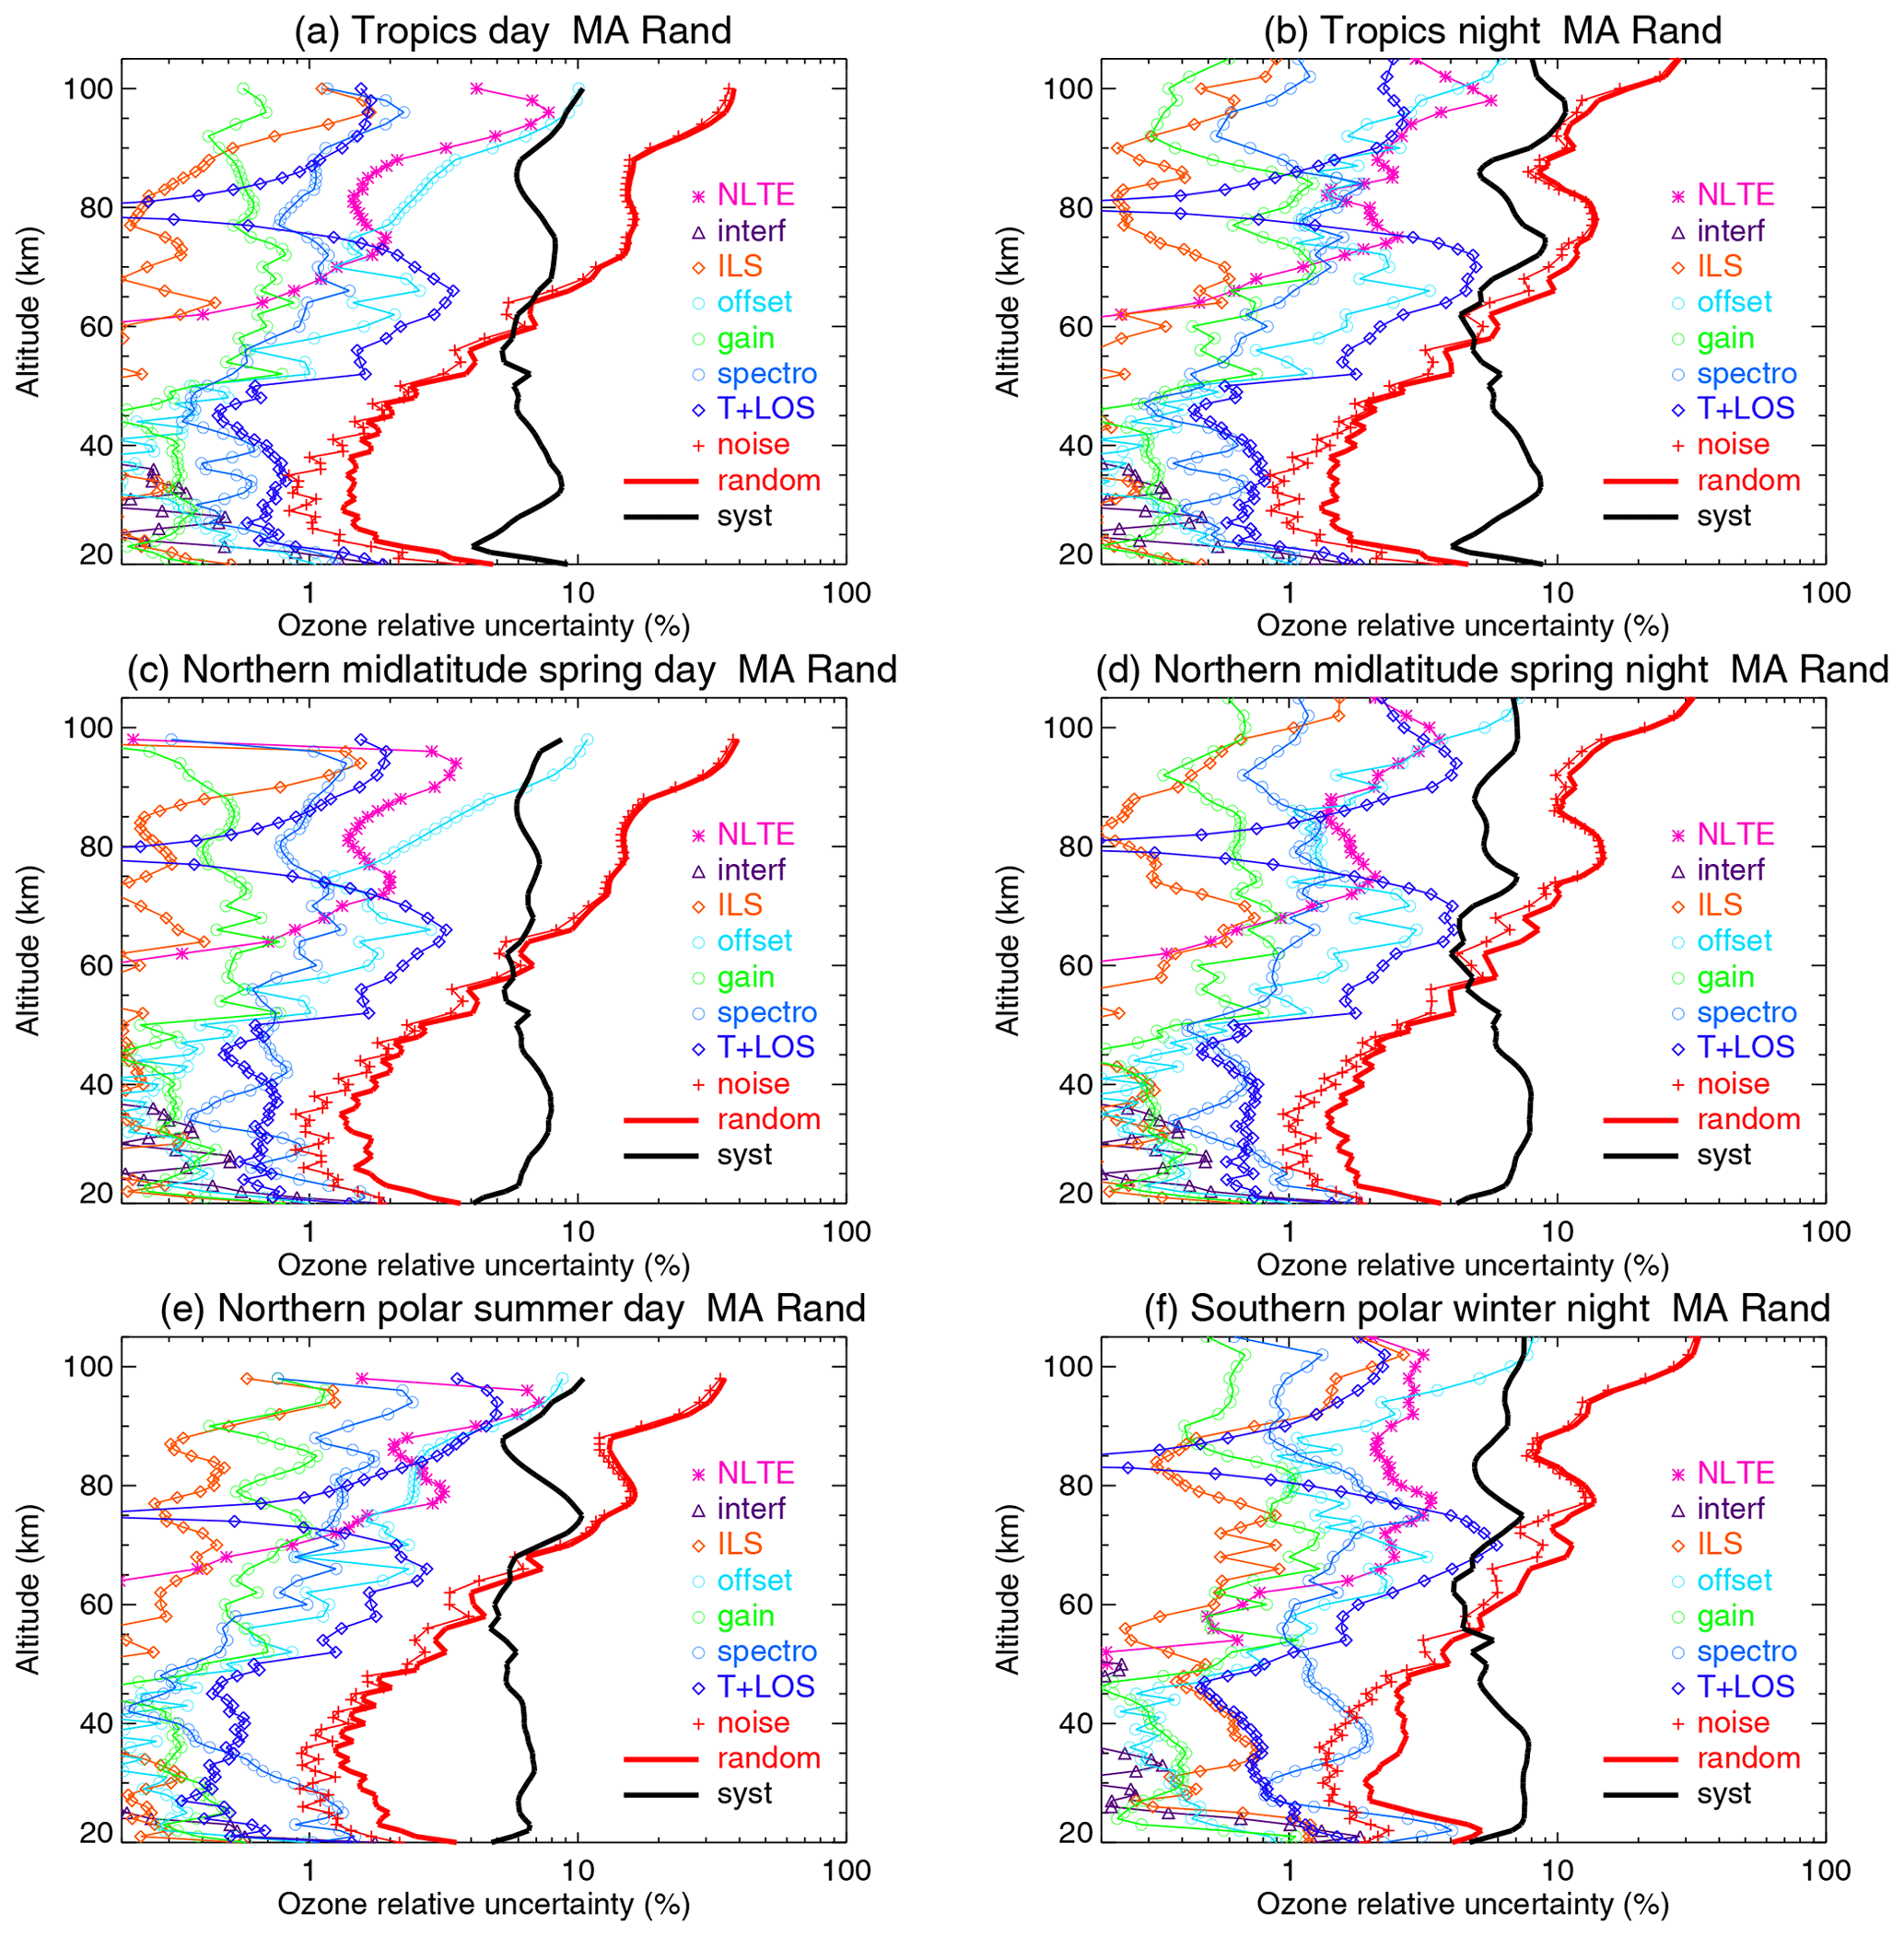
Figure C1The random components of the O3 error budget for MA data shown in Fig. 5 for different atmospheric conditions in the tropics (a, b), northern mid-latitudes in spring (c, d) and polar regions (e, f), for daytime (a, c, e) and nighttime (b, d, f). All error estimates are 1σ uncertainties and given in percent. Error contributions are labelled “T + LOS” for the propagated error from the T + LOS retrieval, “noise” for error due to measurement noise, “spectro” for the spectroscopic error, “gain” for gain calibration error (see text), “offset” for error due to spectral offset (see text), “ILS” for instrument line shape error (see text), “interf” for the uncertainty in the abundance of the interfering species and “NLTE” for non-LTE-related errors. The total random (“random”) and systematic (“syst”) errors are also shown.
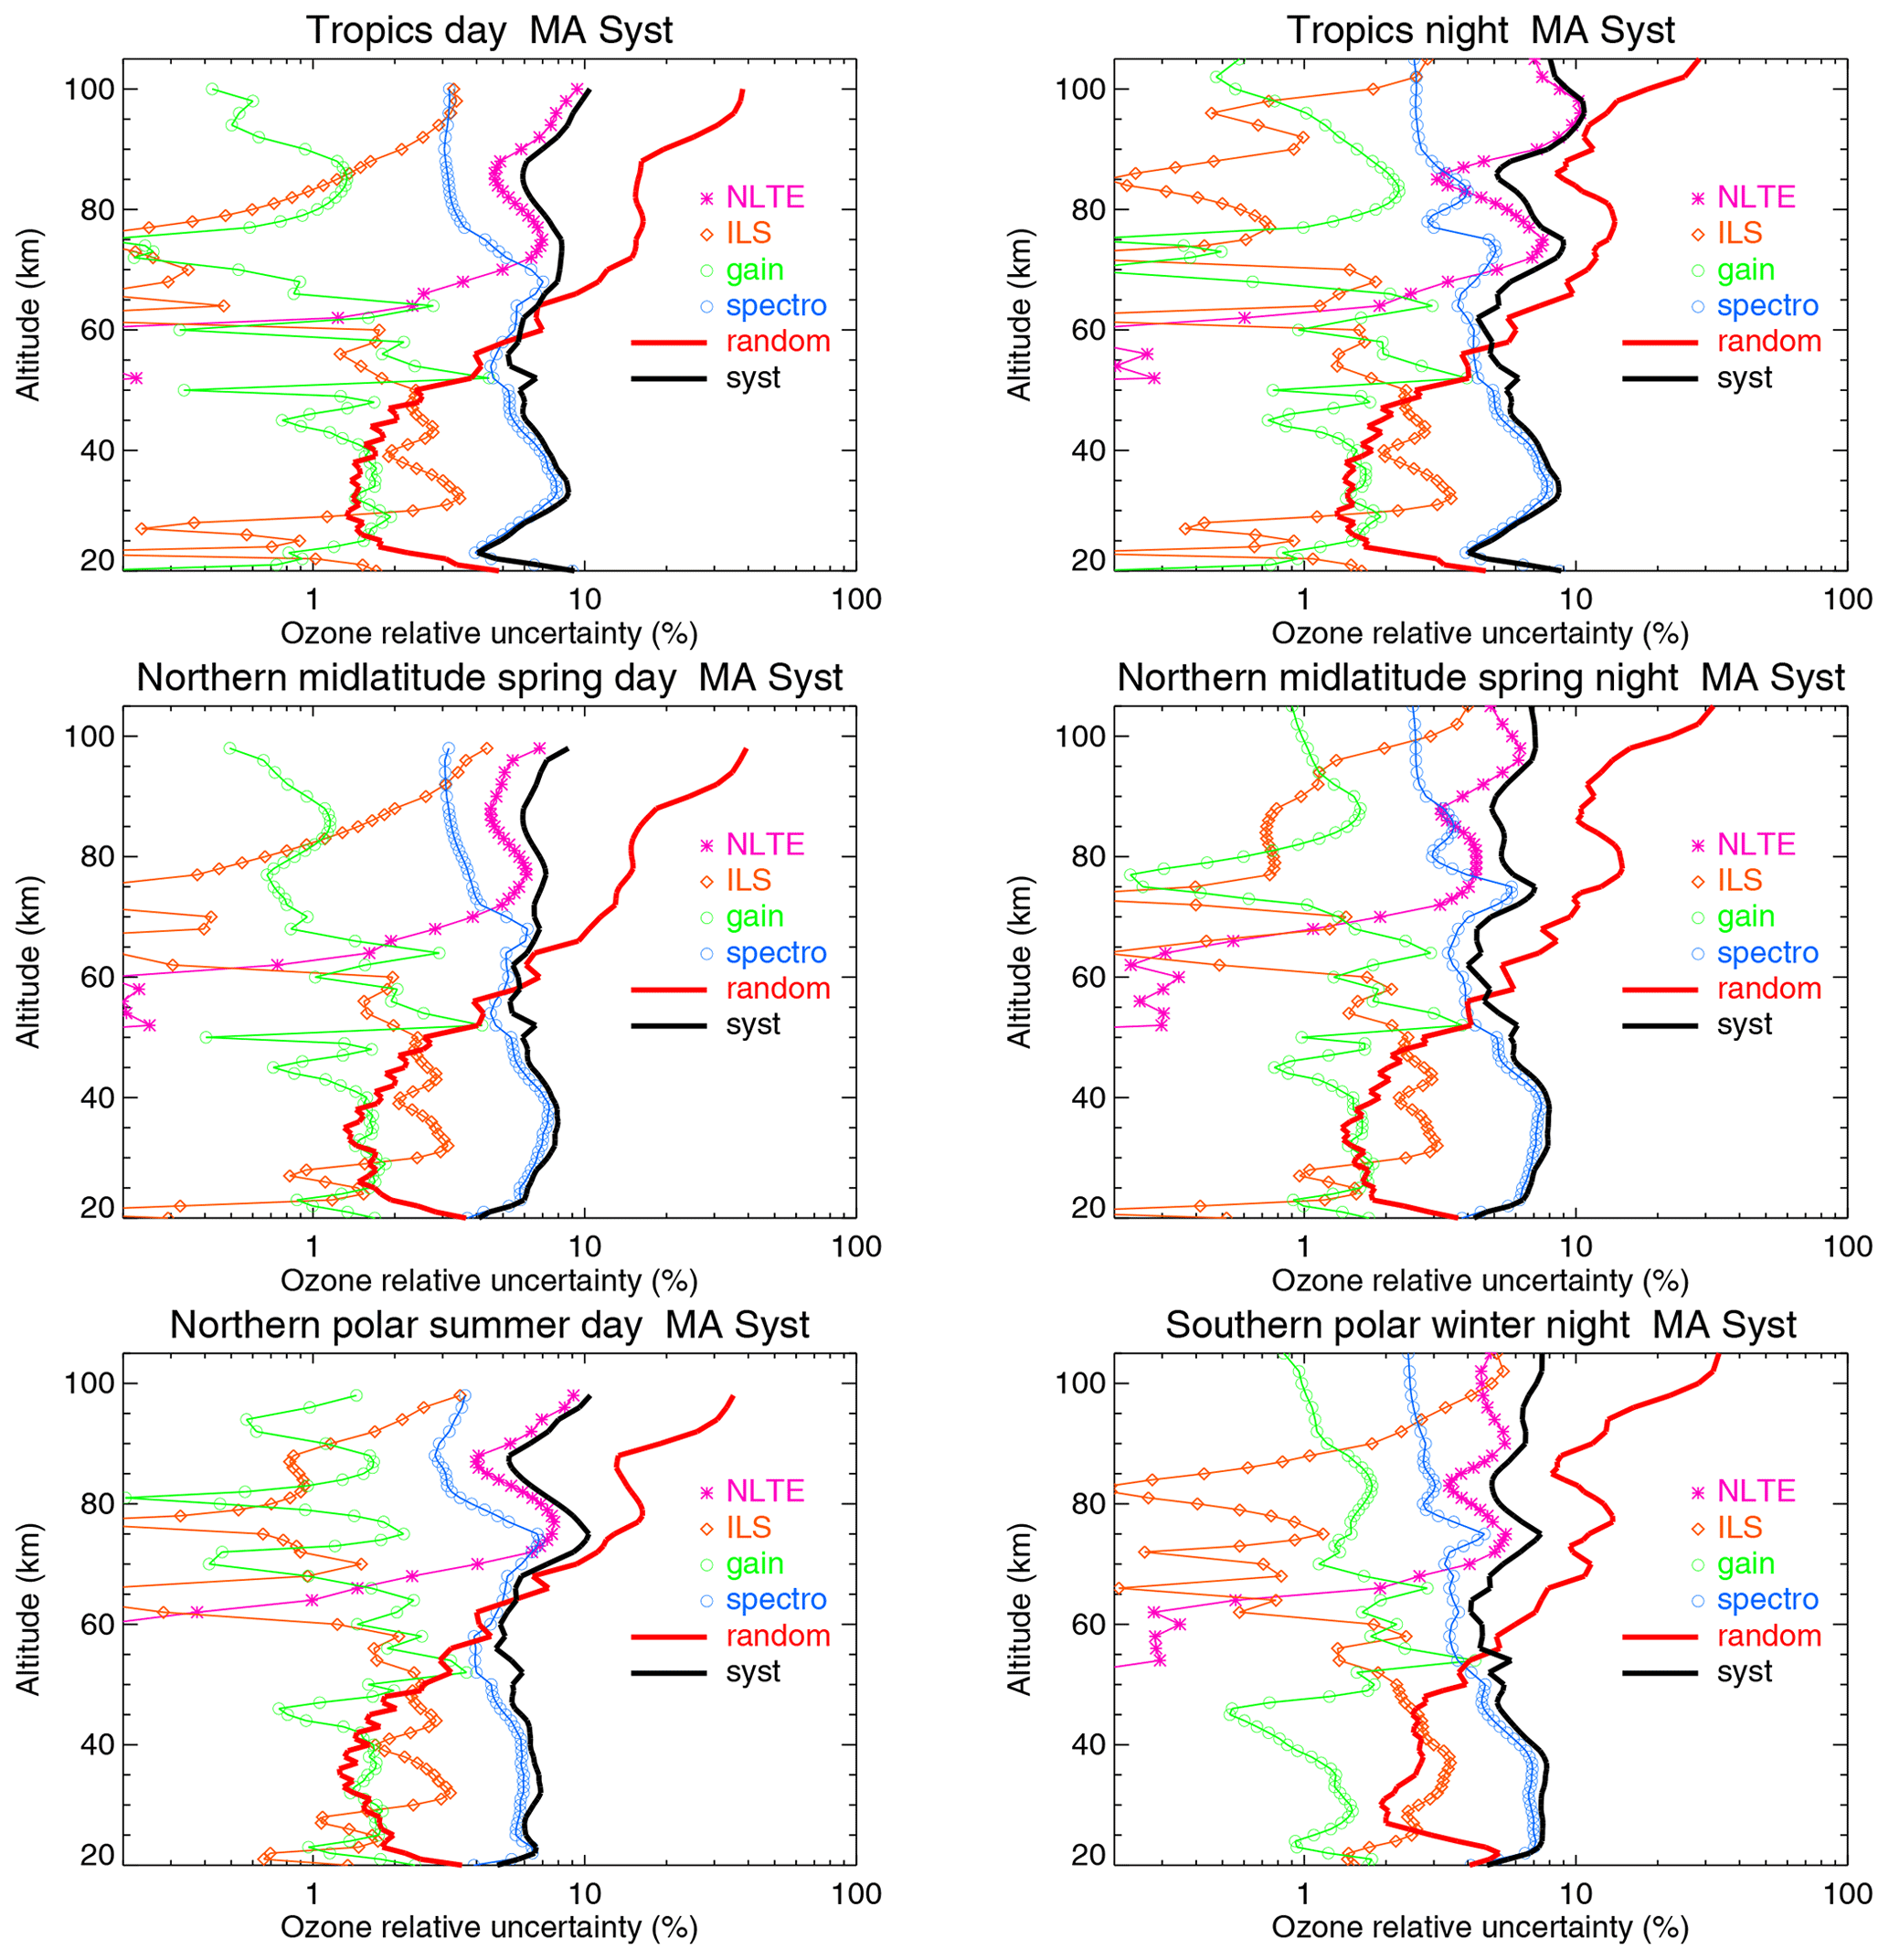
We present in this appendix several distributions of O3, represented as a function of altitude, latitude and time, for the new data version, V8R_O3_m61. Similar figures, and the corresponding discussion of the major features in the O3 distributions, were presented by López-Puertas et al. (2018) for the previous version of MIPAS O3, V5R_O3_m22. The features shown in these figures are very similar. Only the absolute values have changed slightly as is discussed above in Sect. 5. One significant improvement, however, is the diurnal variation (see Fig. D3). We refer the reader to López-Puertas et al. (2018) for a detailed description of the O3 fields but recommend using and citing this new version of MIPAS MA/UA data.
D1 Monthly zonal-mean distributions
Figures D1 and D2 show composite monthly zonal means of MIPAS O3 data for the 2007–2012 period for the day- and nighttime, respectively. The figures show the characteristic primary, secondary and tertiary maxima and their seasonal evolution (see more details in López-Puertas et al., 2018).
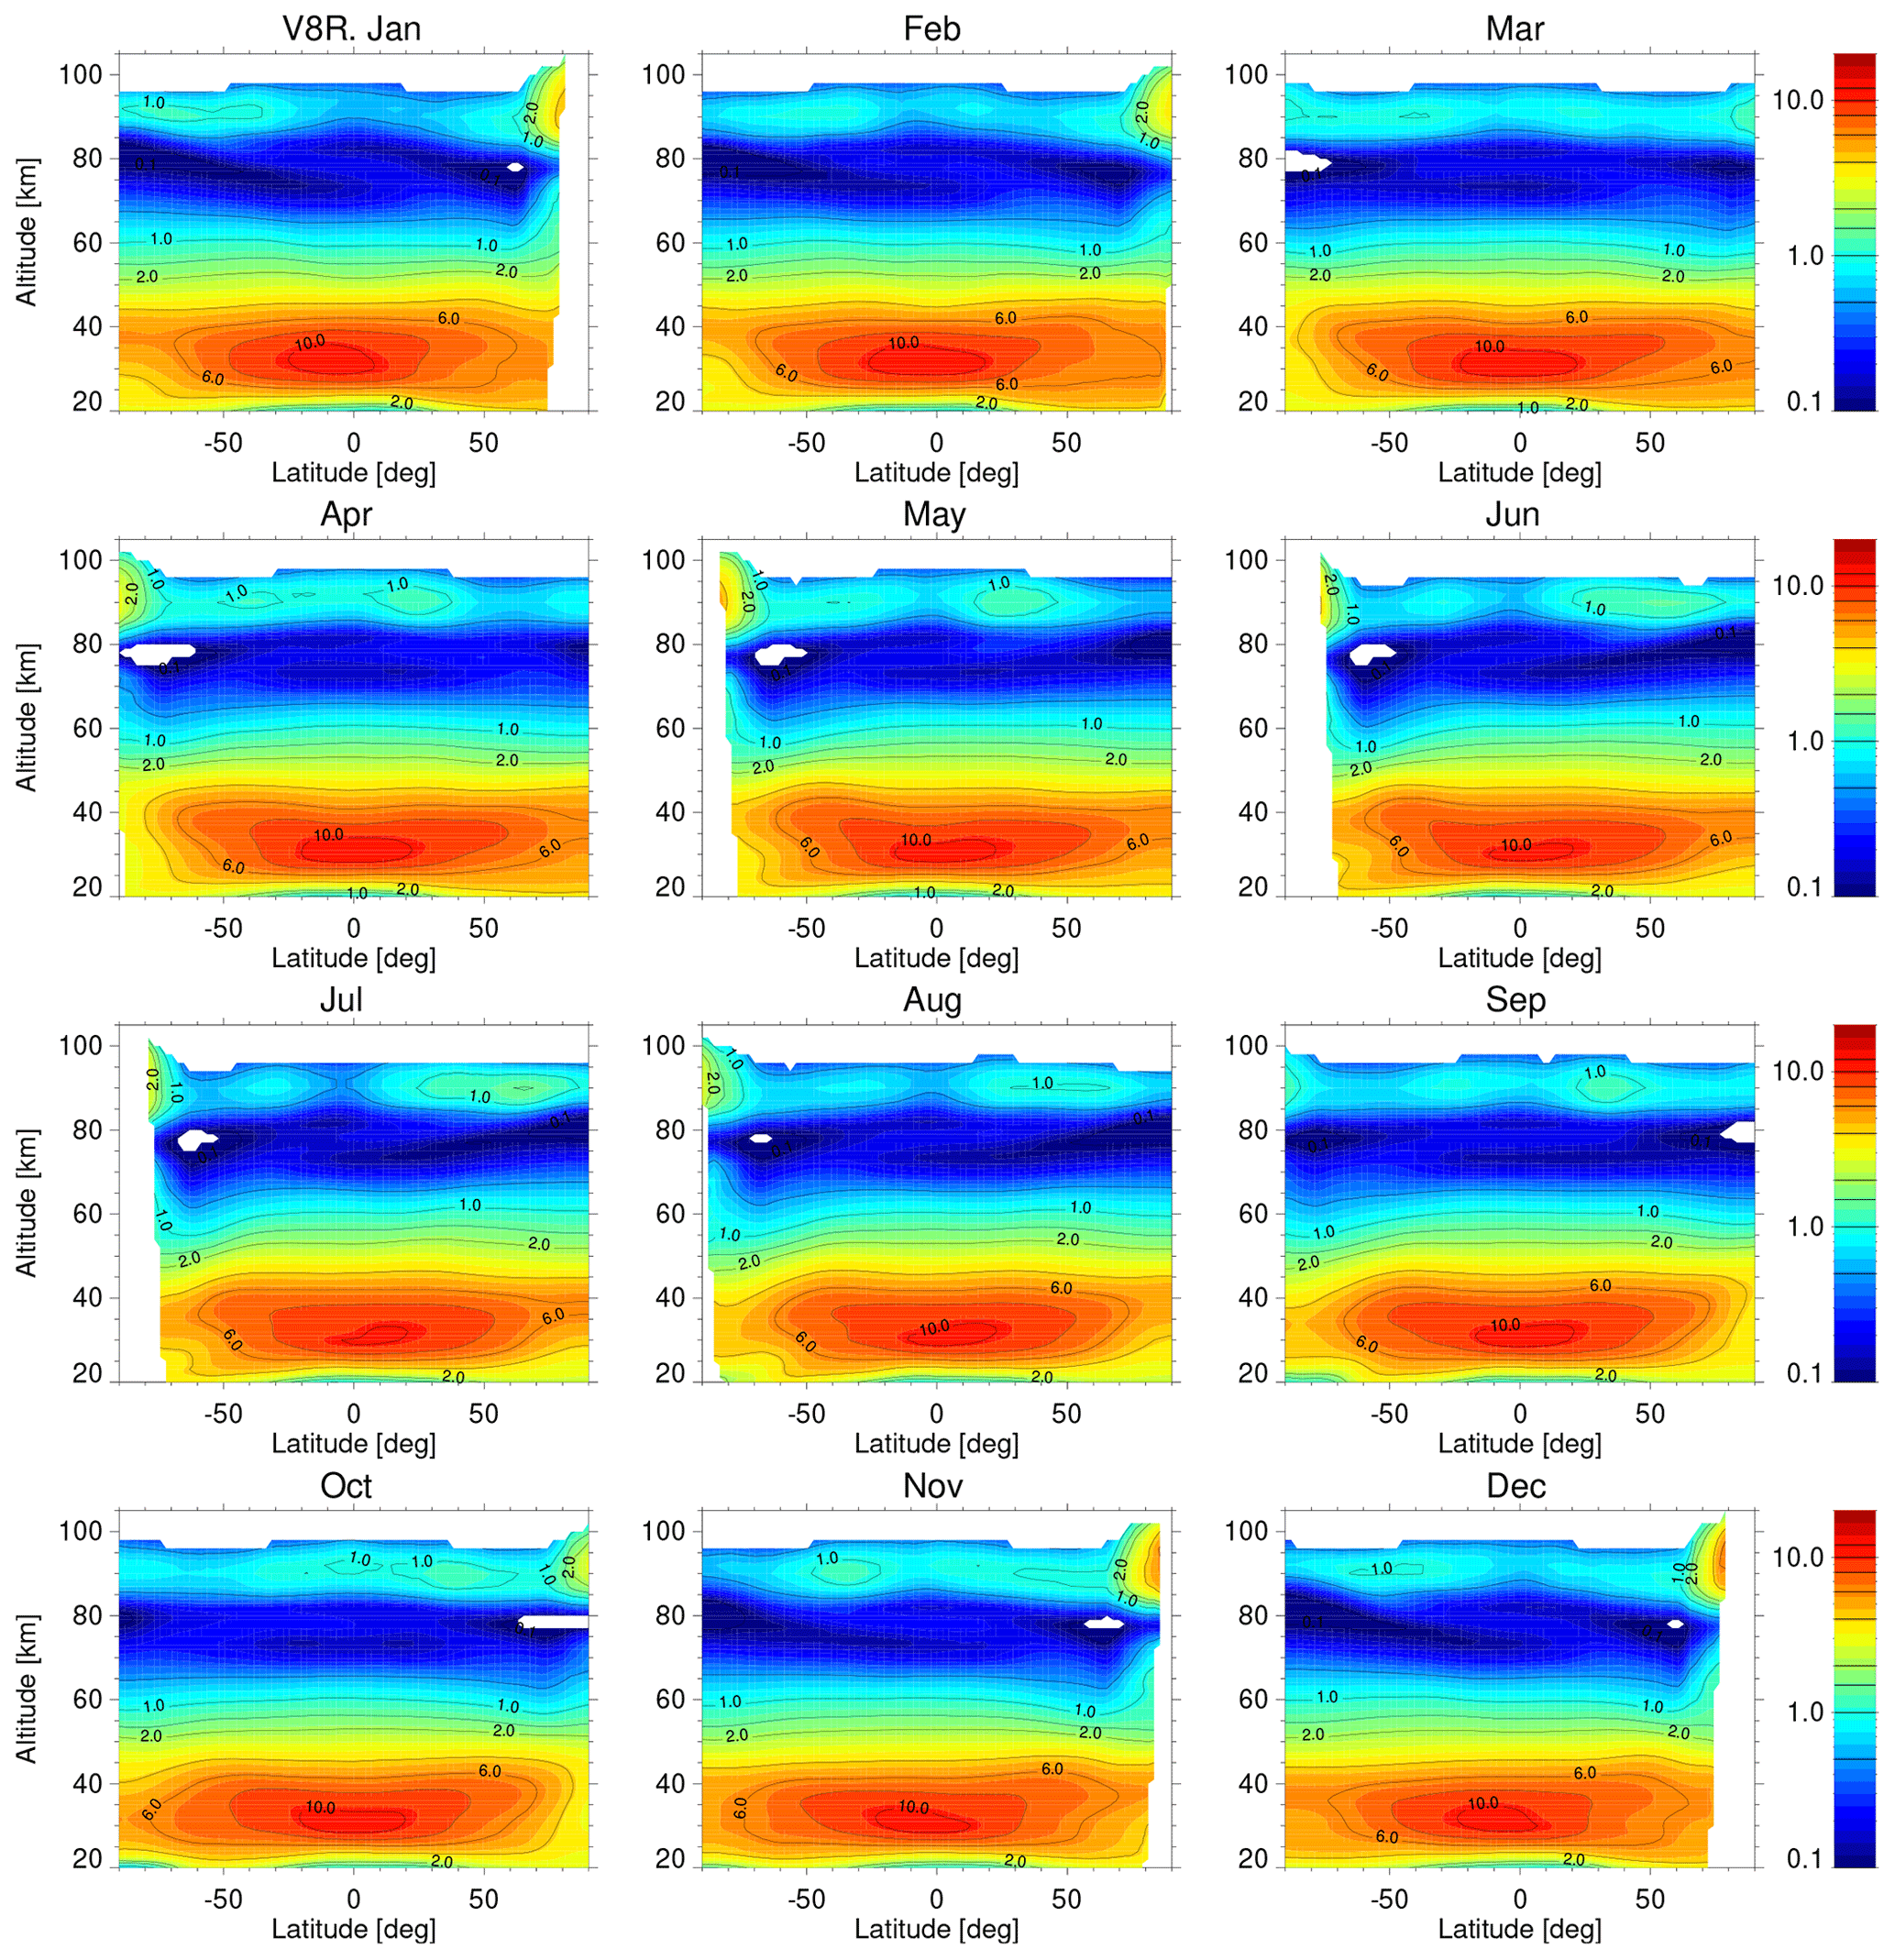
Figure D1Composite monthly zonal mean of MIPAS data taken in the MA mode for the 2007–2012 period for the daytime (local time of 10:00). White areas denote regions where MIPAS has no sensitivity to measure the very low ozone values. Contours are 0.1, 0.5, 1, 1.5, 2, 4, 6, 8, 10 and 12 ppmv.
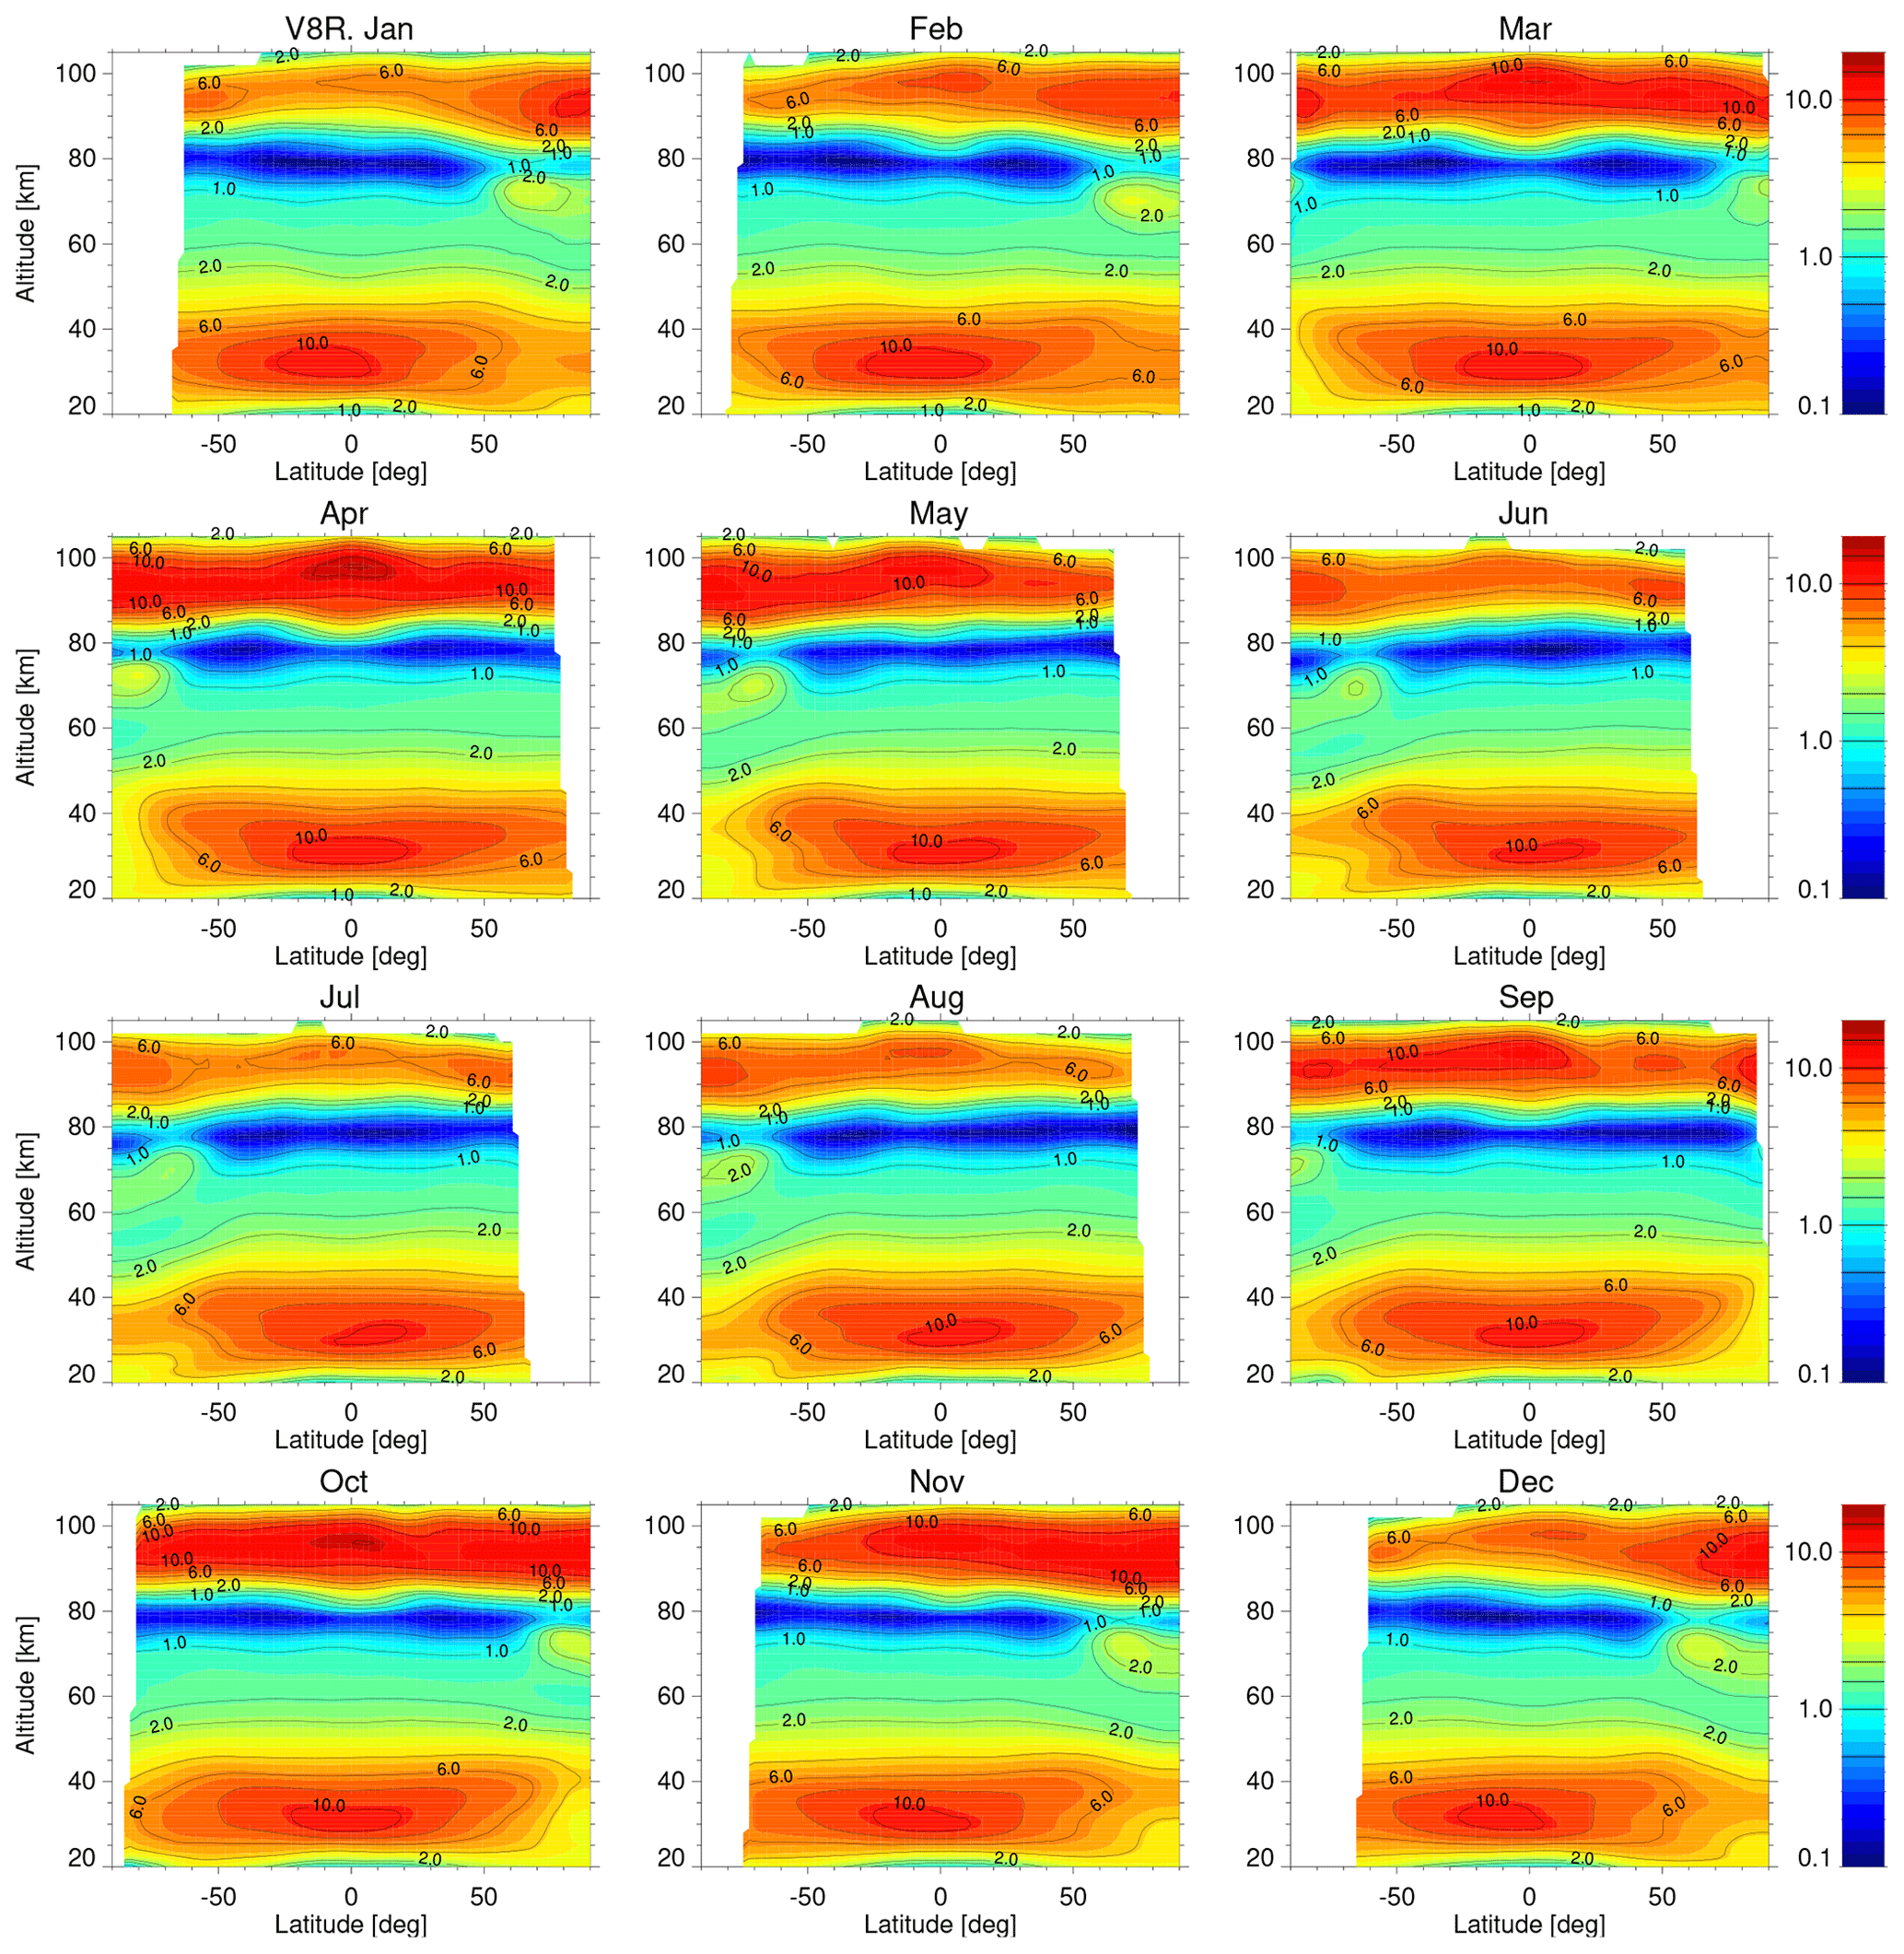
Figure D2Composite monthly zonal mean of MIPAS data for the 2017–2012 period for the nighttime. Contours are 0.5, 1, 1.5, 2, 4, 6, 8, 10 and 15 ppmv.
D2 Diurnal variation
For completeness, we also show the composite seasonal zonal mean of the MIPAS O3 diurnal differences (10:00–22:00 as a percentage of 22:00 values) in Fig. D3. The differences near 80 km have been considerably improved in the data version. See general features in López-Puertas et al. (2018).
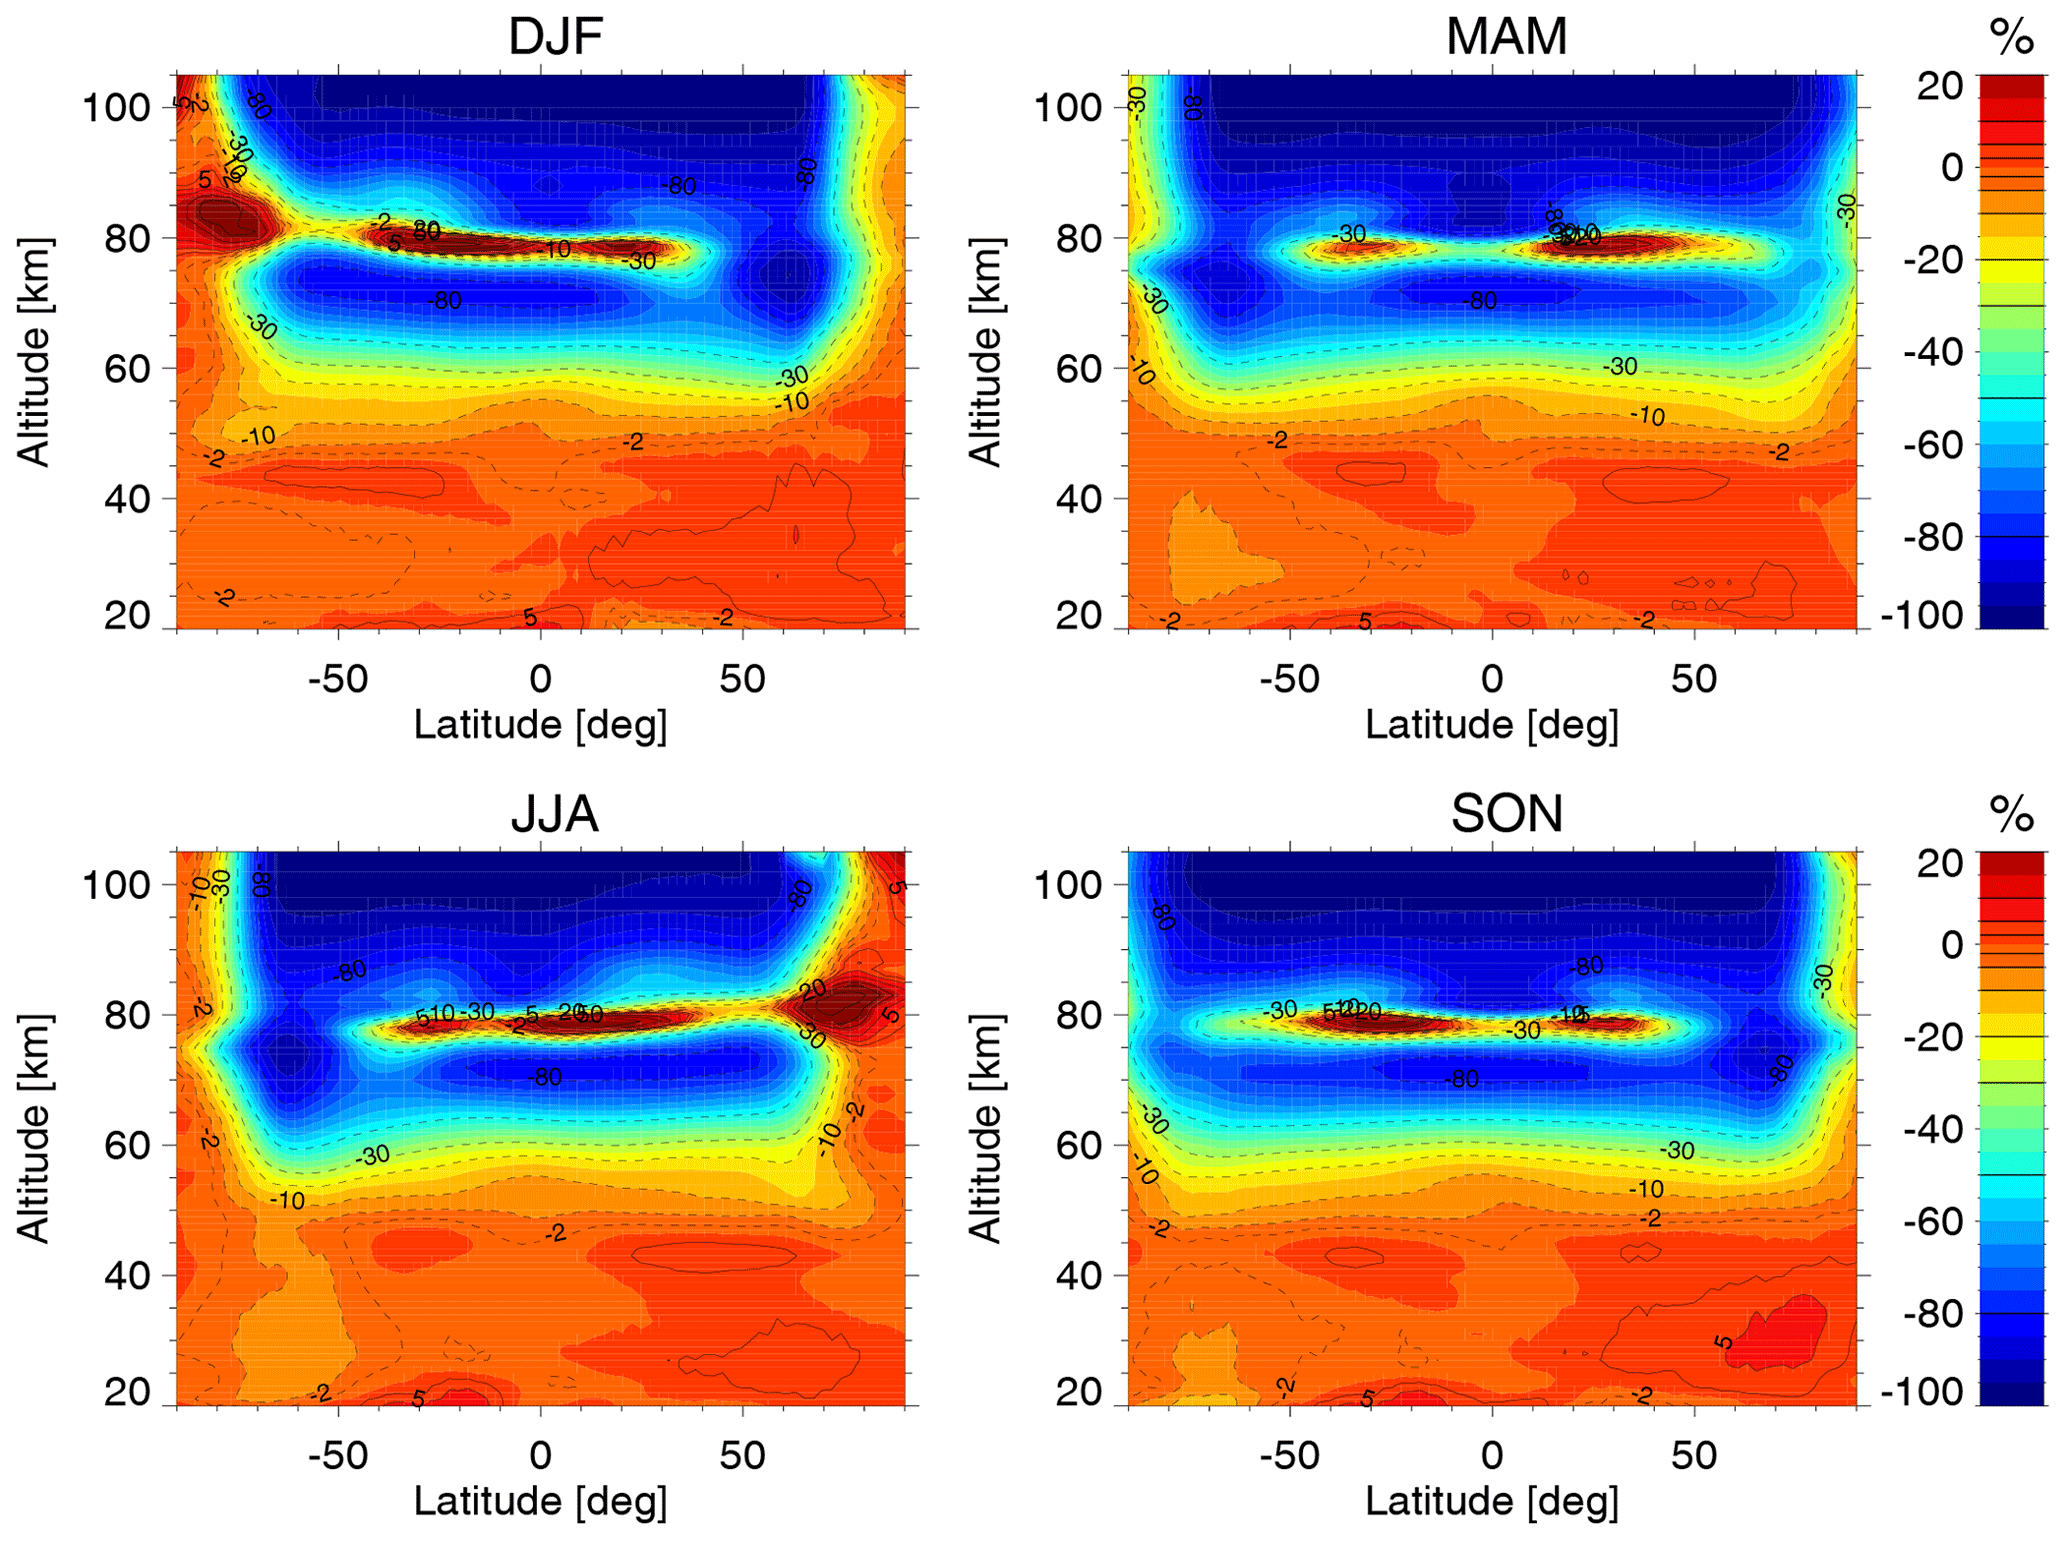
Figure D3Composite seasonal zonal mean of O3 diurnal differences (10:00–22:00 as a percentage of 22:00 values) of MIPAS data taken in the MA mode for the 2007–2012 period. DJF stands for December, January and February; MAM for March, April and May; JJA for June, July and August; and SON for September, October and November. Contours are −80 %, −50 %, −30 %, −20 %, −10 %, −5 %, −2 %, 2 %, 5 %, 10 % and 20 %.
D3 Annual variability
Figure D4 shows the annual variability as latitude × month cross sections of O3 at different altitudes for the daytime (left column) and nighttime (right column). See López-Puertas et al. (2018) for a description of the major features.
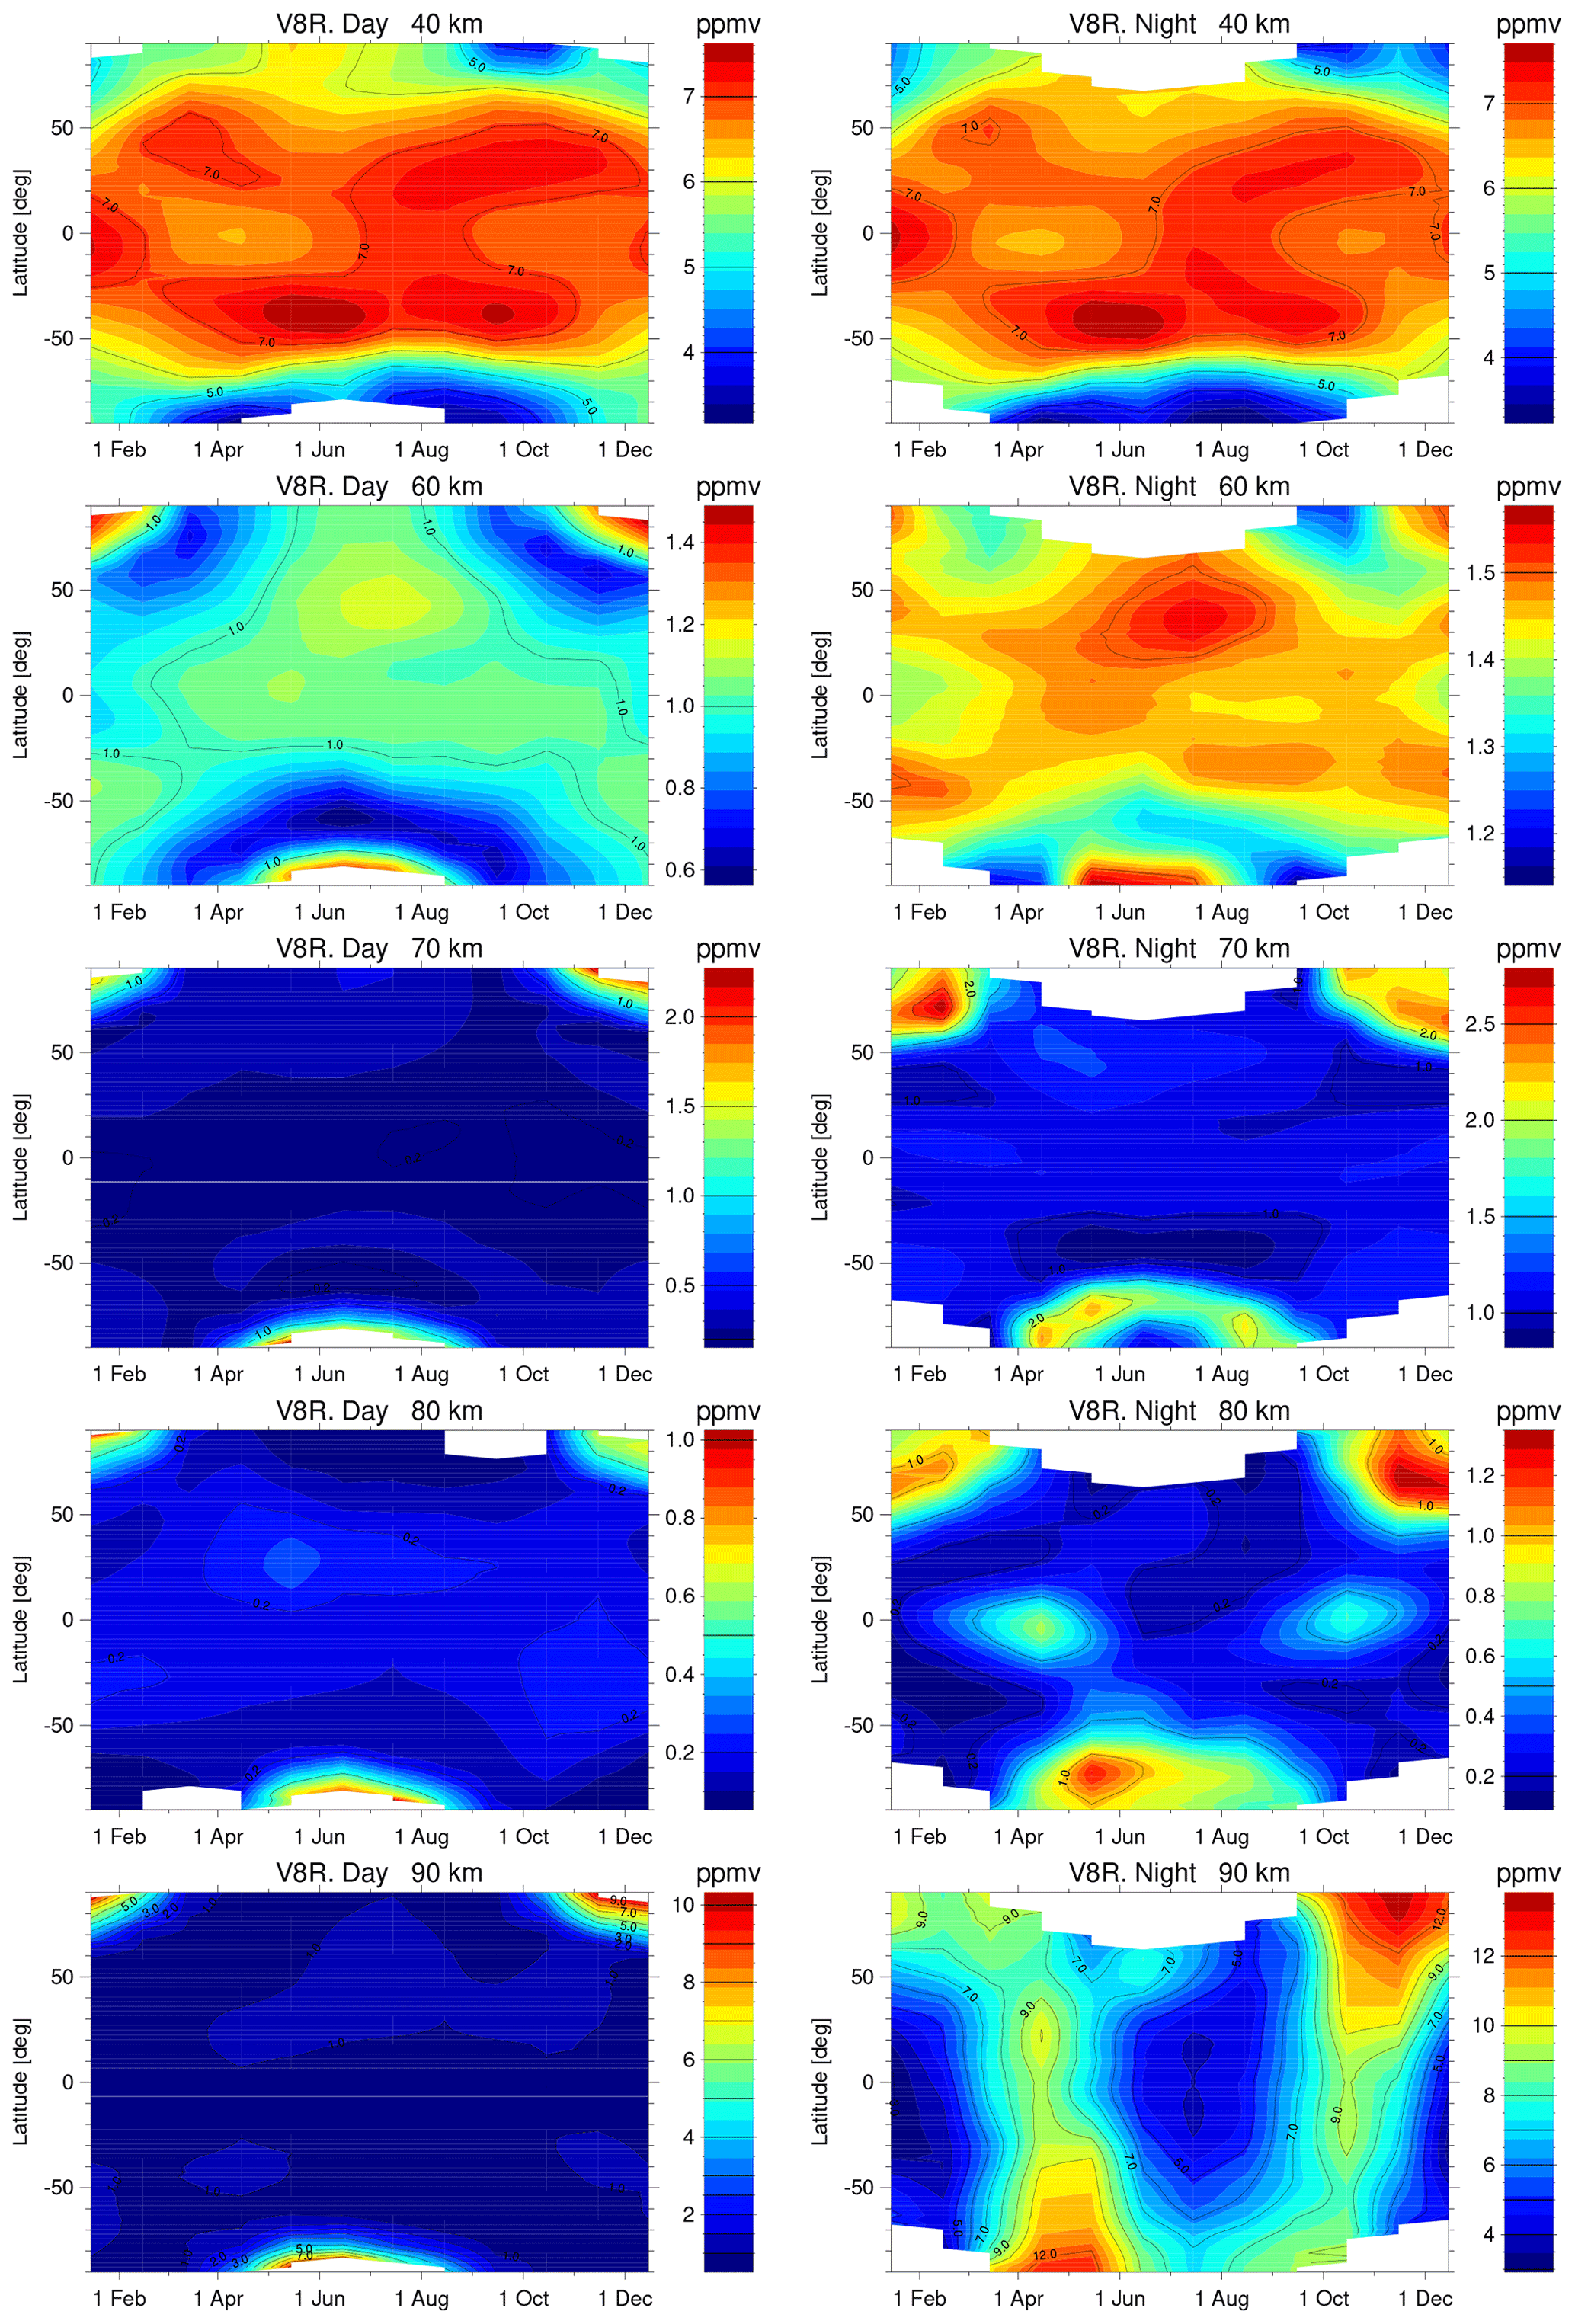
Figure D4Seasonal evolution versus latitude of O3 VMR at different altitudes for the daytime (left column) and nighttime (right column). Note the different scales used in the different panels.
D4 Altitude-resolved time series
In this section we show the inter-annual variability in altitude-resolved time series of O3 at the tropical and polar latitudes (Fig. D5) and as latitude × time cross sections at given altitudes (Fig. D6).

Figure D5Altitude-resolved time series, for latitudes near the Equator (10∘ S–10∘ N) (a, b); the southern polar region, 70–90∘ S (c, d); and the northern polar region, 70–90∘ N (e, f), for daytime (a, c, e) and nighttime (b, d, f).
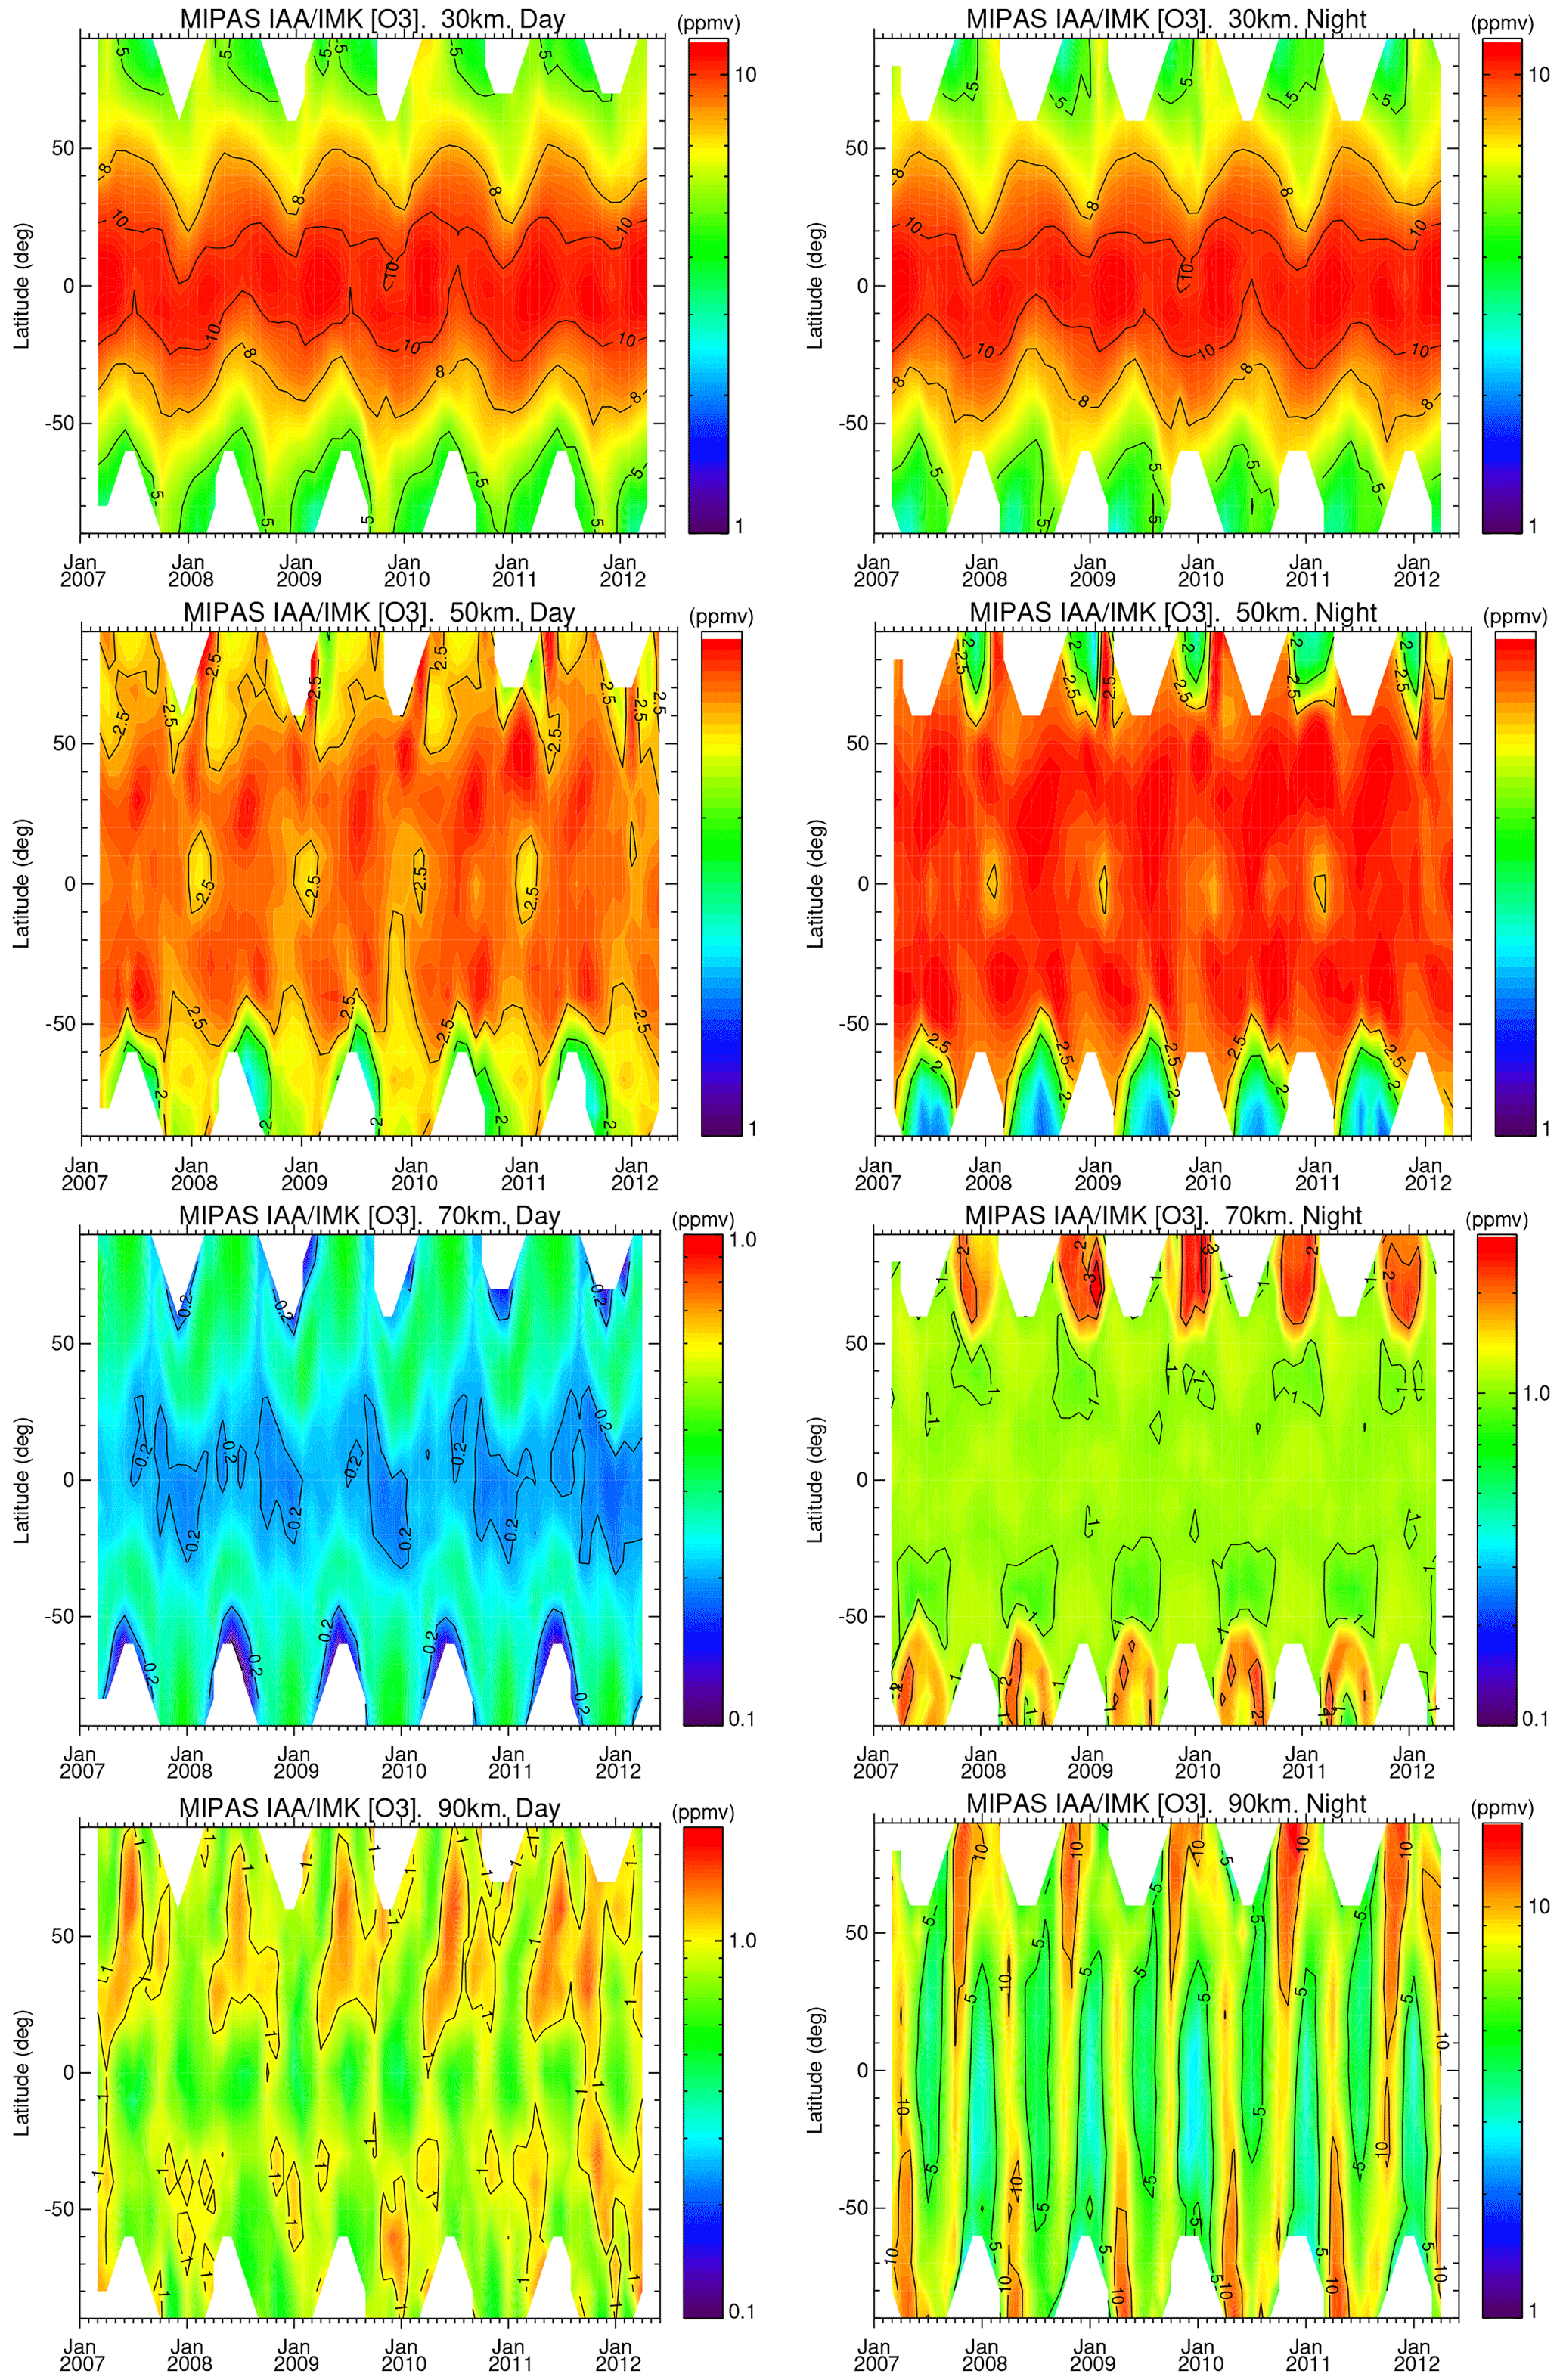
Figure D6Cross section of latitude–time MIPAS O3 at 50, 70 and 90 km for the daytime (left column) and nighttime (right column). Note the different colour scales in some panels.
The MIPAS data can be obtained from the KITopen repository at https://doi.org/10.35097/1803 (López-Puertas et al., 2023). The data is also available on demand in HARMOZ format (Sofieva et al., 2013, https://doi.org/10.5194/essd-5-349-2013). SABER version 2.0 of O3 retrieved from the 9.6 µm channel is publicly available at http://saber.gats-inc.com (USU SDL, 2023). ESA O3 IPF version 6.01 (Kyrölä et al., 2010; Sofieva et al., 2010) is available from the ESA Earth Online portal at https://doi.org/10.57780/EN1-b655562 (European Space Agency, 2017). MLS O3 version 5.0–1.1a is available at https://doi.org/10.5067/Aura/MLS/DATA2516 (Schwartz et al., 2020). Version 3.2 of SMILES O3 data is available at https://doi.org/10.17597/ISAS.DARTS/STP-00001 (JAXA/ISAS, 2016). ACE-FTS O3 data from version 4.1 are available from http://www.ace.uwaterloo.ca/data.php (University of Waterloo, 2023).
The supplement related to this article is available online at: https://doi.org/10.5194/amt-16-5609-2023-supplement.
MLP performed the data analysis, wrote the manuscript and had the final editorial responsibility for this paper. MGC performed the comparison of MIPAS data with all the other instruments. BF developed the retrieval setup and performed many test calculations. TvC ensured the TUNER compliance of error estimates. NG was responsible for spectroscopy issues, developed parts of the error estimation software and carried out some retrieval tests. UG provided and maintained the retrieval software and developed parts of the error estimation software. SK and ALi ran the retrievals. MK coordinated and performed related test calculations and error estimations. ALa contributed to quality control and prepared the data in HARMOZ format. GPS organized the interfacing between IMK and IAA, organized the consistency between NOM and MA–UA–NLC data, and took care of the quality control. All the authors participated in the development of the retrieval setup, contributed to the discussions, and provided text and comments.
At least one of the (co-)authors is a member of the editorial board of Atmospheric Measurement Techniques. The peer-review process was guided by an independent editor, and the authors also have no other competing interests to declare.
Publisher's note: Copernicus Publications remains neutral with regard to jurisdictional claims made in the text, published maps, institutional affiliations, or any other geographical representation in this paper. While Copernicus Publications makes every effort to include appropriate place names, the final responsibility lies with the authors.
This article is part of the special issue “IMK–IAA MIPAS version 8 data: retrieval, validation, and application (ACP/AMT inter-journal SI)”. It is not associated with a conference.
We would like to thank the European Space Agency for providing the MIPAS level-1b spectra. The computations were partly done in the framework of a Bundesprojekt (grant MIPAS_V7) on the Cray XC40 “Hazel Hen” of the High Performance Computing Center Stuttgart (HLRS) of the University of Stuttgart.
This research has been supported by the Agencia Estatal de Investigación (grant nos. PID2019-110689RB-I00 and CEX2021-001131-S) and the Deutsches Zentrum für Luft- und Raumfahrt (grant no. 50EE1547).
We acknowledge support of the publication fee by the CSIC Open Access Publication Support Initiative through its Unit of Information Resources for Research (URICI).
This paper was edited by Andre Butz and reviewed by Chris Boone and one anonymous referee.
Bernath, P. F.: The Atmospheric Chemistry Experiment (ACE), J. Quant. Spectrosc. Ra., 186, 3–16, https://doi.org/10.1016/j.jqsrt.2016.04.006, 2017. a
Bertaux, J. L., Kyrölä, E., Fussen, D., Hauchecorne, A., Dalaudier, F., Sofieva, V., Tamminen, J., Vanhellemont, F., Fanton d'Andon, O., Barrot, G., Mangin, A., Blanot, L., Lebrun, J. C., Pérot, K., Fehr, T., Saavedra, L., Leppelmeier, G. W., and Fraisse, R.: Global ozone monitoring by occultation of stars: an overview of GOMOS measurements on ENVISAT, Atmos. Chem. Phys., 10, 12091–12148, https://doi.org/10.5194/acp-10-12091-2010, 2010. a
Birk, M., Wagner, G., Gordon, I. E., and Drouin, B. J.: Ozone Intensities in the Rotational Bands, J. Quant. Spectrosc. Ra., 226, 60–65, https://doi.org/10.1016/j.jqsrt.2019.01.004, 2019. a
Boone, C. D., Walker, K. A., and Bernath, P. F.: Version 3 retrievals for the Atmospheric Chemistry Experiment Fourier Transform Spectrometer (ACE–FTS), in: The Atmospheric Chemistry Experiment ACE at 10: A Solar Occultation Anthology, edited by: Bernath, P. F., pp. 103–127, A. Deepak Publishing, Hampton, Virginia, USA, ISBN 978-0-937194-54-9, 2013. a
Brasseur, G. and Solomon, S.: Aeronomy of the Middle Atmosphere–Chemistry and Physics of the Stratosphere and Mesosphere, 3rd edn., Atmospheric and Oceanographic Sciences Library 32, Springer, P.O. Box 17, 3300 AA Dordrecht, the Netherlands, https://doi.org/10.1007/1-4020-3824-0, 2005. a
Castle, K. J., Black, L. A., and Pedersen, T. J.: Vibrational Relaxation of O3(ν2) by O(3P), J. Phys. Chem., 118, 4548–4553, https://doi.org/10.1021/jp500224j, 2014. a
De Laurentis, M.: Planning of MIPAS new special modes January 2005 Campaign, Tech. rep., ESA Technical Note, ENVI-SPPA-EOPG-TN-05-0002, European Space Agency, Noordwijk, The Netherlands, 2005. a, b
Eckert, E., von Clarmann, T., Kiefer, M., Stiller, G. P., Lossow, S., Glatthor, N., Degenstein, D. A., Froidevaux, L., Godin-Beekmann, S., Leblanc, T., McDermid, S., Pastel, M., Steinbrecht, W., Swart, D. P. J., Walker, K. A., and Bernath, P. F.: Drift-corrected trends and periodic variations in MIPAS IMK/IAA ozone measurements, Atmos. Chem. Phys., 14, 2571–2589, https://doi.org/10.5194/acp-14-2571-2014, 2014. a, b
Emmert, J. T., Drob, D. P., Picone, J. M., Siskind, D. E., Jones, M., Mlynczak, M. G., Bernath, P. F., Chu, X., Doornbos, E., Funke, B., Goncharenko, L. P., Hervig, M. E., Schwartz, M. J., Sheese, P. E., Vargas, F., Williams, B. P., and Yuan, T.: NRLMSIS 2.0: A Whole-Atmosphere Empirical Model of Temperature and Neutral Species Densities, Earth Space Sci., 8, e2020EA001321, https://doi.org/10.1029/2020ea001321, 2021. a
European Space Agency: Envisat GOMOS Level 2 - Atmospheric constituents profiles [GOM_NL__2P], Version R/IPF 6.01, ESA [data set], https://doi.org/10.57780/EN1-b655562, 2017. a
Fischer, H., Birk, M., Blom, C., Carli, B., Carlotti, M., von Clarmann, T., Delbouille, L., Dudhia, A., Ehhalt, D., Endemann, M., Flaud, J. M., Gessner, R., Kleinert, A., Koopman, R., Langen, J., López-Puertas, M., Mosner, P., Nett, H., Oelhaf, H., Perron, G., Remedios, J., Ridolfi, M., Stiller, G., and Zander, R.: MIPAS: an instrument for atmospheric and climate research, Atmos. Chem. Phys., 8, 2151–2188, https://doi.org/10.5194/acp-8-2151-2008, 2008. a
Flaud, J.-M., Piccolo, C., Carli, B., Perrin, A., Coudert, L. H., Teffo, J.-L., and Brown, L. R.: Molecular line parameters for the MIPAS (Michelson Interferometer for Passive Atmospheric Sounding) experiment, Atmos. Oceanic Opt., 16, 172–182, 2003a. a
Flaud, J. M., Wagner, G., Birk, M., Camy-Peyret, C., Claveau, C., De Backer-Barilly, M. R., Barbe, A., and Piccolo, C.: Ozone absorption around 10 µm, J. Geophys. Res., 108, 4269, https://doi.org/10.1029/2002JD002755, 2003b. a
Funke, B., López-Puertas, M., Stiller, G. P., von Clarmann, T., and Höpfner, M.: A new non–LTE Retrieval Method for Atmospheric Parameters From MIPAS–ENVISAT Emission Spectra, Adv. Space Res., 27, 1099–1104, https://doi.org/10.1016/S0273-1177(01)00169-7, 2001. a
Funke, B., López-Puertas, M., García-Comas, M., Kaufmann, M., Höpfner, M., and Stiller, G. P.: GRANADA: a Generic RAdiative traNsfer AnD non-LTE population Algorithm, J. Quant. Spectrosc. Ra., 113, 1771–1817, https://doi.org/10.1016/j.jqsrt.2012.05.001, 2012. a, b, c
Garcia, R., Smith, A., Kinnison, D., de la Camara, A., and Murphy, D.: Modification of the gravity wave parameterization in the Whole Atmosphere Community Climate Model: Motivation and results, J. Atmos. Sci., 74, 275–291, 2017. a
Garcia, R. R. and Solomon, S.: A new numerical model for the middle atmosphere 2. Ozone and related species, J. Geophys. Res., 99, 12937–12951, 1994. a, b
García-Comas, M., Funke, B., López-Puertas, M., Glatthor, N., Grabowski, U., Kellmann, S., Kiefer, M., Linden, A., Martínez-Mondéjar, B., Stiller, G. P., and von Clarmann, T.: Version 8 IMK–IAA MIPAS temperatures from 12–15 µm spectra: Middle and Upper Atmosphere modes, Atmos. Meas. Tech., 16, 5357–5386, https://doi.org/10.5194/amt-16-5357-2023, 2023. a, b, c, d, e, f, g, h
Gil-López, S., López-Puertas, M., Kaufmann, M., Funke, B., García-Comas, M., Koukouli, M. E., Glatthor, N., Grabowski, U., Höpfner, Stiller, G. P., and von Clarmann, T.: Retrieval of stratospheric and mesospheric O3 from high resolution MIPAS spectra at 15 and 10 µm, Adv. Space Res., 36, 943–951, https://doi.org/10.1016/j.asr.2005.05.123, 2005. a
Glatthor, N., von Clarmann, T., Fischer, H., Funke, B., Gil-López, S., Grabowski, U., Höpfner, M., Kellmann, S., Linden, A., López-Puertas, M., Mengistu Tsidu, G., Milz, M., Steck, T., Stiller, G. P., and Wang, D.-Y.: Retrieval of stratospheric ozone profiles from MIPAS/ENVISAT limb emission spectra: a sensitivity study, Atmos. Chem. Phys., 6, 2767–2781, https://doi.org/10.5194/acp-6-2767-2006, 2006. a
Glatthor, N., von Clarmann, T., Stiller, G. P., Kiefer, M., Laeng, A., Dinelli, B. M., Wetzel, G., and Orphal, J.: Differences in ozone retrieval in MIPAS channels A and AB: a spectroscopic issue, Atmos. Meas. Tech., 11, 4707–4723, https://doi.org/10.5194/amt-11-4707-2018, 2018. a, b
Gordon, I. E., Rothman, L. S., Hill, C., Kochanov, R. V., Tan, Y., Bernath, P. F., Birk, M., Boudon, V., Campargue, A., Chance, K. V., Drouin, B. J., Flaud, J.-M., Gamache, R. R., Hodges, J. T., Jacquemart, D., Perevalov, V. I., Perrin, A., Shine, K. P., Smith, M.-A. H., Tennyson, J., Toon, G. C., Tran, H., Tyuterev, V. G., Barbe, A., Császár, A. G., Devi, V. M., Furtenbacher, T., Harrison, J. J., Hartmann, J.-M., Jolly, A., Johnson, T. J., Karman, T., Kleiner, I., Kyuberis, A. A., Loos, J., Lyulin, O. M., Massie, S. T., Mikhailenko, S. N., Moazzen-Ahmadi, N., Müller, H. S. P., Naumenko, O. V., Nikitin, A. V., Polyansky, O. L., Rey, M., Rotger, M., Sharpe, S. W., Sung, K., Starikova, E., Tashkun, S. A., Vander Auwera, J., Wagner, G., Wilzewski, J., Wcisło, P., Yu, S., and Zak, E. J.: The HITRAN2016 molecular spectroscopic database, J. Quant. Spectrosc. Ra., 203, 3–69, https://doi.org/10.1016/j.jqsrt.2017.06.038, 2017. a
Hubert, D., Keppens, A., Granville, J., and Lambert, J.-C.: Multi-TASTE Phase F Validation Report: Ground-based validation of MIPAS ESA operational products (ORM 8.22): T, altitude, O3, CH4, HNO3 and N2O, European Space Agency, Noordwijk, The Netherlands, https://earth.esa.int/eogateway/documents/20142/37627/TN- BIRA-IASB-MultiTASTE-Phase-F-MIPAS-ORM8-Iss1-RevB.pdf (last access: 10 March 2023), 2020. a
Imai, K., Fujiwara, M., Inai, Y., Manago, N., Suzuki, M., Sano, T., Mitsuda, C., Naito, Y., Hasebe, F., Koide, T., and Shiotani, M.: Comparison of ozone profiles between Superconducting Submillimeter-Wave Limb-Emission Sounder and worldwide ozonesonde measurements, J. Geophys. Res., 118, 12,755–12,765, https://doi.org/10.1002/2013JD021094, 2013a. a
Imai, K., Manago, N., Mitsuda, C., Naito, Y., Nishimoto, E., Sakazaki, T., Fujiwara, M., Froidevaux, L., von Clarmann, T., Stiller, G. P., Murtagh, D. P., Rong, P.-p., Mlynczak, M. G., Walker, K. A., Kinnison, D. E., Akiyoshi, H., Nakamura, T., Miyasaka, T., Nishibori, T., Mizobuchi, S., Kikuchi, K.-i., Ozeki, H., Takahashi, C., Hayashi, H., Sano, T., Suzuki, M., Takayanagi, M., and Shiotani, M.: Validation of ozone data from the Superconducting Submillimeter-Wave Limb-Emission Sounder (SMILES), J. Geophys. Res., 118, 5750–5769, 2013b. a
JAXA/ISAS: SMILES Data, SMILES level-2 products, DARTS [data set], https://doi.org/10.17597/ISAS.DARTS/STP-00001, 2016. a
Jurado-Navarro, Á. A., López-Puertas, M., Funke, B., García-Comas, M., Gardini, A., González-Galindo, F., Stiller, G. P., Clarmann, T. V., Grabowski, U., and Linden, A.: Global distributions of CO2 volume mixing ratio in the middle and upper atmosphere from daytime MIPAS high-resolution spectra, Atmos. Meas. Tech., 9, 6081–6100, https://doi.org/10.5194/amt-9-6081-2016, 2016. a
Kaufmann, M., Gusev, O. A., Grossmann, K. U., Martín-Torres, F. J., Marsh, D. R., and Kutepov, A. A.: Satellite observations of daytime and nighttime ozone in the mesosphere and lower thermosphere, J. Geophys. Res., 108, 4399, https://doi.org/10.1029/2002JD003186, 2003. a
Kiefer, M., von Clarmann, T., Funke, B., García-Comas, M., Glatthor, N., Grabowski, U., Kellmann, S., Kleinert, A., Laeng, A., Linden, A., López-Puertas, M., Marsh, D. R., and Stiller, G. P.: IMK/IAA MIPAS temperature retrieval version 8: nominal measurements, Atmos. Meas. Tech., 14, 4111–4138, https://doi.org/10.5194/amt-14-4111-2021, 2021. a, b, c, d, e, f, g, h, i, j
Kiefer, M., von Clarmann, T., Funke, B., García-Comas, M., Glatthor, N., Grabowski, U., Höpfner, M., Kellmann, S., Laeng, A., Linden, A., López-Puertas, M., and Stiller, G. P.: Version 8 IMK–IAA MIPAS ozone profiles: nominal observation mode, Atmos. Meas. Tech., 16, 1443–1460, https://doi.org/10.5194/amt-16-1443-2023, 2023. a, b, c, d, e, f, g, h, i, j, k, l, m, n, o, p
Kikuchi, K.-I., Nishibori, T., Ochiai, S., Ozeki, H., Irimajiri, Y., Kasai, Y., Koike, M., Manabe, T., Mizukoshi, K., Murayama, Y., Nagahama, T., Sano, T., Sato, R., Seta, M., Takahashi, C., Takayanagi, M., Masuko, H., Inatani, J., Suzuki, M., and Shiotani, M.: Overview and early results of the Superconducting Submillimeter-Wave Limb-Emission Sounder (SMILES), J. Geophys. Res., 115, D23306, https://doi.org/10.1029/2010JD014379, 2010. a
Kleinert, A., Birk, M., Perron, G., and Wagner, G.: Level 1b error budget for MIPAS on ENVISAT, Atmos. Meas. Tech., 11, 5657–5672, https://doi.org/10.5194/amt-11-5657-2018, 2018. a, b, c
Kyrölä, E., Tamminen, J., Sofieva, V., Bertaux, J. L., Hauchecorne, A., Dalaudier, F., Fussen, D., Vanhellemont, F., Fanton d'Andon, O., Barrot, G., Guirlet, M., Mangin, A., Blanot, L., Fehr, T., Saavedra de Miguel, L., and Fraisse, R.: Retrieval of atmospheric parameters from GOMOS data, Atmos. Chem. Phys., 10, 11881–11903, https://doi.org/10.5194/acp-10-11881-2010, 2010. a, b
Laeng, A., Grabowski, U., von Clarmann, T., Stiller, G., Glatthor, N., Höpfner, M., Kellmann, S., Kiefer, M., Linden, A., Lossow, S., Sofieva, V., Petropavlovskikh, I., Hubert, D., Bathgate, T., Bernath, P., Boone, C. D., Clerbaux, C., Coheur, P., Damadeo, R., Degenstein, D., Frith, S., Froidevaux, L., Gille, J., Hoppel, K., McHugh, M., Kasai, Y., Lumpe, J., Rahpoe, N., Toon, G., Sano, T., Suzuki, M., Tamminen, J., Urban, J., Walker, K., Weber, M., and Zawodny, J.: Validation of MIPAS IMK/IAA V5R_O3_224 ozone profiles, Atmos. Meas. Tech., 7, 3971–3987, https://doi.org/10.5194/amt-7-3971-2014, 2014. a
Laeng, A., Hubert, D., Verhoelst, T., von Clarmann, T., Dinelli, B. M., Dudhia, A., Raspollini, P., Stiller, G., Grabowski, U., Keppens, A., Kiefer, M., Sofieva, V., Froidevaux, L., Walker, K. A., Lambert, J.-C., and Zehner, C.: The Ozone Climate Change Initiative: Comparison of four Level-2 Processors for the Michelson Interferometer for Passive Atmospheric Sounding (MIPAS), Remote Sens. Environ., 162, 316–343, https://doi.org/10.1016/j.rse.2014.12.013, 2015. a
Laeng, A., Eckert, E., von Clarmann, T., Kiefer, M., Hubert, D., Stiller, G., Glatthor, N., López-Puertas, M., Funke, B., Grabowski, U., Plieninger, J., Kellmann, S., Linden, A., Lossow, S., Babenhauserheide, A., Froidevaux, L., and Walker, K.: On the improved stability of the version 7 MIPAS ozone record, Atmos. Meas. Tech., 11, 4693–4705, https://doi.org/10.5194/amt-11-4693-2018, 2018. a
Livesey, N. J., Read, W. G., Wagner, P. A., Froidevaux, L., Santee, M. L., Schwartz, M. J., Lambert, A., Millán-Valle, L. F., Pumphrey, H. C., , Manney, G. L., Fuller, R. A., Jarnot, R. F., Knosp, B. W., and Lay, R. R.: Version 5.0x Level 2 and 3 data quality and description document, Tech. Rep. JPL D-105336 Rev. B, Jet Propulsion Laboratory California Institute of Technology Pasadena, California, 91109-8099, 2022. a, b
López-Puertas, M., Funke, B., Stiller, G., and Laeng, A.: The diurnal variability of O3 in the upper stratosphere and mesosphere (WP232 and O-WP310), Tech. Rep. Project: Ozone CCI O-II Optional Proposal v1.1, ESA Contract No:4000109876/14/I-NB, European Space Agency, Noordwijk, The Netherlands, 2017. a
López-Puertas, M., García-Comas, M., Funke, B., Gardini, A., Stiller, G. P., von Clarmann, T., Glatthor, N., Laeng, A., Kaufmann, M., Sofieva, V. F., Froidevaux, L., Walker, K. A., and Shiotani, M.: MIPAS observations of ozone in the middle atmosphere, Atmos. Meas. Tech., 11, 2187–2212, https://doi.org/10.5194/amt-11-2187-2018, 2018. a, b, c, d, e, f, g, h, i, j, k, l, m, n, o, p, q, r, s, t, u, v, w, x, y, z, aa, ab, ac, ad
López-Puertas, M., García-Comas, M., Funke, B., von Clarmann, T., Glatthor, N., Grabowski, U., Kellmann, S., Kiefer, M. Laeng, A., Linden, A., and Stiller, G. P.: MIPAS ozone retrieval version 8: middle-atmosphere measurements, KITopen [data set], https://doi.org/10.35097/1803, 2023. a
Marsh, D. R.: Chemical-dynamical coupling in the mesosphere and lower thermosphere, in: Aeronomy of the Earth’s atmosphere and ionosphere, 1st edn., edited by: Abdu, M. and Pancheva, D., vol. 2 of IAGA Special Sopron Book, Springer, Dordrecht, 3–17, ISBN 978-94-007-0325-4, 2011. a
Marsh, D. R., Mills, M. J., Kinnison, D. E., Lamarque, J.-F., Calvo, N., and Polvani, L. M.: Climate Change from 1850 to 2005 Simulated in CESM1(WACCM), J. Climate, 26, 7372–7391, https://doi.org/10.1175/JCLI-D-12-00558.1, 2013. a
Mitsuda, C., Suzuki, M., Iwata, Y., Manago, N., Naito, Y., Takahashi, C., Imai, K., Nishimoto, E., Hayashi, H., Shiotani, M., Sano, T., Takayanagi, M., and Taniguchi, H.: Current status of level 2 product of Superconducting Submillimeter-Wave Limb-Emission Sounder (SMILES), in: Sensors, Systems, and Next-Generation Satellites XV, edited by: Meynart, R., Neeck, S. P., Shimoda, H., SPIE, 8176, p. 6, https://doi.org/10.1117/12.898135, 2011. a
Mlynczak, M. G., Hunt, L. A., Mast, J. C., Thomas Marshall, B., Russell, J. M., Smith, A. K., Siskind, D. E., Yee, J.-H., Mertens, C. J., Javier Martin-Torres, F., Earl Thompson, R., Drob, D. P., and Gordley, L. L.: Atomic oxygen in the mesosphere and lower thermosphere derived from SABER: Algorithm theoretical basis and measurement uncertainty, J. Geophys. Res., 118, 5724–5735, https://doi.org/10.1002/jgrd.50401, 2013. a, b, c
Norton, H. and Beer, R.: New apodizing functions for Fourier spectrometry, J. Opt. Soc. Am., 66, 259–264, https://doi.org/10.1364/JOSA.66.000259, 1976. a
Oelhaf, H.: MIPAS Mission Plan, ESA Technical Note ENVI-SPPA-EOPG-TN-07-0073, European Space Agency, Noordwijk, The Netherlands, 2008. a, b
Picone, J., Hedin, A., Drob, D., and Aikin, A.: NRLMSISE-00 empirical model of the atmosphere: Statistical comparisons and scientific issues, J. Geophys. Res., 107, 1468, https://doi.org/10.1029/2002JA009430, 2002. a
Rong, P. P., Russell, J. M., Mlynczak, M. G., Remsberg, E. E., Marshall, B. T., Gordley, L. L., and López-Puertas, M.: Validation of Thermosphere Ionosphere Mesosphere Energetics and Dynamics/Sounding of the Atmosphere using Broadband Emission Radiometry (TIMED/SABER) v1.07 ozone at 9.6 µm in altitude range 15-70 km, J. Geophys. Res., 114, D04306, https://doi.org/10.1029/2008JD010073, 2009. a, b
Rothman, L. S., Gordon, I. E., Barbe, A., Benner, D. C., Bernath, P. F., Birk, M., Boudon, V., Brown, L. R., Campargue, A., Champion, J., Chance, K., Coudert, L. H., Dana, V., Devi, V. M., Fally, S., Flaud, J., Gamache, R. R., Goldman, A., Jacquemart, D., Kleiner, I., Lacome, N., Lafferty, W. J., Mandin, J., Massie, S. T., Mikhailenko, S. N., Miller, C. E., Moazzen-Ahmadi, N., Naumenko, O. V., Nikitin, A. V., Orphal, J., Perevalov, V. I., Perrin, A., Predoi-Cross, A., Rinsland, C. P., Rotger, M., Šimečková, M., Smith, M. A. H., Sung, K., Tashkun, S. A., Tennyson, J., Toth, R. A., Vandaele, A. C., and Vander Auwera, J.: The HITRAN 2008 molecular spectroscopic database, J. Quant. Spectrosc. Ra., 110, 533–572, https://doi.org/10.1016/j.jqsrt.2009.02.013, 2009. a
Russell III, J. M., Mlynczak, M. G., Gordley, L. L., Tansock, J., and Esplin, R.: An overview of the SABER experiment and preliminary calibration results, in: Optical Spectroscopic Techniques and Instrumentation for Atmospheric and Space Research III, edited by: Larar, A. M., 3756, 277–288, https://doi.org/10.1117/12.366382, 1999. a
Schwartz, M., Froidevaux, L., Livesey, N., and Read, W.: MLS/Aura Level 2 Ozone (O3) Mixing Ratio V004, Goddard Earth Sciences Data and Information Services Center (GES DISC) [data set], Greenbelt, MD, USA, https://doi.org/10.5067/AURA/MLS/DATA2017, 2015. a
Schwartz, M., Froidevaux, L., Livesey, N., and Read, W.: MLS/Aura Level 2 Ozone (O3) Mixing Ratio V005, Goddard Earth Sciences Data and Information Services Center (GES DISC) [data set], Greenbelt, MD, USA, https://doi.org/10.5067/Aura/MLS/DATA2516, 2020. a
Smith, A. K., Harvey, V. L., Mlynczak, M. G., Funke, B., García-Comas, M., Hervig, M., Kaufmann, M., Kyrölä, E., López-Puertas, M., McDade, I., Randall, C. E., Russell, J. M., Sheese, P. E., Shiotani, M., Skinner, W. R., Suzuki, M., and Walker, K. A.: Satellite observations of ozone in the upper mesosphere, J. Geophys. Res., 118, 1–19, https://doi.org/10.1002/jgrd.50445, 2013. a, b
Sofieva, V. F., Vira, J., Kyrölä, E., Tamminen, J., Kan, V., Dalaudier, F., Hauchecorne, A., Bertaux, J.-L., Fussen, D., Vanhellemont, F., Barrot, G., and Fanton d'Andon, O.: Retrievals from GOMOS stellar occultation measurements using characterization of modeling errors, Atmos. Meas. Tech., 3, 1019–1027, https://doi.org/10.5194/amt-3-1019-2010, 2010. a, b
Sofieva, V. F., Rahpoe, N., Tamminen, J., Kyrölä, E., Kalakoski, N., Weber, M., Rozanov, A., von Savigny, C., Laeng, A., von Clarmann, T., Stiller, G., Lossow, S., Degenstein, D., Bourassa, A., Adams, C., Roth, C., Lloyd, N., Bernath, P., Hargreaves, R. J., Urban, J., Murtagh, D., Hauchecorne, A., Dalaudier, F., van Roozendael, M., Kalb, N., and Zehner, C.: Harmonized dataset of ozone profiles from satellite limb and occultation measurements, Earth Syst. Sci. Data, 5, 349–363, https://doi.org/10.5194/essd-5-349-2013, 2013. a
Takahashi, C., Ochiai, S., and Suzuki, M.: Operational retrieval algorithms for JEM/SMILES level 2 data processing system, J. Quant. Spectrosc. Ra., 111, 160–173, https://doi.org/10.1016/j.jqsrt.2009.06.005, 2010. a
Takahashi, C., Suzuki, M., Mitsuda, C., Ochiai, S., Manago, N., Hayashi, H., Iwata, Y., Imai, K., Sano, T., Takayanagi, M., and Shiotani, M.: Capability for ozone high-precision retrieval on JEM/SMILES observation, Adv. Space Res., 48, 1076–1085, 2011. a
Tamminen, J., Kyrölä, E., Sofieva, V. F., Laine, M., Bertaux, J.-L., Hauchecorne, A., Dalaudier, F., Fussen, D., Vanhellemont, F., Fanton-d'Andon, O., Barrot, G., Mangin, A., Guirlet, M., Blanot, L., Fehr, T., Saavedra de Miguel, L., and Fraisse, R.: GOMOS data characterisation and error estimation, Atmos. Chem. Phys., 10, 9505–9519, https://doi.org/10.5194/acp-10-9505-2010, 2010. a
Tikhonov, A.: On the solution of incorrectly stated problems and method of regularization, Dokl. Akad. Nauk. SSSR+, 151, 501–504, 1963. a
University of Waterloo: ACE Public Datasets, http://www.ace.uwaterloo.ca/data.php, last access: 9 November 2023. a
USU SDL (Utah State University Space Dynamics Laboratory): Sounding of the Atmosphere using Broadband Emission Radiometry (SABER) data, GATS, SABER O3 data, NASA Langley Research Center, http://saber.gats-inc.com, last access: 9 November 2023. a
von Clarmann, T., Glatthor, N., Grabowski, U., Höpfner, M., Kellmann, S., Kiefer, M., Linden, A., Mengistu Tsidu, G., Milz, M., Steck, T., Stiller, G. P., Wang, D. Y., Fischer, H., Funke, B., Gil-López, S., and López-Puertas, M.: Retrieval of temperature and tangent altitude pointing from limb emission spectra recorded from space by the Michelson Interferometer for Passive Atmospheric Sounding (MIPAS), J. Geophys. Res., 108, 4736, https://doi.org/10.1029/2003JD003602, 2003. a, b
von Clarmann, T., Höpfner, M., Kellmann, S., Linden, A., Chauhan, S., Funke, B., Grabowski, U., Glatthor, N., Kiefer, M., Schieferdecker, T., Stiller, G. P., and Versick, S.: Retrieval of temperature, H2O, O3, HNO3, CH4, N2O, ClONO2 and ClO from MIPAS reduced resolution nominal mode limb emission measurements, Atmos. Meas. Tech., 2, 159–175, https://doi.org/10.5194/amt-2-159-2009, 2009. a, b
von Clarmann, T., Glatthor, N., Grabowski, U., Funke, B., Kiefer, M., and Stiller, G. P.: TUNER-compliant error estimation for MIPAS, Atmos. Meas. Tech., in preparation, 2022. a, b, c, d, e, f, g, h, i, j, k, l
Waters, J. W., Froidevaux, L., Harwood, R. S., et al..: The Earth Observing System Microwave Limb Sounder (EOS MLS) on the Aura Satellite, IEEE T. Geosci. Remote, 44, 1075–1092, https://doi.org/10.1109/TGRS.2006.873771, 2006. a
West, G. A., Weston Jr., R. E., and Flynn, G. W.: Deactivation of vibrationally excited ozone by O(3P) atoms, Chem. Phys. Lett., 42, 488–493, 1976. a, b
West, G. A., Weston, R. E., and Flynn, G. W.: The influence of reactant vibrational excitation on the O(3P) + O3 bimolecular reaction rate, Chem. Phys. Lett., 56, 429–433, 1978. a, b
Here m is equal to 5, 6 and 7 for the MA, UA and NLC modes, respectively.
The scan patterns and the number of measurements taken in each observing mode can be consulted at http://eodg.atm.ox.ac.uk/MIPAS/rrmodes.html (last access: 9 November 2023) and http://eodg.atm.ox.ac.uk/MIPAS/L2OXF/ (last access: 10 September 2023).
The 9.6 µm emission used here to retrieve O3 in the mesosphere and lower thermosphere comes from the Δv3 and Δv1 bands.
https://www2.acom.ucar.edu/modeling/tropospheric-ultraviolet-and-visible-tuv-radiation-model (last access: 9 November 2023).
- Abstract
- Introduction
- The retrieval of O3 V8R_O3_m61
- Characterization of the retrieved O3 mixing ratios
- Error budget
- Differences between current V8R_O3_m61 and previous V5R_O3_m22 O3 data
- Consistency between nominal and middle-atmosphere O3 data
- Comparison with other satellite measurements
- Summary and conclusions
- Appendix A: Microwindows
- Appendix B: Tables of the O3 error budget
- Appendix C: Random and systematic components of the O3 errors
- Appendix D: O3 climatology
- Data availability
- Author contributions
- Competing interests
- Disclaimer
- Special issue statement
- Acknowledgements
- Financial support
- Review statement
- References
- Supplement