the Creative Commons Attribution 4.0 License.
the Creative Commons Attribution 4.0 License.
 | 27 Mar 2024
Version 8 IMK/IAA MIPAS measurements of CFC-11, CFC-12, and HCFC-22
Gabriele P. Stiller
Thomas von Clarmann
Norbert Glatthor
Udo Grabowski
Sylvia Kellmann
Michael Kiefer
Alexandra Laeng
Andrea Linden
Bernd Funke
Maya García-Comas
Manuel López-Puertas
The Michelson Interferometer for Passive Atmospheric Sounding (MIPAS) on Envisat provided infrared limb emission spectra, which were used to infer global distributions of CFC-11, CFC-12, and HCFC-22. Spectra were analysed using constrained non-linear least-squares fitting. Changes with respect to earlier data versions refer to the use of version 8 spectra, the altitude range where the background continuum is considered, details of the regularization and microwindow selection, and the occasional joint fitting of interfering species, the use of new spectroscopic data, the joint fit of a tangent-height-dependent spectral offset, and the use of 2D temperature fields. In the lower stratosphere the error budget is dominated by uncertainties in spectroscopic data, while above this measurement noise is the leading error source. The vertical resolution of CFC-11 and CFC-12 is 2–3 km near the tropopause, about 4 km at 30 km altitude, and 6–10 km at 50 km. The vertical resolution of HCFC-22 is somewhat coarser, 3–4 km at the tropopause and 10–12 km at 35 km altitude. In the altitude range of interest, the horizontal resolution is typically limited by the horizontal sampling of the measurements, not by the smearing of the retrievals. Horizontal information displacement does not exceed 150 km, which can become an issue only for comparisons with model simulations with high horizontal resolution or localized in situ observations. Along with the regular data product, an alternative representation of the data on a coarser vertical grid is offered. These data can be used without consideration of the averaging kernels. The new data version provides improvement with respect to reduction of biases and improved consistency between the full- and reduced-resolution mission period of MIPAS.
- Article
(25907 KB) - Full-text XML
-
Supplement
(7157 KB) - BibTeX
- EndNote


We would like to dedicate this paper to Thomas von Clarmann who passed away far too early, only a few weeks before this paper could be finally published. Thomas was our valued colleague, group leader and friend over many years. His outstanding commitment pushed forward the retrieval of remote sensing data and their characterisation, and the analysis and scientific use of MIPAS data. We owe him more than 20 years of thorough data analysis and exciting atmospheric science. We will miss him very much.
Chlorofluorocarbons, particularly CFC-11 (CCl3F) and CFC-12 (CCl2F2), are anthropogenic gases that were used as propellants and refrigerants. These gases got public attention due to the capability of their decomposition products to destroy stratospheric ozone (Molina and Rowland, 1974). These chlorofluorocarbons ascend into the stratosphere where they are decomposed by photolysis and reaction with O(1D). After a reaction chain they finally produce atomic chlorine, which is, after temporary deactivation in reservoir species, responsible for polar spring ozone destruction (for details, see Brasseur and Solomon, 2005 and von Clarmann, 2013). A ban of CFC-11 and CFC-12 laid down by the Montreal protocol (see, e.g. United Nations Environment Programme, 2012) led to the decrease in stratospheric chlorine and the protection of the ozone layer. An idea as to what the failure of the Montreal Protocol would have meant was developed by the use of a counterfactual conditional scenario and published under the title “The World Avoided by the Montreal Protocol” (Morgenstern et al., 2008). However, the decrease in atmospheric CFC-11 slowed down after 2010 (Montzka et al., 2018), which is chiefly attributed to emission from northeastern China (Rigby et al., 2019). Lickley et al. (2022) suggest that old equipment is still a source of CFC emissions. Park et al. (2021), however, found that the recent CFC-11 production in eastern China subsequently declined in 2017–2018 and that a substantial delay in ozone layer recovery could obviously be avoided.
HCFC-22 (CHClF2) is another chlorine-containing propellant and refrigerant. While it is decomposed in the stratosphere by photolysis, O(1D), Cl−, and OH, it is more stable than CFC-11 and CFC-12 and contributed less than the latter species to the destruction of ozone. It is for this reason that its phasing out was only settled in the 2007 amendment to the Montreal protocol. Further relevant information on these ozone-destructing substances is summarized in Engel et al. (2018).
Besides their role as source gases of stratospheric chlorine, it has long been recognized that these species act, with their infrared absorption bands in the atmospheric window, as greenhouse gases (Ramanathan, 1975).
Due to their different but long lifetimes, CFCs and HCFCs can be used as tracers of the stratospheric circulation. For example, Toon et al. (1992) used CFC measurements to infer subsidence of polar stratospheric air, and von Clarmann et al. (2021) inferred patterns of meridional stratospheric circulations from remote measurements of stable trace gases, among them CFC-11, CFC-12, and HCFC-22. The information on the stratospheric mean meridional circulation contributed by each of these species was analysed by von Clarmann and Grabowski (2021). It goes without saying this type of work benefits from denser and more accurate measurements of these species.
Atmospheric measurements of CFC-11 and CFC-12 volume mixing ratios (VMRs) were first reported by Lovelock (1971). Rasmussen et al. (1980) reported the first HCFC-22 measurements in the atmosphere. Measurement techniques for stratospheric CFC and HCFC abundances include air sampling (e.g. Lueb et al., 1975; Heidt et al., 1975; Schmidt et al., 1991; Engel et al., 1998; O'Doherty et al., 2004; Yokouchi et al., 2006; Montzka et al., 2009), in situ measurements (Robinson et al., 1977; Bujok et al., 2001; Romashkin et al., 2001, e.g.), and infrared spectroscopy. Nassar et al. (2006) provided a global inventory of stratospheric chlorine in 2004. Infrared spectroscopic solar absorption measurements were carried out from the ground (e.g. Rinsland et al., 1988, 1989) or using stratospheric balloons (Murcray et al., 1975; Williams et al., 1976; Goldman et al., 1981, e.g.). Routine ground-based monitoring of these species is performed by the Network for the Detection of Atmospheric Composition Change (NDACC; De Mazière et al., 2018). Local long-term trends are reported, e.g. by Prignon et al. (2019) and Rinsland et al. (2005). Solar occultation spectrometry from space-borne platforms allowed for a much better data coverage (e.g. Zander et al., 1987; Khosrawi et al., 2004). More recently, the Fourier Transform Spectrometer of the Atmospheric Chemistry Experiment (ACE-FTS) provided space-borne measurements of CFCs and HCFCs (Mahieu et al., 2008; Brown et al., 2011; Park et al., 2014). At the time of writing, ACE-FTS is still operational.
Limb emission measurements offer the advantage of providing measurements independent of daylight and thus provide, when employed on a space-borne platform, better temporal and spatial coverage. After balloon-borne measurements of CFCs and HCFCs in limb emission (Kunde et al., 1987; Brasunas et al., 1986; von Clarmann et al., 1995), limb emission spectrometers were operated from space-borne platforms to measure these gases. The list of instruments includes the Cryogenic Limb Array Etalon Spectrometer (CLAES; Roche et al., 1993), the Cryogenic Infrared Radiance Instrumentation for Shuttle (CIRRIS 1A; Bingham et al., 1997), the Cryogenic Infrared Spectrometers and Telescopes (CRISTA; Spang et al., 1997), and the High Resolution Dynamics Limb Sounder (HIRDLS; Khosravi et al., 2009). The Michelson Interferometer for Passive Atmospheric Sounding (MIPAS; Fischer et al., 2008) on Envisat provided infrared limb emission spectra, which allowed the retrieval of global CFC-11, CFC-12, and HCFC-22 distributions (Glatthor et al., 2006; Moore and Remedios, 2008; Hoffmann et al., 2008; Kellmann et al., 2012; Raspollini et al., 2013; Chirkov et al., 2016; Eckert et al., 2016; Dinelli et al., 2021; Raspollini et al., 2022). Some of these data products found their way into the climatologies compiled by the SPARC Data Initiative (SDI; Tegtmeier et al., 2016).
In this paper we present recent updates of the retrieval of these species, along with an error analysis that is compliant with the most recent recommendations by the SPARC activity “Towards Unified Error Reporting” (TUNER; von Clarmann et al., 2020). After summarizing the characteristics of the MIPAS instrument that are relevant for the retrieval of the three species (Sect. 2), we discuss each species separately. We start with CFC-12 (Sect. 3), proceed with CFC-11 (Sect. 4) and finally turn towards HCFC-22 (Sect. 5). A critical discussion of the achievements with respect to preceding data versions concludes this paper (Sect. 6).
As one of the atmospheric chemistry instruments of the ENVISAT research satellite, the limb-viewing Fourier transform spectrometer MIPAS (Michelson Interferometer for Passive Atmospheric Sounding; Fischer et al., 2008) recorded infrared emission spectra in the region from 4.1 to 14.7 µm (685–2410 cm−1). During the first phase of the mission, from June 2002 to March 2004, spectra were measured at a full spectral resolution (FR) of 0.035 cm−1 (unapodized). After an interruption due to problems with the interferometer slide in 2004, MIPAS resumed operation in January 2005 at a reduced spectral resolution (RR) of 0.0625 cm−1. In April 2012, contact to ENVISAT was lost, which caused the termination of the mission. Limb emission spectroscopy in combination with Envisat's polar sun-synchronous orbit enabled the measurement of global trace gas distributions during night and day. For the retrieval of mixing ratios of CFC-11, CFC-12, and HCFC-22, spectral signatures in the MIPAS A band (685–980 cm−1) and AB band (1010–1180 cm−1) are used.
MIPAS measurement modes include the Nominal mode (NOM, with tangent altitudes from 6 to about 70 km, depending on latitude), the Upper Troposphere–Lower Stratosphere mode (UTLS-1, 5.5–45 km), the Middle Atmosphere mode (MA, 18–102 km), the Upper Atmosphere mode (UA, 42–172 km), and the Noctilucent Cloud mode (NLC, 39–102 km) (Oelhaf, 2008), with the MA, UA, NLC, and UTLS-1 observation modes available only for the RR phase of the mission. For CFC-12, CFC-11, and HCFC-22, only the FR and RR NOM, UTLS-1, and MA modes are relevant because the part of the atmosphere seen by the UA and NLC modes contains no appreciable amounts of these gases. The along-orbit distance of two adjacent profiles for the FR/NOM, RR/NOM, UTLS, and MA measurement modes was 510, 410, 290, and 430 km, respectively. Data presented in this paper are based on ESA data version 8.03 level-1b (L1) calibrated and geolocated spectra. Details of L1 characteristics are reported by Kleinert et al. (2018) and by Kiefer et al. (2021). The data versions presented in this paper are V8H_<gas>_61 for FR NOM, V8R_<gas>_261 for RR NOM, V8R_<gas>_161 for UTLS-1, and V8R_<gas>_561 for MA, where <gas> stands for F-11, F-12, or F-22.
Previous data versions of CFC-12 from the IMK/IAA processor were published by Glatthor et al. (2006) and Kellmann et al. (2012). The latter, data version 5, underwent extensive validation (Eckert et al., 2016). These authors reported good agreement between MIPAS profiles and those of the comparison instruments with differences exceeding ±10 % only in very few cases below 25 km altitude. Above this altitude, comparisons to the various other data sets seemed to agree on a rapidly increasing low bias that reaches, e.g. −30 % at 32 km, for comparison with ACE-FTS v3.5. Zhou et al. (2016) compared MIPAS CFC-12 and ground-based Fourier transform infrared (FTIR) spectroscopic measurements at Réunion Island. They found a low bias of −2.9 % and a standard deviation of 4.6 % (in terms of (MIPAS − FTIR)FTIR × 100 %) between partial columns from MIPAS CFC-12 and the ground-based FTIR measurements. The retrieval setup by Kellmann et al. (2012) forms the basis of the V8 CFC-11 and CFC-12 retrievals, upon which several refinements were built.
3.1 The retrieval of CFC-12
The retrieval of trace gases from MIPAS relies on constrained least squares fitting (von Clarmann et al., 2003, 2009b). The unknowns of the retrieval are adjusted in a way that both the measured spectra in the pre-selected analysis windows agree best with those calculated with the Karlsruhe Optimized and Precise Radiative Transfer Algorithm (KOPRA; Stiller, 2000; Stiller et al., 2002) and a smoothness constraint applied to the vertical profiles is satisfied. Technical details related to this approach are reported, e.g. in Kiefer et al. (2021, 2023).
In our sequential retrieval approach, the retrieval of CFC-12 follows the retrieval of temperature and the line-of-sight pointing information (Kiefer et al., 2021), ozone (Kiefer et al., 2023), water vapour (Kiefer et al., 2024), HNO3 (Stiller et al., 2024), CH4 and N2O (Glatthor et al., 2023), NO2 (Funke et al., 2024), and ClONO2 (Stiller et al., 2024), implying that for these species results from version 8 processing were already available and could be used where relevant. The pressure at the tangent altitudes and the retrieval grid points is constructed with one (z,p,T) reference point taken from ERA-I and by making use of the hydrostatic equilibrium (Kiefer et al., 2021).
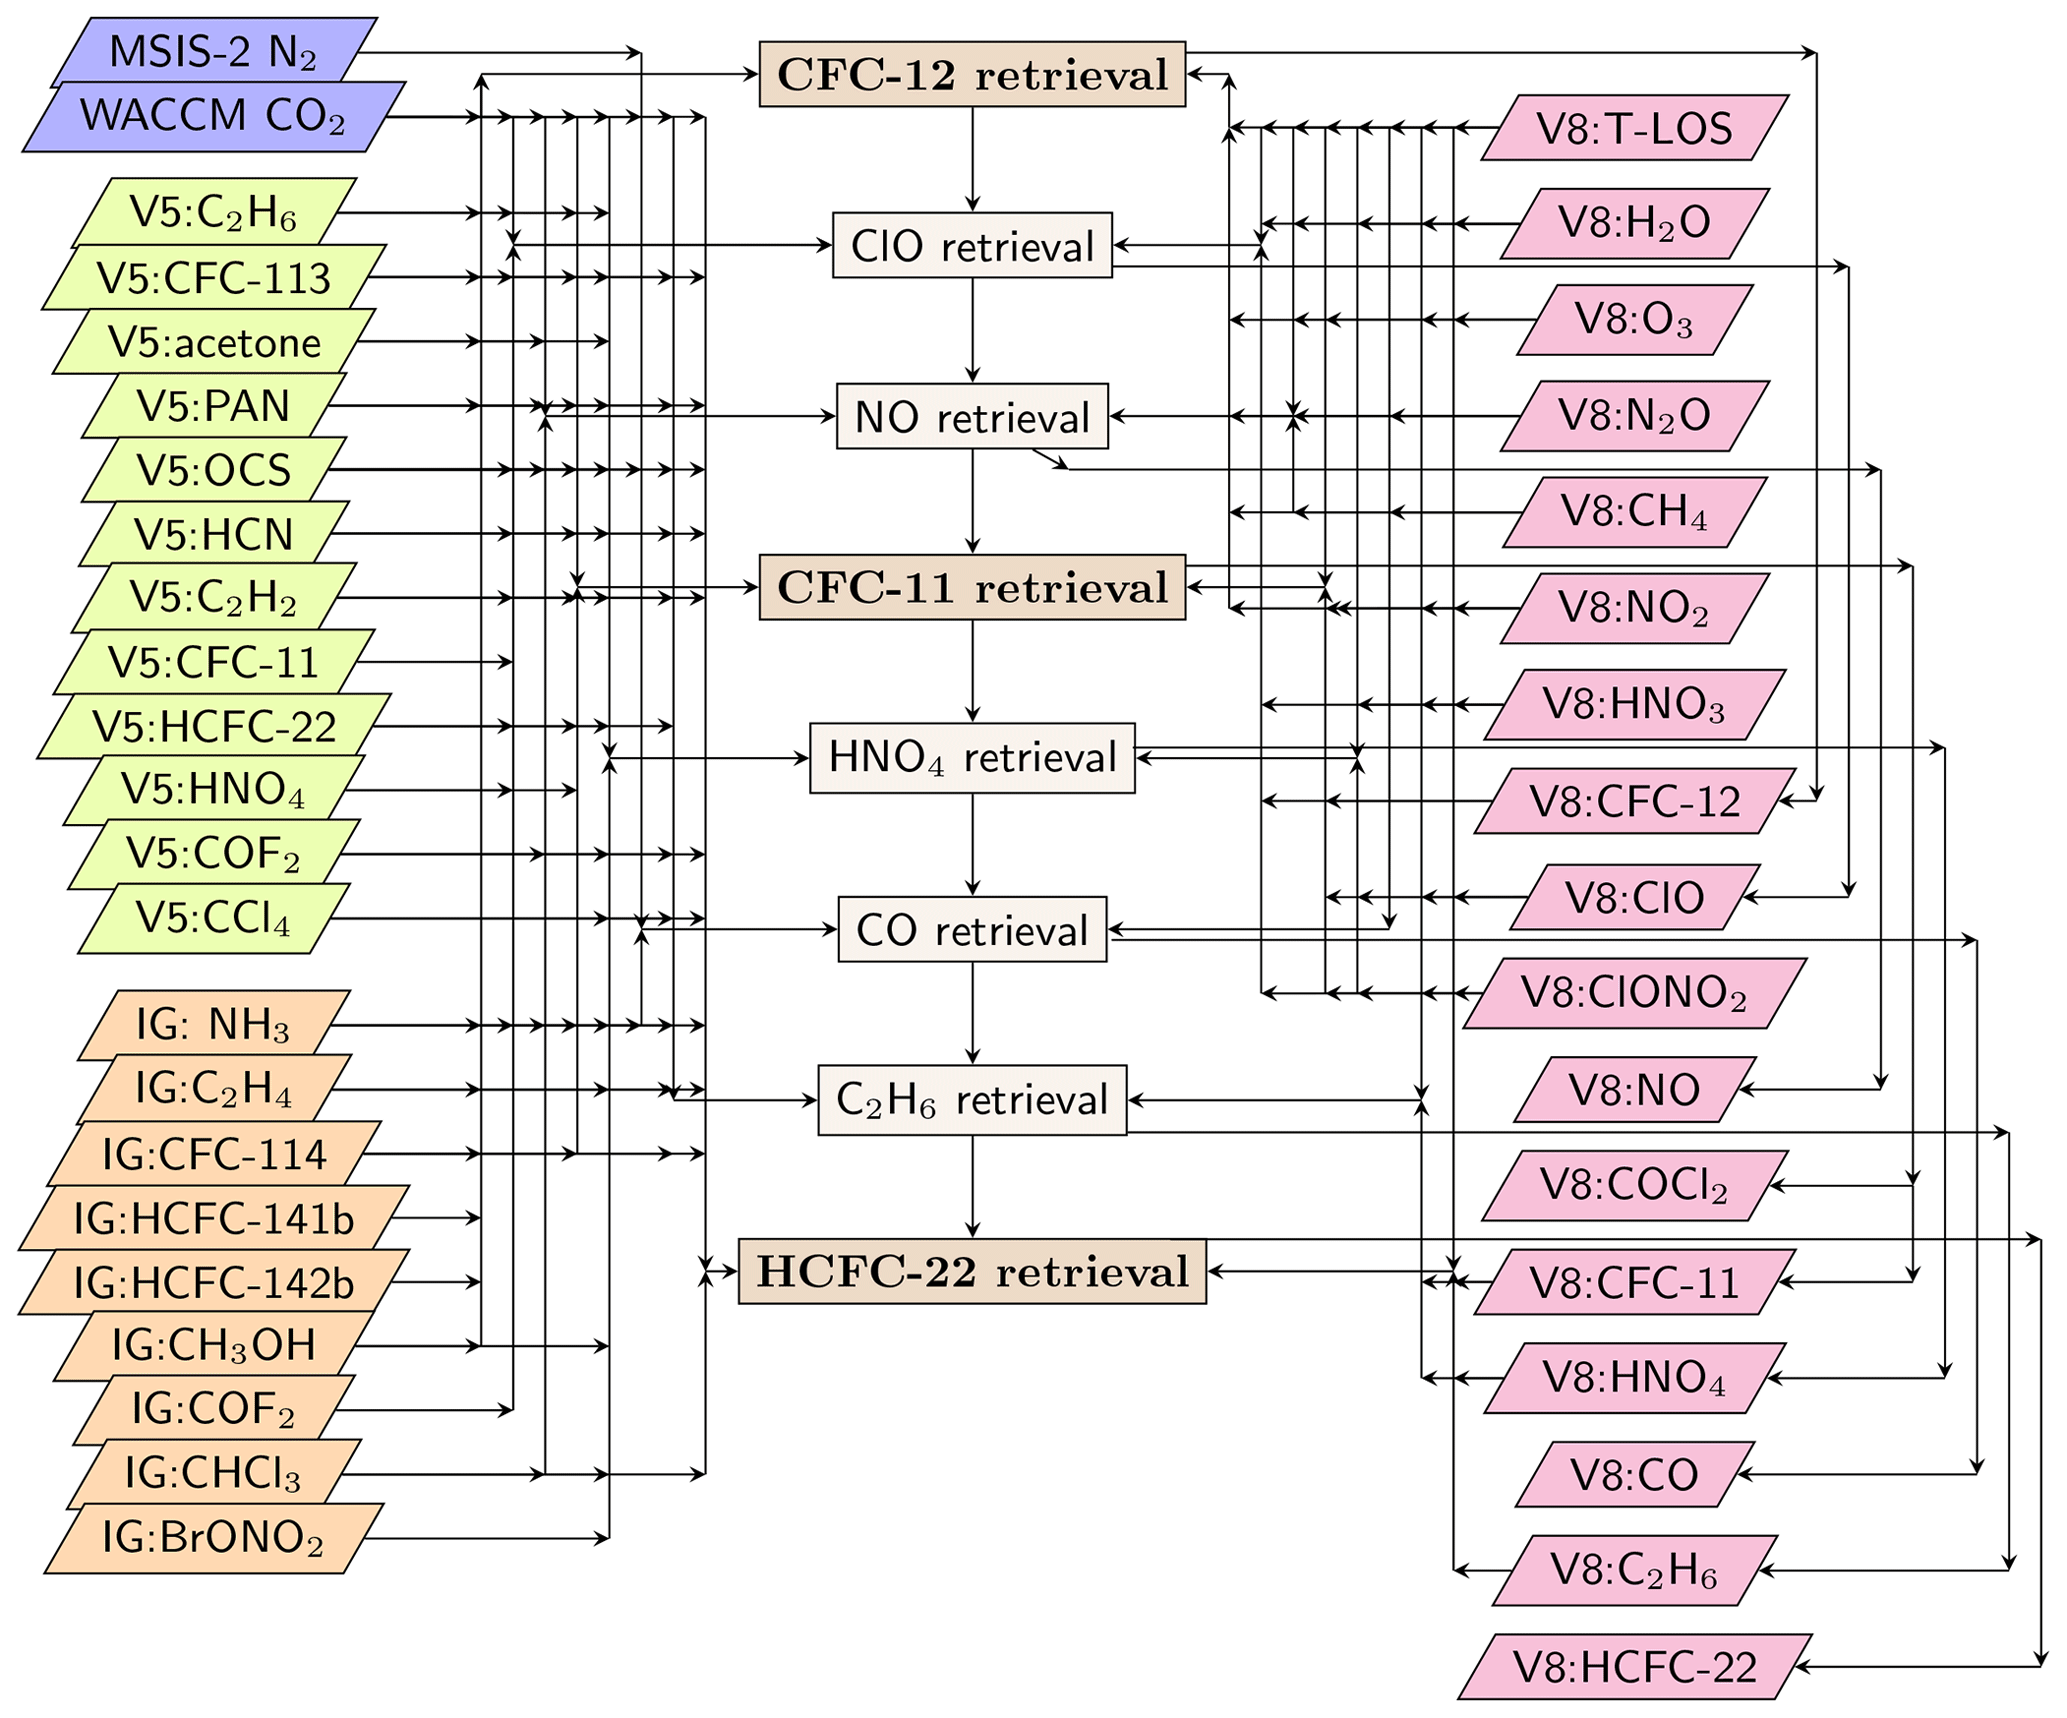
Figure 1Processing sequence and related data flow of FR and RR nominal measurement mode retrievals. N2 mixing ratios are taken from the MSIS2 model (Emmert et al., 2020), while CO2 mixing ratios are generated using WACCM model output (Marsh, 2011; Marsh et al., 2013; García et al., 2017) as described by Kiefer et al. (2021). Retrieving NO concentrations prior to CFC-11 and CO concentrations prior to HCFC-22 is a merely pragmatic choice, since these are not needed as input of the CFC-11 and HCFC-22 retrieval.
For H2O and HNO3, the mixing ratios were jointly adjusted with those of CFC-12, with their pre-retrieved mixing ratios used as a priori. The rationale behind this approach is to minimize any impact of spectroscopic inconsistencies between the bands where these species were originally retrieved for version 8, and their signal in the CFC-12 fitting window. For the other pre-retrieved gases no systematic residuals were observed, and the V8 retrieved mixing ratio profiles were used. For PAN, which was jointly fitted with CFC-12 in older data versions, the joint retrieval was no longer considered necessary (Fig. 1). For reasons discussed in von Clarmann et al. (2003), in addition to the gas concentrations a background continuum and an additive radiance offset were also treated as unknowns of the retrieval. As opposed to the preceding version where the background continuum was considered at altitudes up to 32 km, we now retrieve the background continuum up to 58 km altitude. Formerly it was believed that it was sufficient to cover the Junge aerosol layer (Junge and Manson, 1961), but the work of Neely et al. (2011) made us speculate that meteoric dust might cause an additional aerosol signal in the MIPAS spectra of the upper stratosphere. Indeed, the extension of the background continuum to higher altitudes led in some cases to more plausible vertical profiles of trace gases. In particular, wiggles near the altitude of the former continuum cutoff were removed in some cases.
The revised offset retrieval scheme described in Kiefer et al. (2021) was used also for CFC-12. Information on the horizontal temperature structure (2D temperature field), as available from the temperature and tangent altitude retrieval results (see Kiefer et al., 2021), is also used for the CFC-12 retrievals. While former data versions used only the spectral region from 915.0–925.0 cm−1 in the ν6 band, now an additional window covering the 1150.0 to 1165.0 cm−1 in the CFC-12 ν8 band centred at 1161 cm−1 is used above 31.5 km. For species retrieved earlier in the sequential retrieval, version 8 mixing ratio distributions were used. This refers to O3, CH4, N2O, and NO2. Some of the other spectrally interfering species, namely C2H6, CFC-113, acetone, and PAN, are retrieved after CFC-12. Thus, results from our version 5 processing were used for these species in the nominal mode retrievals. While believed to be slightly inferior to version 8 data, they still offer the possibility to use profiles of the actual time and geolocation instead of climatological mean profiles. Only for CO2, NH3, C2H4, CFC-114, HCFC-141b, HCFC-142b, and CH3OH, also interfering with the spectral signature of CFC-12, no previous MIPAS results were available, thus profiles from our climatological database (Kiefer et al., 2002, and updates thereof) had to be used. For MA retrievals, climatologies built from V5 NOM retrievals were used for C2H6, CFC-113, acetone, and PAN, since MA observations of these gases had not been processed for data version 5.
While earlier CFC-12 data versions relied fully on absorption cross-sections by Varanasi (1992a), now a combination of frequency-corrected Varanasi data and 15 additional data sets by Harrison (2015) are used. The latter cover pressure and temperature combinations not covered by the Varanasi cross-sections. The new cross-sections allow a four-point interpolation in pressure and temperature for almost all atmospheric conditions encountered by MIPAS measurements, particularly in the cold tropopause region.
CFC-12 is retrieved on a vertical grid as follows: surface (0 km); 4 to 60 km with a 1 km grid width; and additional levels at 62, 64, 66, 68, 70, 75, 80, 90, 100, and 120 km. In major parts of the altitude range, this grid width is finer than the distance between adjacent tangent altitudes. This implies that the involved inverse problem tends to be ill-posed and has to be stabilized by regularization. We use a regularization as formalized by Tikhonov (1963), Twomey (1963), and Phillips (1962), with a squared finite-difference matrix as regularization matrix that smooths the retrieval. Only at 100 and 120 km altitude does the regularization matrix block referring to CFC-12 have a diagonal term. This diagonal term shall prevent the retrieved profiles from escaping towards unphysical values. The a priori profile is chosen as constant zero over the full altitude range in order not to imprint any altitude structure on the retrieved profile. Since the regularization chosen employs a smoothing constraint only, results are not pushed towards zero, except for the uppermost altitudes where there is a diagonal term in the regularization matrix. The approach to control the altitude dependence of the smoothing constraint as described by Kiefer et al. (2021, their Eq. 3) supersedes the old approach by Steck and von Clarmann (2001) which was previously used. The effect of the regularization is reflected by the averaging kernels (Sect. 3.3).
The retrieval of CFC-12 has been performed along the description above for MIPAS data from the NOM(FR), NOM(RR), UTLS(RR), and MA(RR) observation modes level 1b data.
3.2 The CFC-12 error budget
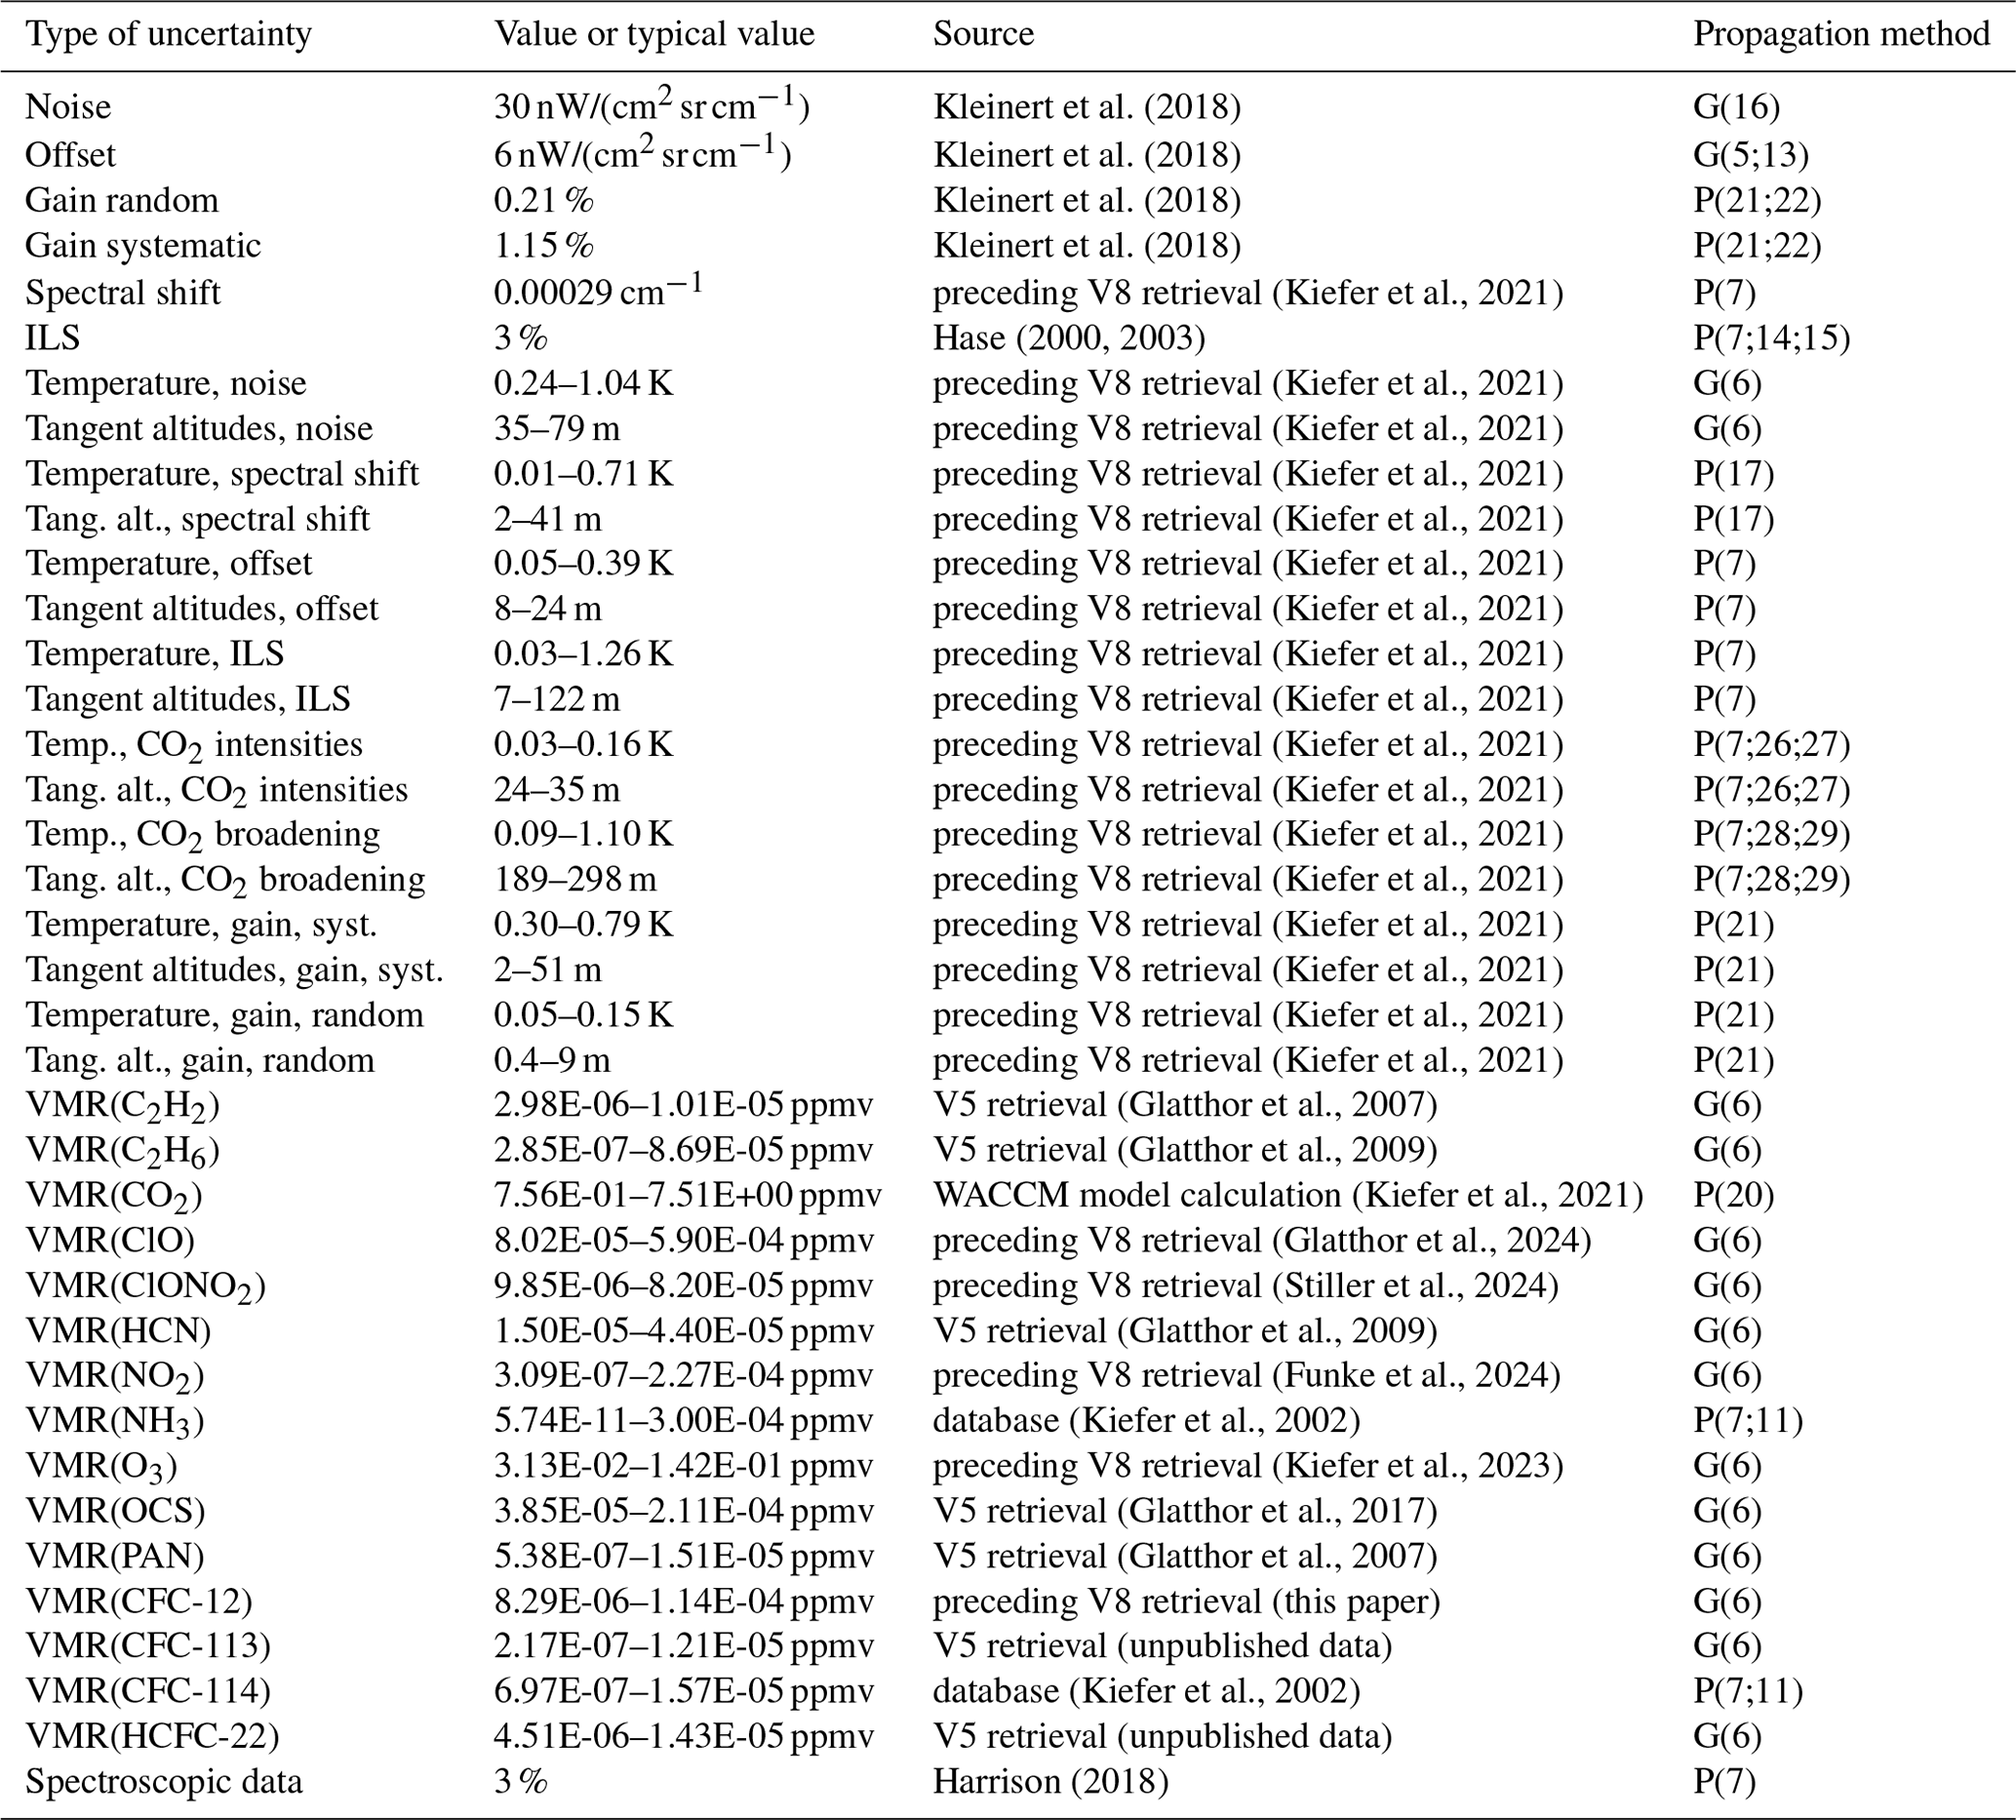
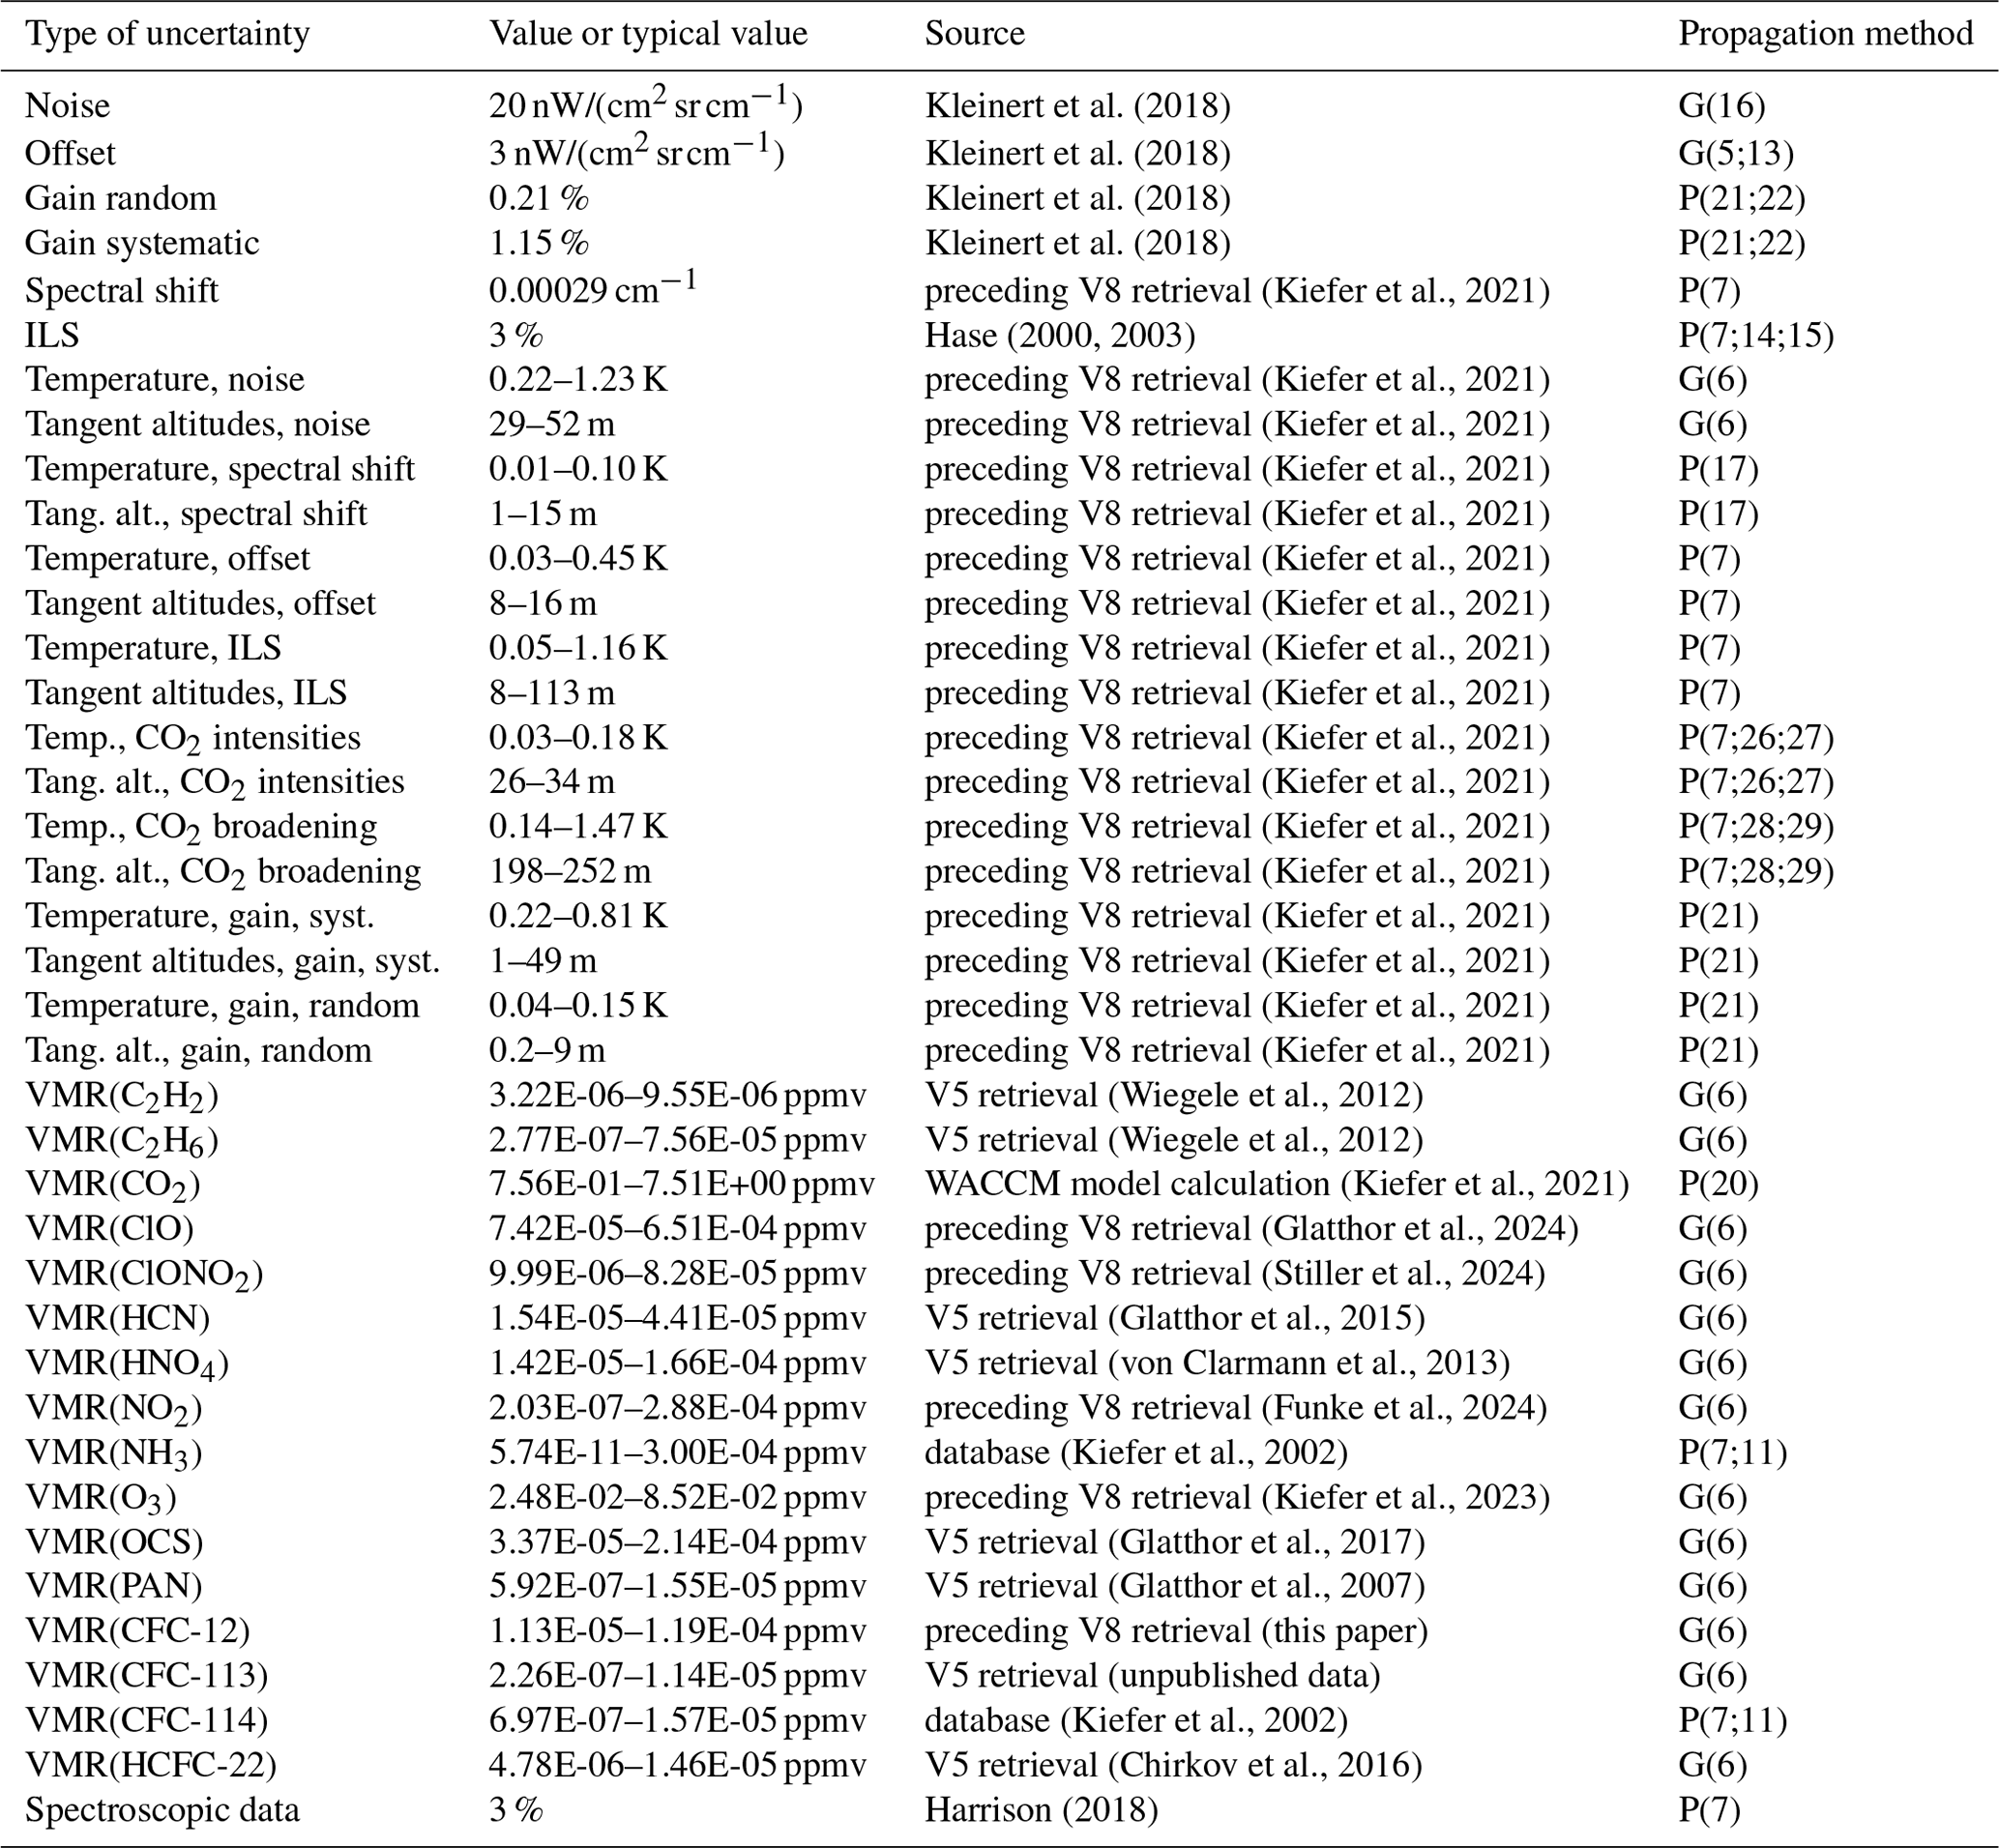
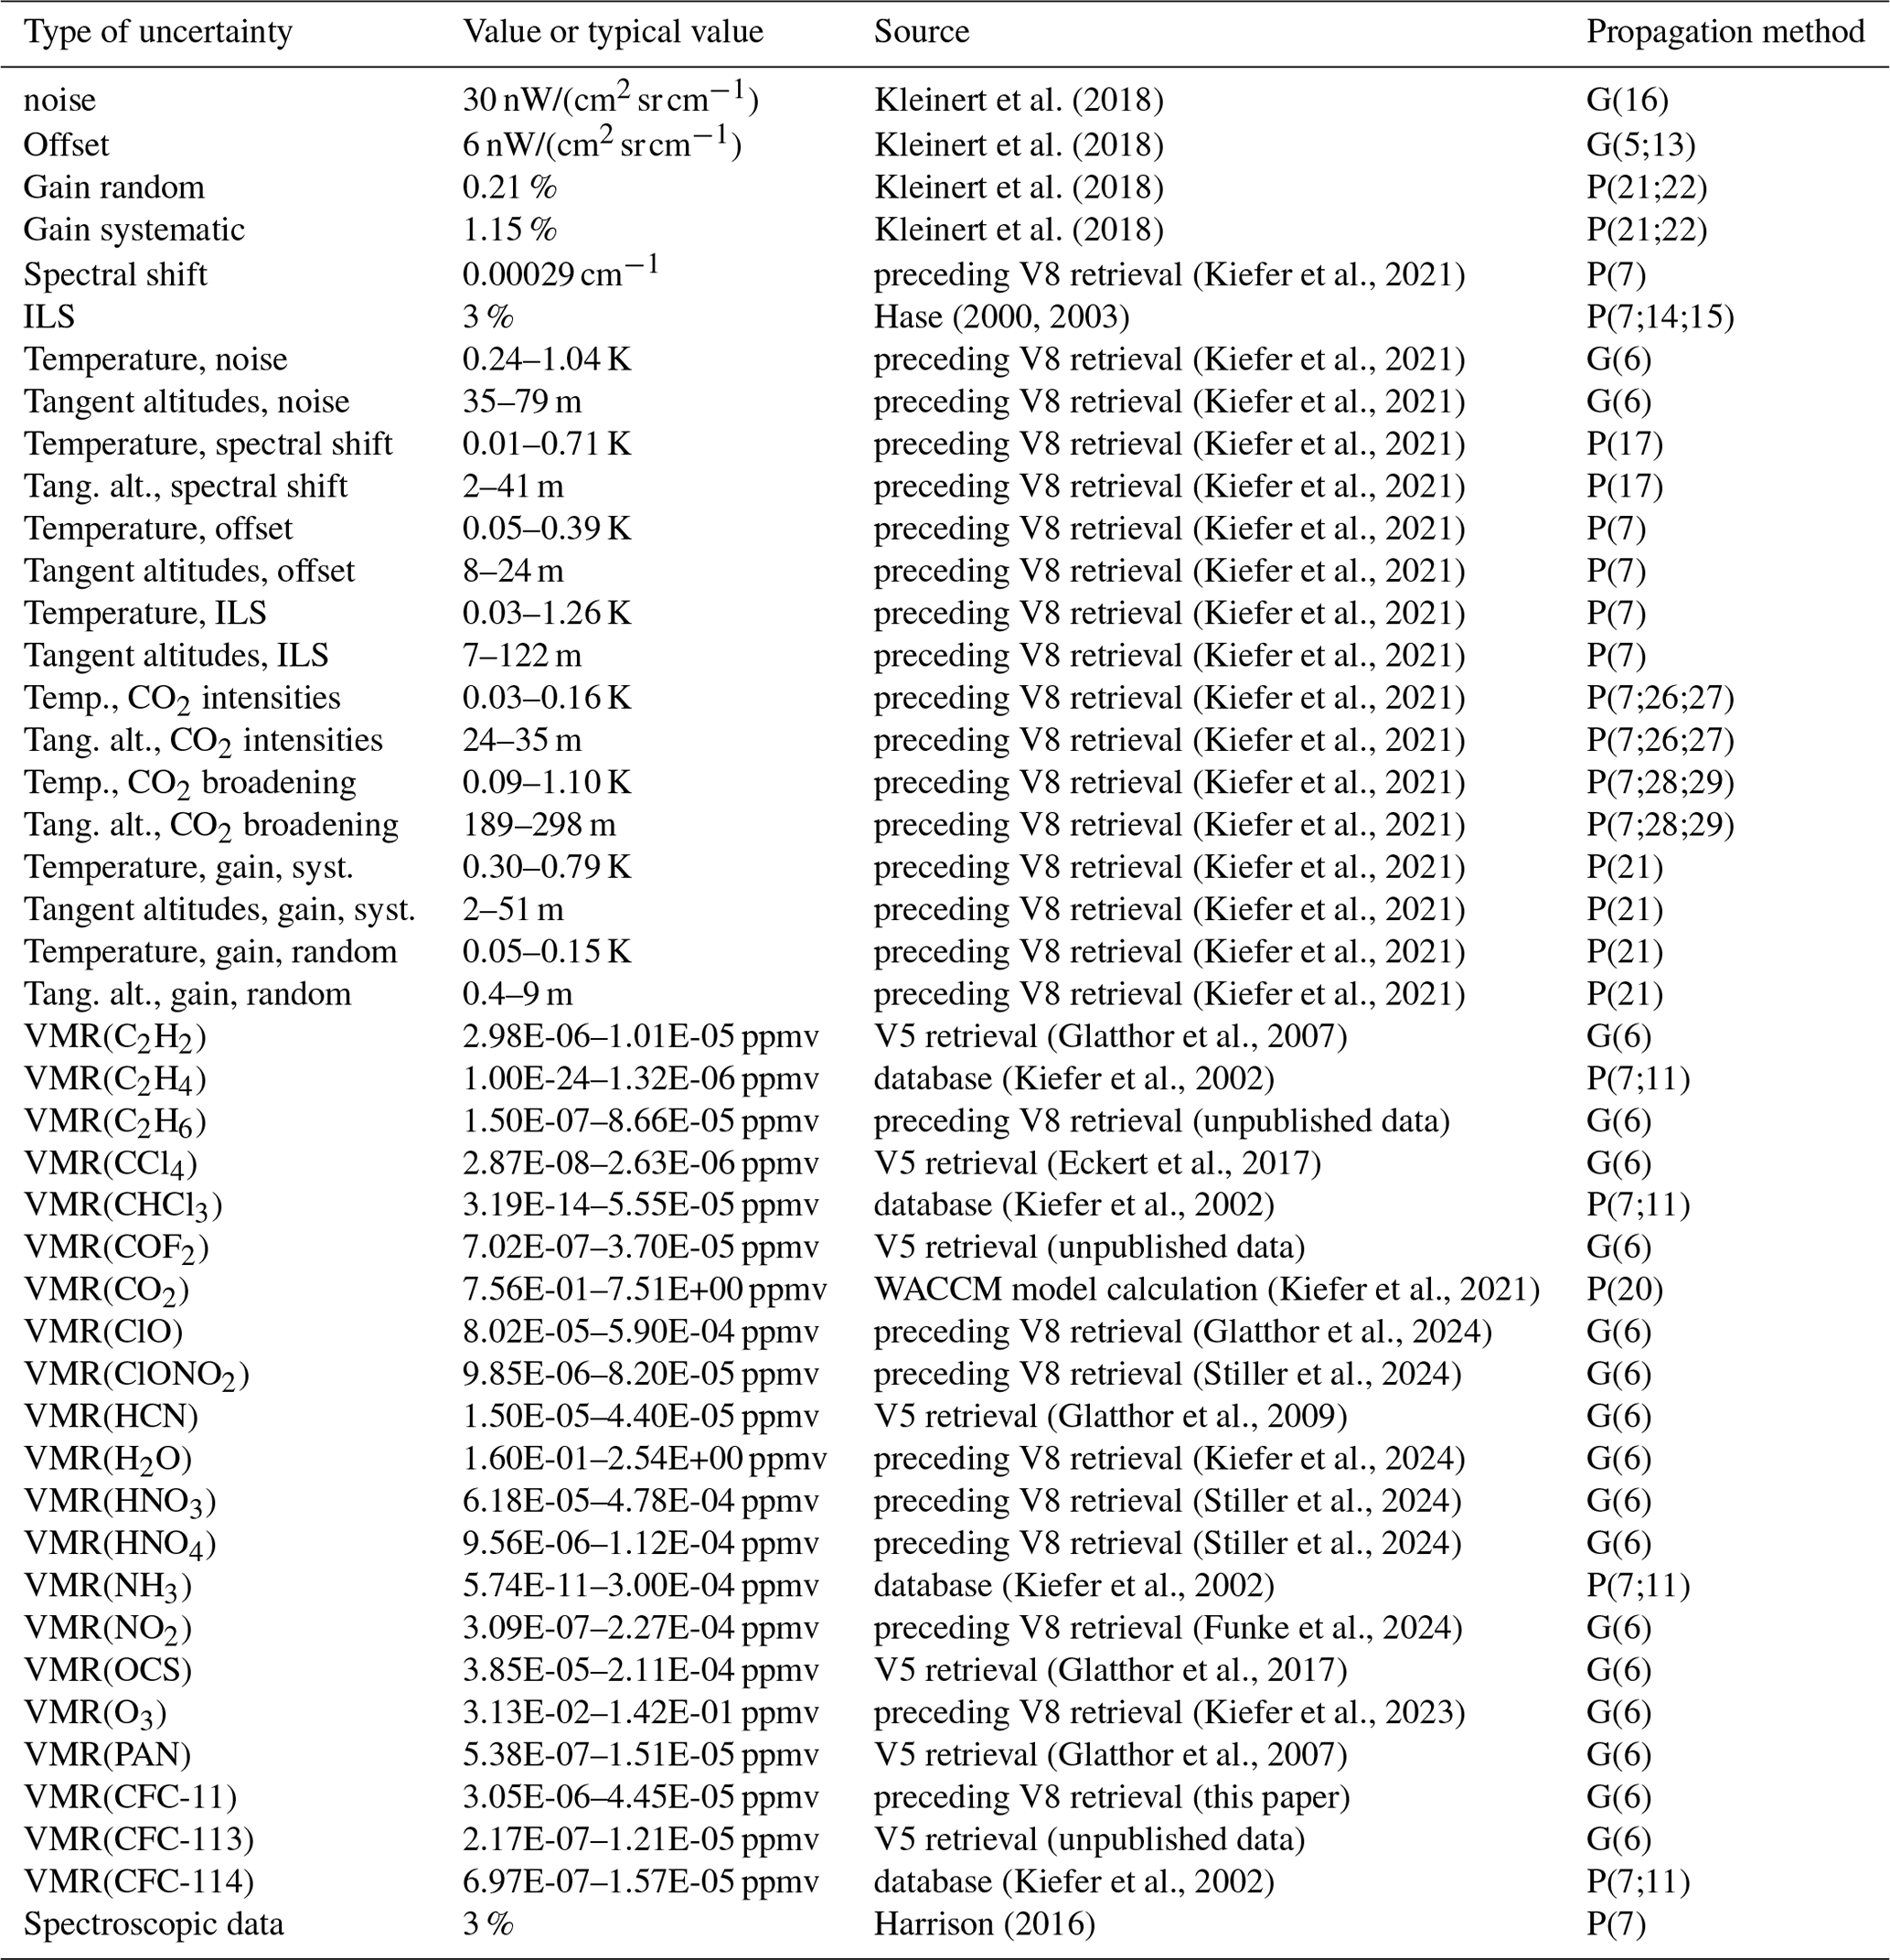
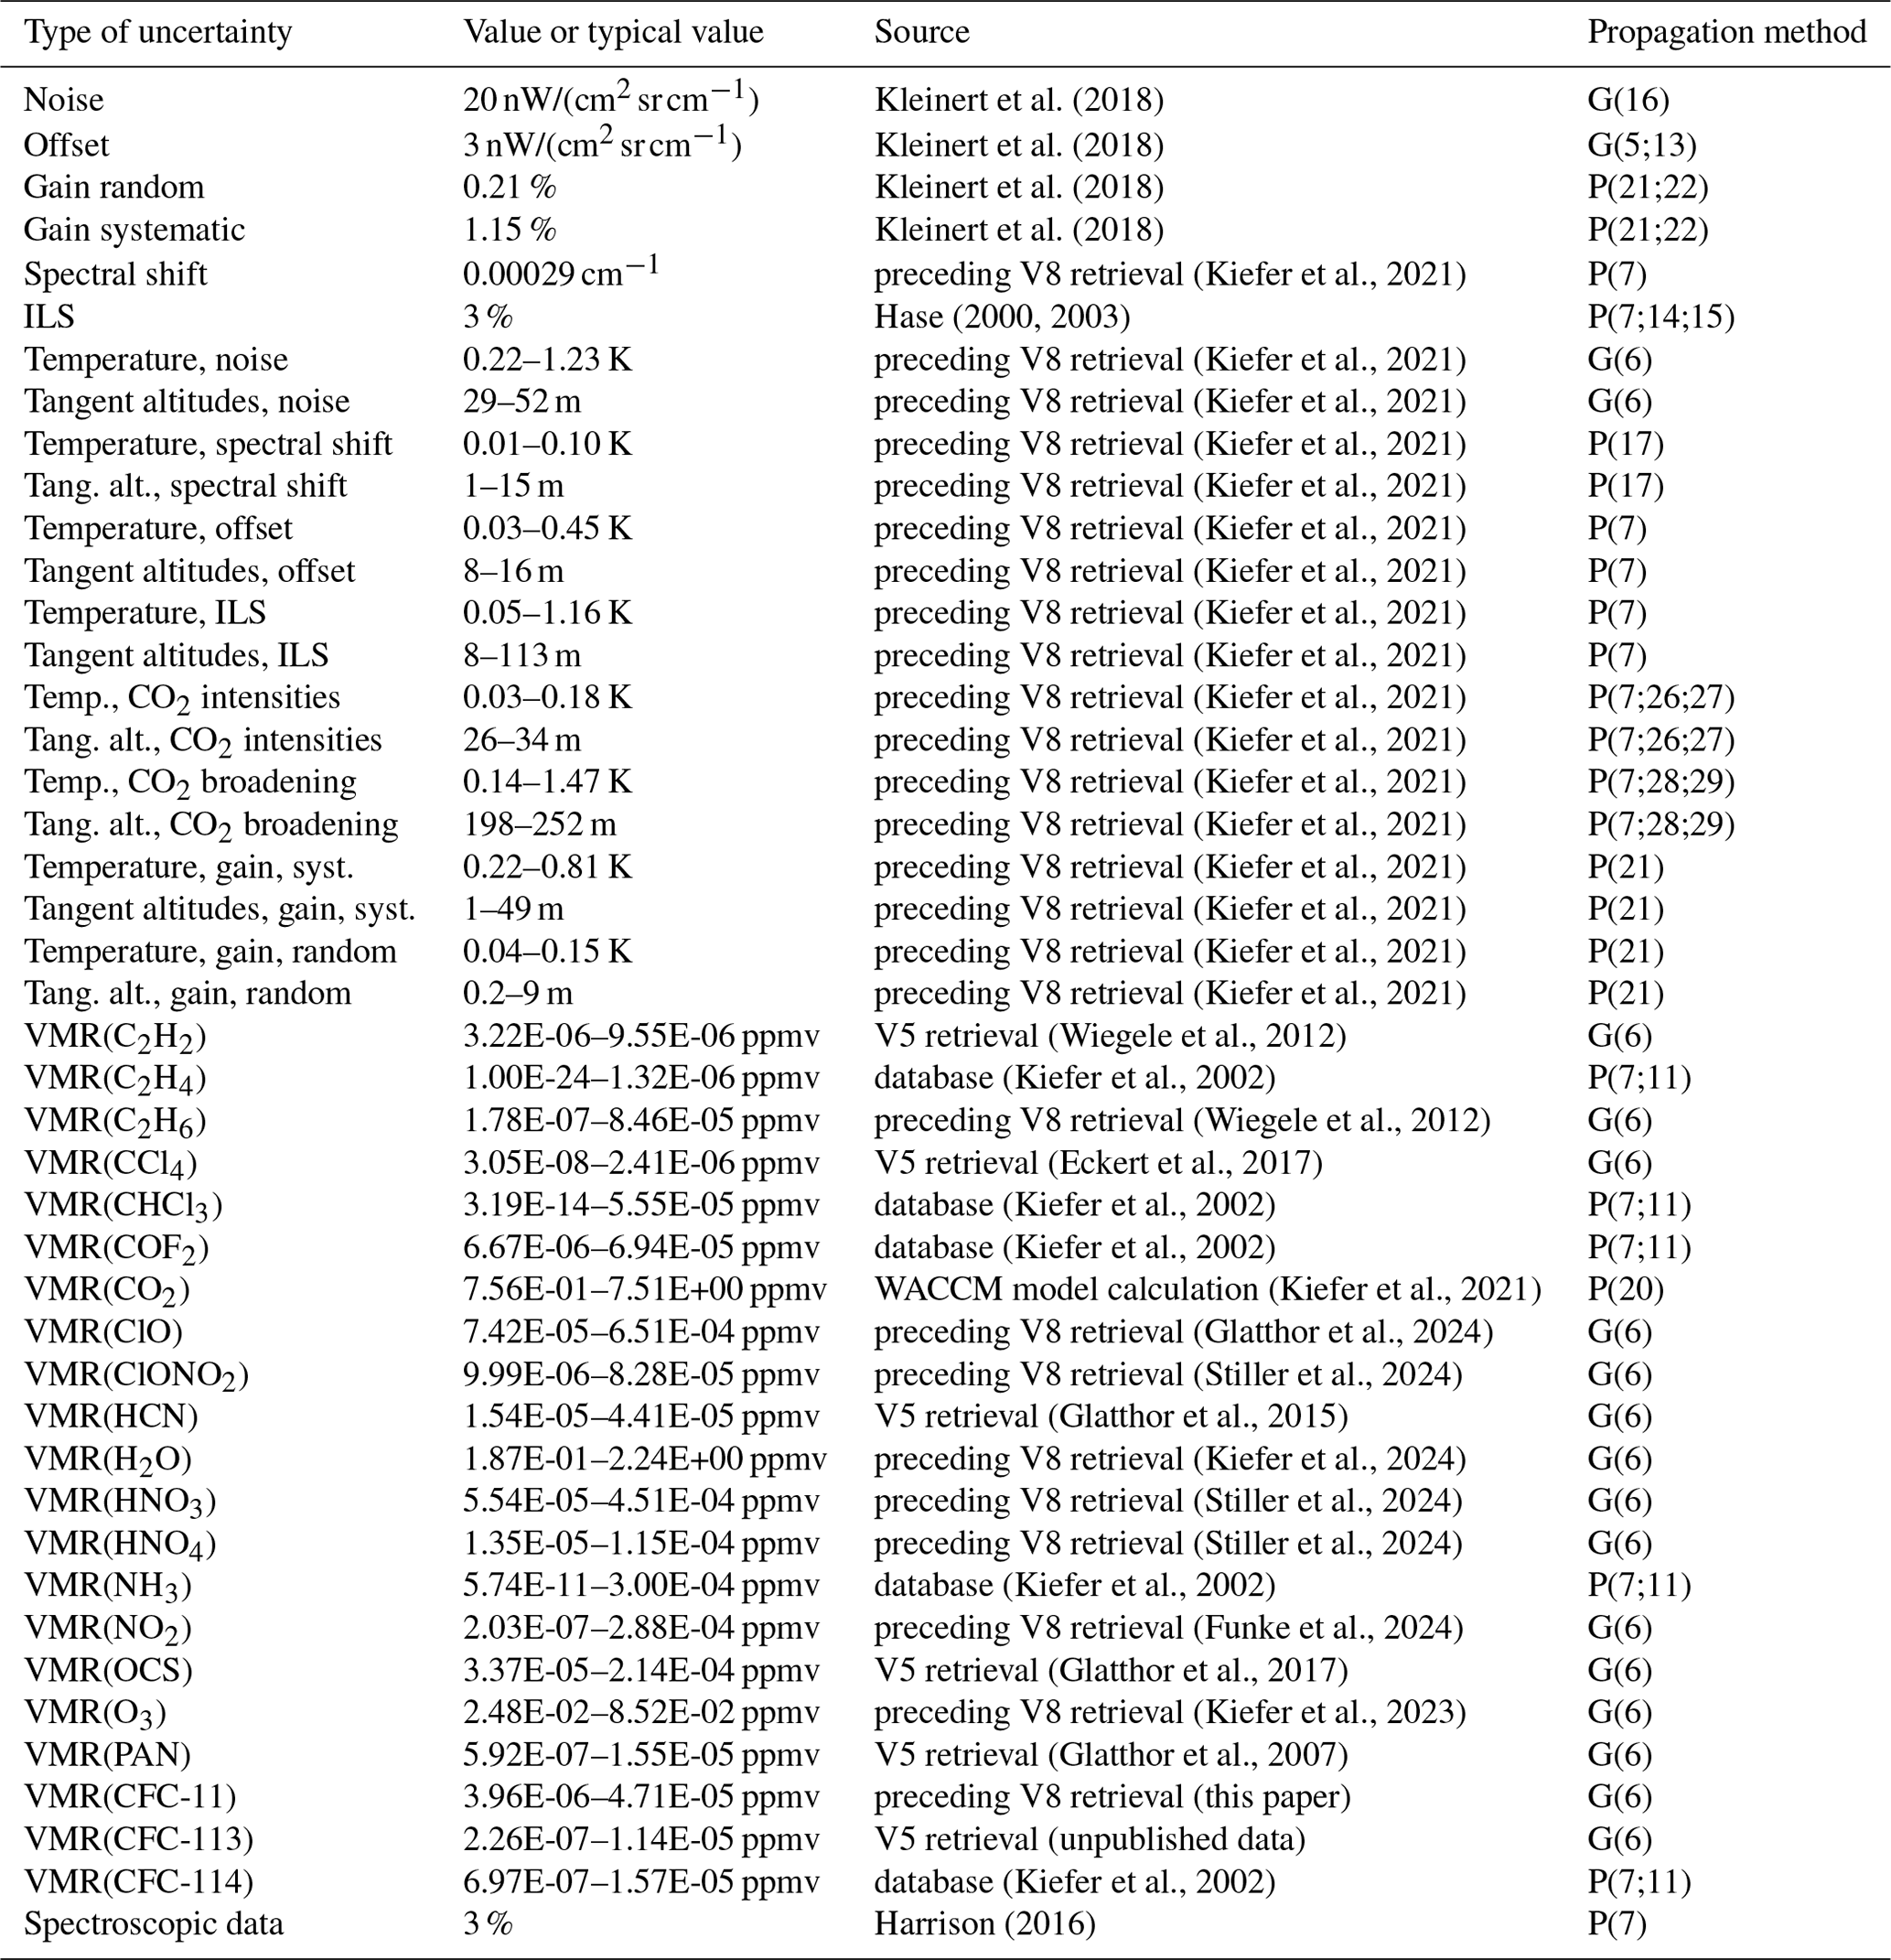
The error estimation follows the general approach as described in detail by von Clarmann et al. (2022). The relevant error sources for northern mid-latitude summer daytime conditions are provided as examples and summarized in Tables 1–3 for FR, RR, and MA measurements, respectively.
Kleinert et al. (2018)Kleinert et al. (2018)Kleinert et al. (2018)Kleinert et al. (2018)Kleinert et al. (2018)Kleinert et al. (2018)Kleinert et al. (2018)Kleinert et al. (2018)(Kiefer et al., 2021)Hase (2000, 2003)(Kiefer et al., 2021)(Kiefer et al., 2021)(Kiefer et al., 2021)(Kiefer et al., 2021)(Kiefer et al., 2021)(Kiefer et al., 2021)(Kiefer et al., 2021)(Kiefer et al., 2021)(Kiefer et al., 2021)(Kiefer et al., 2021)(Kiefer et al., 2021)(Kiefer et al., 2021)(Kiefer et al., 2021)(Kiefer et al., 2021)(Kiefer et al., 2021)(Kiefer et al., 2021)(Kiefer et al., 2002)(Glatthor et al., 2009)(Kiefer et al., 2002)(Glatthor et al., 2023)(Kiefer et al., 2021)(Kiefer et al., 2002)(Glatthor et al., 2023)(Funke et al., 2024)(Kiefer et al., 2023)(Glatthor et al., 2007)(Kiefer et al., 2002)(Kiefer et al., 2002)(Kiefer et al., 2002)Harrison (2015)Kellmann et al. (2012)Varanasi and Nemtchinov (1994)Table 1Assumed uncertainties for northern mid-latitude summer daytime conditions affecting the retrieval of CFC-12 (FR).
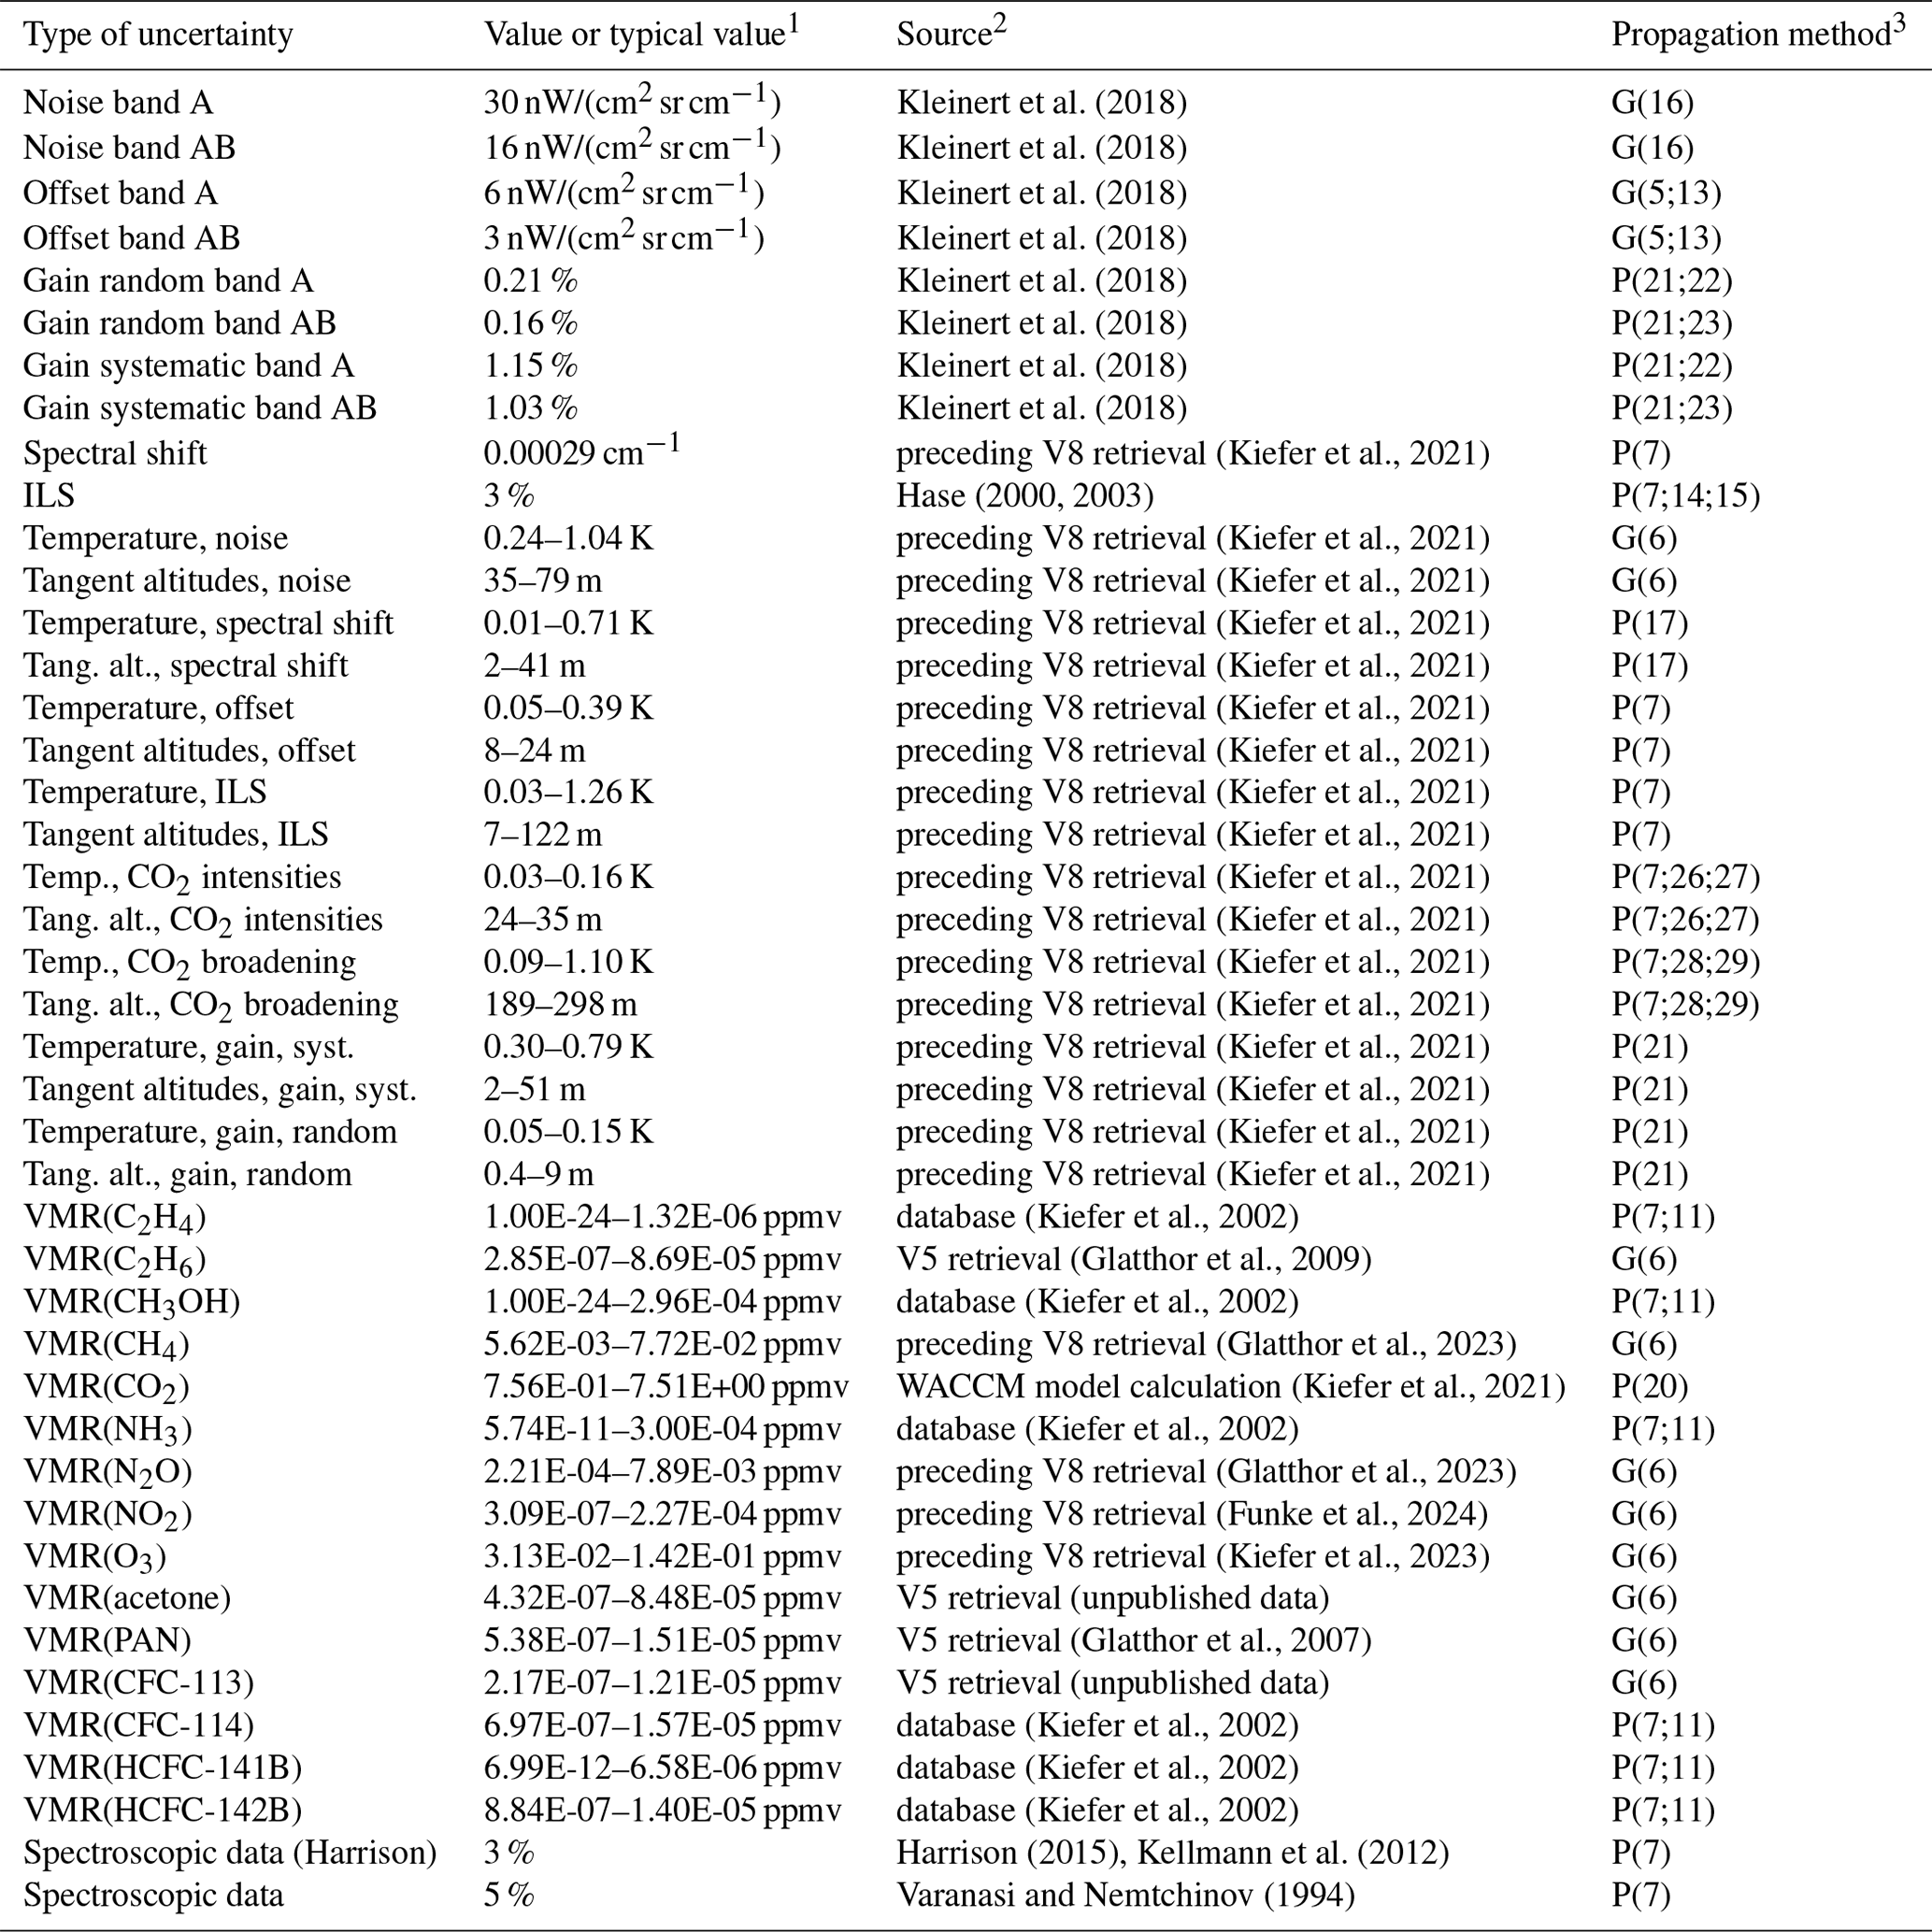
1 For variable uncertainties typical values are reported. Some errors in Kleinert et al. (2018) are given in terms of 2σ; we have rescaled them to 1σ, which explains the apparent inconsistencies. 2 In some cases V5 data were used that are not published. In these cases, reference to an earlier data version is made. 3 Temperature and tangent altitude errors due to noise, spectral shift, and offset are propagated separately. The notation is as follows: “G” refers to generalized Gaussian error propagation in a matrix formalism, while “P” refers to perturbation studies. The numbers in parentheses are the respective equation numbers in von Clarmann et al. (2022).
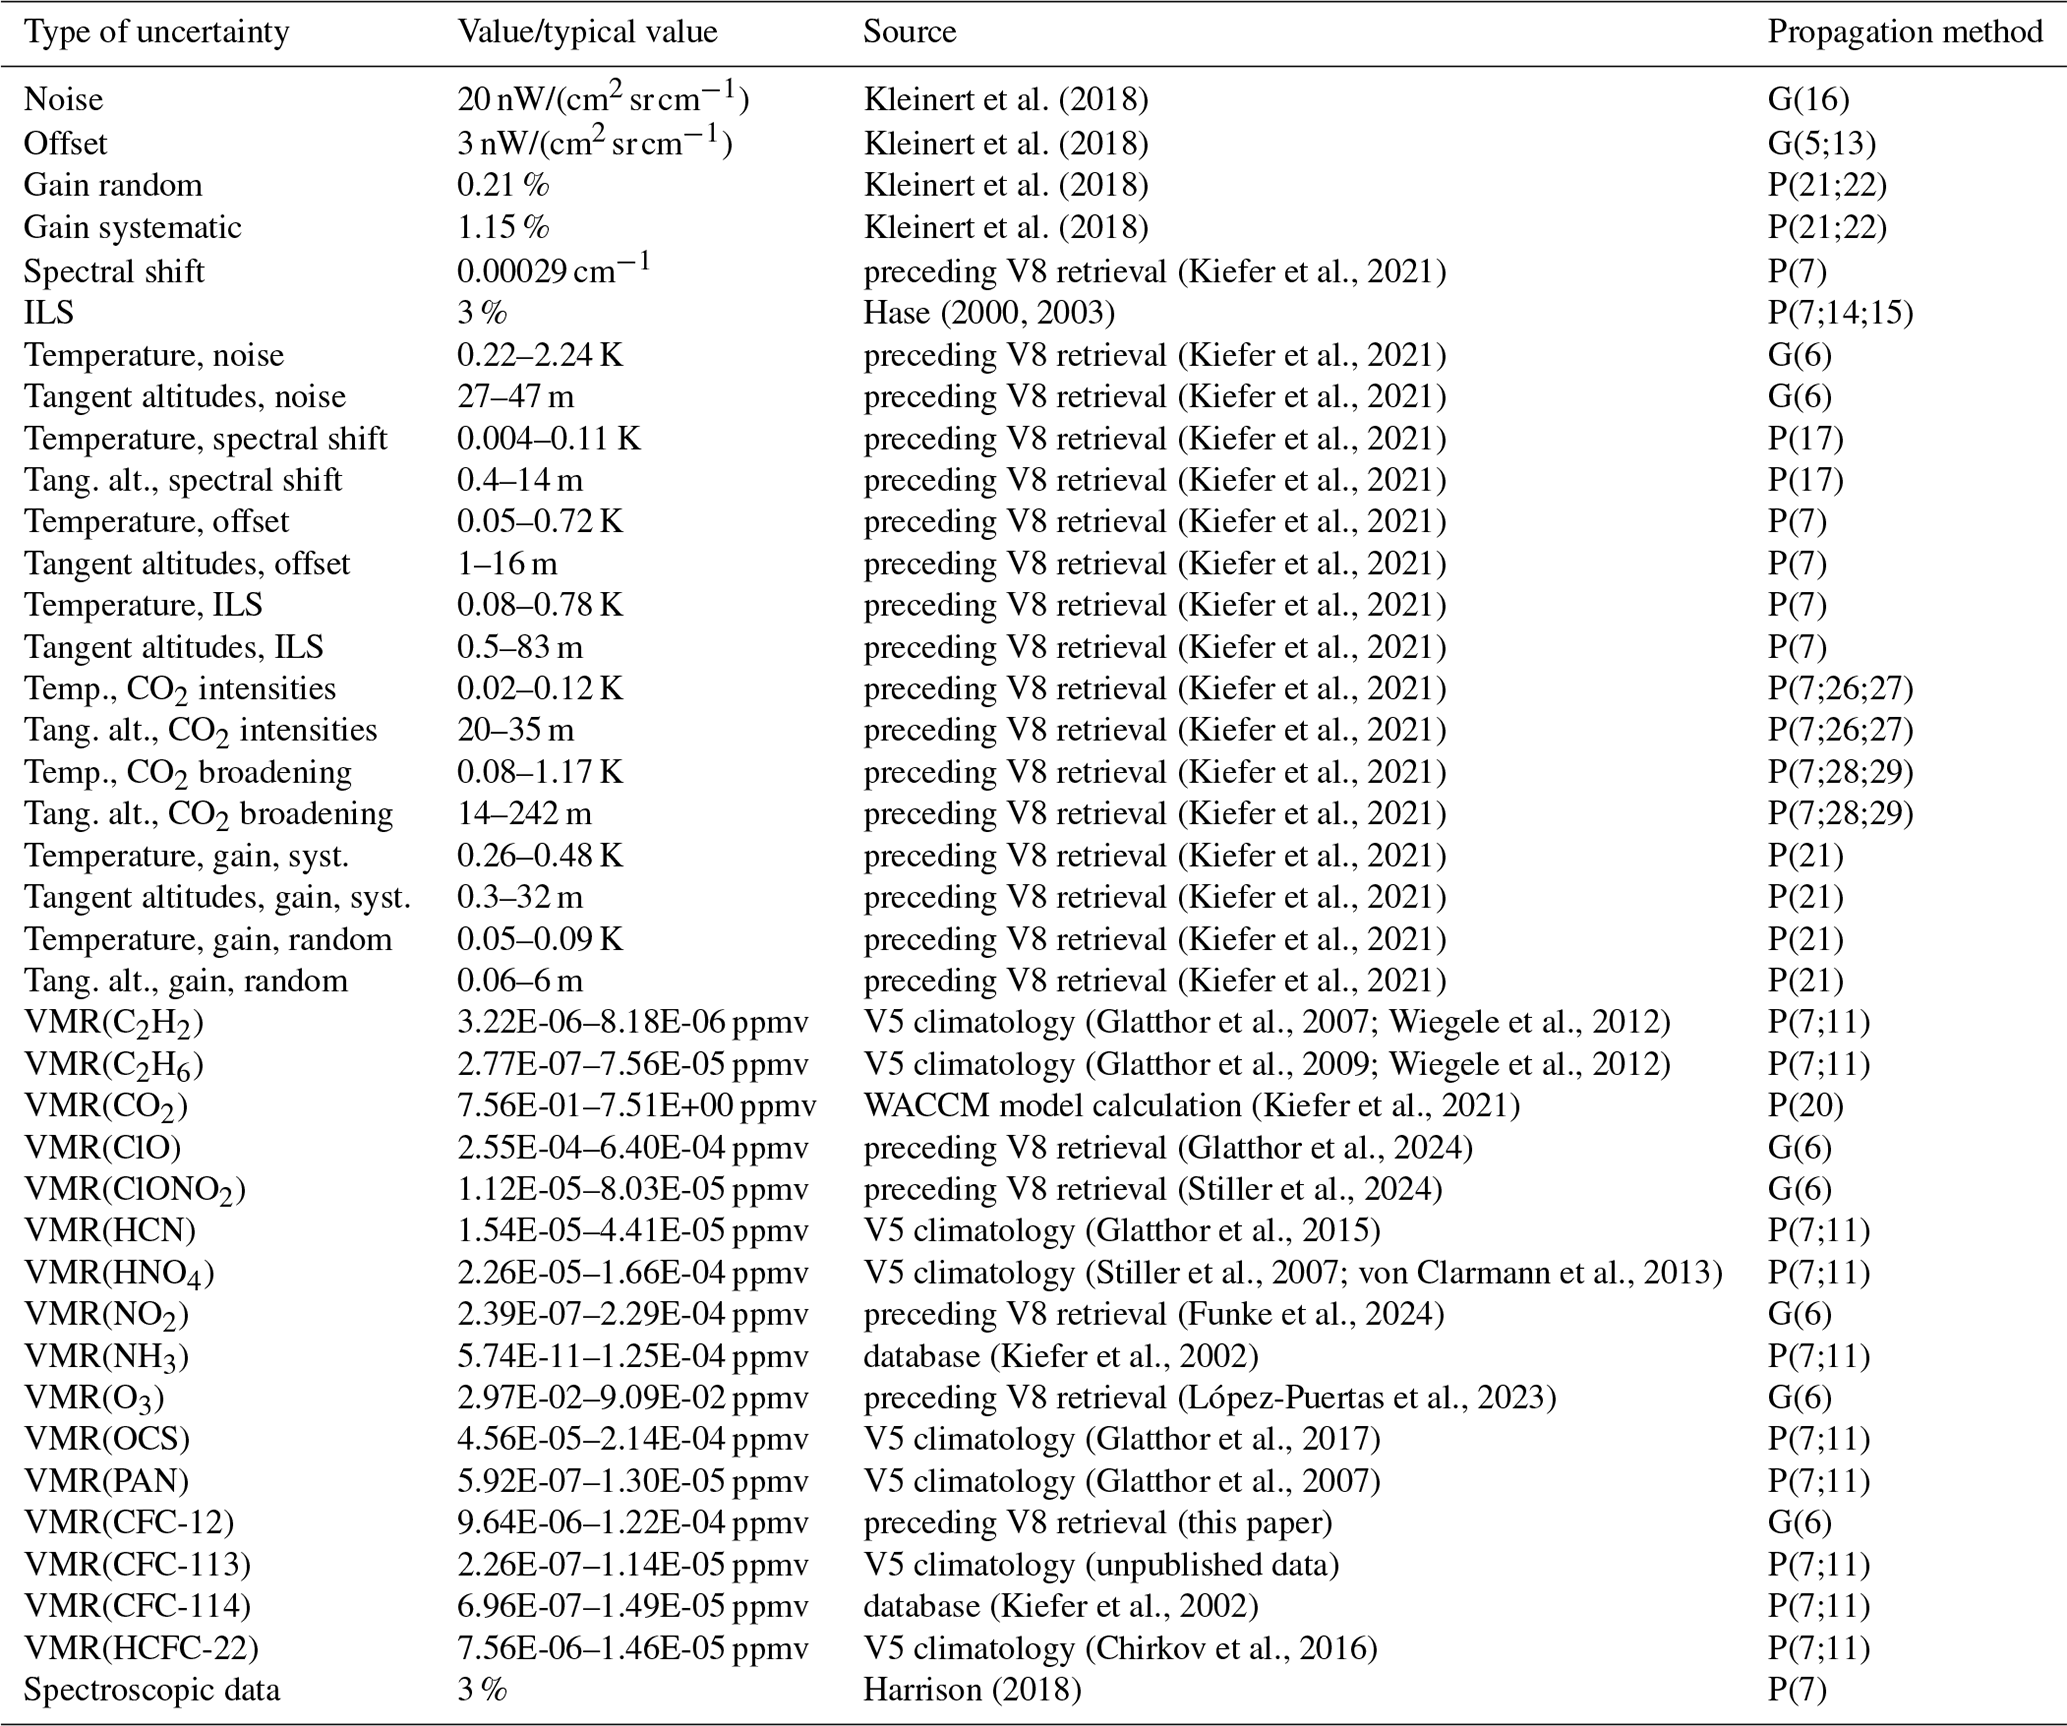
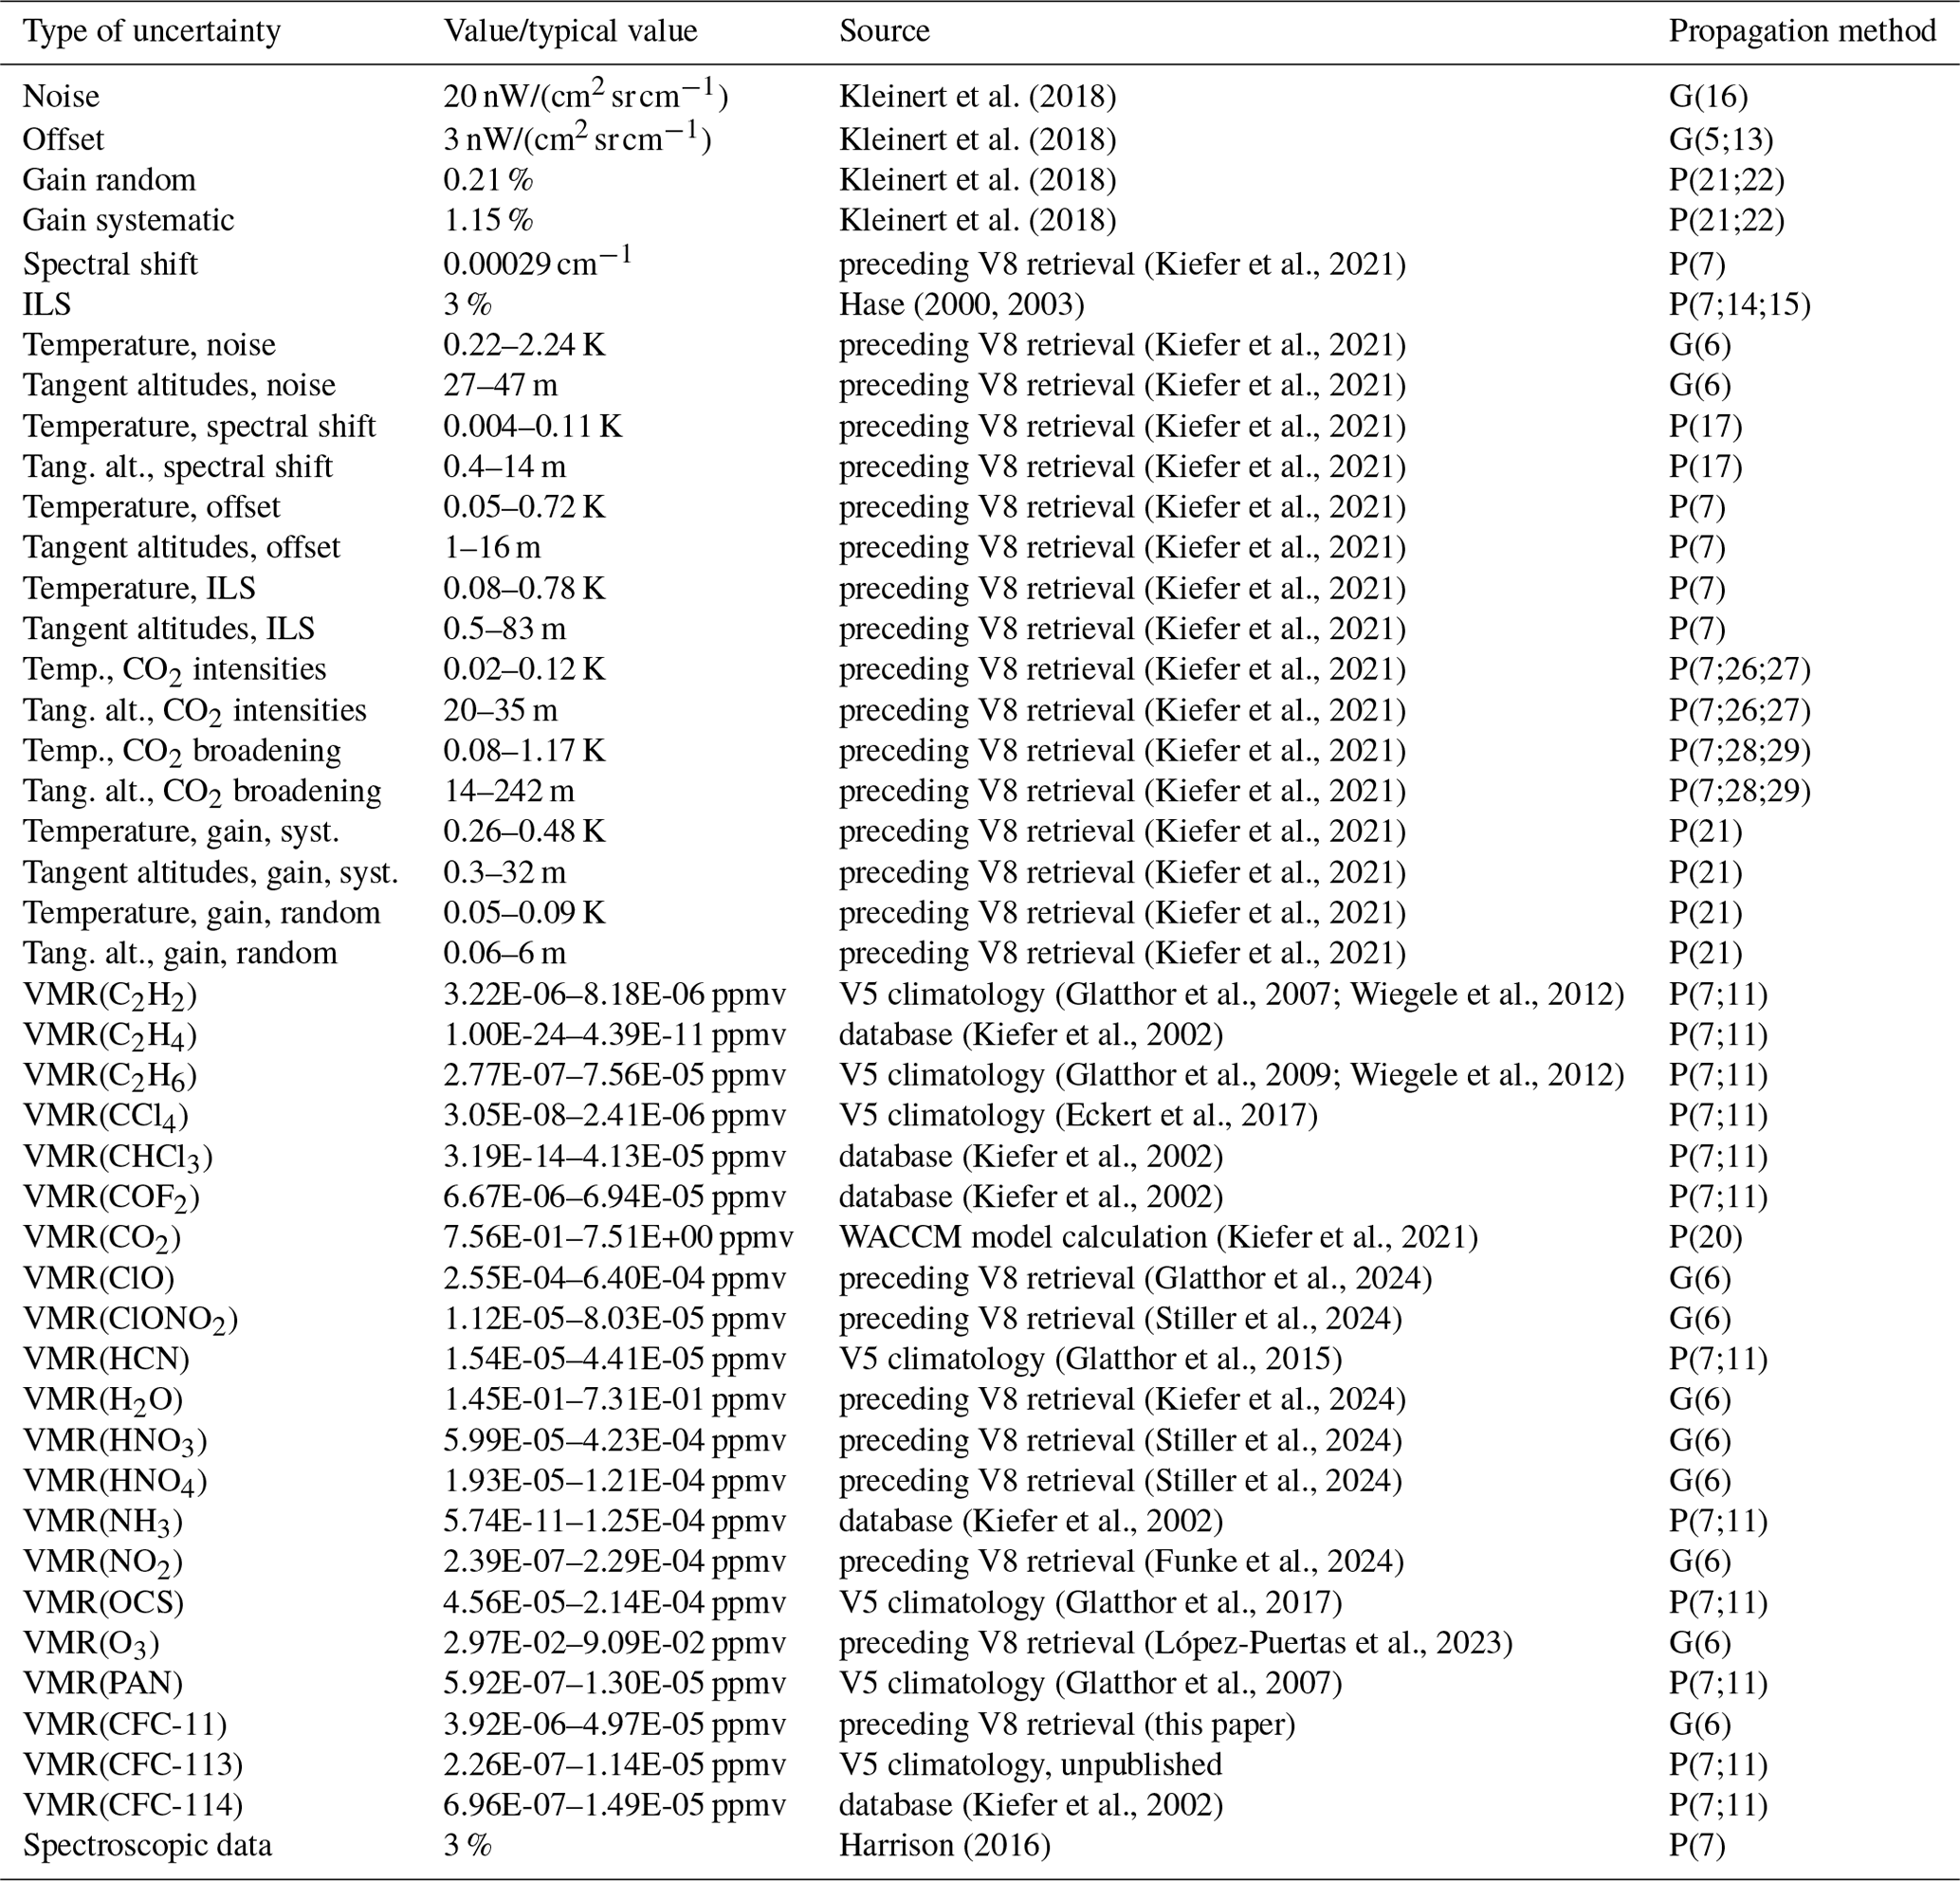
Table 2Assumed uncertainties for northern mid-latitude summer daytime conditions affecting the retrieval of CFC-12 (RR).
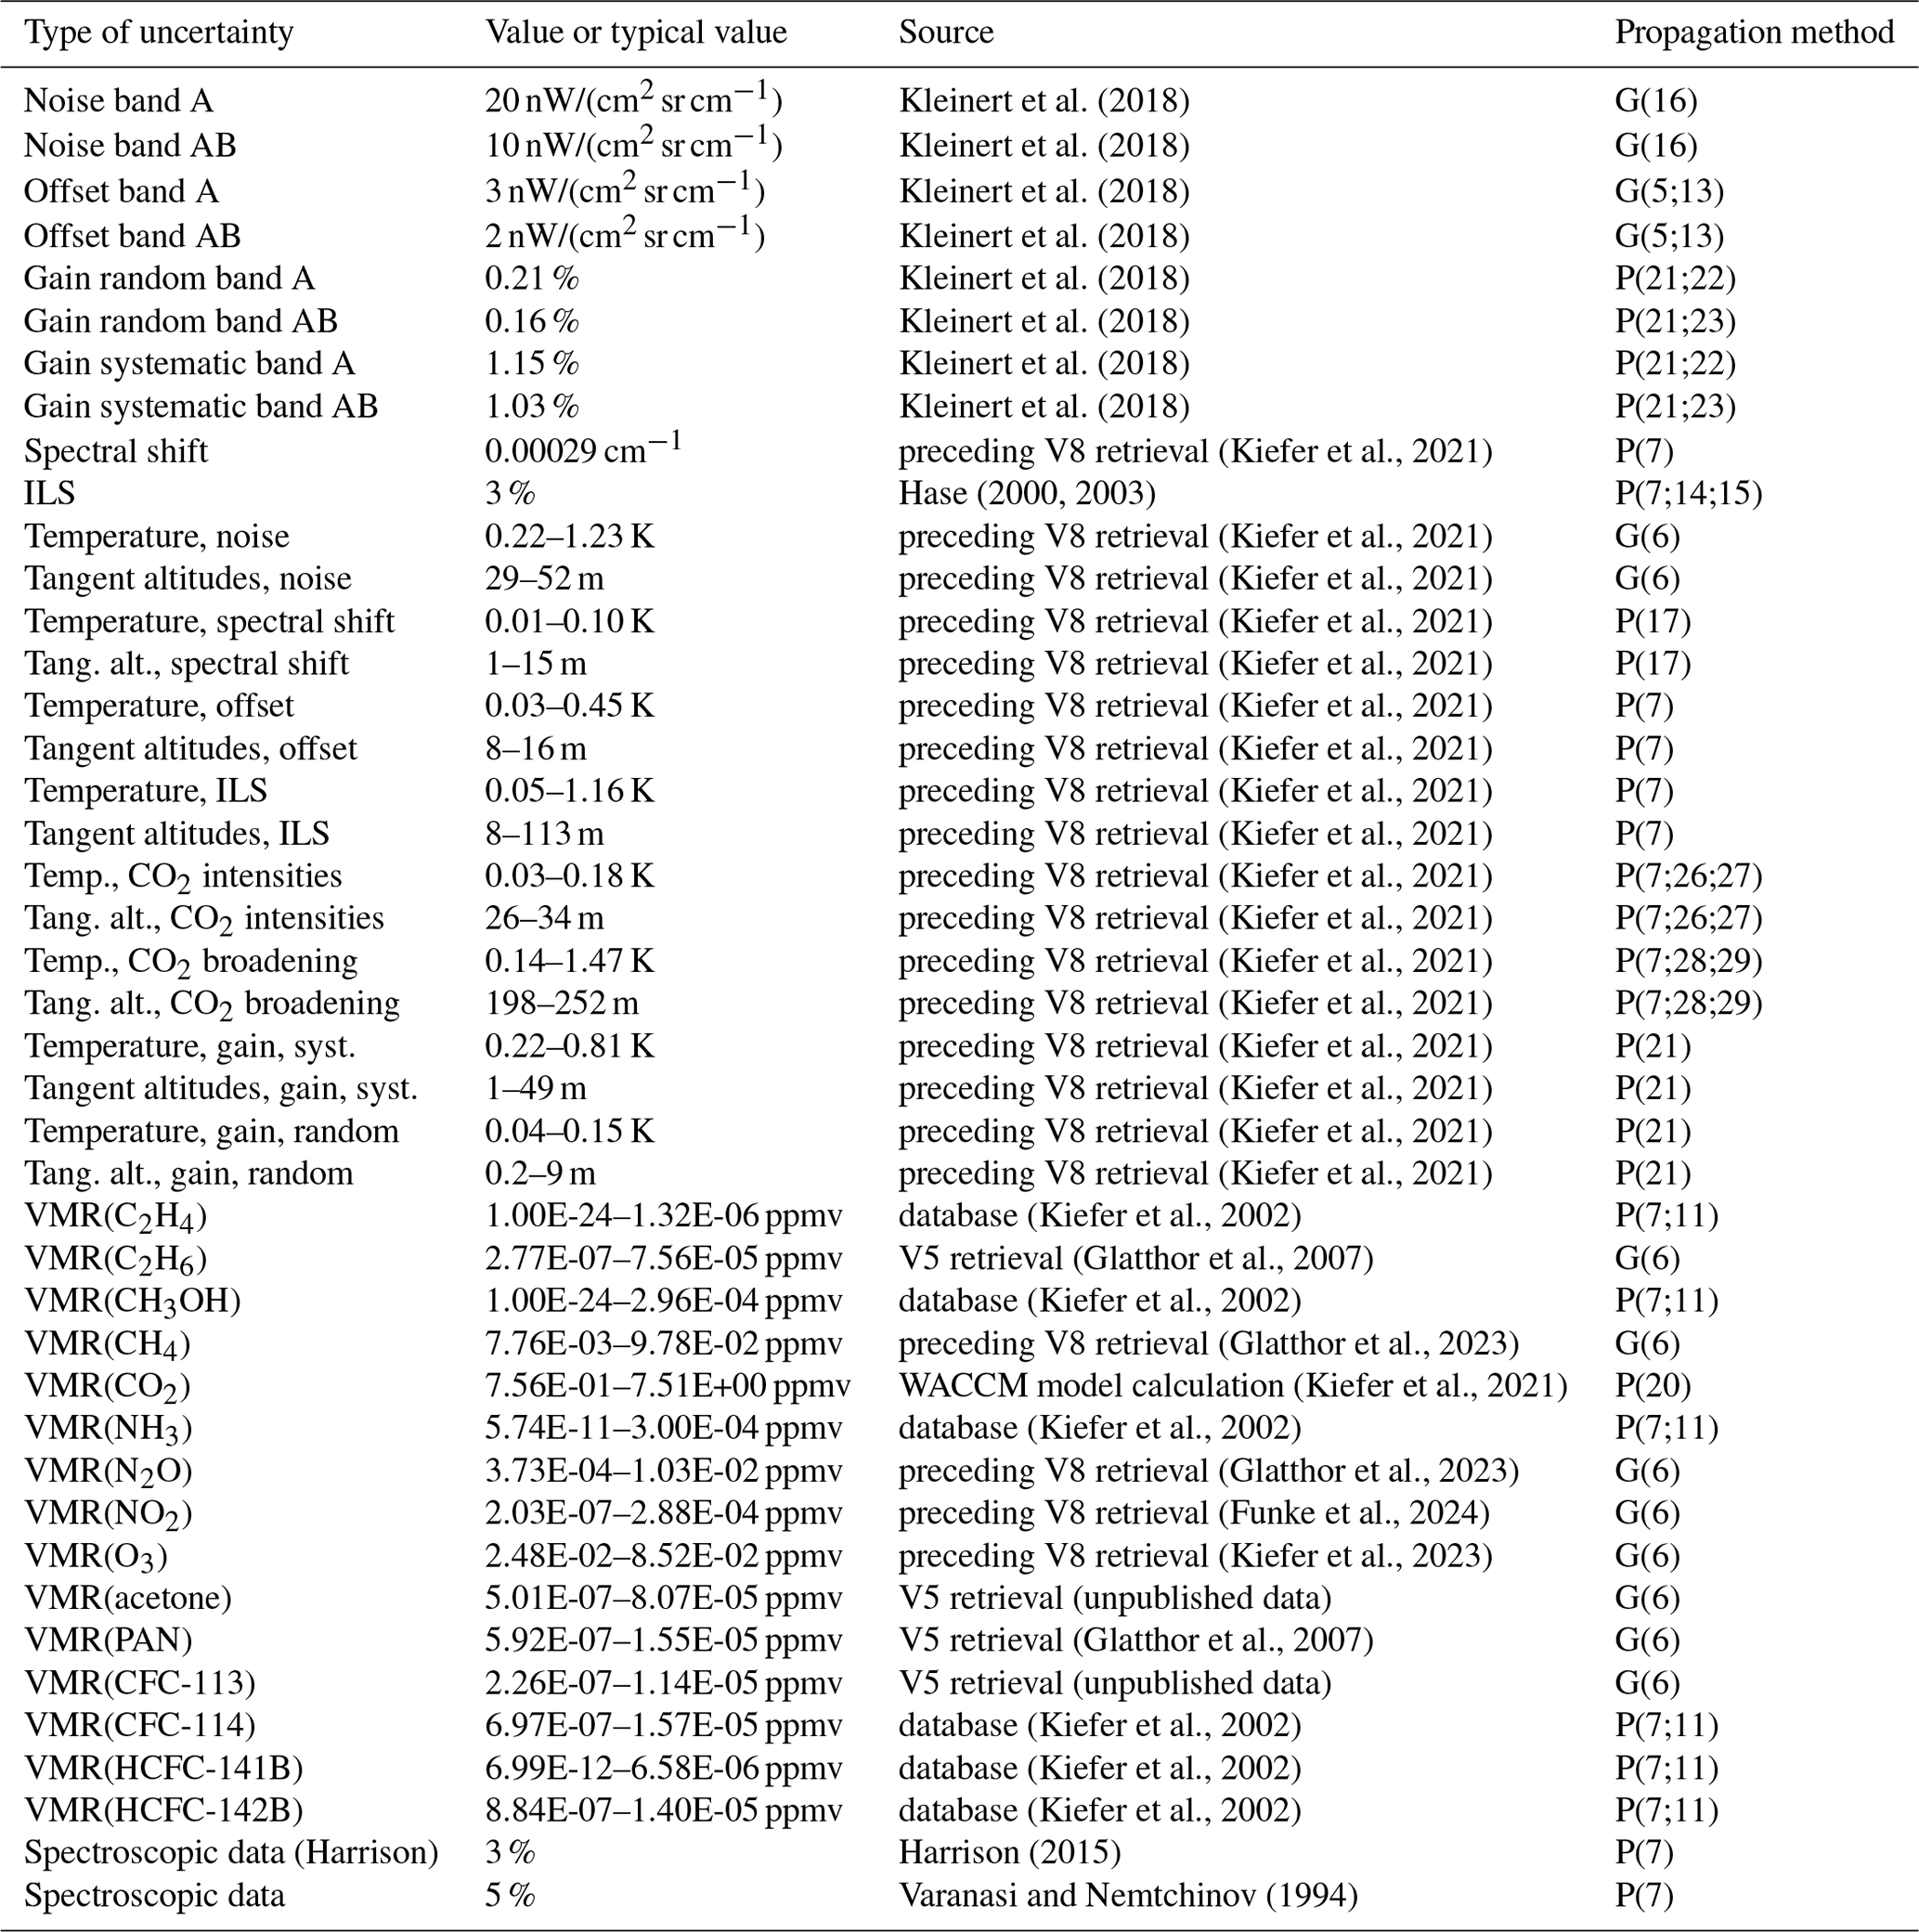
See footnotes of Table 1 for details on the contents of the columns.
Table 3Assumed uncertainties for northern mid-latitude summer daytime conditions affecting the retrieval of CFC-12 (MA).
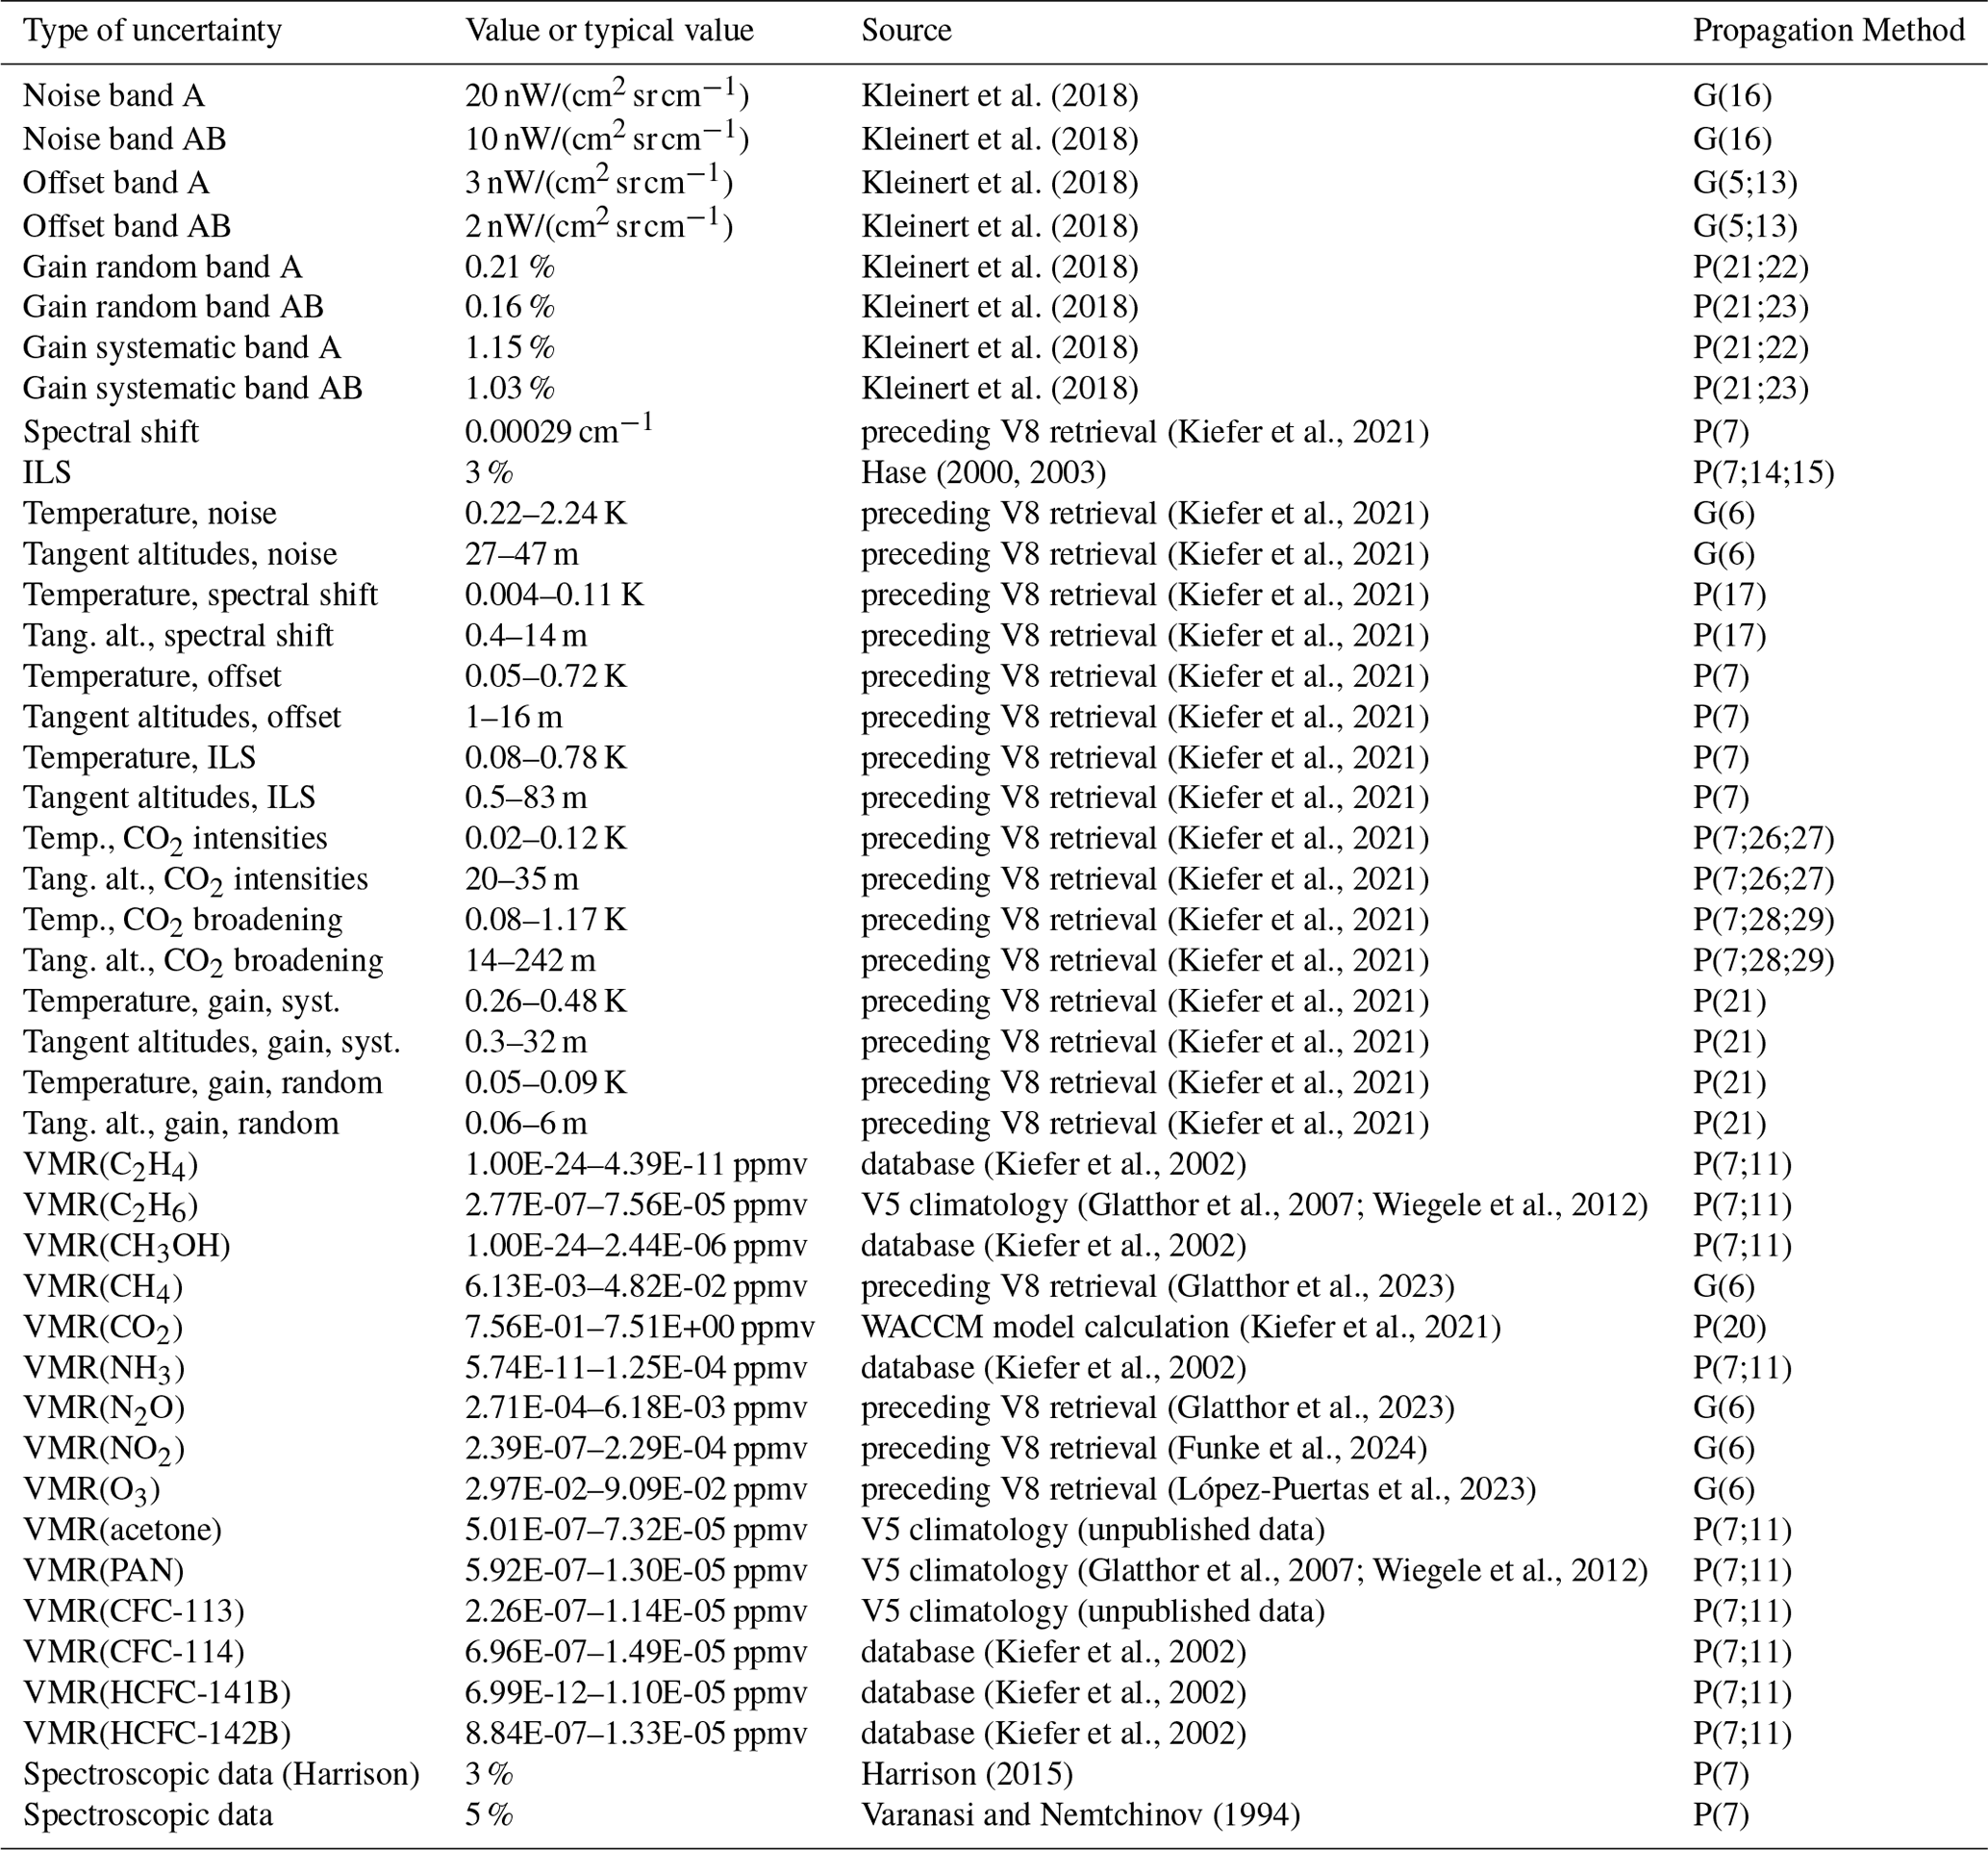
See footnotes of Table 1 for details on the contents of the columns.
Resulting error estimates of CFC-12 mixing ratios are presented as examples in Fig. 2 for northern mid-latitude summer daytime conditions. For all FR, RR, and MA measurements, the systematic errors dominate the error budget below 23 (24) km, while the random error takes over above this point. The leading source of the systematic error is uncertainties in spectroscopic data, while the random error is dominated by measurement noise. Radiance offset uncertainties play an appreciable role, too. The error budgets for all atmospheric conditions and the FR and RR observation modes are presented as tables and figures in the Supplement file S2 to this article.
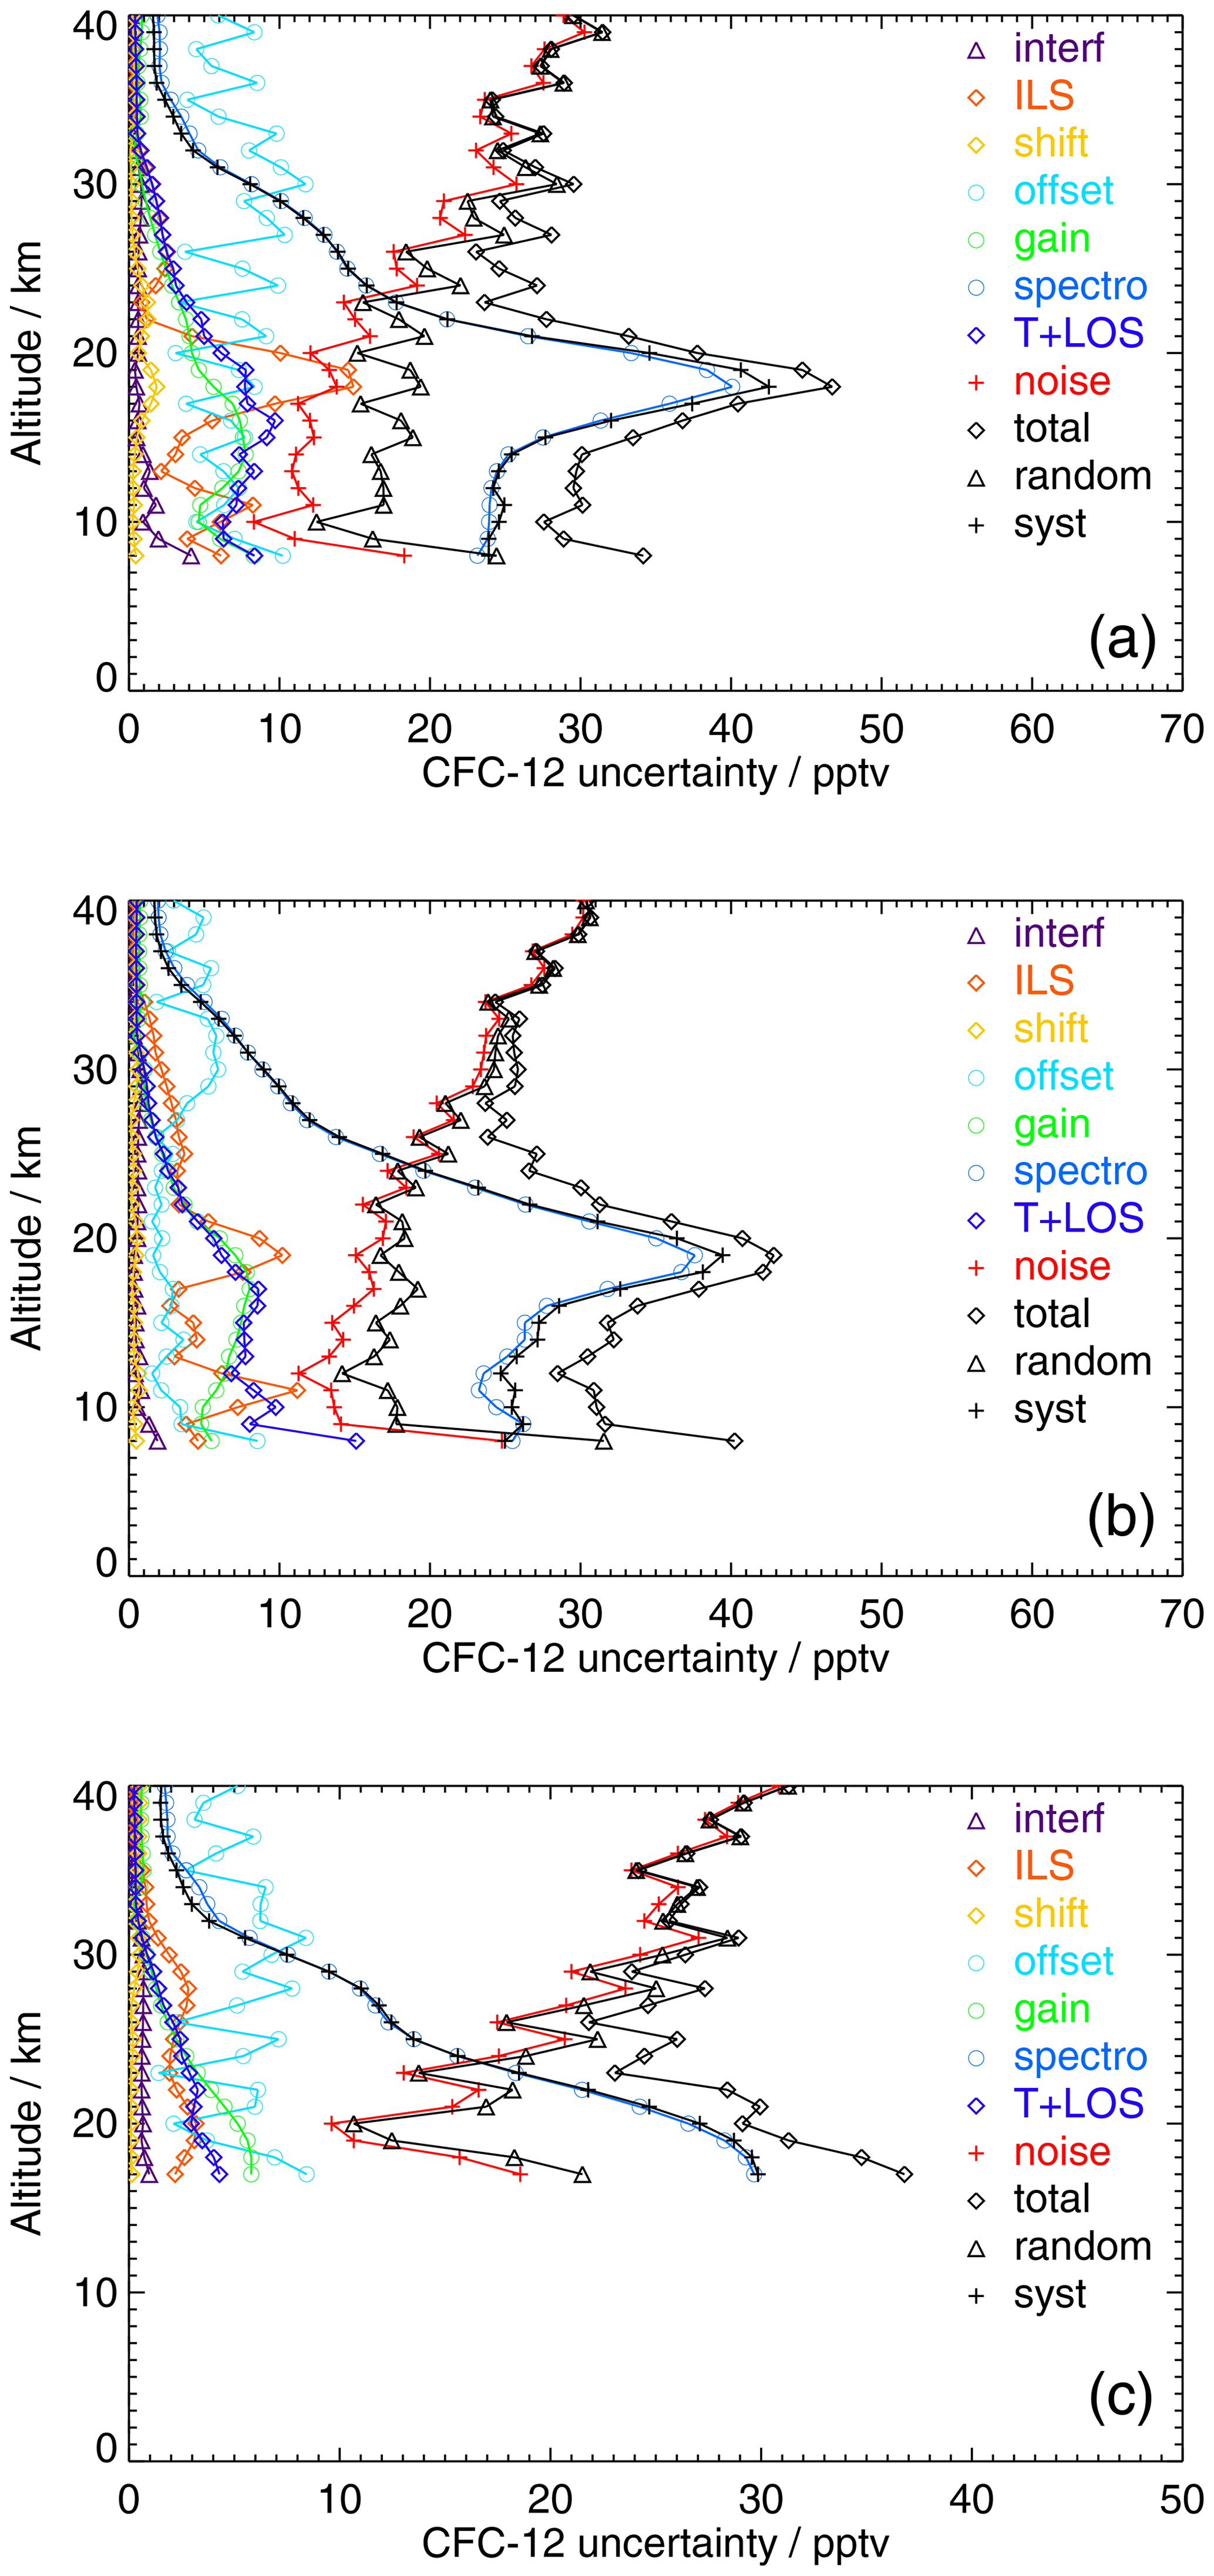
Figure 2Uncertainties of CFC-12 mixing ratios retrieved from MIPAS FR (a), RR (b), and MA (c) measurements for northern mid-latitude summer daytime conditions.
3.3 The CFC-12 vertical averaging kernels
The content of prior information and the vertical resolution are characterized by the averaging kernels of the retrieval (Rodgers, 2000). CFC-12 averaging kernels for FR, RR, and MA measurements under northern mid-latitude daytime conditions are shown in Fig. 3.
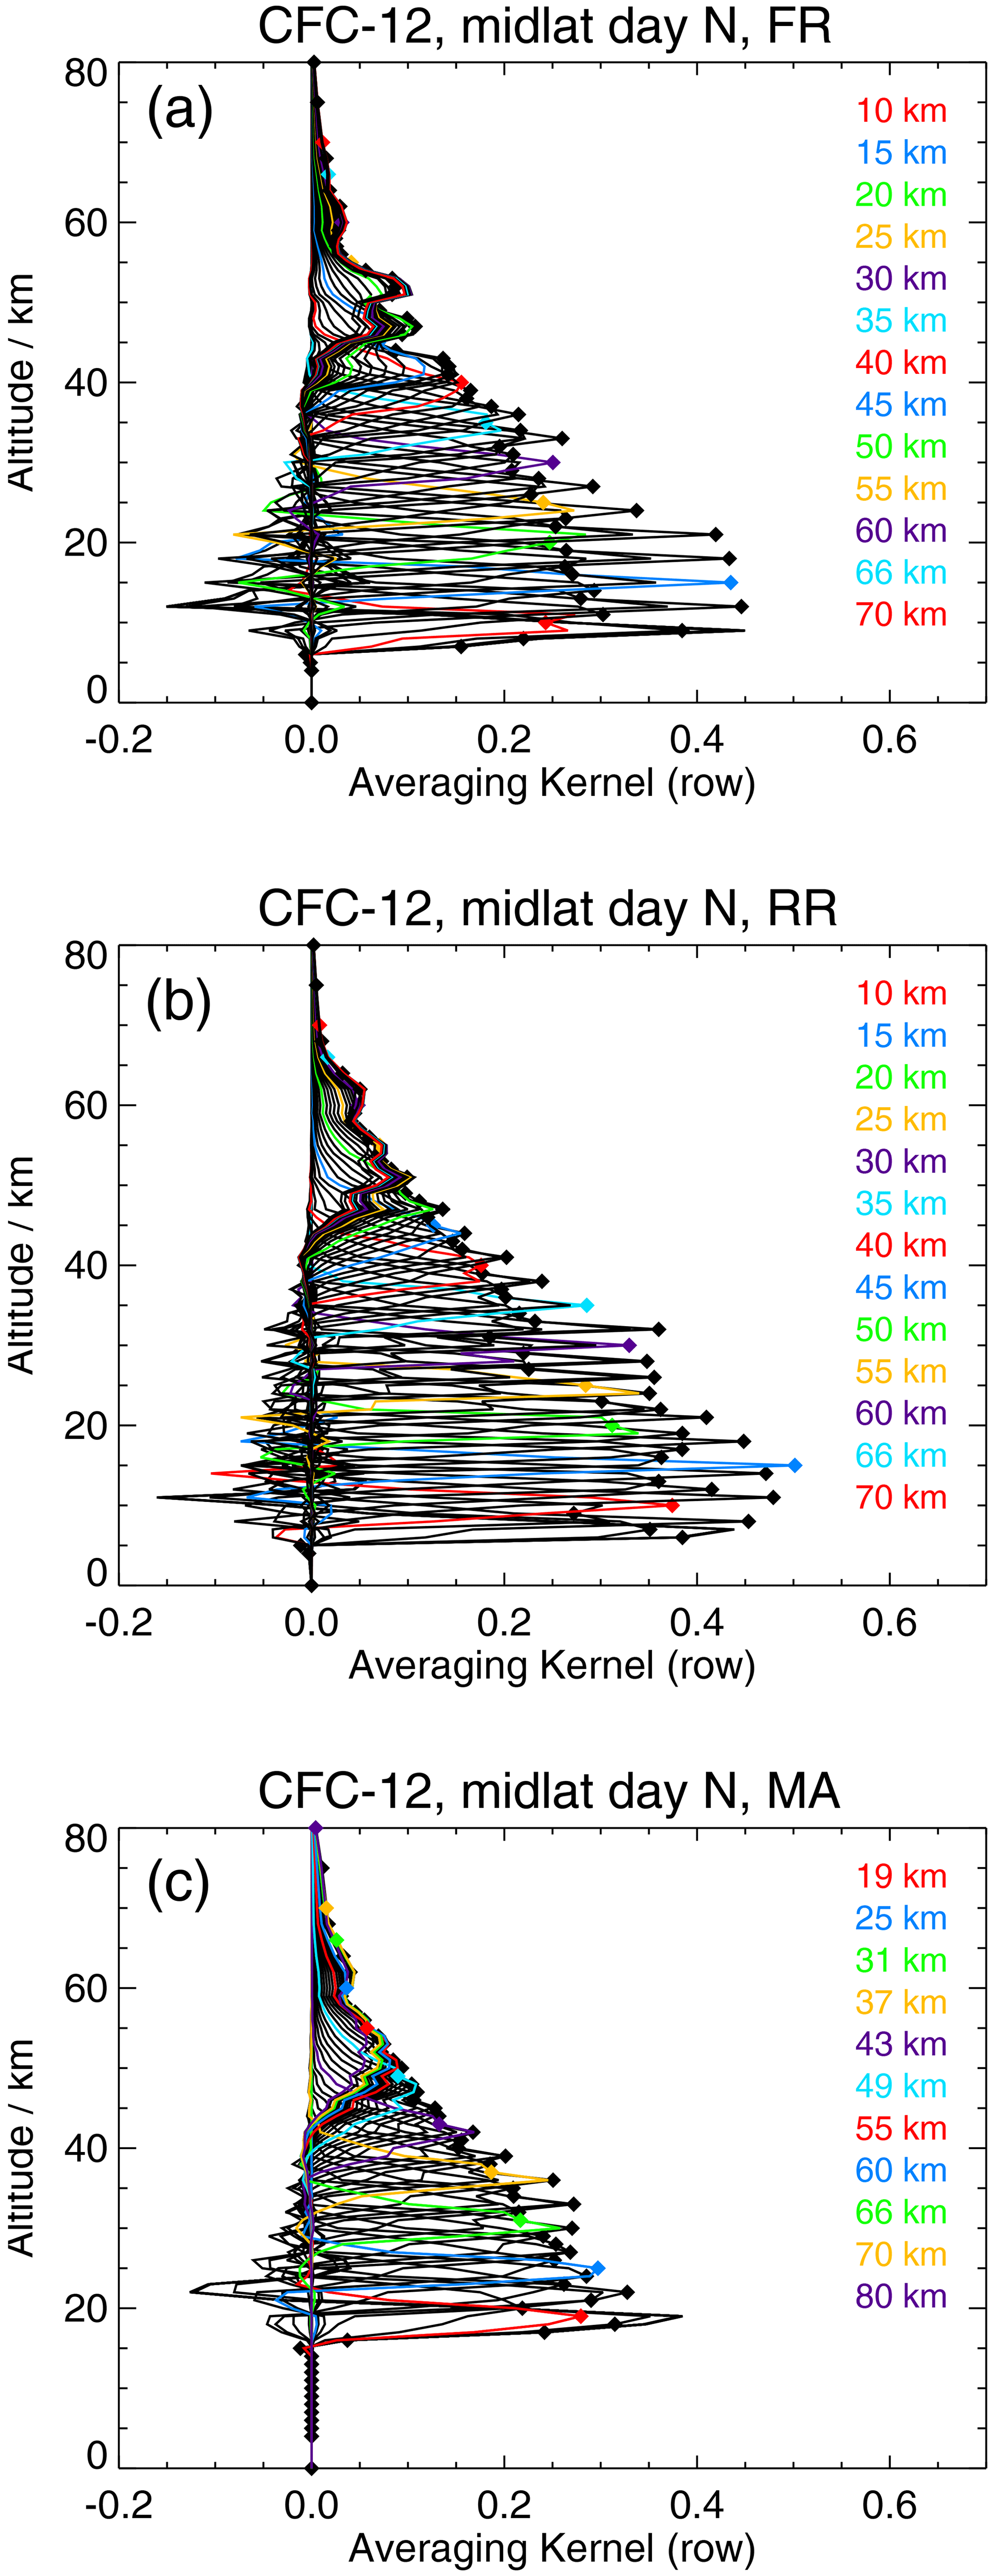
Figure 3Averaging kernels of northern mid-latitude daytime CFC-12 FR (a), RR (b), and MA (c) measurements. These averaging kernels refer to limb sequences recorded at 46.1° N, 155.1° W on 14 January 2003 (a); 48.4° N, 116.4° W on 4 January 2009 (b); and 48.0° N, 179.65° E on 11 January 2009 (c). Every fifth averaging kernel row is marked by colour, and the diamonds mark the altitude of the retrieval grid point.
For stratospheric altitudes, the vertical resolution both in terms of the full width at half maximum of the row of the averaging kernel matrix and in terms of the grid width divided by the diagonal element of the averaging kernel vary roughly between 2 km near the tropopause and 6 km near the stratopause. Below 50 km the averaging kernels are well-behaved in the sense that they peak at their nominal altitudes. This indicates that there is no systematic vertical information displacement at these altitudes. FR and RR averaging kernels are fairly consistent.
3.4 The CFC-12 horizontal averaging kernels
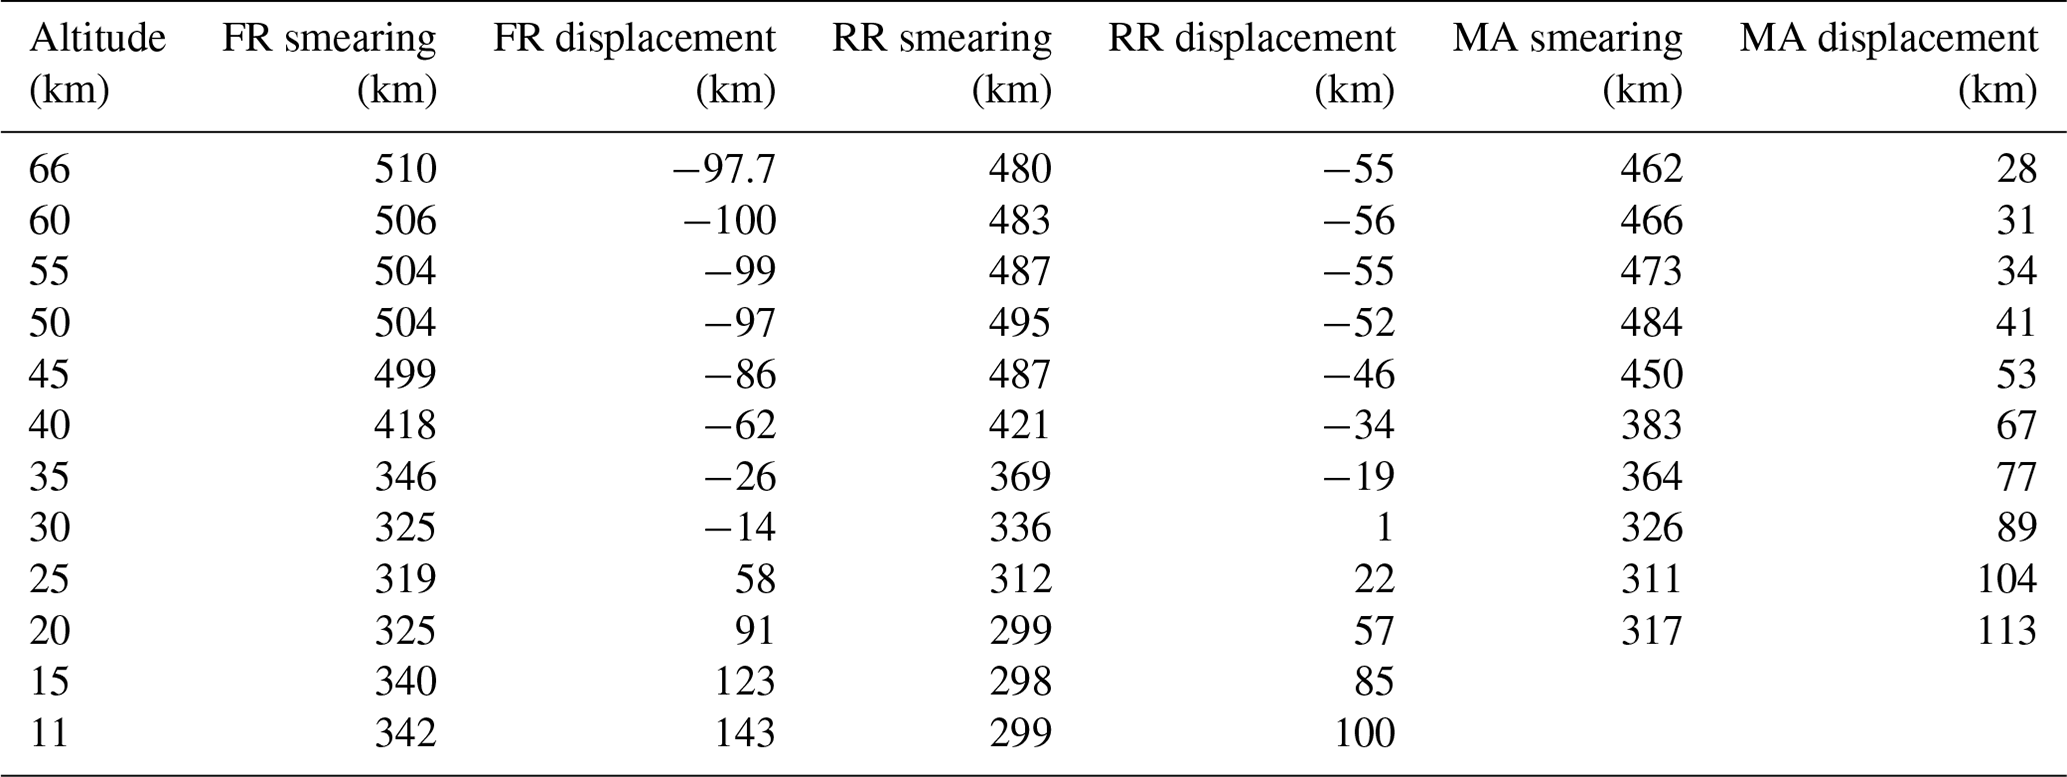
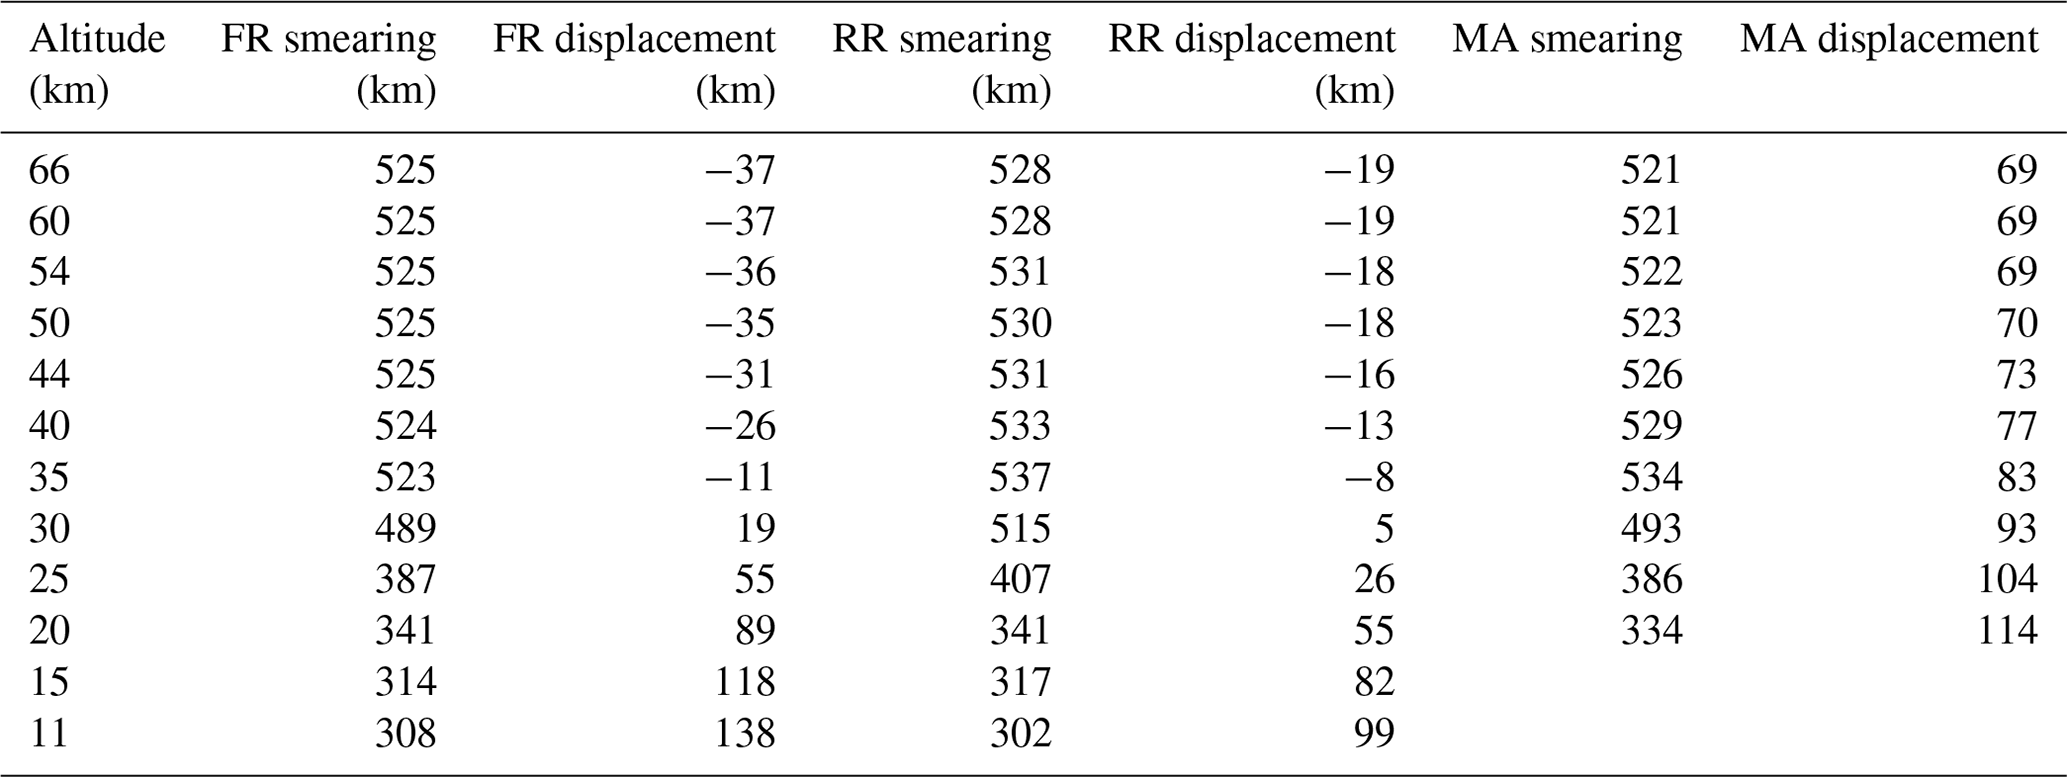
In order to estimate the horizontal resolution of MIPAS CFC-12 measurements, horizontal averaging kernels were calculated following the scheme by von Clarmann et al. (2009a). We report both the horizontal smearing in terms of full width at half maximum of the vertically integrated 2D averaging kernels and the horizontal information displacement (Table 4). The latter is the horizontal distance between the averaging-kernel-weighted mean of the horizontal coordinate and the nominal geolocation of the limb scan. Positive signs indicate information displacements towards the satellite.
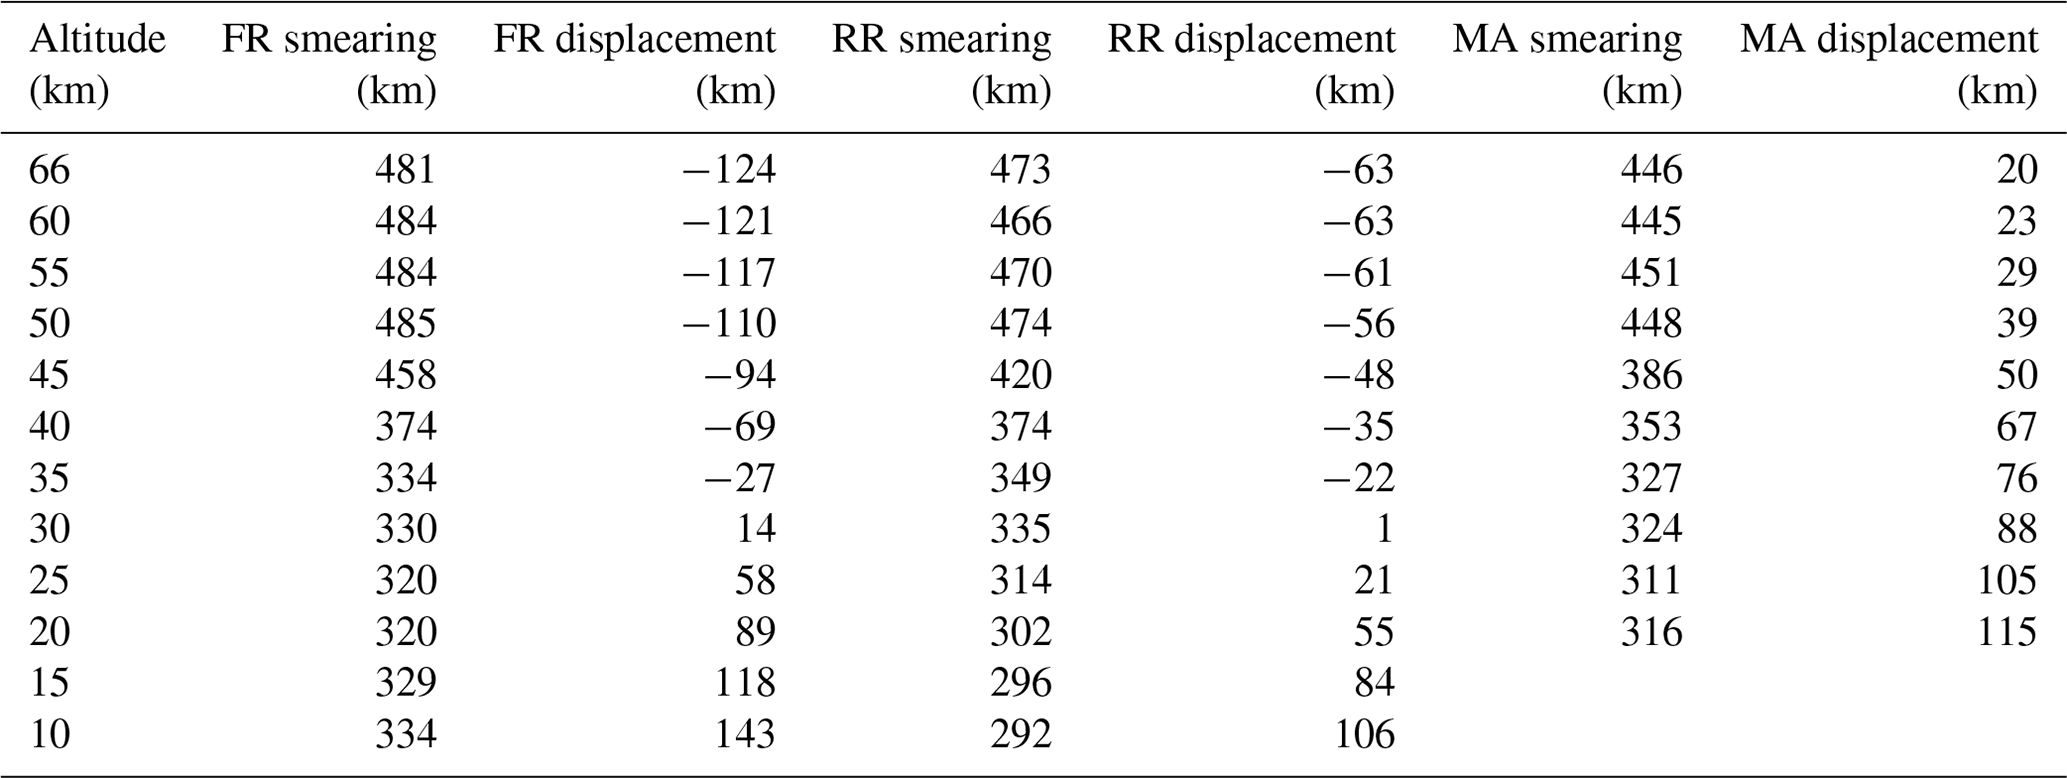
For both the FR and the RR measurement modes the information is displaced from the nominal geolocation of the limb scan towards the satellite below about 30 km and away from the satellite above. The values of the displacement, however, are too low to give reason for concern. For MA measurements, the displacement is towards the satellite for all altitudes, because the nominal geolocation of MA limb scans refers to a tangent point at about 60 km altitude.
The horizontal smearing of the FR retrievals is always narrower than the horizontal grid (510 km), i.e. the horizontal distance between the nominal geolocations of two subsequent limb scans. As a consequence, the horizontal resolution of these measurements is sampling limited, not smearing limited. The situation is slightly different for the RR retrievals. Here the horizontal resolution is sampling limited below about 40 km, and smearing limited, with values exceeding 410 km, above this point. The loss of horizontal resolution due to smearing is still deemed negligibly small. Information smearing of MA retrievals is quite similar to that of RR nominal retrievals.
3.5 CFC-12 results
The first row of Fig. 4 presents an average altitude–latitude cross section and a global map at 15 km altitude for an arbitrarily selected month of August 2011, while Fig. 5 (first row) shows the evolution over time at 10 and 14 km altitude of CFC-12. Differences between the new version V8 and the preceding version V5 are quite small (see Fig. 6), except for the lowermost parts of the profiles. In the previous data version, volume mixing ratios at altitudes below 11 km were found to be lower in the tropics than at high latitudes (but only when represented at altitude levels, not at pressure levels), while V8 data are highest at the tropics and lower at the poles on both altitude and pressure levels. For FR retrievals, differences between V8 and V5 are typically around −2 % to +4 % in the troposphere. In the stratosphere, they vary between −6 % under southern polar winter and spring conditions and around 18 km for 30° N to 30° S and +3 % elsewhere. The RR data set reveals other systematic differences between V5 and V8. Except for the stratospheric polar winter and spring conditions, where the V8 data set is about 4 % to 12 % lower than the V5 data version, the differences range between +4 % and −2 % over the full valid altitude range. Again, CFC-12 VMRs are reduced in the tropical tropopause region. The reduction at low latitudes around the tropopause for both FR and RR data is related to the reduction in an implausible maximum of CFC-12 in the uppermost tropical troposphere in the V5 data version. The changes due to the new spectroscopic data used for the V8 retrievals, derived from tests with V5 spectra for which only the spectroscopic data were exchanged, are rather small. They are restricted to the troposphere and UTLS region and are in the order of 5 to 8 pptv (about 1 % to 1.5 %).
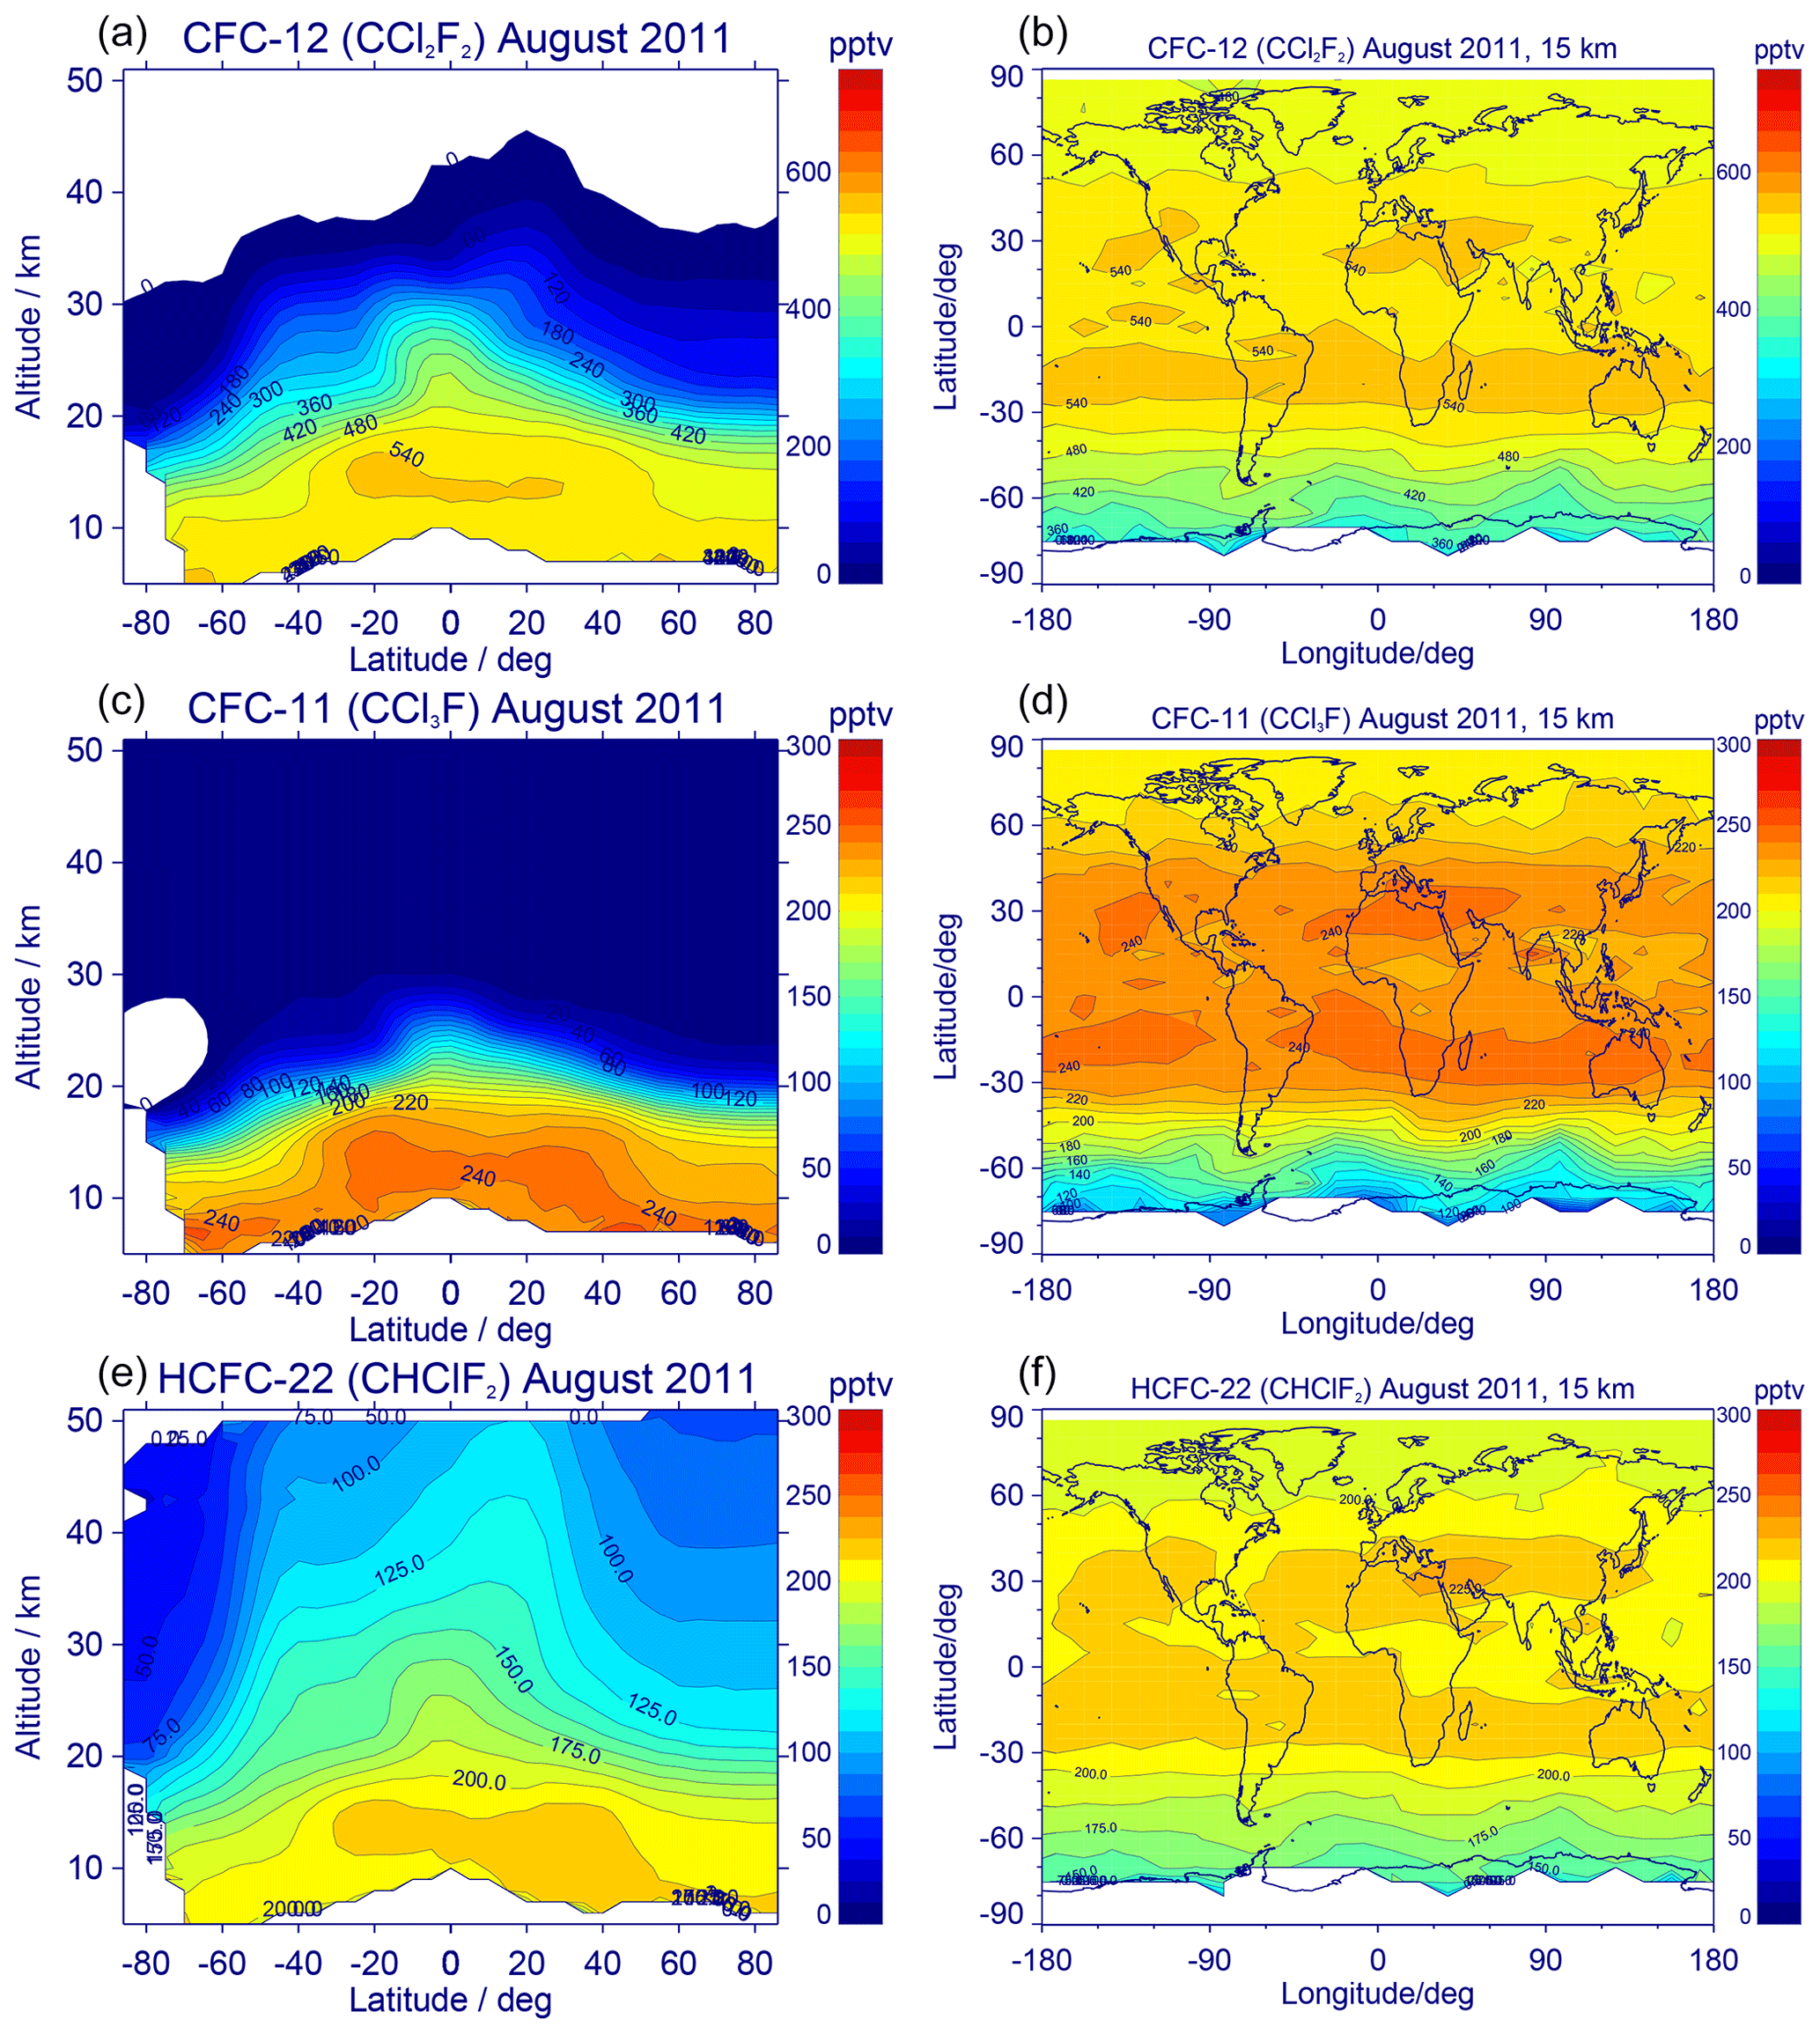
Figure 4Monthly zonal mean distributions (a, c, and e) and global maps at 15 km altitude (b, d, and f) for CFC-12 (a, b), CFC-11 (c, d), and HCFC-22 (e, f) for August 2011. White areas mean no data, due to either clouds in the line of sight, lacking sensitivity of the retrieval, or discarding negative mean values in the plots.
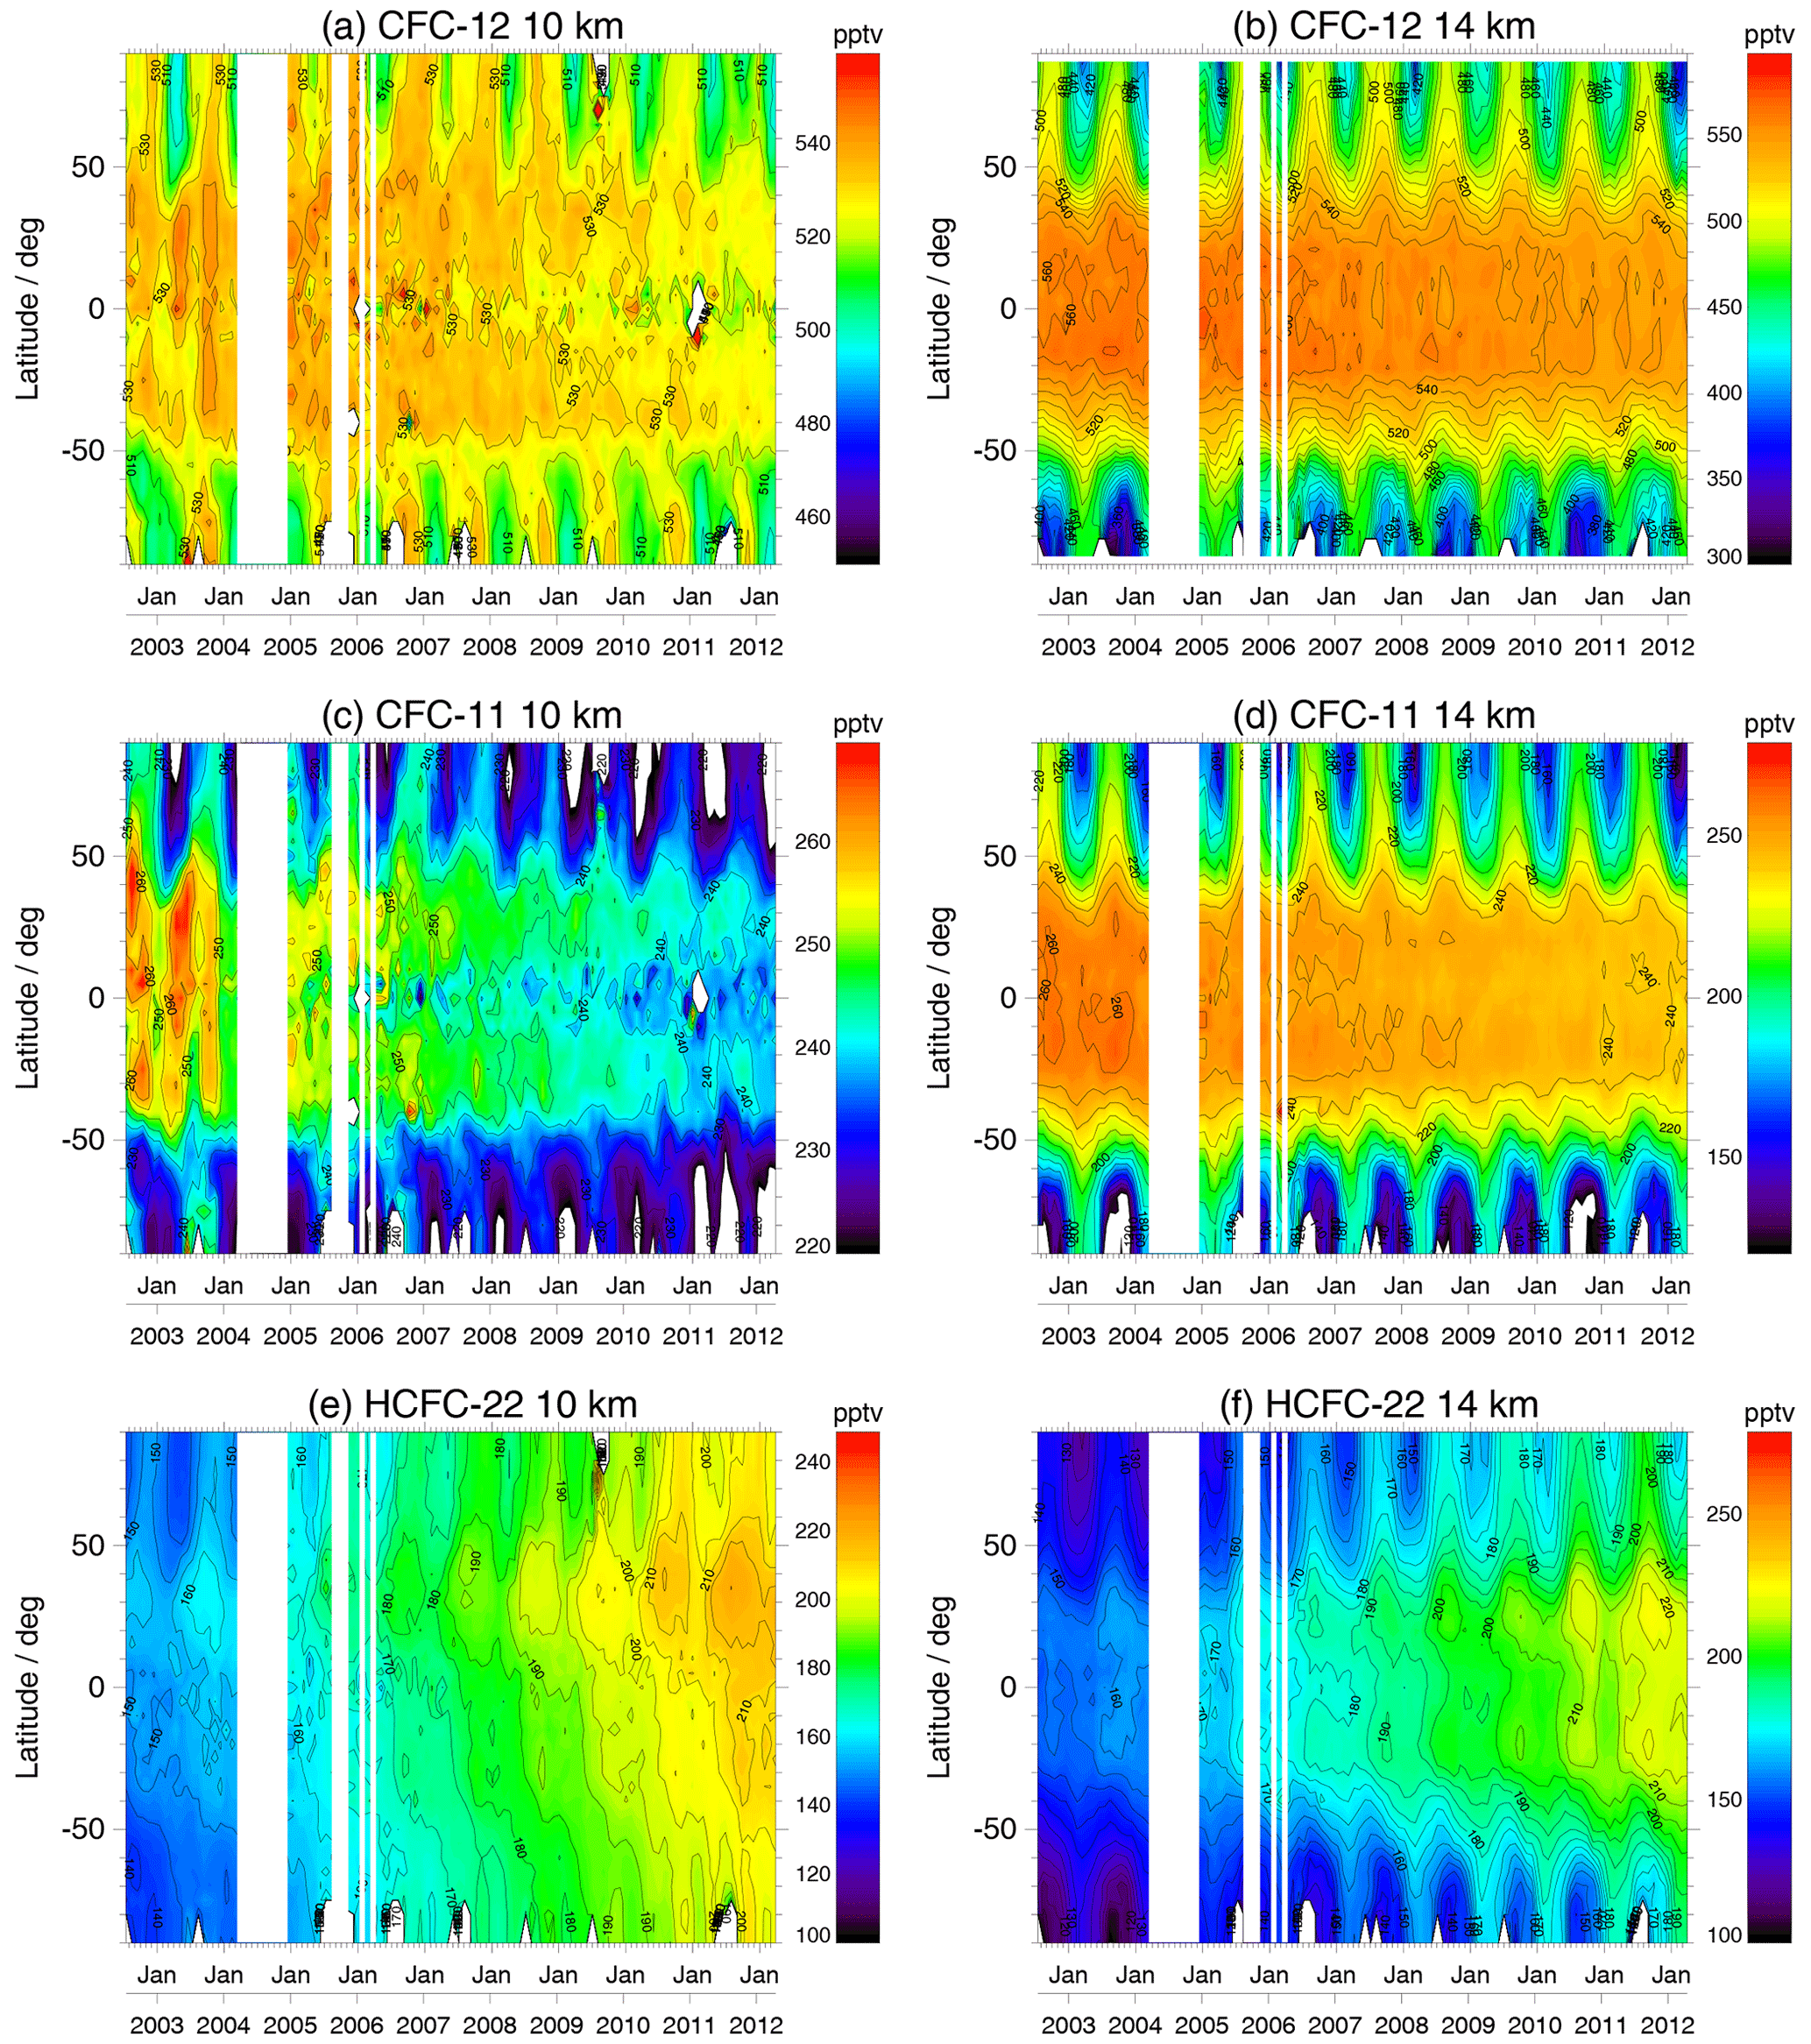
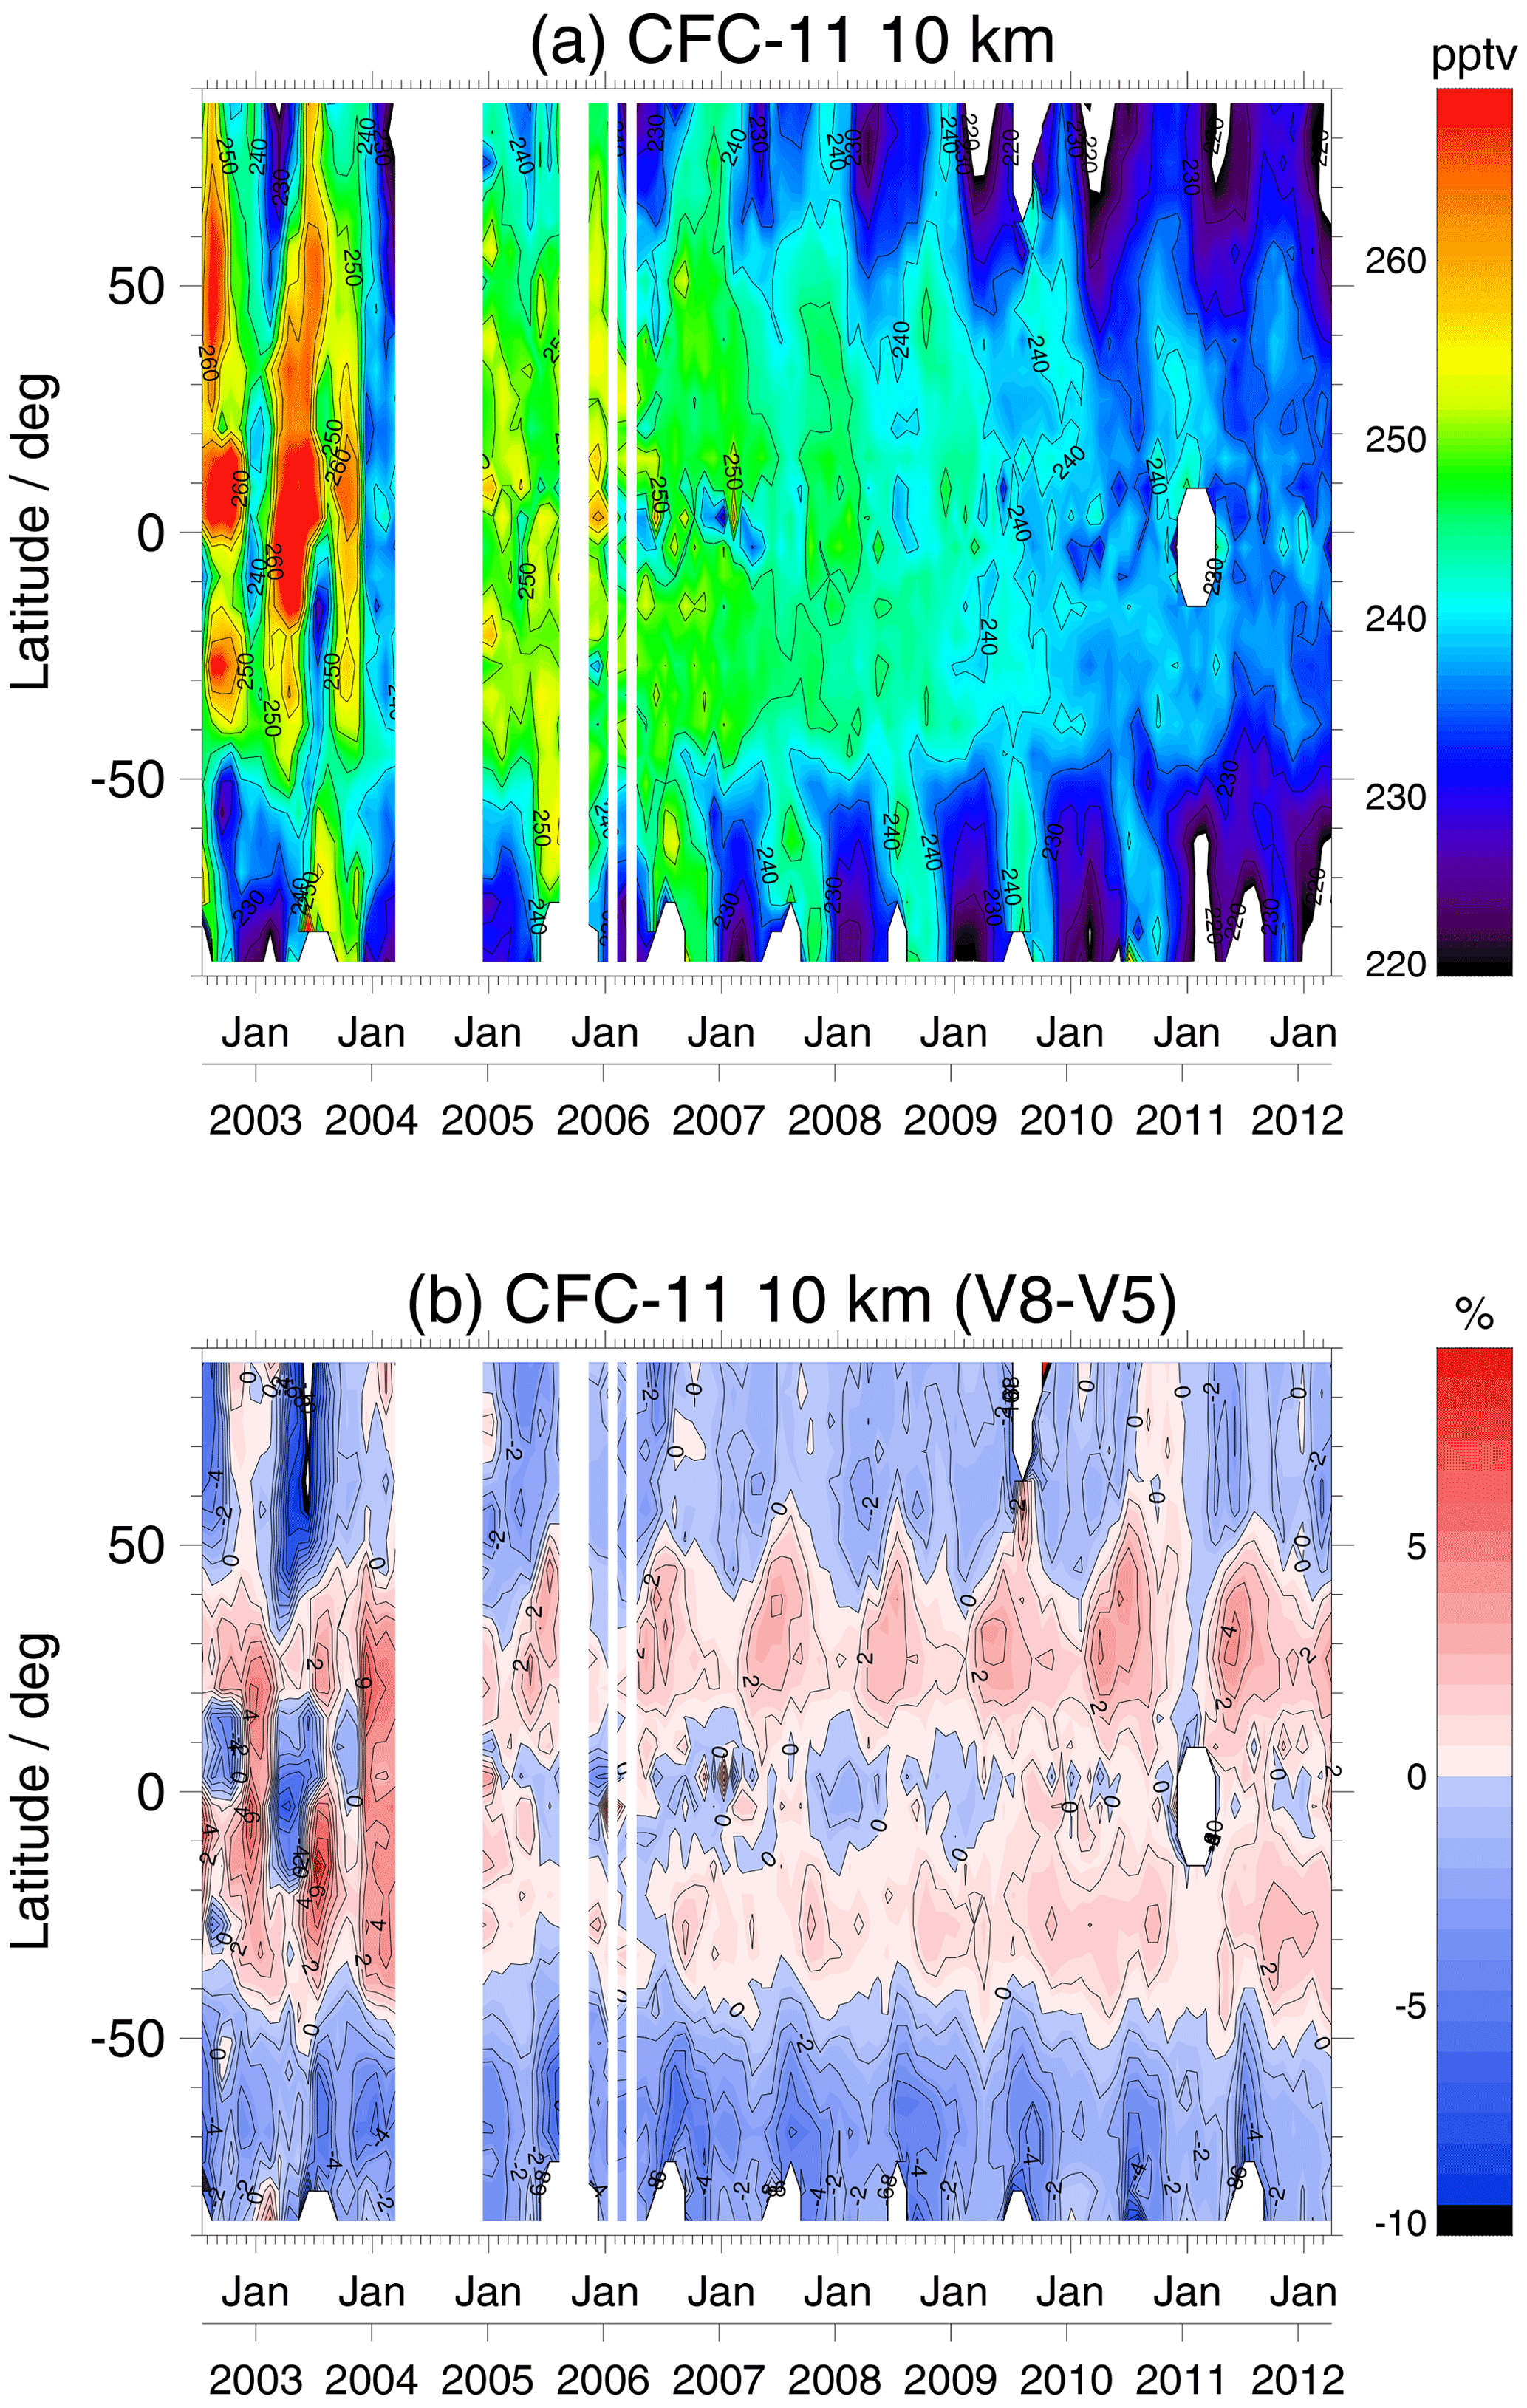
Figure 5Latitude–time cross-sections of CFC-12 (a, b), CFC-11 (c, d), and HCFC-22 (e, f) at 10 km (a, c, and e), and 14 km (b, d, and f) altitude. White vertical bars mean no measurements, and other white areas denote regions with no information due to clouds in the line of sight, retrieval insensitivity, or discarding negative mean values in the plots.
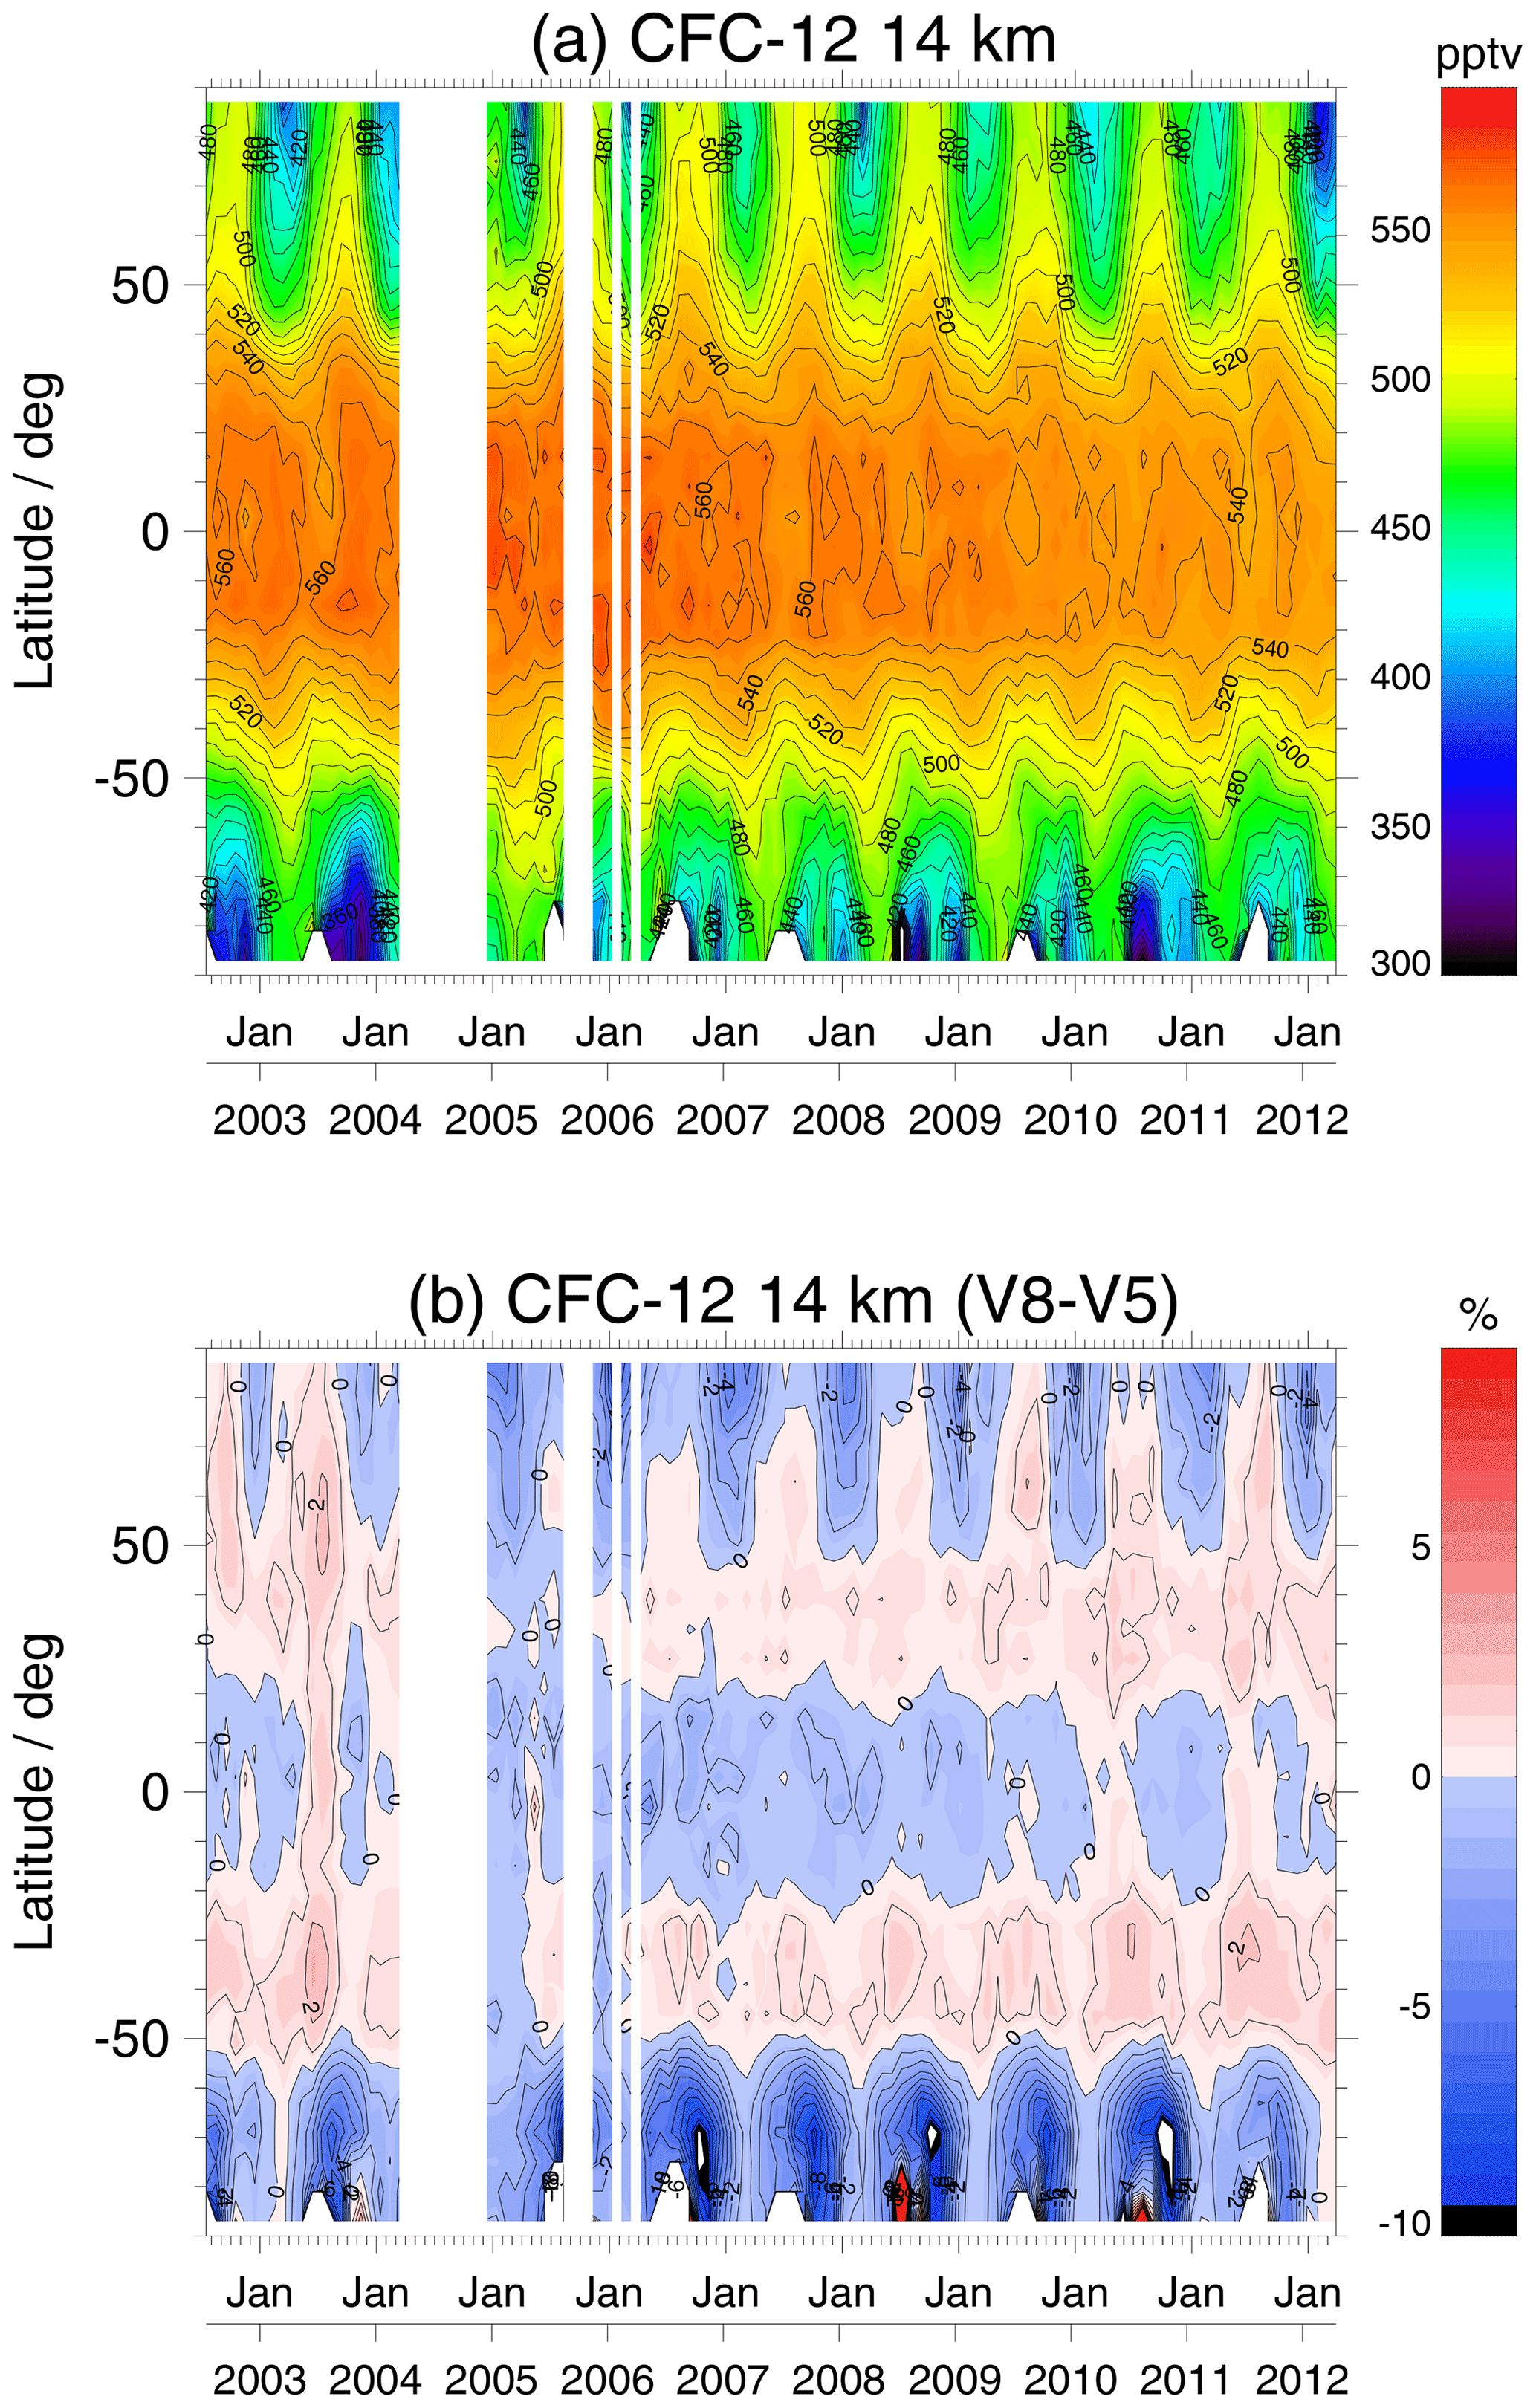
Figure 6Latitude–time cross-sections of the previous version, V5, of CFC-12 at 14 km altitude (a) and the relative difference between V8 and V5 of CFC-12 at 14 km (in terms of 100 ⋅ (V8 − V5) V5) (b). For details, see Fig. 5.
These changes are in consonance with previous validation studies which confirmed that V5 CFC-12 was already a reliable data set (Eckert et al., 2016). While comparisons to reference data below 20 km remained inconclusive (see Eckert et al., 2016, their Fig. 31), they seemed to agree on a low bias of MIPAS V5 CFC-12 increasing rapidly to −6 % at 25 km and −30 % at 32 km. The difference CFC-12 V8 − V5, developing from negative values at the tropopause to about +4 % at 25 km, corrects the CFC-12 data record in the right direction. In the upper part of the profiles, V8 data exhibit fewer areas with negative mixing ratios. This is attributed to the new diagonal term in the regularization matrix which constrains the retrieval at the uppermost altitudes as described in Sect. 3.1. This additional regularization leads to smaller diagonal values of the averaging kernel matrices at higher altitudes. Profile points with diagonal values below our threshold of 0.03 are thus more frequent, and therefore the new data cover a smaller altitude range than version V5. However, in the nominal range (up to 30–45 km, depending on latitude; see Fig. 4a) the vertical resolution and retrieval uncertainty due to noise in the spectra are similar to the V5 data version. Analysis of the differences between V5 and V8 time series (example given in Fig. 6) reveals that the steps between the FR and RR parts of the V8 CFC-12 data record have been reduced for some prominent cases in the V5 data set; however, in general, some biases between the two mission phases still remain in V8 data. Nevertheless, we consider the V8 data to be more realistic.
3.6 CFC-12 coarse-grid representation
Since the MIPAS standard results are generated with a regularizing retrieval, they include a certain amount of prior information, at least on the profile shape. Thus, quantitative use of these data requires consideration of averaging kernels. This often is an obstacle to the use of the data, and for certain applications, e.g. time series analysis, there is no obvious solution how varying averaging kernels can be dealt with. In order to facilitate the use of the MIPAS data, we make available an additional data product for FR and RR NOM measurements, where the data are transformed to a vertical grid coarse enough to remove the formal prior information from the data, following the method suggested by von Clarmann and Grabowski (2007) and von Clarmann et al. (2015). We provide the data as layer mean values around the following nominal pressures: 400, 250, 150, 100, 50, 30, 15, 7, 3, 1.5, and 0.5 hPa, both for FR and RR measurements (layer boundaries are 600, 350, 185, 122.5, 75, 40, 25, 12.5, 6, 2.5, 0.85, and 0.25 hPa). Since no regularization smooths the profiles, the vertical resolution in this representation is entirely defined by the grid width. With this representation we come as close as possible to the representation of trace gas distributions in Eulerian atmospheric models. This representation is provided in addition to the regular data product and is not meant to replace it.
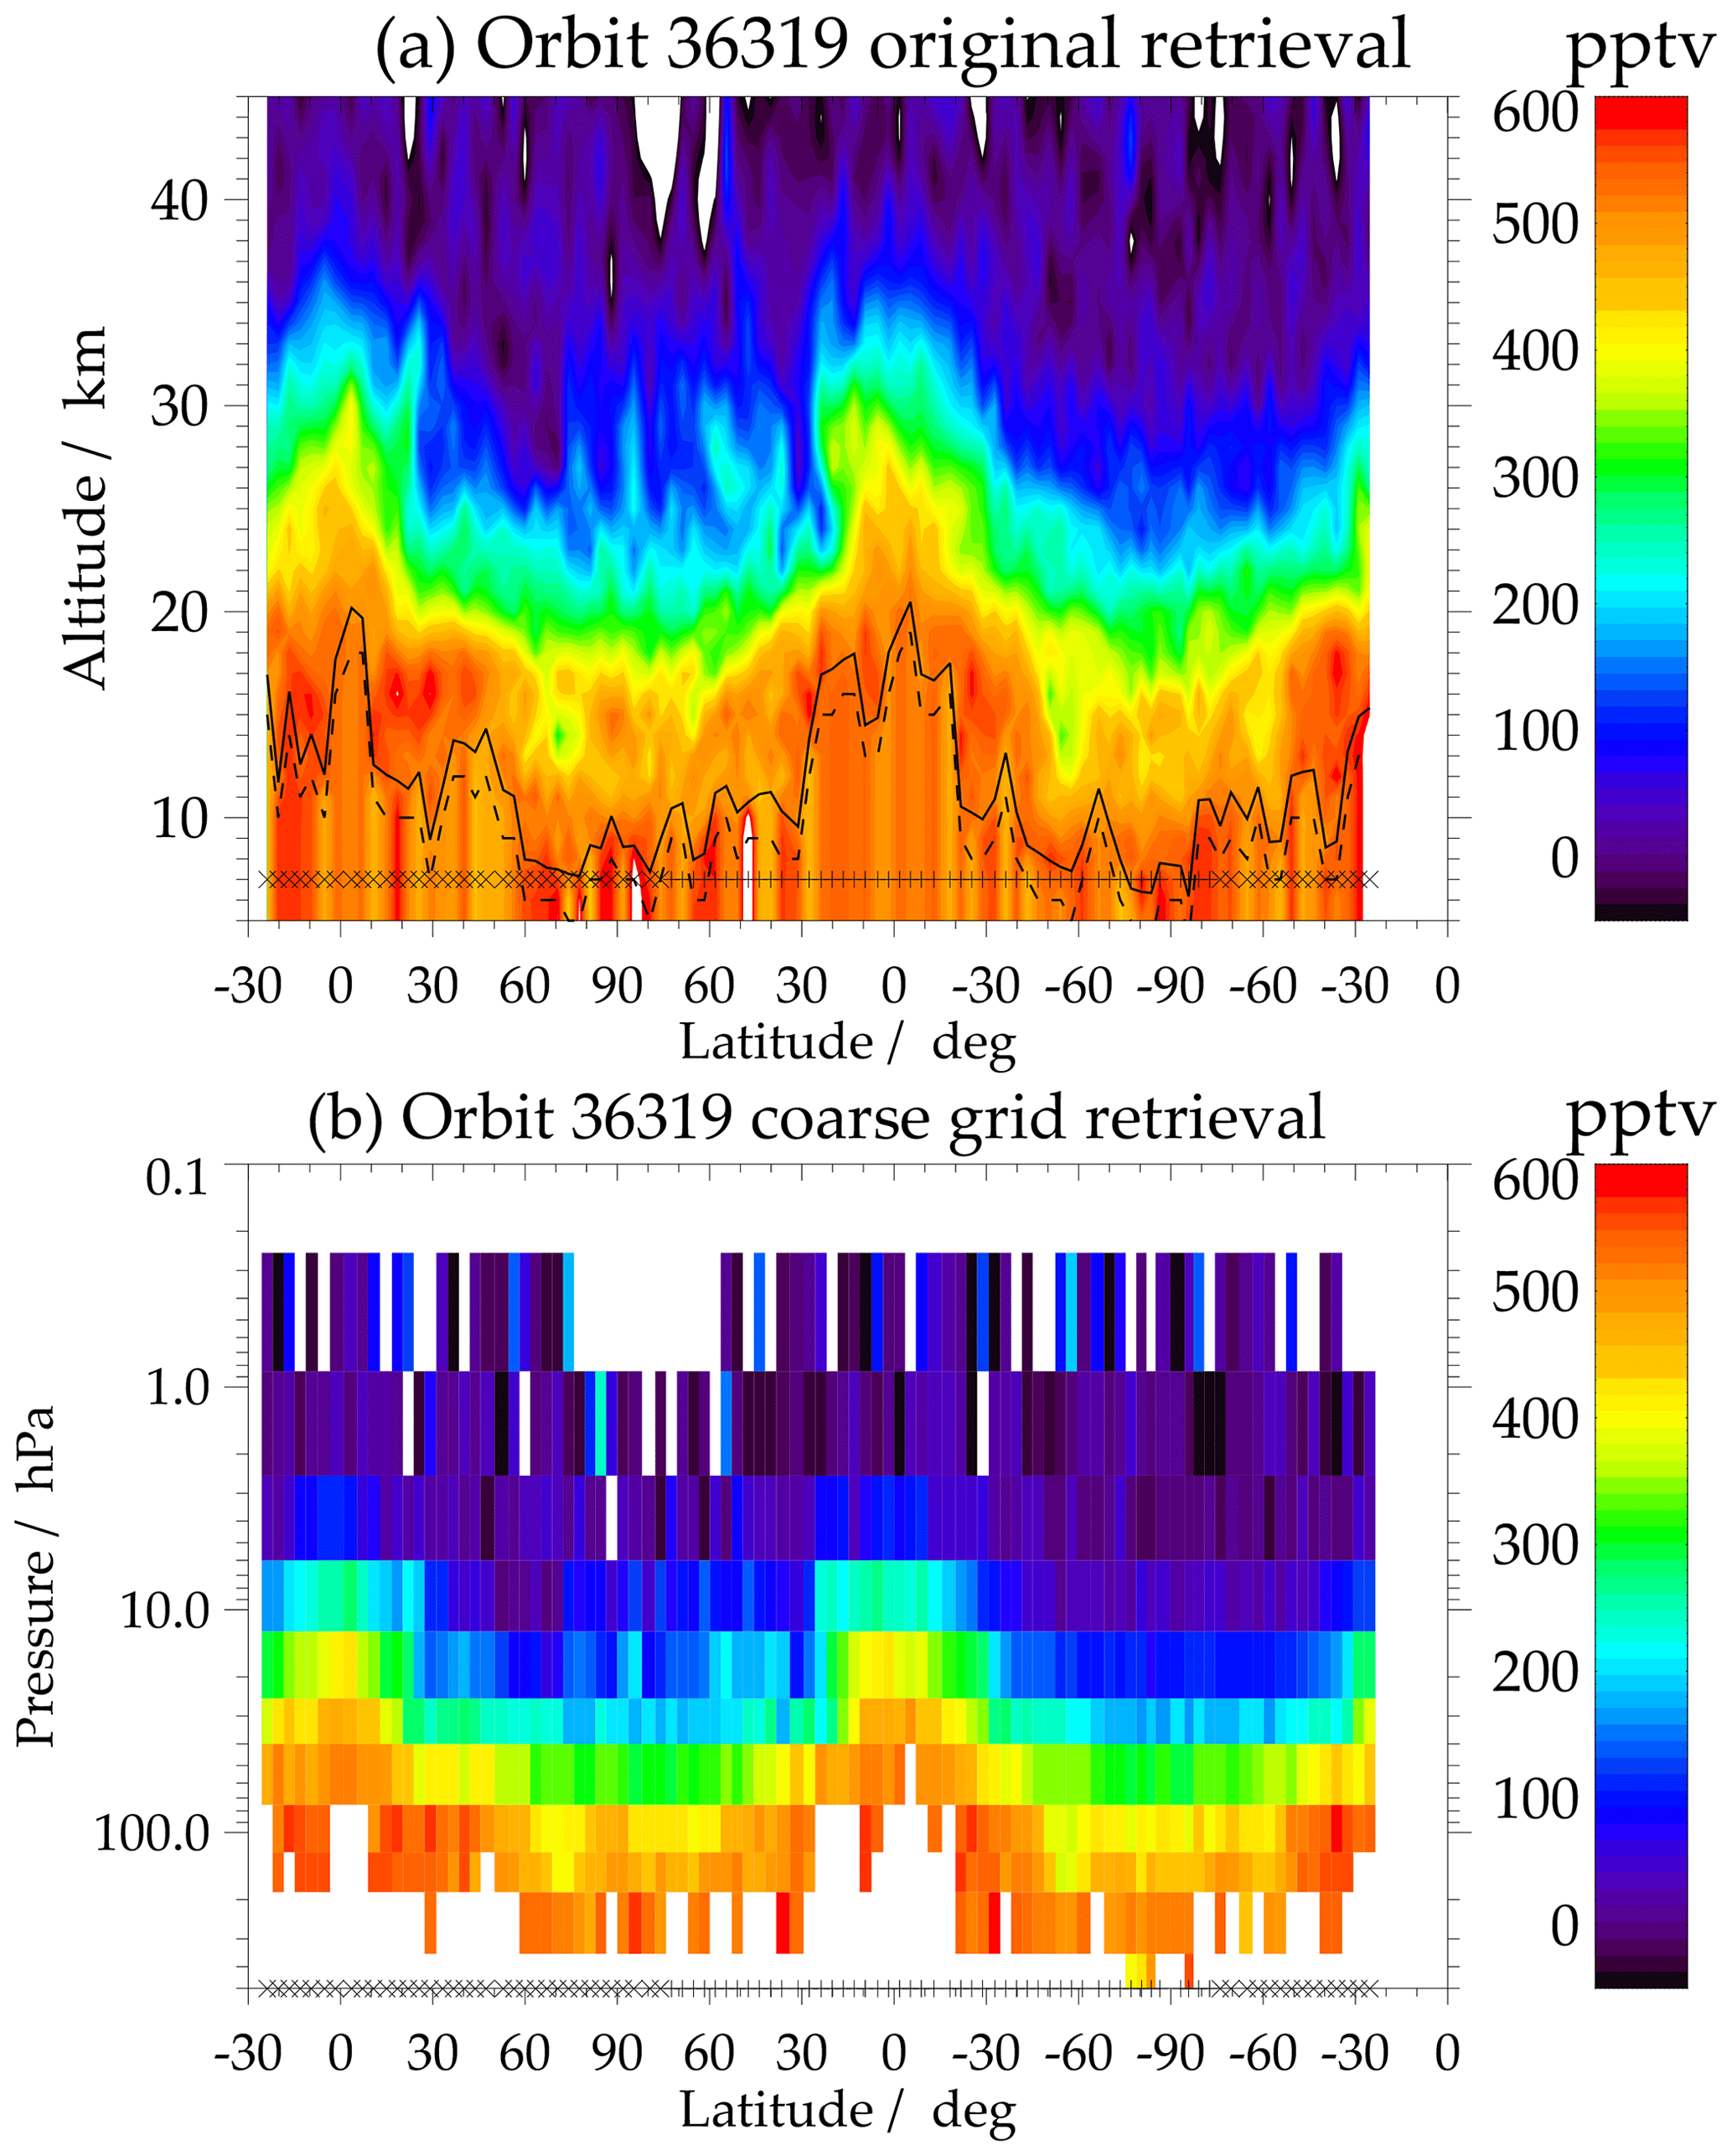
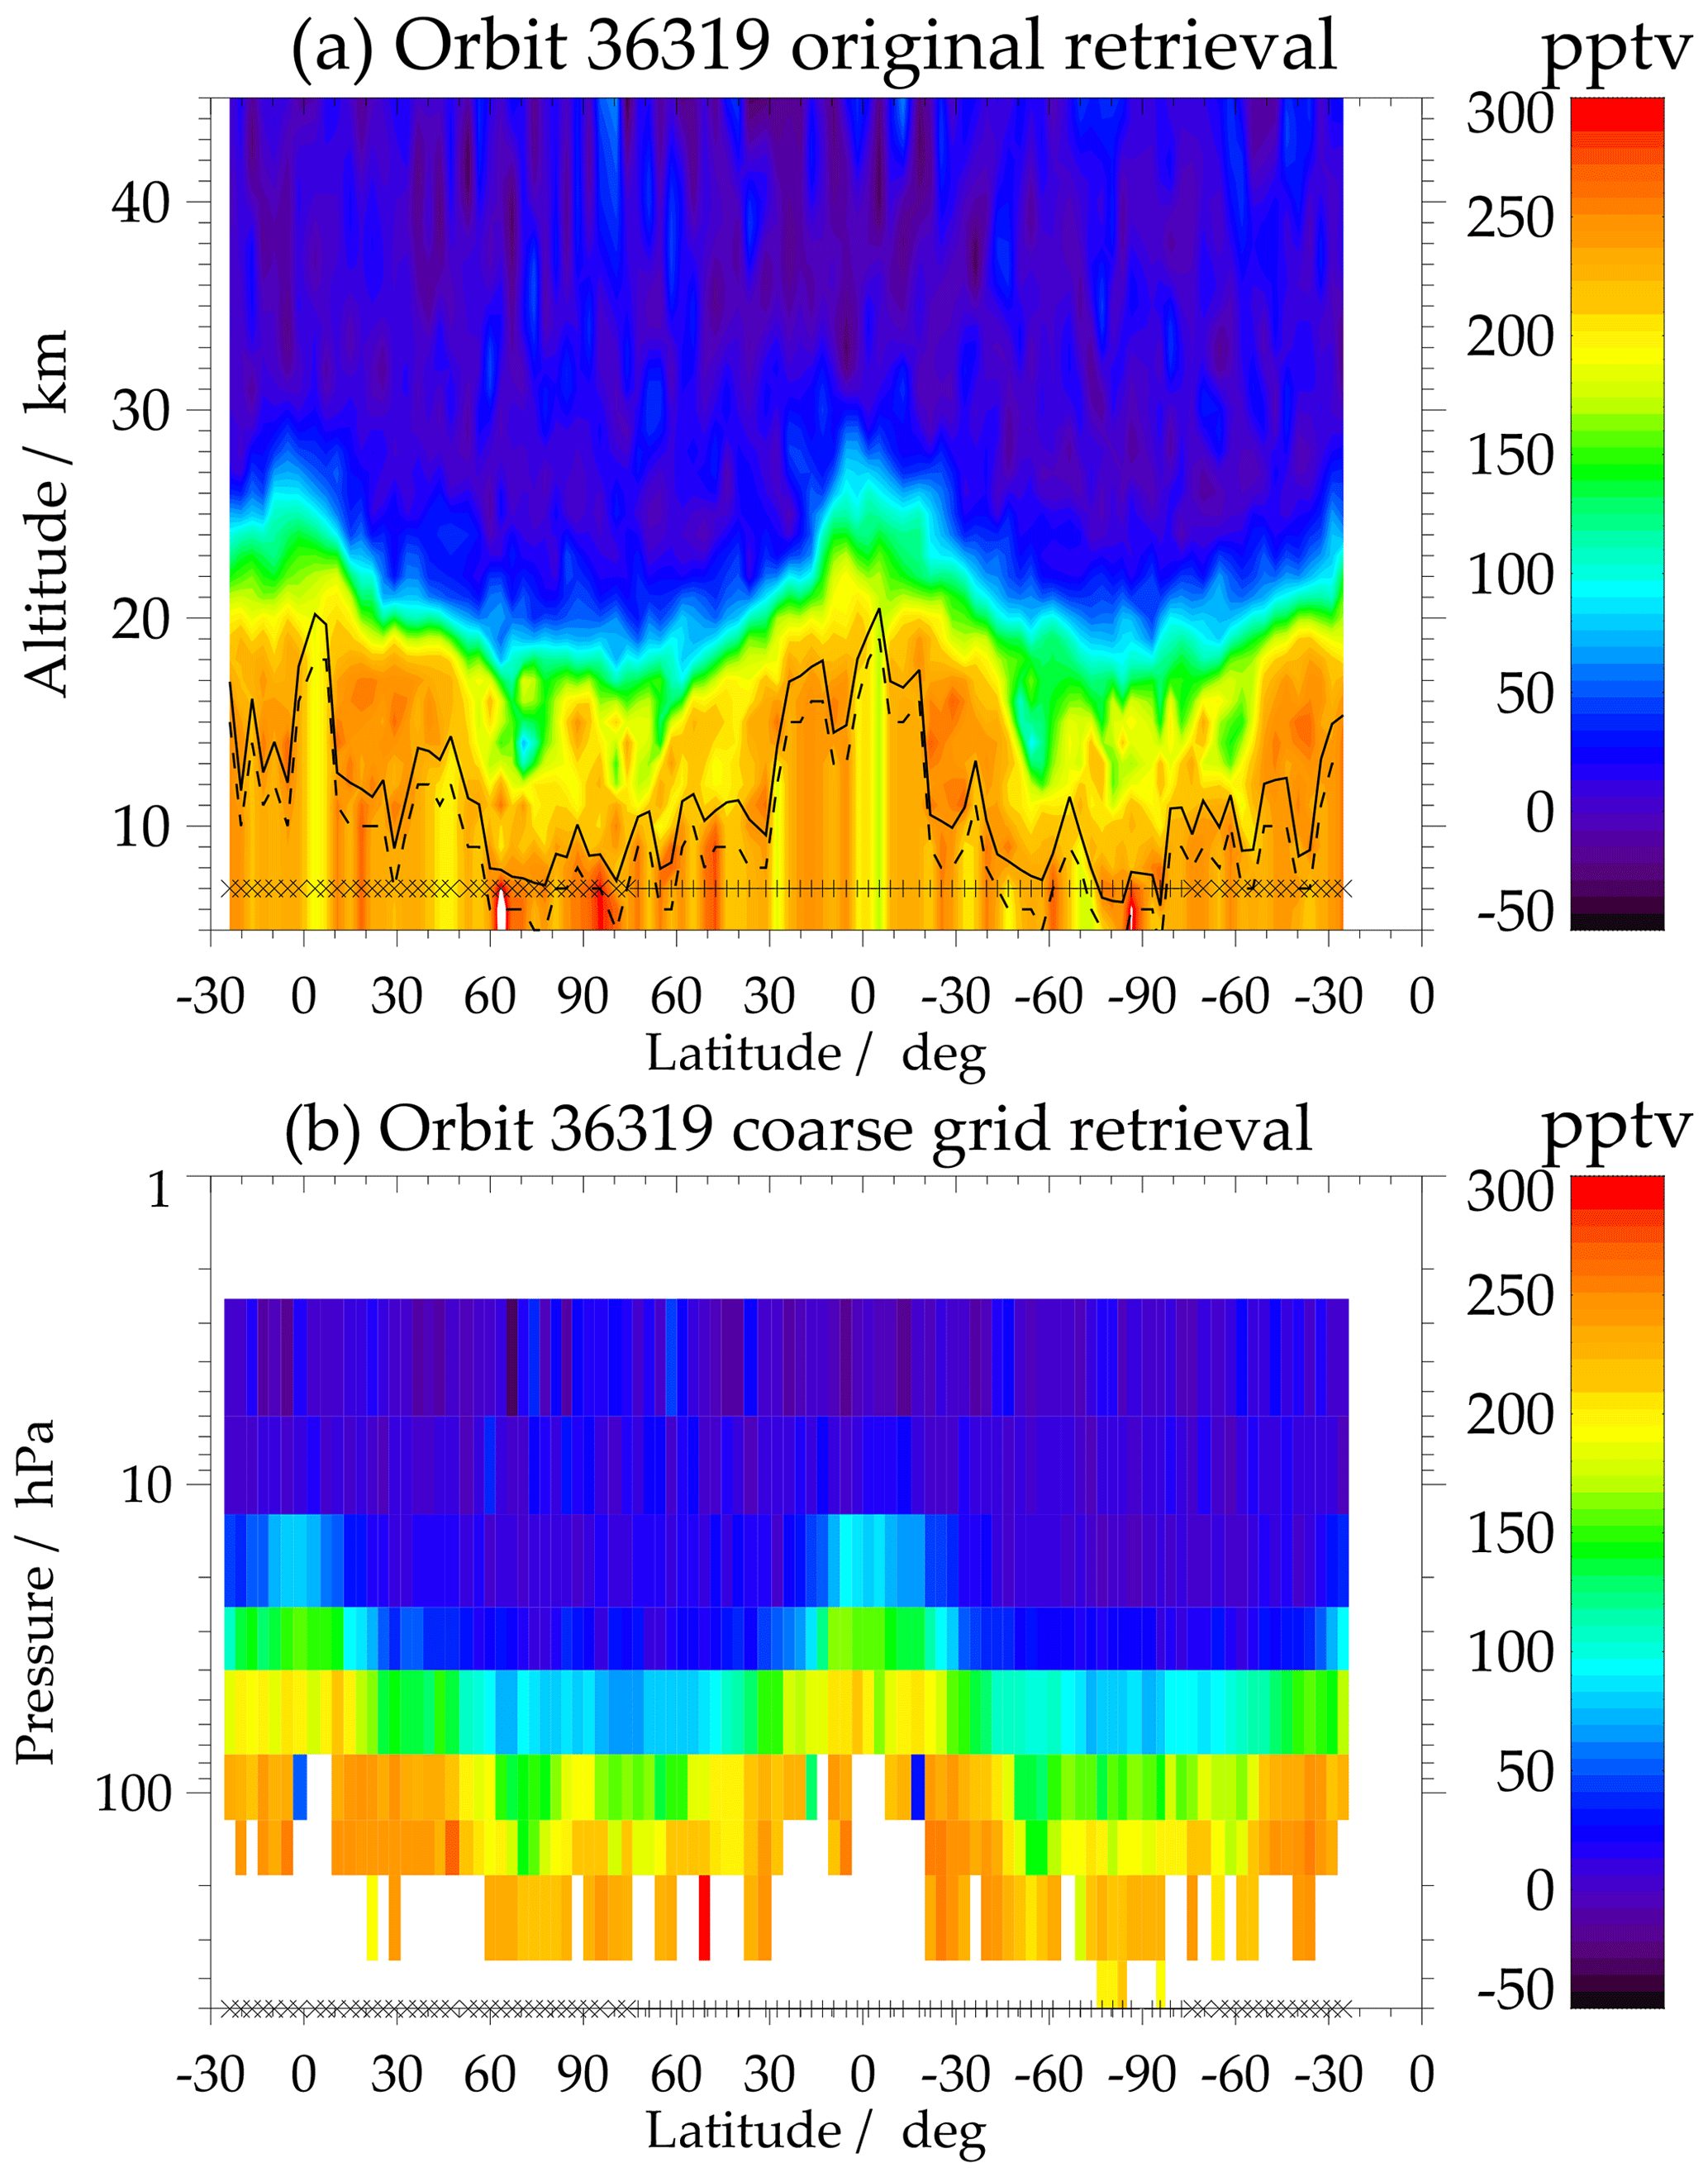
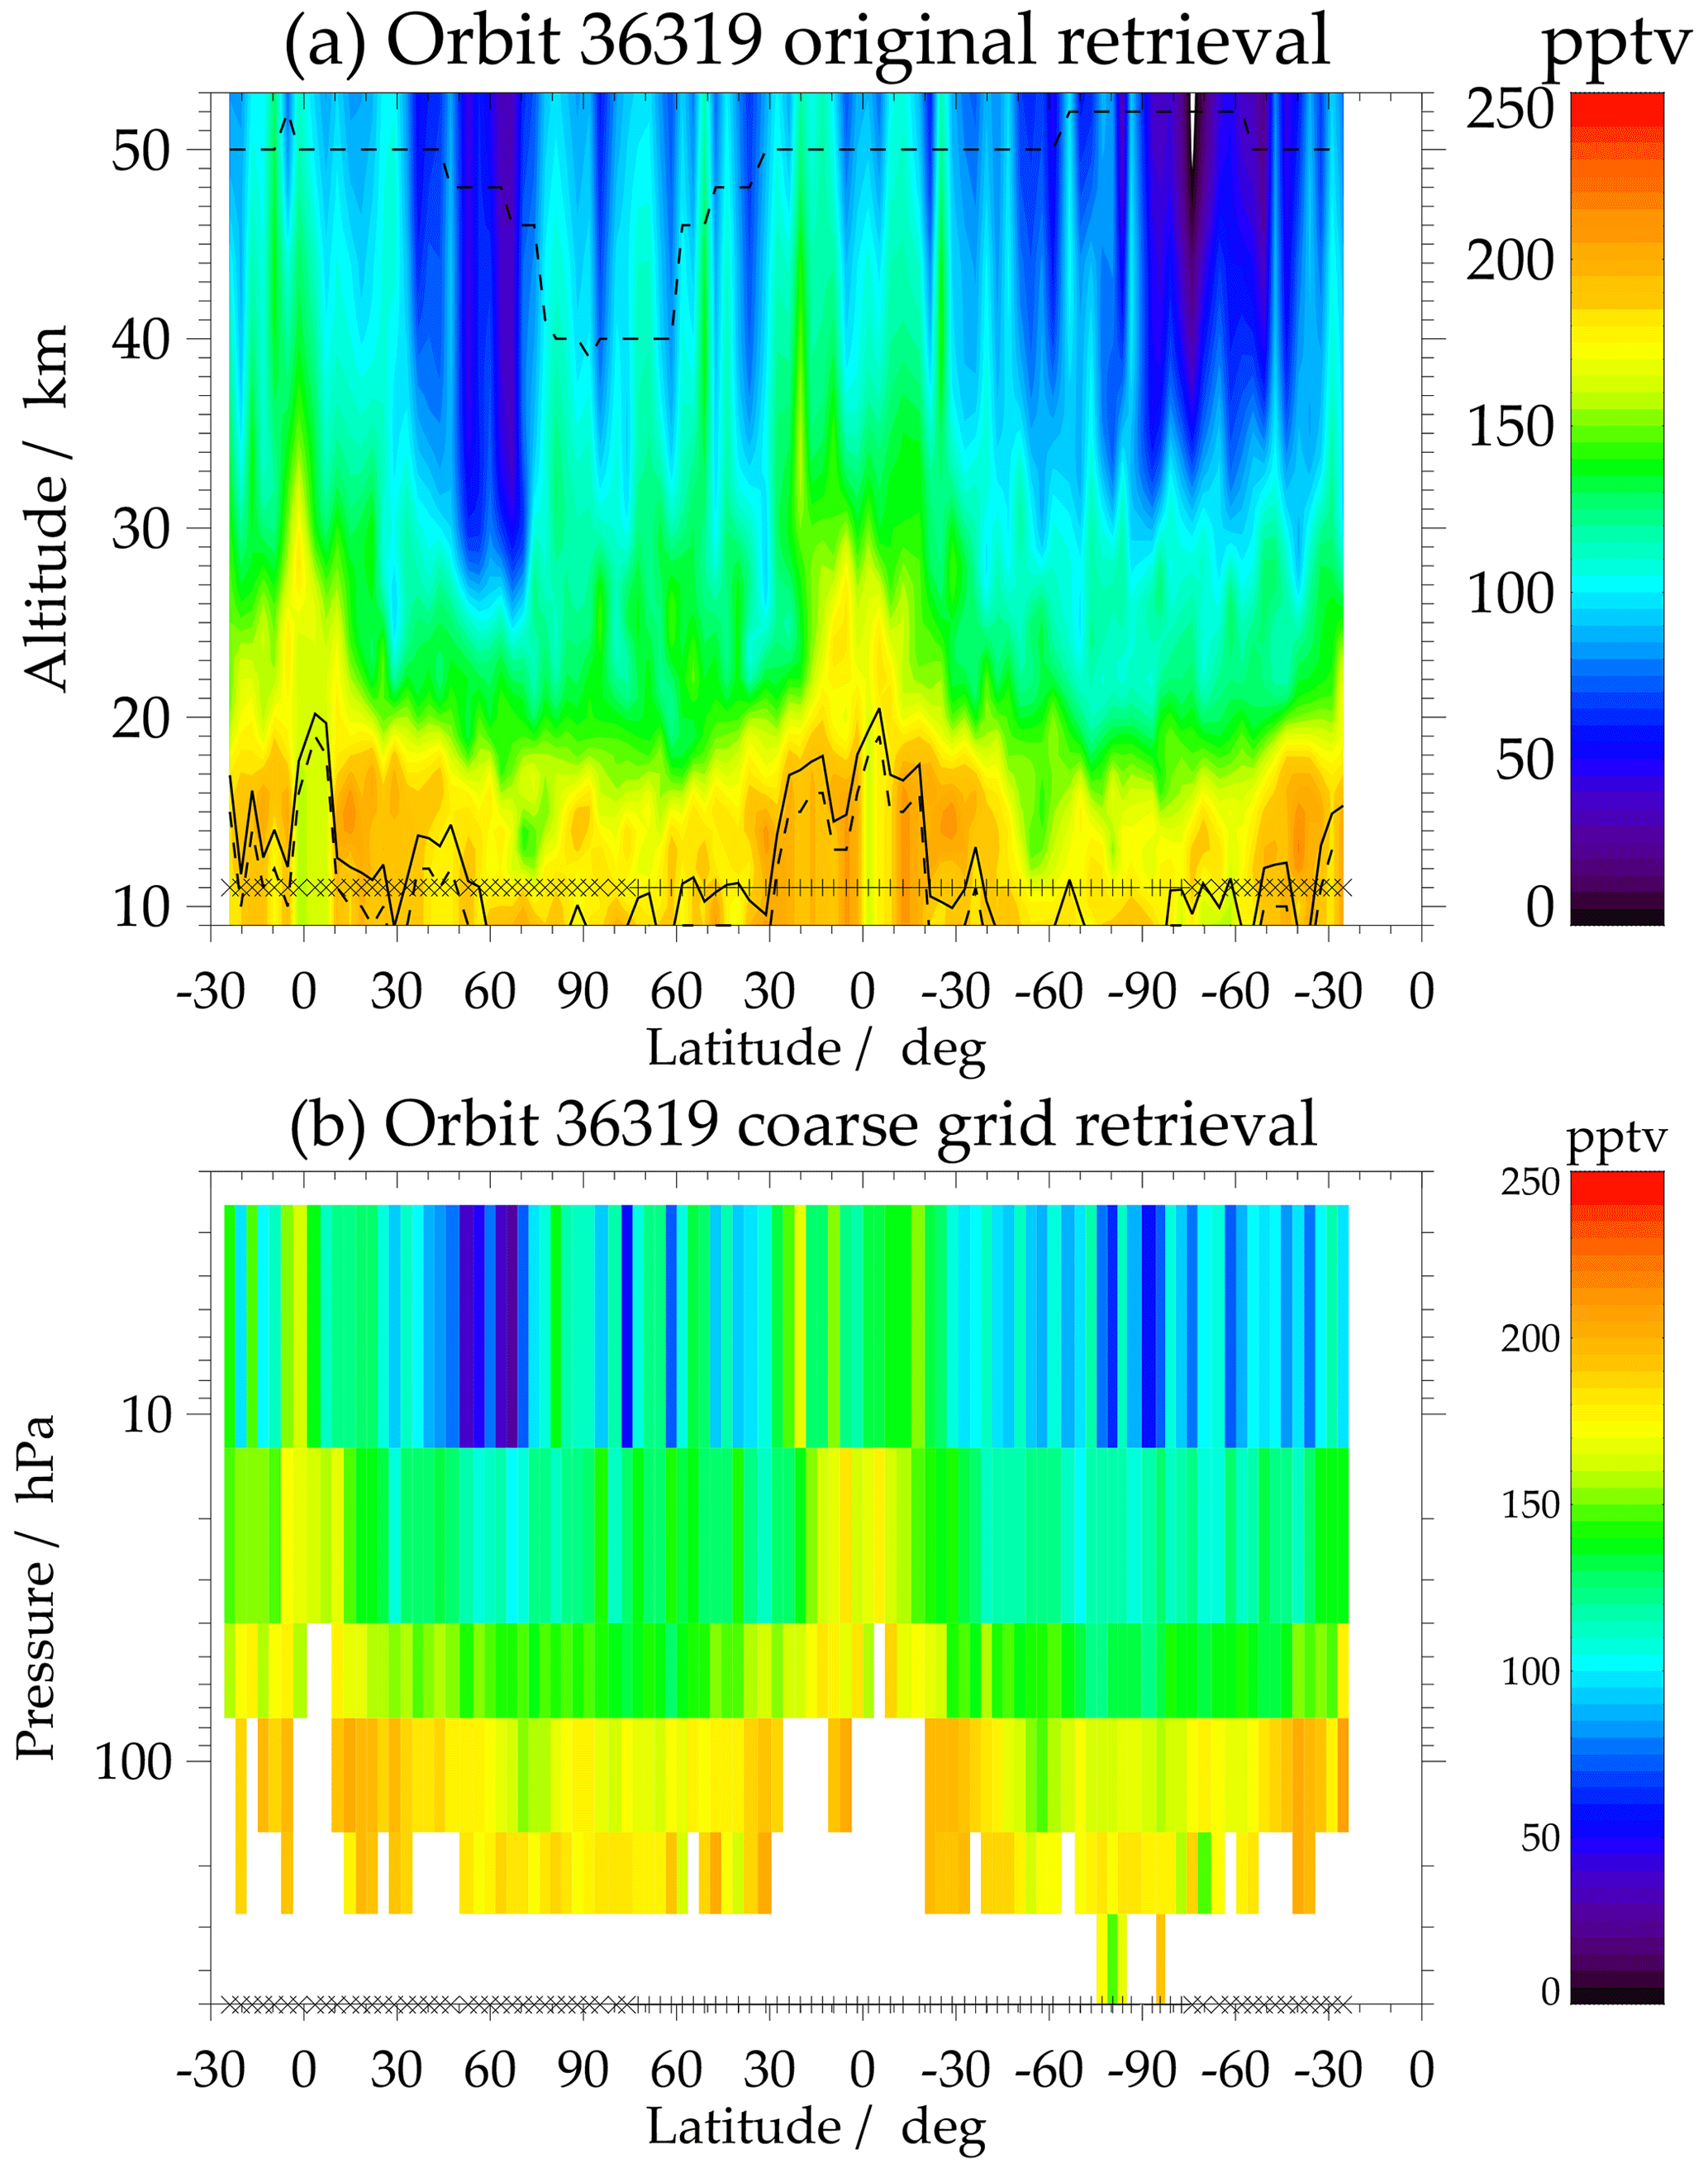
Figure 7CFC-12 distribution from orbit 36319, recorded on 9 February 2009. Panel (a) shows the regular retrieval, while panel (b) shows the results after transformation to the coarse grid. Crosses and plus signs at the bottom of the panels indicate nighttime and daytime measurements, respectively. The orbit starts at about 30° S, crosses the Equator in the direction of the North pole, crosses the Equator again in the direction of the South pole, and closes the circle at 30° S. White areas indicate missing data. The solid black line in (a) shows the central beams of the lowest tangent used, while the dashed line shows the limit of sensitivity, expressed by the averaging kernel diagonal element of the respective retrieval level < 0.03.
An example of a CFC-12 coarse grid representation is shown in Fig. 7. While the regular retrieval (Fig. 7a) is richer in details, the coarse grid representation offers the advantage that no averaging kernels are needed for quantitative work with the data and that the vertical resolution is fully defined by the pressure grid and does not change with time. However, there is a price to pay: the vertical grid has to comply with the coarsest resolution of the entire set of measurements and is thus too coarse to represent the independent pieces of information of a profile recorded under more favourable conditions.
The validation of the previous data version of CFC-11 by Eckert et al. (2016) and Zhou et al. (2016) showed, in essence, good structural agreement between MIPAS V5 CFC-11 profiles and those from other instruments. However, a slight tendency of MIPAS towards a high bias of +5 % to +20 % at the lower ends of the profiles was determined, as well as some isolated non-plausible features, such as a pronounced volume mixing ratio maximum near the tropical tropopause and volume mixing ratios increasing towards the poles at lower altitudes.
4.1 The retrieval of CFC-11
The general retrieval setup used for CFC-11 resembles that of CFC-12 described in the previous section, including the treatment of the background continuum and the additive radiance offset and regularization, the a priori profile, the altitude grid of the retrieval, and the use of two-dimensional temperature fields. CFC-11 is retrieved after CFC-12 and ClO (Glatthor et al., 2024). Hence, their concentrations and those retrieved before CFC-12 are available (see Fig. 1). For practical reasons, NO concentrations were also retrieved before those of CFC-11, although these are not needed for the retrieval of CFC-11.
For the retrieval of CFC-11, the spectral interval from 831.0 to 853.0 cm−1 was chosen, which includes a major part of the CFC-11 ν4 band. The description of the continuum and offset treatment in Sect. 3.1, the vertical grid, and technical details of the altitude dependence of the regularization also holds for the retrieval of CFC-11. Besides CFC-11, mixing ratios of H2O, HNO3, and COCl2 were jointly retrieved. H2O and HNO3 have been retrieved earlier in the retrieval chain, but, in order to avoid problems with inconsistencies of spectroscopic data in the CFC-11 analysis window and analysis windows where these interferents were retrieved, it was decided to treat them as unknowns, using the pre-retrieved values as a priori (Fig. 1).
COCl2 is a co-retrieved target in its own right, and retrieval-related issues will be discussed in a separate paper. Its relevance as interferent in the CFC-11 retrieval was first reported by Toon et al. (2001). For this interferent, the spectroscopic data by Kwabia-Tchana et al. (2015) are now used. For CFC-11 we have switched from the spectroscopic cross-section data provided by Varanasi (1992a) to those measured by Harrison (2018). Further interferents we have considered in the radiative transfer calculations but not fitted are C2H2, C2H6, CO2, HCN, HNO4 (RR only), NH3, OCS, PAN, CFC-113, CFC-114, and HCFC-22. For C2H2, C2H6, HCN, HNO4, OCS, PAN, CFC-113, and HCFC-22, profiles from the V5 data version were used. For MA, we used climatologies built from V5 FR and RR results instead of individual profiles, since MA observations of these gases had not been processed for V5. For CO2, NH3, and CFC-114, profiles from our climatological database (Kiefer et al., 2002, and updates thereof) were used.
As opposed to version V5 where we used spectra up to a tangent altitudes of 30 km only for the retrievals, for version V8 we used all spectra of a limb sequence in FR and RR observation mode and spectra up to tangent altitudes of 75 km in the MA observation mode. The vertical retrieval grid is the same as for CFC-12: surface (0 km); 4 to 60 km with a 1 km grid width; and additional levels at 62, 64, 66, 68, 70, 75, 80, 90, 100, and 120 km. The retrieval of CFC-11 has been performed along the description above for MIPAS data from the NOM(FR), NOM(RR), UTLS(RR), and MA(RR) observation modes level 1b data.
4.2 The CFC-11 error budget
Uncertainties relevant to the CFC-11 error budget for the example of northern mid-latitude summer daytime conditions are summarized in Tables 5–7, for the FR, RR, and MA observation modes, respectively. The main differences with respect to the uncertainties affecting the CFC-12 retrieval are calibration uncertainties that have to be considered only for the MIPAS A band; different lists of interfering species; and mixing ratios of more species are available from V8 processing, since CFC-11 holds a later position in the sequential retrieval chain.
Kleinert et al. (2018)Kleinert et al. (2018)Kleinert et al. (2018)Kleinert et al. (2018)(Kiefer et al., 2021)Hase (2000, 2003)(Kiefer et al., 2021)(Kiefer et al., 2021)(Kiefer et al., 2021)(Kiefer et al., 2021)(Kiefer et al., 2021)(Kiefer et al., 2021)(Kiefer et al., 2021)(Kiefer et al., 2021)(Kiefer et al., 2021)(Kiefer et al., 2021)(Kiefer et al., 2021)(Kiefer et al., 2021)(Kiefer et al., 2021)(Kiefer et al., 2021)(Kiefer et al., 2021)(Kiefer et al., 2021)(Glatthor et al., 2007)(Glatthor et al., 2009)(Kiefer et al., 2021)(Glatthor et al., 2024)(Stiller et al., 2024)(Glatthor et al., 2009)(Funke et al., 2024)(Kiefer et al., 2002)(Kiefer et al., 2023)(Glatthor et al., 2017)(Glatthor et al., 2007)(Kiefer et al., 2002)Harrison (2018)Table 5Assumed uncertainties for northern mid-latitude summer daytime conditions affecting the retrieval of CFC-11 (FR).
See footnotes of Table 1 for details on the contents of the columns.
Table 6Assumed uncertainties for northern mid-latitude summer daytime conditions affecting the retrieval of CFC-11 (RR).
See footnotes of Table 1 for details on the contents of the columns.
Table 7Assumed uncertainties for northern mid-latitude summer daytime conditions affecting the retrieval of CFC-11 (MA).
See footnotes of Table 1 for details on the contents of the columns.
Resulting CFC-11 estimated errors are presented in Fig. 8. Again northern mid-latitude summer daytime conditions have been chosen as an example. All that has been said here about the CFC-12 error budget also applies to CFC-11 errors.
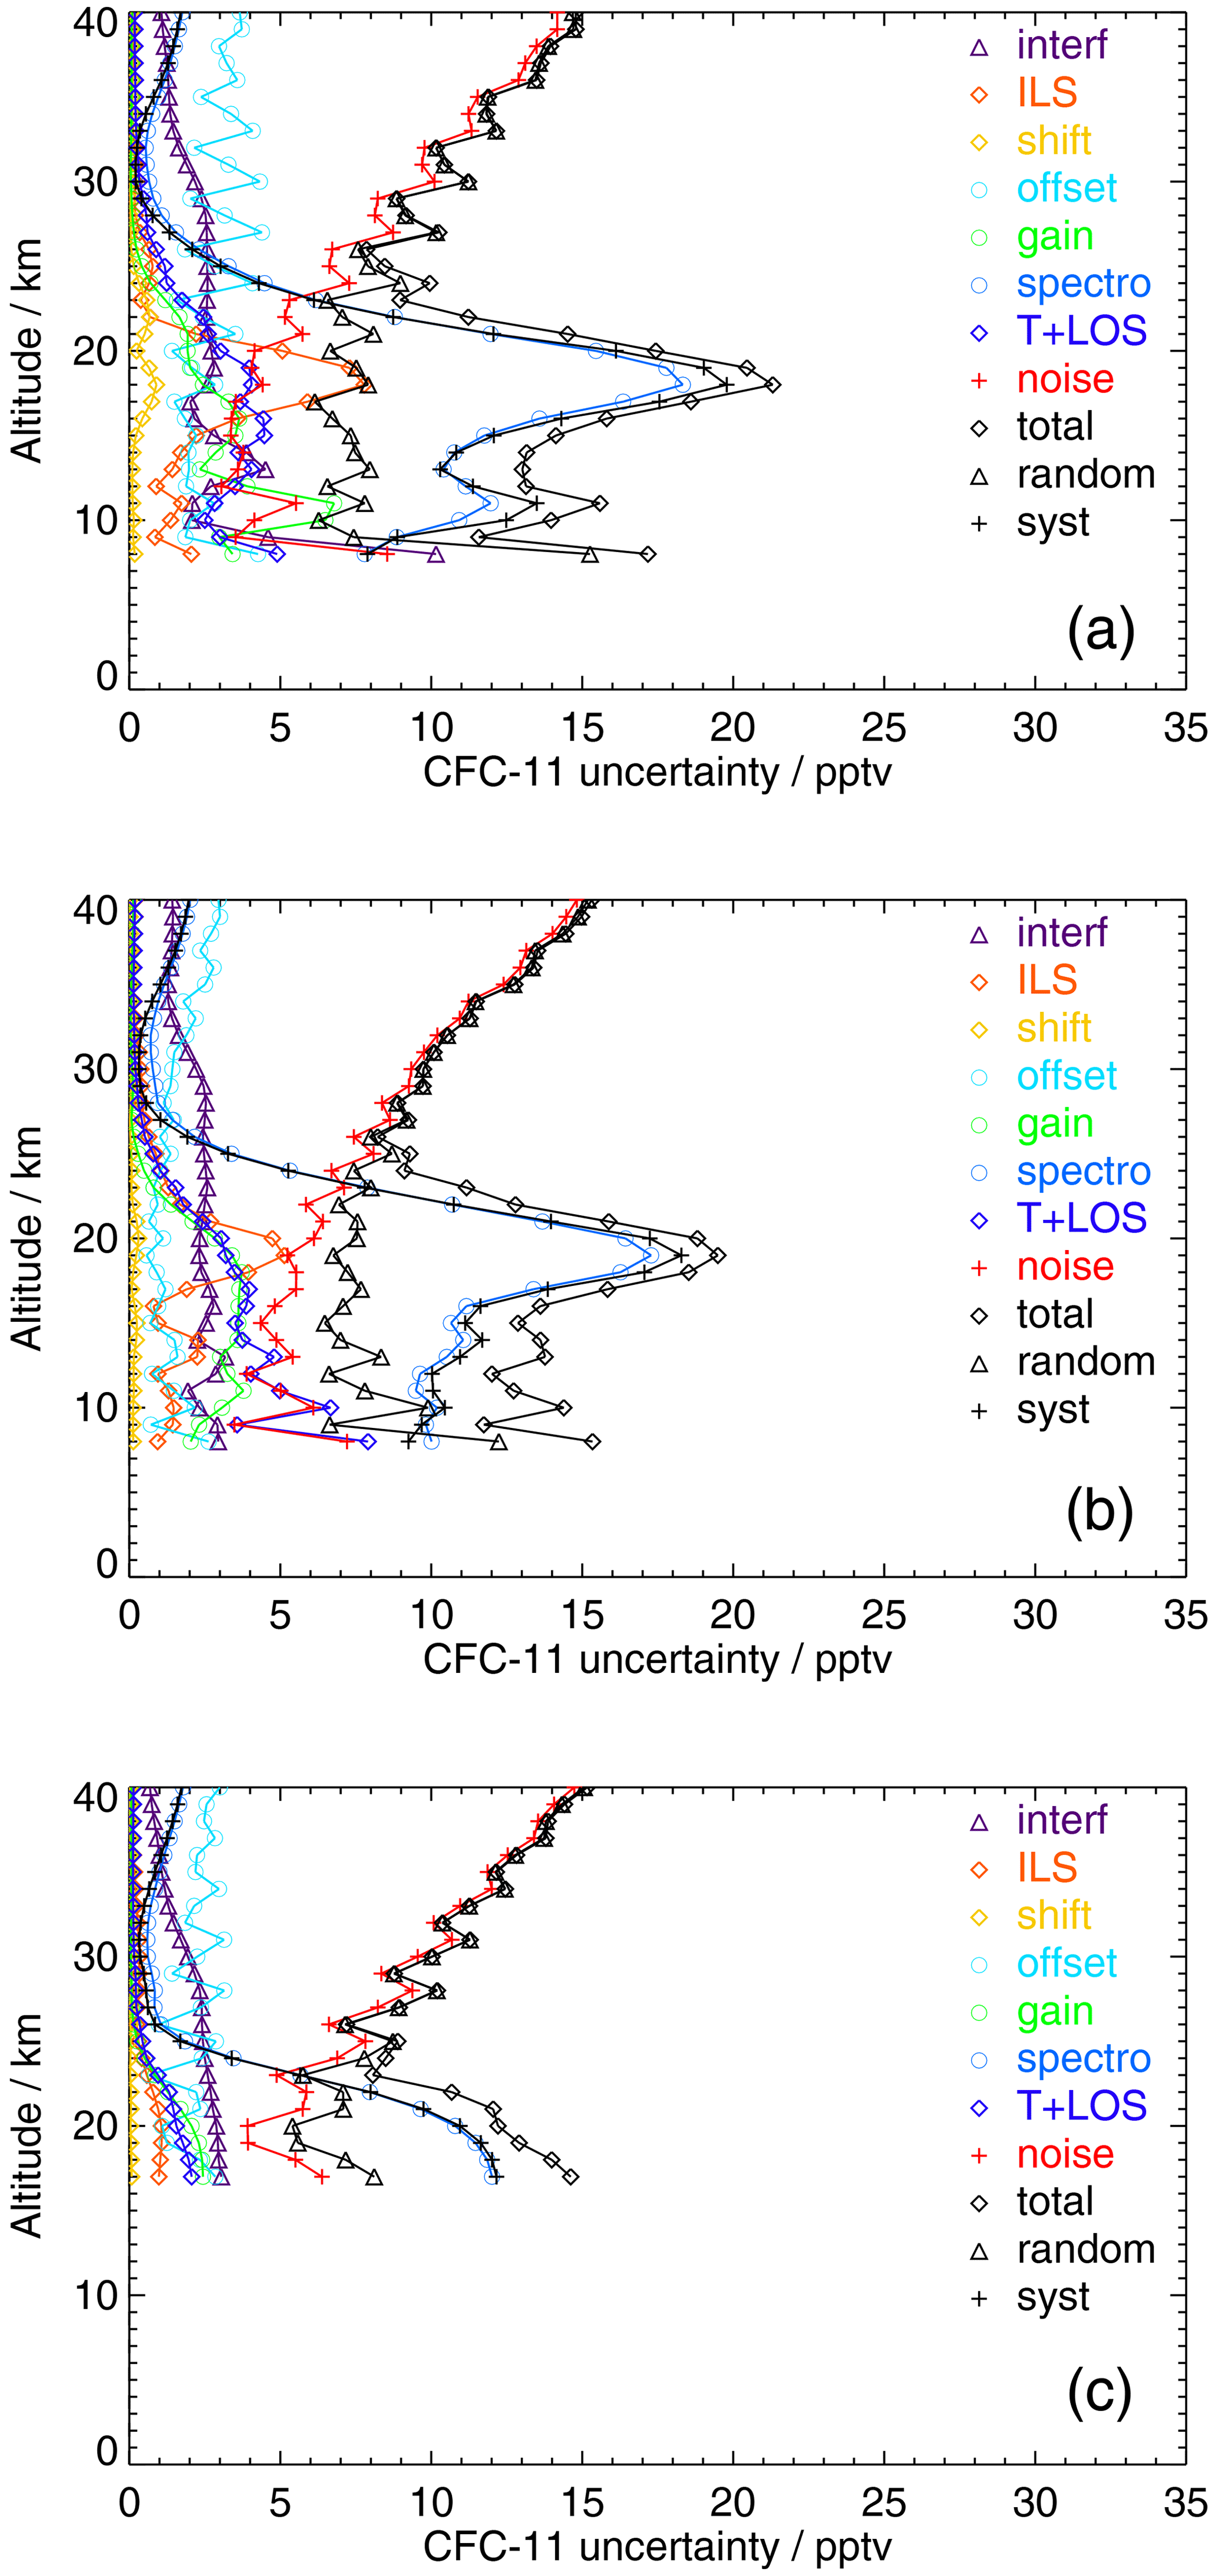
Figure 8Uncertainties of CFC-11 mixing ratios retrieved from MIPAS FR (a), RR (b), and MA(c) measurements for northern mid-latitude summer daytime conditions.
The error budgets for all atmospheric conditions and the FR and RR observation modes are presented as tables and figures in the Supplement file S1 to this article.
4.3 The CFC-11 vertical averaging kernels
All that has been said here on the purpose of vertical averaging kernels in the context of CFC-12 also holds for CFC-11, whose vertical averaging kernels are shown in Fig. 9.
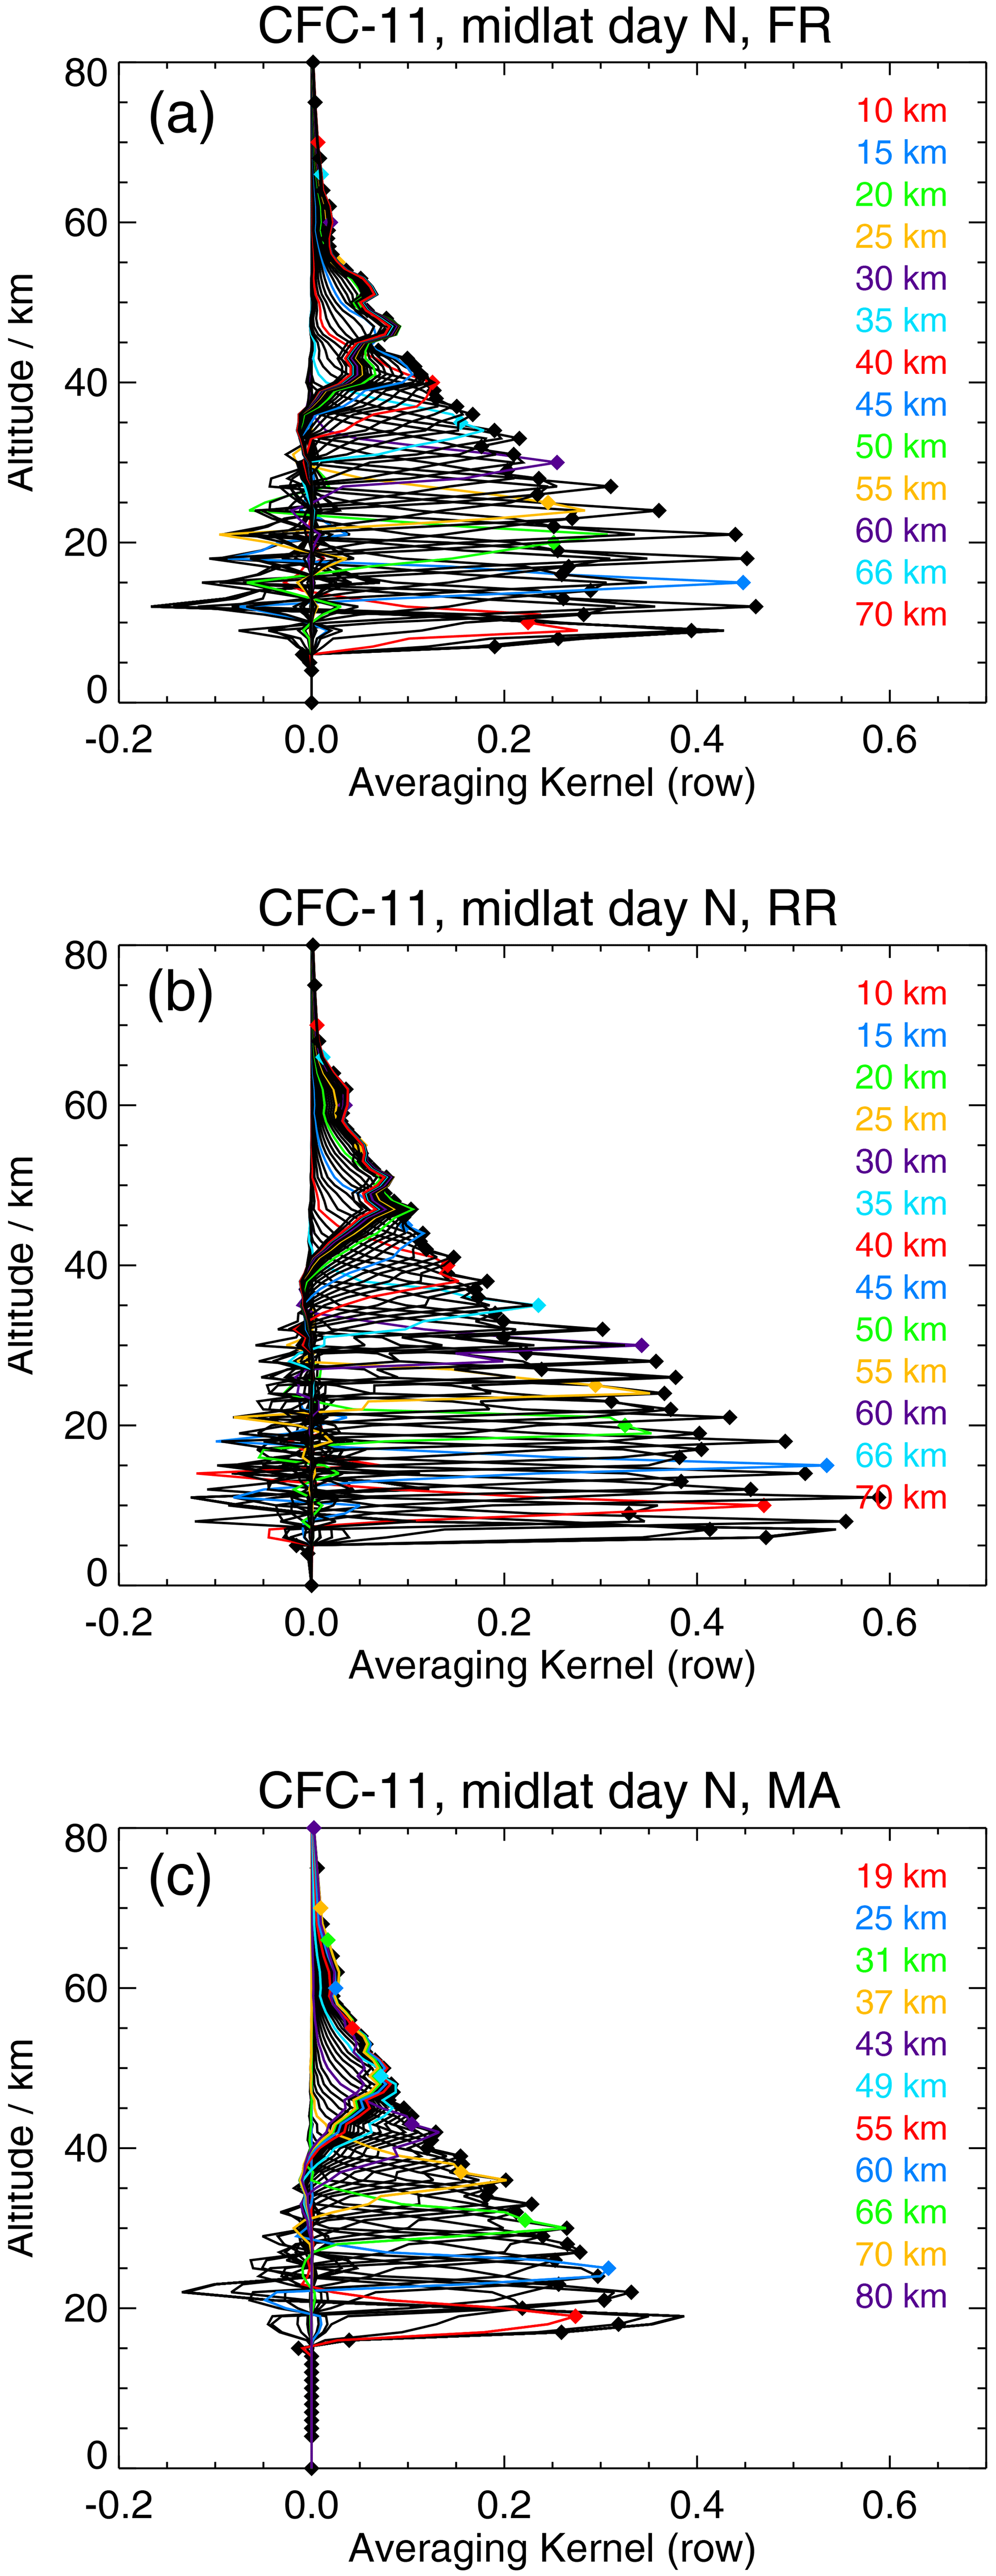
Figure 9Averaging kernels of northern mid-latitude daytime CFC-11 FR (a), RR (b), and MA (c) measurements. These averaging kernels refer to limb sequences recorded at 46.1° N, 155.1° W on 14 January 2003 (a); 48.4° N, 116.4° W on 4 January 2009 (b); and 48.0° N, 179.65° E on 11 January 2009 (c). Every fifth averaging kernel row is marked by colour, and the diamonds mark the altitude of the retrieval grid point.
Similar to CFC-12, the vertical resolution is on the order of 2 km in the lower stratosphere and deteriorates towards higher altitudes. Up to about 40 km the averaging kernels peak at their nominal altitudes, while some vertical information displacement takes place above this altitude. FR and RR averaging kernels are roughly consistent, with a tendency in RR measurements towards a better vertical resolution.
4.4 The CFC-11 horizontal averaging kernels
CFC-11 horizontal averaging kernels were calculated in the same way as those of CFC-12. Horizontal smearing and information displacement are summarized in Table 8 for selected altitudes. All said for the horizontal information distribution of CFC-12 also applies to that of CFC-11. The displacements are small, and the horizontal smearing exceeds the horizontal sampling by small amounts only (if any).
4.5 CFC-11 results
Compared to CFC-12, the differences between V8 and V5 CFC-11 mixing ratios are larger. Test retrievals with V5 spectra, for which only the spectroscopic data were exchanged, everything else unchanged, led to a reduction of about 4 % over the altitude range of the profiles up to ∼ 25 km. Additional changes in parameters (new level-1b data, the 2D temperature field, better information on pre-fitted constituents or a priori information on interferents) contributed another 2 % to 5 % of difference between V5 and V8 CFC-11 (see Fig. 10). The differences between V8 and V5 data of CFC-11 vary strongly with latitude and altitude. In the lower part up to about 16 km altitude differences as shown in Fig. 10 are typical: negative differences up to −5 % at high latitudes and in the inner tropics and positive differences up to 5 % in the mid-latitudes; further, the positive differences of V8 in the mid-latitudes increase over time, which leads to a reduction in the previously detected negative trend in these regions (Kellmann et al., 2012). Suspiciously high CFC-11 abundances in polar spring in V5 data are removed in the V8 data. Towards higher altitudes, the pattern of differences changes gradually to a high bias of up to 5 % in the tropics, a low bias up to −40 % in the mid- to high latitudes, and occasionally even stronger negative biases in the polar winter vortices. Eckert et al. (2016) in general found a high bias of 5 % to 20 % at the lower end of the CFC-11 V5 profiles. Due to the strong latitude dependence of biases between V8 and V5 it is hard to come to an unambiguous conclusion whether V8 is an improvement or not. However, we note that the supposedly artificial maxima of the profiles in the tropical upper troposphere–lower stratosphere region are less pronounced in version 8 (see Fig. 4), and the suspicious volume mixing increase towards the poles in the lower part of the profiles of V5 CFC-11 (see Fig. 10, upper panel) is also less pronounced in version 8 data. Beyond this, version 8 covers a wider altitude range. The CFC-11 VMR biases between the FR and RR MIPAS mission phases are reduced for some prominent cases (see Fig. 10). However, the V8 CFC-11 data set still reveals steps between the FR and RR phase that are partly due to the different vertical resolutions caused by the differing vertical sampling in the two phases. Another characteristic of the V8 retrievals is a reduced regularization above 20 km in order to improve vertical resolution. This is now better than 3.5 km up to about 30 km altitude but deteriorates rapidly from there on. As a result, the retrieval uncertainty due to noise in the spectra increases from about 6 pptv below 16 km up to 10 pptv at 30 km and larger above (see Fig. 8, red line with crosses). In summary, we consider the V8 retrievals of CFC-11 as more reliable than V5.
4.6 CFC-11 coarse grid representation
For CFC-11 FR and RR NOM measurements, we also provide a data product sampled on a coarser vertical grid in order to support users who do not want to care about averaging kernels or for applications where the vertical resolution changing with time is an obstacle to quantitative data analysis. The same pressure grid as for CFC-12 has been chosen, both for CFC-11 FR and FR retrievals, however, we do not provide data above the layer around 3 hPa. The nominal layer pressures are 400, 250, 150, 100, 50, 30, 15, 7, and 3 hPa (layer boundaries are 600, 350, 185, 122.5, 75, 40, 25, 12.5, 6, and 2.5 hPa). An example of a CFC-11 coarse grid representation is shown in Fig. 11. In contrast to the regular representation of the data (Fig. 11a), which shows more details, the coarse grid representation has the advantage that the vertical resolution is constant for all geolocations and that the user does not have to take averaging kernels into account.
Previous results of the retrieval of HCFC-22 volume mixing ratios were published by Chirkov et al. (2016). HCFC-22 data of version V5R have been used to study transport and mixing within the Asian summer monsoon anticyclone (Vogel et al., 2016, 2019). This data version has been found to suffer from a high bias with respect to in situ cryogenic air sampler data under tropical and northern polar winter conditions of 15 to 50 pptv below 24 km. Above 28 km, the high bias was reduced to less than 10 pptv in the V5R data version. The validation of the V5R data record remained inconclusive, since within comparisons to ACE-FTS profiles (Chirkov et al., 2016) and ground-based Fourier transform spectroscopic measurements at Réunion Island (Zhou et al., 2016) and Jungfraujoch (Prignon et al., 2019), good to excellent agreements between the respective data sets were found (within ±10 pptv compared to ACE-FTS; within ±5 % for the ground-based observations at Réunion Island; and within differences in the order of 5 %, however insignificant due to large error bars, for Jungfraujoch). The high bias to in situ measurements on one hand and good agreement within remote sensing observations on the other hand may give a hint towards a bias of the spectroscopic data used. All remote sensing instruments cited here used the same spectral signature of HCFC-22 and are based on the same spectroscopic data. For MIPAS V5R and ACE-FTS v3.5, cross-section data from Varanasi (1992b) and Varanasi et al. (1994), provided via the HITRAN database (Rothman et al., 2003, 2005), were directly used. The ground-based observations relied on a pseudo-line list generated by Geoffrey Toon (Prignon et al., 2019) and based on the same cross-sections measured by Varanasi et al. (1994) and on laboratory data by McDaniel et al. (1991). Another shortcoming of the V5R data set was the rather coarse vertical resolution, with 3.5 km at 10 km altitude and continuously increasing to 10 km at 34 km altitude (Chirkov et al., 2016).
5.1 The retrieval of HCFC-22
With respect to the general settings, i.e. the joint retrieval of the background continuum and radiance offset, the new regularization, the a priori profile, the vertical retrieval grid, and the use of a 2D temperature field, the V8 retrieval of HCFC-22 uses the same approach as chosen for CFC-11 and CFC-12. Beyond the interfering species mentioned under CFC-11, the retrieval of HCFC-22 is preceded by the retrieval of HNO4 and C2H6 whose concentrations are thus available for the forward calculations in the HCFC-22 retrieval. Beyond these, the following interferents are considered, whose mixing ratios are available from the version 5 processing: OCS, HCN, C2H2, COF2 (FR only), CCl4, CFC-113 and PAN. Only for CO2, NH3, CHCl3, C2H4, and CFC-114 concentrations from the initial guess database by Kiefer et al. (2002, and updates thereof) had to be used (Fig. 1). V5 COF2 volume mixing ratios are available for FR only. For RR and MA, climatological mean values were constructed from V5 FR data and used for RR and MA retrievals. In addition, climatologies built from V5 NOM observations were also used for C2H2, C2H6, CCl4, HCN, OCS, PAN, and CFC-113 in the MA retrievals.
The following HCFC-22-specific upgrades were performed with respect to the retrieval setup. Instead of the absorption cross-sections by Varanasi (1992b) and Varanasi et al. (1994) that were used in earlier data versions (Chirkov et al., 2016), we now use those by Harrison (2016). Besides other advantages, these better cover the low temperatures at pressures between 300 and 70 Torr (400 to 93 hPa).
Contrary to the preceding retrieval setup, now all four spectral signatures in the region of the ν4 and 2ν6 band region are used at all altitudes (microwindows are 803.50–804.75, 808.25–809.75, 820.50–821.125, and 828.75–829.50 cm−1). As for CFC-11 and CFC-12, the regularization matrix also contains a diagonal term at the uppermost altitudes for HCFC-22. The retrieval was performed on a vertical grid as follows: surface (0km); 4 to 44 km with a 1 km grid width, a 2 km spacing between 46 and 70 km, and further grid points at 75, 80, 90, 100, and 120 km. The retrieval of HCFC-22 has been performed along the description above for MIPAS data from the NOM(FR), NOM(RR), UTLS(RR), and MA(RR) observation modes.
5.2 The HCFC-22 error budget
Tables 9–11 summarize the uncertainties of input quantities of the HCFC-22 retrieval for northern mid-latitude summer daytime conditions. Again, similar to CFC-11, calibration uncertainties have to be considered only for the MIPAS A band for the HCFC-22 error budget, and due to HCFC-22's later position in the retrieval chain, V8 data from preceding retrievals are available for more interferents than for CFC-11 and CFC-12 .
Kleinert et al. (2018)Kleinert et al. (2018)Kleinert et al. (2018)Kleinert et al. (2018)(Kiefer et al., 2021)Hase (2000, 2003)(Kiefer et al., 2021)(Kiefer et al., 2021)(Kiefer et al., 2021)(Kiefer et al., 2021)(Kiefer et al., 2021)(Kiefer et al., 2021)(Kiefer et al., 2021)(Kiefer et al., 2021)(Kiefer et al., 2021)(Kiefer et al., 2021)(Kiefer et al., 2021)(Kiefer et al., 2021)(Kiefer et al., 2021)(Kiefer et al., 2021)(Kiefer et al., 2021)(Kiefer et al., 2021)(Glatthor et al., 2007)(Kiefer et al., 2002)(Eckert et al., 2017)(Kiefer et al., 2002)(Kiefer et al., 2021)(Glatthor et al., 2024)(Stiller et al., 2024)(Glatthor et al., 2009)(Kiefer et al., 2024)(Stiller et al., 2024)(Stiller et al., 2024)(Kiefer et al., 2002)(Funke et al., 2024)(Glatthor et al., 2017)(Kiefer et al., 2023)(Glatthor et al., 2007)(Kiefer et al., 2002)Harrison (2016)Table 9Assumed uncertainties for northern mid-latitude summer daytime conditions affecting the retrieval of HCFC-22 (FR).
See footnotes of Table 1 for details on the contents of the columns.
Table 10Assumed uncertainties for northern mid-latitude summer daytime conditions affecting the retrieval of HCFC-22 (RR).
See footnotes of Table 1 for details on the contents of the columns.
Table 11Assumed uncertainties for northern mid-latitude summer daytime conditions affecting the retrieval of HCFC-22 (MA).
See footnotes of Table 1 for details on the contents of the columns.
Estimated HCFC-22 errors as resulting from these ingoing uncertainties are listed in Fig. 12, again for northern mid-latitude summer daytime conditions. Similar to CFC-12 and CFC-11, the error budget at lower altitudes is dominated by uncertainties in spectroscopic data, while above 22 km (24 km) for FR (RR) measurements noise and, to a lesser extent, uncertainties in the radiance offset take over. The error budgets for all atmospheric conditions and the FR and RR observation modes are presented as tables and figures in the Supplement file S3 to this article.
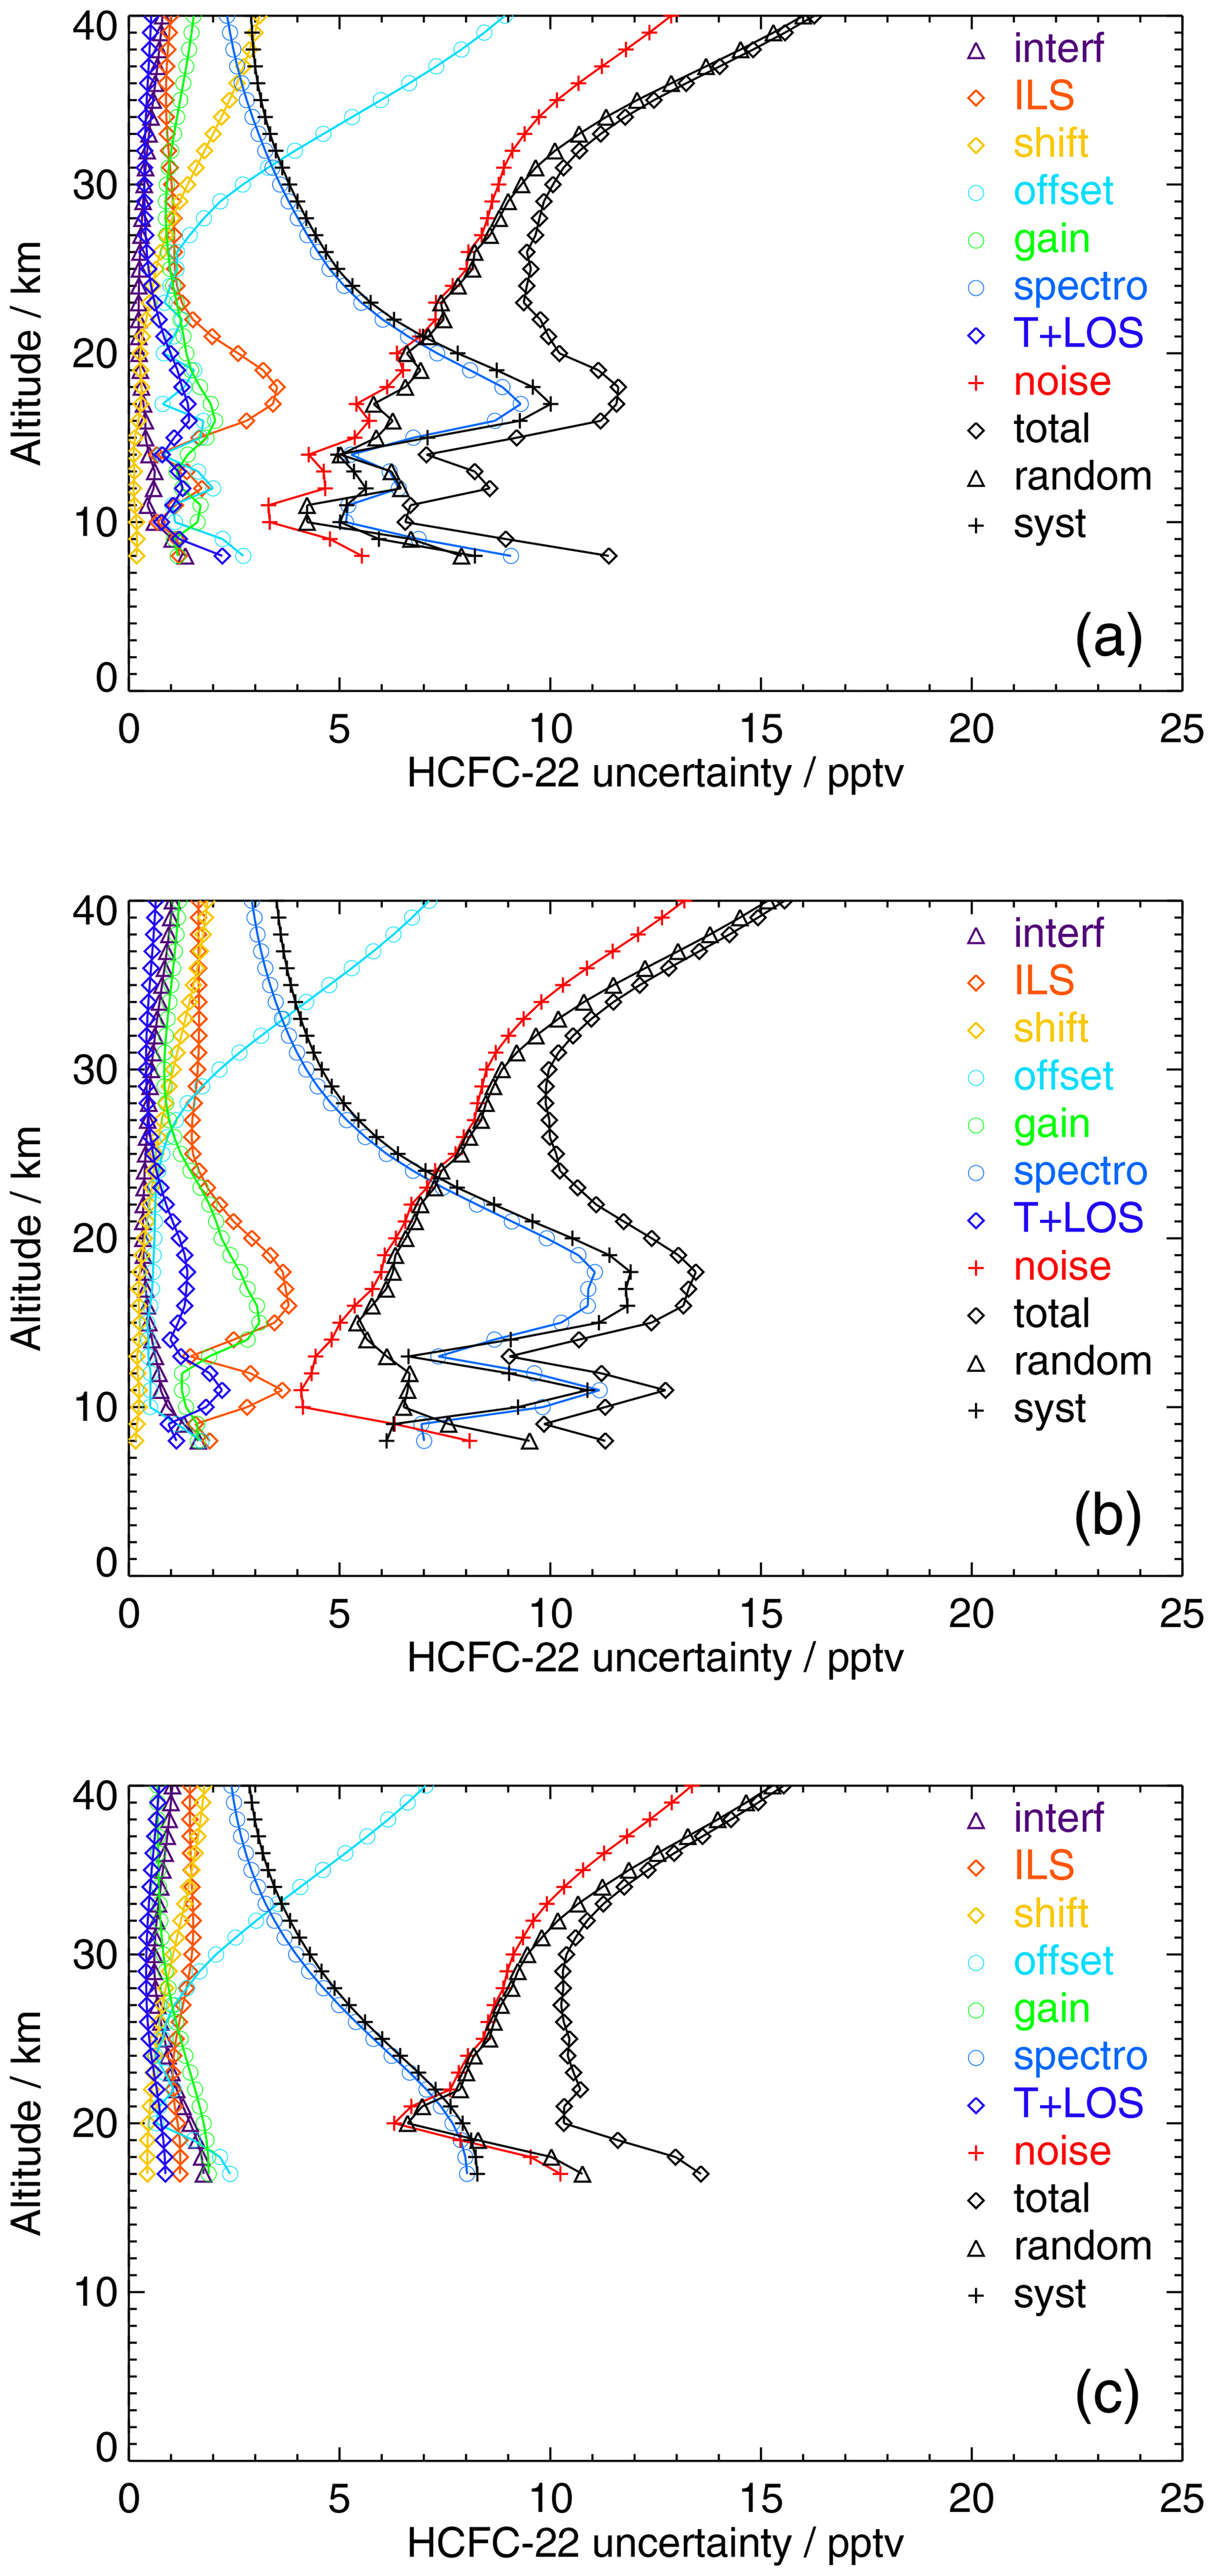
Figure 12Uncertainties of HCFC-22 mixing ratios retrieved from MIPAS FR (a), RR (b), and MA (c) measurements for northern mid-latitude summer conditions.
5.3 The HCFC-22 vertical averaging kernels
Vertical averaging kernels of HCFC-22 retrievals are shown in Fig. 13 for a FR measurement at 46.1° N, 155.1° W on 14 January 2003; a RR measurement at 48.4° N, 116.4° W on 4 January 2009; and a MA measurement 48.0° N, 179.65° E on 11 January 2009, respectively.
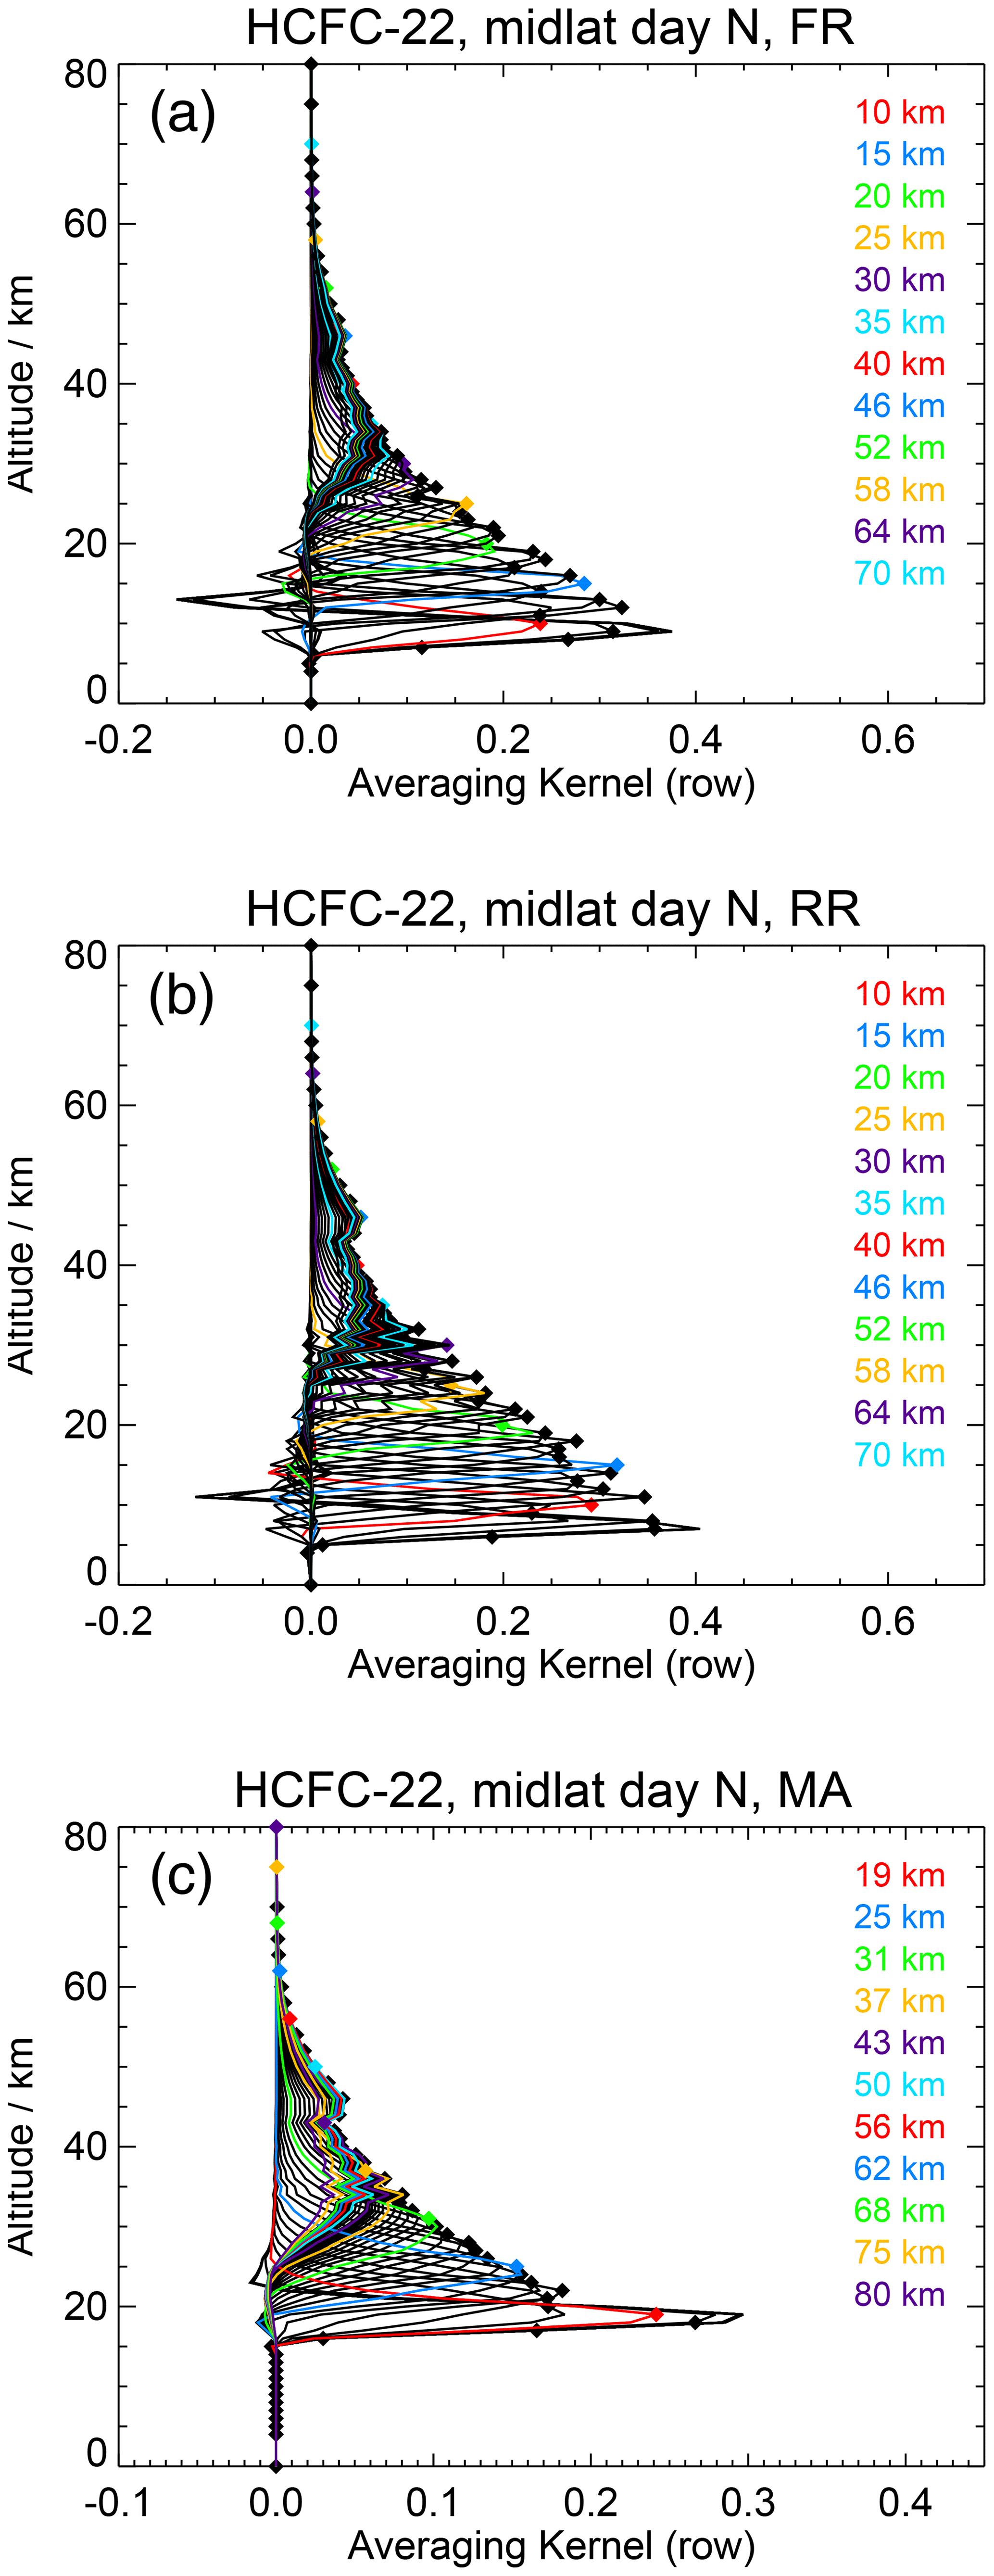
Figure 13Averaging kernels of northern mid-latitude day HCFC-22 FR (a), RR (b), and MA (c) measurements. These averaging kernels refer to limb sequences recorded at 46.1° N, 155.1° W on 14 January 2003 (a); 48.4° N, 116.4° W on 4 January 2009 (b); and 48.0° N, 179.65° E on 11 January 2009 (c). Every fifth averaging kernel row is marked by colour, and the diamonds mark the altitude of the retrieval grid point.
For HCFC-22 it has not been possible to achieve a vertical resolution as good as that for CFC-11 and CFC-12, and the vertical resolution deteriorates faster towards higher altitudes. Typical vertical resolutions for FR are 3.4 km in the troposphere, 5 km at 20 km altitude, and 12 km at 38 km. The averaging kernels are well behaved in the lower part of the stratosphere. Again, the vertical resolution of RR HCFC-22 is slightly better than that of FR.
5.4 The HCFC-22 horizontal averaging kernels
To represent the horizontal information distribution of a MIPAS HCFC-22 retrieval, we again use the concept of horizontal averaging kernels (see Table 12). The horizontal smearing is somewhat larger than for CFC-12 and CFC-11 but still not large enough to require consideration by the data user. In the lower stratosphere, which is the altitude region of major interest in the context of stratospheric (H)CFC research, the horizontal resolution is sampling limited, not smearing limited. The horizontal information displacement is small compared to the horizontal sampling grid.
5.5 HCFC-22 results
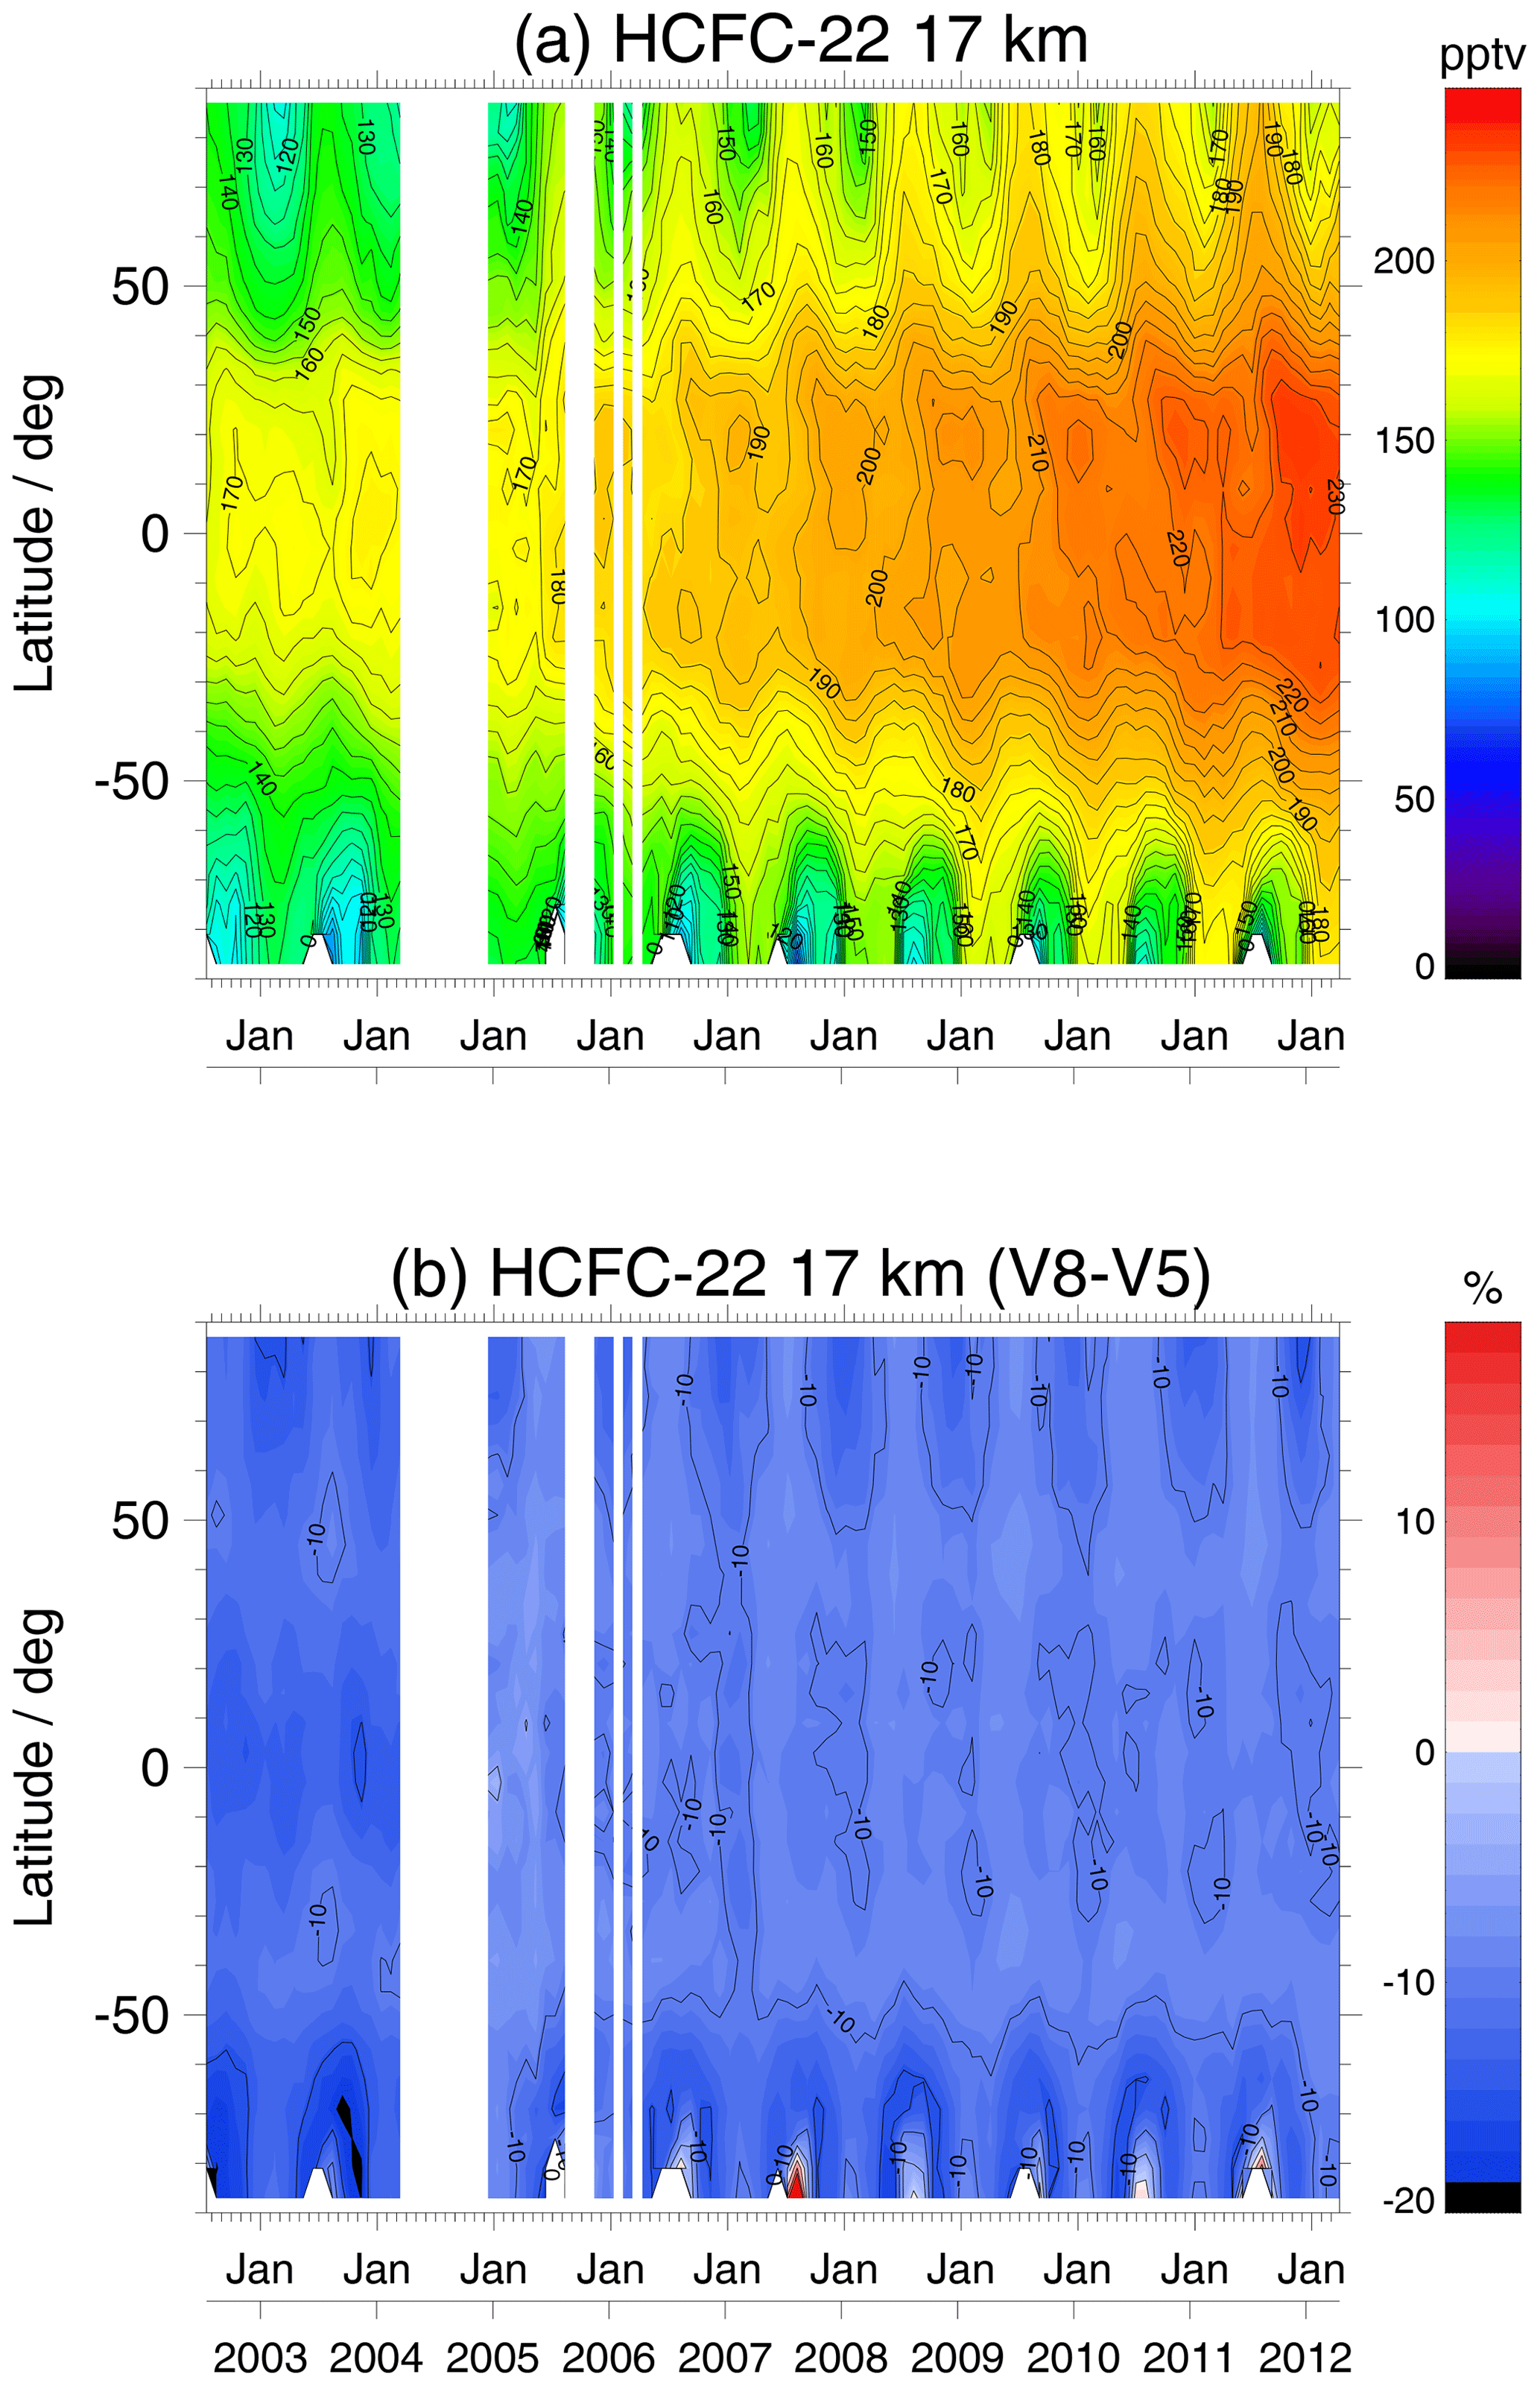
V8 HCFC-22 mixing ratios are generally lower than V5, particularly in the tropical upper troposphere. The major part of this difference is due to the new spectroscopic data used (Harrison, 2016). The differences are largest on an absolute scale with −25 pptv in the tropopause region, and decrease to −5 pptv at the lower and upper ends of the profiles (−3 % in the middle troposphere to −12 % in the tropopause region, and −13 % in the upper stratosphere). Changes are even larger for the FR phase of the mission, with up to −20 % in the polar regions (See Fig. 14, lower panel). These changes do not agree with v3.5 ACE-FTS measurements but they improve the comparison with cryosampler measurements (see Chirkov et al., 2016, their Figs. 8 and 9). Very recently, however, the ACE-FTS v5.2 data version became available, for which the HCFC-22 retrievals had also been performed with the spectroscopic data provided by Harrison (2016). Comparison between ACE-FTS v5.2 and MIPAS V8 HCFC-22 revealed good agreement (Kolonjari et al., 2023). For six 30° latitude bands, differences between ACE-FTS and MIPAS were within ±5 % (relative to ACE-FTS data) between 10 and 22 km. Above and below this range, MIPAS was between 0 % and 10 % lower than ACE-FTS. The vertical resolution and noise error were both slightly improved (however, by less than 0.5 km and less than 1 pptv, respectively) by using more spectral grid points in the retrieval as described in Sect. 5.1. Regarding the two mission phases of MIPAS, the V8 data set seems to not be fully homogeneous but reveals steps of about 5 pptv from the V8H_F-22_61 (FR) to the V8R_F-22_261 (RR) data.
The isolated HCFC-22 maximum in the upper troposphere is largely reduced on a global scale compared to V5 data (see Fig. 14). We conclude that this maximum was a retrieval artefact due to the old cross-section data that did not cover tropopause temperatures well. However, in HCFC-22 profiles retrieved in the Asian monsoon period and location, this isolated maximum is still present (see Fig. 4 and Fig. 5, last rows). This maximum, that at first glance looks like a retrieval artefact, has been reproduced by model calculations by Vogel et al. (2016, 2019). These authors attribute it to transport of HCFC-22 rich air masses from emissions in East Asia – which are known to have risen strongly during the MIPAS mission period (Saikawa et al., 2012) – followed by fast uplift inside the monsoon to the Asian monsoon anticyclone in the upper troposphere–lower stratosphere. The time series in Fig. 5 demonstrate that such a monsoon-related upper tropospheric maximum is not present in CFC-11 (Fig. 5, middle row) and CFC-12 data (Fig. 5, top row). This is in accordance with the fact that no strong or increasing emissions of CFC-11 and CFC-12, specifically in East Asia, during the MIPAS mission period have been observed (e.g. World Meteorological Organization, 2022).
5.6 HCFC-22 coarse grid representation
As for CFC-12 and CFC-11, we also offer for HCFC-22 FR and RR NOM measurements an alternative representation of the data where all information on regularization and smoothing is contained in the grid used for the representation. For this purpose we use the following grid of nominal pressures: 400, 200, 100, 50, 20, 5, and 1 hPa (layer boundaries are 600, 275, 160, 75, 40, 12.5, 2.5, and 0.6 hPa). This grid is somewhat coarser than that of the more abundant species discussed before. As mentioned in Sect. 3.6, the coarse grid chosen is somewhat overly pessimistic in the sense that it is coarse enough to allow an un-regularized retrieval even for the least favourable conditions represented by the data set. The contrast between the regular retrieval and the coarse grid retrieval of HCFC-22 (Fig. 15) is large compared to the coarse grid representations of CFC-12 and CFC-11. This is consistent with the wider averaging kernels of the regular HCFC-22 retrieval in comparison with those of CFC-12 or CFC-11.
The MIPAS CFC-11, CFC-12, and HCFC-22 data record extends over 10 years, covering the upper troposphere and stratosphere with a vertical resolution of about 3 km and a dense daily global coverage including dark polar winter conditions. We have presented the retrieval and the data characteristics (error budget, vertical and horizontal resolution) for the V8 data version retrieved with the IMK-IAA MIPAS data processor, which is most likely the final data version. We consider the V8 data of CFC-12, CFC-11, and HCFC-22 as superior over V5 for several reasons.
-
The V8 calibration including the correction for the detector ageing is superior over V5 calibration, reducing instrumental drifts in the data.
-
The new spectroscopic data used better cover the temperature–pressure range of the atmosphere.
-
In all three cases, the V8 data set is corrected with respect to V5 in the direction that is given by the V5 validations.
-
Several implausible features in the V5 CFC-12 data, which could not be explained by any known atmospheric process, have disappeared in V8 or are at least largely reduced. These are as follows: the CFC-12 V5 distributions over latitude in the middle troposphere (below 10 km) showed a minimum in the tropics and largest values near the poles, while the V8 distributions now look as expected (larger values in the tropics and the Northern Hemisphere); an implausible maximum of CFC-12 in the uppermost tropical troposphere in the V5 data version is reduced; areas in the upper stratosphere with negative CFC-12 VMR are reduced due to an adjusted regularization; in some prominent cases, the bias between the FR and the RR phase of the data set was reduced, but, in general, steps between the two phases could not be avoided.
-
For CFC-11, suspiciously high abundances in polar spring in V5 data are no longer present in the V8 data; the supposedly artificial maxima of the CFC-11 profiles in the tropical upper troposphere–lower stratosphere are less pronounced in V8.
-
For HCFC-22, the high bias of 10 % (RR) to 20 % (FR) versus cryosampler data detected for V5 HCFC-22 has disappeared; the isolated HCFC-22 maximum in the upper troposphere is largely reduced on a global scale compared to V5 data. In the Asian monsoon, however, this maximum remains and can be explained by transport and uplift of HCFC-22-rich air from the industrial production sites in SE Asia (Vogel et al., 2016, 2019).
Beyond trend studies in the context of ozone recovery, these data carry important information on stratospheric circulation, as analysed, e.g. with a scheme as proposed by von Clarmann and Grabowski (2016), or on transport processes in the upper troposphere, as analysed by Vogel et al. (2016, 2019).
CFC-11, CFC-12, and HCFC-22 data can be downloaded after registration from https://www.imk-asf.kit.edu/english/308.php (last access: 22 February 2024). Additionally, they are publicly available at the KITopen repository under https://doi.org/10.35097/1835 (Stiller et al., 2023a) (CFC-11), https://doi.org/10.35097/1834 (Stiller et al., 2023b) (CFC-12), and https://doi.org/10.35097/1833 (Stiller et al., 2023c) (HCFC-22).
The supplement related to this article is available online at: https://doi.org/10.5194/amt-17-1759-2024-supplement.
GPS has the final editorial responsibility for this paper. GPS was engaged in spectroscopy issues and quality control, evaluated deficiencies in earlier data versions, suggested necessary improvements and took the responsibility for some key decisions related to the retrieval setup. All authors contributed to the development of the retrieval setup, discussed the results, and contributed to the final text. NG performed the test calculations needed to improve the retrieval setup, using suggestions from the entire team. NG was also responsible for spectroscopy issues and coded and maintained parts of the error estimation software. MK coded and maintained parts of the error estimation software, performed the error estimation, and provided the horizontal averaging kernels. TvC wrote large parts of the manuscript, organized related discussions, and took care of the TUNER compliance of error estimates. BF, MGC, and MLP took care that the retrieval setup was developed in a way that inter-consistency with the retrieval setups of middle atmospheric measurement modes was maintained. UG provided and maintained the retrieval software and coded and maintained parts of the error estimation software. SK and ALi ran the retrievals. SK provided figures on the trace gas distributions and their temporal evolution. ALa contributed to quality control.
At least one of the (co-)authors is a member of the editorial board of Atmospheric Measurement Techniques. The peer-review process was guided by an independent editor, and the authors also have no other competing interests to declare.
Publisher's note: Copernicus Publications remains neutral with regard to jurisdictional claims made in the text, published maps, institutional affiliations, or any other geographical representation in this paper. While Copernicus Publications makes every effort to include appropriate place names, the final responsibility lies with the authors.
This article is part of the special issue “IMK–IAA MIPAS version 8 data: retrieval, validation, and application (ACP/AMT inter-journal SI)”. It is not associated with a conference.
Spectra used for this work were provided by the European Space Agency. We would like to thank the MIPAS Quality Working Group for enlightening discussions, Claus Zehner for invaluable support, and Guido Levrini for motivating us to develop an independent MIPAS data processor. The project upon which this paper is based was funded by the Federal Ministry for Economic Affairs under grant no. 50EE1547 (SEREMISA). The responsibility for the content of this publication is that of the authors. The project relied on computations performed in the frame of a Bundesprojekt (grant MIPAS_V7) on the Cray XC40 “Hazel Hen” and the HPE Apollo “Hawk” of the High-Performance Computing Center Stuttgart (HLRS) of the University of Stuttgart. The IAA team acknowledges financial support from the Agencia Estatal de Investigación, MCIN/AEI/10.13039/501100011033, through grant nos. PID2019-110689RB-I00 and CEX2021-001131-S. We thank the two anonymous referees for their helpful and constructive comments.
This research has been supported by the Bundesministerium für Wirtschaft und Energie (grant no. 50EE1547) and the Agencia Estatal de Investigación, MCIN/AEI/10.13039/501100011033, through grant nos. PID2019-110689RB-I00 and CEX2021-001131-S.
The article processing charges for this open-access publication were covered by the Karlsruhe Institute of Technology (KIT).
This paper was edited by Andre Butz and reviewed by two anonymous referees.
Bingham, G. E., Zhou, D. K., Bartschi, B. Y., Anderson, G. P., Smith, D. R., Chetwynd, J. H., and Nadile, R. M.: Cryogenic Infrared Radiance Instrumentation for Shuttle (CIRRIS 1A) Earth limb spectral measurements, calibration, and atmospheric O3, HNO3, CFC-12, and CFC-11 PROFile retrieval, J. Geophys. Res., 102, 3547–3558, https://doi.org/10.1029/96JD03508, 1997.. a
Brasseur, G. and Solomon, S.: Aeronomy of the Middle Atmosphere–Chemistry and Physics of the Stratosphere and Mesosphere, Atmospheric and Oceanographic Sciences Library 32, third edn., Springer, Dordrecht, the Netherlands, ISBN 978-1-4020-3284-4, https://doi.org/10.1007/1-4020-3824-0, 2005. a
Brasunas, J. C., Kunde, V. G., Hanel, R. A., Walser, D., Herath, L. W., Buijs, H. L., Bérubé, J. N., and McKinnon, J.: Balloon-Borne Cryogenic Spectrometer For Measurement Of Lower Stratospheric Trace Constituents, in: Cryogenic Optical Systems and Instruments II, vol. 619, edited by: Melugin, R. K., International Society for Optics and Photonics, SPIE, Bellingham, WA, USA, https://doi.org/10.1117/12.966642, pp. 80–88, 1986. a
Brown, A. T., Chipperfield, M. P., Boone, C., Wilson, C., Walker, K. A., and Bernath, P. F.: Trends in atmospheric halogen containing gases since 2004, J. Quant. Spectrosc. Ra., 112, 2552–2566, https://doi.org/10.1016/j.jqsrt.2011.07.005, 2011. a
Bujok, O., Tan, V., Klein, E., Nopper, R., Bauer, R., Engel, A., Gerhards, M.-T., Afchine, A., McKenna, D. S., Schmidt, U., Wienhold, F. G., and Fischer, H.: GHOST – A Novel Airborne Gas Chromatograph for In Situ Measurements of Long–Lived Tracers in the Lower Stratosphere: Method and Applications, J. Atmos. Chem., 39, 37–64, https://doi.org/10.1023/A:1010789715871, 2001. a
Chirkov, M., Stiller, G. P., Laeng, A., Kellmann, S., von Clarmann, T., Boone, C. D., Elkins, J. W., Engel, A., Glatthor, N., Grabowski, U., Harth, C. M., Kiefer, M., Kolonjari, F., Krummel, P. B., Linden, A., Lunder, C. R., Miller, B. R., Montzka, S. A., Mühle, J., O'Doherty, S., Orphal, J., Prinn, R. G., Toon, G., Vollmer, M. K., Walker, K. A., Weiss, R. F., Wiegele, A., and Young, D.: Global HCFC-22 measurements with MIPAS: retrieval, validation, global distribution and its evolution over 2005–2012, Atmos. Chem. Phys., 16, 3345–3368, https://doi.org/10.5194/acp-16-3345-2016, 2016. a, b, c, d, e, f, g, h
De Mazière, M., Thompson, A. M., Kurylo, M. J., Wild, J. D., Bernhard, G., Blumenstock, T., Braathen, G. O., Hannigan, J. W., Lambert, J.-C., Leblanc, T., McGee, T. J., Nedoluha, G., Petropavlovskikh, I., Seckmeyer, G., Simon, P. C., Steinbrecht, W., and Strahan, S. E.: The Network for the Detection of Atmospheric Composition Change (NDACC): history, status and perspectives, Atmos. Chem. Phys., 18, 4935–4964, https://doi.org/10.5194/acp-18-4935-2018, 2018. a
Dinelli, B. M., Raspollini, P., Gai, M., Sgheri, L., Ridolfi, M., Ceccherini, S., Barbara, F., Zoppetti, N., Castelli, E., Papandrea, E., Pettinari, P., Dehn, A., Dudhia, A., Kiefer, M., Piro, A., Flaud, J.-M., López-Puertas, M., Moore, D., Remedios, J., and Bianchini, M.: The ESA MIPAS/Envisat level2-v8 dataset: 10 years of measurements retrieved with ORM v8.22, Atmos. Meas. Tech., 14, 7975–7998, https://doi.org/10.5194/amt-14-7975-2021, 2021. a
Eckert, E., Laeng, A., Lossow, S., Kellmann, S., Stiller, G., von Clarmann, T., Glatthor, N., Höpfner, M., Kiefer, M., Oelhaf, H., Orphal, J., Funke, B., Grabowski, U., Haenel, F., Linden, A., Wetzel, G., Woiwode, W., Bernath, P. F., Boone, C., Dutton, G. S., Elkins, J. W., Engel, A., Gille, J. C., Kolonjari, F., Sugita, T., Toon, G. C., and Walker, K. A.: MIPAS IMK/IAA CFC-11 (CCl3F) and CFC-12 (CCl2F2) measurements: accuracy, precision and long-term stability, Atmos. Meas. Tech., 9, 3355–3389, https://doi.org/10.5194/amt-9-3355-2016, 2016. a, b, c, d, e, f
Eckert, E., von Clarmann, T., Laeng, A., Stiller, G. P., Funke, B., Glatthor, N., Grabowski, U., Kellmann, S., Kiefer, M., Linden, A., Babenhauserheide, A., Wetzel, G., Boone, C., Engel, A., Harrison, J. J., Sheese, P. E., Walker, K. A., and Bernath, P. F.: MIPAS IMK/IAA carbon tetrachloride (CCl4) retrieval and first comparison with other instruments, Atmos. Meas. Tech., 10, 2727–2743, https://doi.org/10.5194/amt-10-2727-2017, 2017. a, b, c
Emmert, J. T., Drob, D. P., Picone, J. M., Siskind, D. E., Jones Jr., M., Mlynczak, M. G., Bernath, P. F., Chu, X., Doornbos, E., Funke, B., Goncharenko, L. P., Hervig, M. E., Schwartz, M. J., Sheese, P. E., Vargas, F., Williams, B. P., and Yuan, T.: NRLMSIS 2.0: A whole-atmosphere empirical model of temperature and neutral species densities, Earth Space Sci., 7, e2020EA001321, https://doi.org/10.1029/2020EA001321, 2020. a
Engel, A., Schmidt, U., and McKenna, D.: Stratospheric trends of CFC–12 over the past two decades: Recent observational evidence of declining growth rates, Geophys. Res. Lett., 25, 3319–3322, https://doi.org/10.1029/98GL02520, 1998. a
Engel, A., Rigby, M., Burkholder, J. B., Fernandez, R. P., Froidevaux, L., Hall, B. D., Hossaini, R., Saito, T., Vollmer, M., and Yao, B.: Update on Ozone-Depleting Substances (ODSs) and Other Gases of Interest to the Montreal Protocol, chap. 1, World Meteorological Organization, Geneva, 2018. a
Fischer, H., Birk, M., Blom, C., Carli, B., Carlotti, M., von Clarmann, T., Delbouille, L., Dudhia, A., Ehhalt, D., Endemann, M., Flaud, J. M., Gessner, R., Kleinert, A., Koopman, R., Langen, J., López-Puertas, M., Mosner, P., Nett, H., Oelhaf, H., Perron, G., Remedios, J., Ridolfi, M., Stiller, G., and Zander, R.: MIPAS: an instrument for atmospheric and climate research, Atmos. Chem. Phys., 8, 2151–2188, https://doi.org/10.5194/acp-8-2151-2008, 2008. a, b
Funke, B., von Clarmann, T., García-Comas, M., Glatthor, N., Grabowski, U., Kellmann, S., Kiefer, M., Linden, A., López-Puertas, M., and Stiller, G. P.: Version 8 IMK/IAA MIPAS measurements of NO2 and NOx, in preparation, 2024. a, b, c, d, e, f, g, h, i, j
García, R. R., Smith, A. K., Kinnison, D. E., de la Cámara, Á., and Murphy, D.: Modification of the Gravity Wave Parameterization in the Whole Atmosphere Community Climate Model: Motivation and Results, J. Atmos. Sci., 74, 275–291, https://doi.org/10.1175/JAS-D-16-0104.1, 2017. a
Glatthor, N., von Clarmann, T., Fischer, H., Höpfner, M., and Stiller, G. P.: Remote Sensing of the Stratospheric Chlorine Species with the MIPAS/ENVISAT Experiment, in: IRS 2004: Current Problems in Atmospheric Radiation, edited by: Fischer, H. and Sohn, B.-J., A. Deepak Publishing, Hampton, Virginia, 263–266, 2006. a, b
Glatthor, N., von Clarmann, T., Fischer, H., Funke, B., Grabowski, U., Höpfner, M., Kellmann, S., Kiefer, M., Linden, A., Milz, M., Steck, T., and Stiller, G. P.: Global peroxyacetyl nitrate (PAN) retrieval in the upper troposphere from limb emission spectra of the Michelson Interferometer for Passive Atmospheric Sounding (MIPAS), Atmos. Chem. Phys., 7, 2775–2787, https://doi.org/10.5194/acp-7-2775-2007, 2007. a, b, c, d, e, f, g, h, i, j, k, l, m, n, o
Glatthor, N., von Clarmann, T., Stiller, G. P., Funke, B., Koukouli, M. E., Fischer, H., Grabowski, U., Höpfner, M., Kellmann, S., and Linden, A.: Large-scale upper tropospheric pollution observed by MIPAS HCN and C2H6 global distributions, Atmos. Chem. Phys., 9, 9619–9634, https://doi.org/10.5194/acp-9-9619-2009, 2009. a, b, c, d, e, f
Glatthor, N., Höpfner, M., Stiller, G. P., von Clarmann, T., Funke, B., Lossow, S., Eckert, E., Grabowski, U., Kellmann, S., Linden, A., A. Walker, K., and Wiegele, A.: Seasonal and interannual variations in HCN amounts in the upper troposphere and lower stratosphere observed by MIPAS, Atmos. Chem. Phys., 15, 563–582, https://doi.org/10.5194/acp-15-563-2015, 2015. a, b, c, d
Glatthor, N., Höpfner, M., Leyser, A., Stiller, G. P., von Clarmann, T., Grabowski, U., Kellmann, S., Linden, A., Sinnhuber, B.-M., Krysztofiak, G., and Walker, K. A.: Global carbonyl sulfide (OCS) measured by MIPAS/Envisat during 2002–2012, Atmos. Chem. Phys., 17, 2631–2652, https://doi.org/10.5194/acp-17-2631-2017, 2017. a, b, c, d, e, f
Glatthor, N., von Clarmann, T., Funke, B., Garcia-Comas, M., Grabowski, U., Höpfner, M., Kellmann, S., Kiefer, M., Laeng, A., Linden, A., Lopez-Puertas, M., and Stiller, G. P.: IMK/IAA MIPAS retrievals version 8: CH4 and N2O, EGUsphere [preprint], https://doi.org/10.5194/egusphere-2023-919, 2023. a, b, c, d, e, f, g
Glatthor, N., von Clarmann, T., Grabowski, U., Kellmann, S., Kiefer, M., Laeng, A., Linden, A., Stiller, G. P., Funke, B., García-Comas, M., and López-Puertas, M.: Version 8 IMK/IAA MIPAS measurements of ClO, in preparation, 2024. a, b, c, d, e, f, g
Goldman, A., Murcray, F. J., Blatherwick, R. D., Bonomo, F. S., Murcray, F. H., and Murcray, D. G.: Spectroscopic identification of CHClF2 (F-22) in the lower stratosphere, Geophys. Res. Lett., 8, 1012–1014, https://doi.org/10.1029/GL008i009p01012, 1981. a
Harrison, J. J.: New and improved infrared absorption cross sections for dichlorodifluoromethane (CFC-12), Atmos. Meas. Tech., 8, 3197–3207, https://doi.org/10.5194/amt-8-3197-2015, 2015. a, b, c, d
Harrison, J. J.: New and improved infrared absorption cross sections for chlorodifluoromethane (HCFC-22), Atmos. Meas. Tech., 9, 2593–2601, https://doi.org/10.5194/amt-9-2593-2016, 2016. a, b, c, d, e, f
Harrison, J. J.: New and improved infrared absorption cross sections for trichlorofluoromethane (CFC-11), Atmos. Meas. Tech., 11, 5827–5836, https://doi.org/10.5194/amt-11-5827-2018, 2018. a, b, c, d
Hase, F.: Transformation of irradiated to measured spectral distribution due to finite spectral resolution and field of view extent of a Fourier transform spectrometer, in: The Karlsruhe Optimized and Precise Radiative transfer Algorithm (KOPRA), edited by: Stiller, G. P., Wissenschaftliche Berichte FZKA 6487, pp. 119–132, Forschungszentrum Karlsruhe, 2000. a, b, c, d, e, f, g, h, i
Hase, F.: The instrument line shape of MIPAS, Oral presentation at the 2nd MIPAS Quality Working Group Meeting, Florence, Italy, 3 December 2003, 2003. a, b, c, d, e, f, g, h, i
Heidt, L. E., Lueb, R., Pollock, W., and Ehhalt, D. H.: Stratospheric Profiles of CCl3F and CCl2F2, Geophys. Res. Lett., 2, 445–447, https://doi.org/10.1029/GL002i010p00445, 1975. a
Hoffmann, L., Kaufmann, M., Spang, R., Müller, R., Remedios, J. J., Moore, D. P., Volk, C. M., von Clarmann, T., and Riese, M.: Envisat MIPAS measurements of CFC-11: retrieval, validation, and climatology, Atmos. Chem. Phys., 8, 3671–3688, https://doi.org/10.5194/acp-8-3671-2008, 2008. a
Junge, C. E. and Manson, J. E.: Stratospheric aerosol studies, J. Geophys. Res., 66, 2163–2182, https://doi.org/10.1029/JZ066i007p02163, 1961. a
Kellmann, S., von Clarmann, T., Stiller, G. P., Eckert, E., Glatthor, N., Höpfner, M., Kiefer, M., Orphal, J., Funke, B., Grabowski, U., Linden, A., Dutton, G. S., and Elkins, J. W.: Global CFC-11 (CCl3F) and CFC-12 (CCl2F2) measurements with the Michelson Interferometer for Passive Atmospheric Sounding (MIPAS): retrieval, climatologies and trends, Atmos. Chem. Phys., 12, 11857–11875, https://doi.org/10.5194/acp-12-11857-2012, 2012. a, b, c, d, e
Khosravi, R., Lambert, A., Lee, H., Gille, J., Barnett, J., Francis, G., Edwards, D., Halvorson, C., Massie, S., Craig, C., Krinsky, C., McInerney, J., Stone, K., Eden, T., Nardi, B., Hepplewhite, C., Mankin, W., and Coffey, M.: Overview and characterization of retrievals of temperature, pressure, and atmospheric constituents from the High Resolution Dynamics Limb Sounder (HIRDLS) measurements, J. Geophys. Res., 114, D20304, https://doi.org/10.1029/2009JD011937, 2009. a
Khosrawi, F., Müller, R., Irie, H., Engel, A., Toon, G. C., Sen, B., Aoki, S., Nakazawa, T., Traub, W. A., Jucks, K. W., Johnson, D. G., Oelhaf, H., Wetzel, G., Sugita, T., Kanzawa, H., Yokota, T., Nakajima, H., and Sasano, Y.: Validation of CFC-12 measurements from the Improved Limb Atmospheric Spectrometer (ILAS) with the version 6.0 retrieval algorithm, J. Geophys. Res., 109, D06311, https://doi.org/10.1029/2003JD004325, 2004. a
Kiefer, M., von Clarmann, T., and Grabowski, U.: State parameter Data Base for MIPAS Data Analysis, Adv. Space Res., 30, 2387–2392, https://doi.org/10.1016/S0273-1177(02)80284-8, 2002. a, b, c, d, e, f, g, h, i, j, k, l, m, n, o, p, q, r, s, t, u, v, w, x, y, z, aa, ab, ac, ad, ae, af, ag, ah, ai, aj, ak, al, am, an, ao
Kiefer, M., von Clarmann, T., Funke, B., García-Comas, M., Glatthor, N., Grabowski, U., Kellmann, S., Kleinert, A., Laeng, A., Linden, A., López-Puertas, M., Marsh, D. R., and Stiller, G. P.: IMK/IAA MIPAS temperature retrieval version 8: nominal measurements, Atmos. Meas. Tech., 14, 4111–4138, https://doi.org/10.5194/amt-14-4111-2021, 2021. a, b, c, d, e, f, g, h, i, j, k, l, m, n, o, p, q, r, s, t, u, v, w, x, y, z, aa, ab, ac, ad, ae, af, ag, ah, ai, aj, ak, al, am, an, ao, ap, aq, ar, as, at, au, av, aw, ax, ay, az, ba, bb, bc, bd, be, bf, bg, bh, bi, bj, bk, bl, bm, bn, bo, bp, bq, br, bs, bt, bu, bv, bw, bx, by, bz, ca, cb, cc, cd, ce, cf, cg, ch, ci, cj, ck, cl, cm, cn, co, cp, cq, cr, cs, ct, cu, cv, cw, cx, cy, cz, da, db, dc, dd, de, df, dg, dh, di, dj, dk, dl, dm, dn, do, dp, dq, dr, ds, dt, du, dv, dw, dx, dy, dz, ea, eb, ec, ed, ee, ef, eg, eh, ei, ej, ek, el, em, en, eo, ep, eq, er, es, et, eu, ev, ew, ex, ey, ez, fa, fb, fc, fd, fe, ff, fg, fh, fi, fj, fk, fl, fm, fn
Kiefer, M., von Clarmann, T., Funke, B., García-Comas, M., Glatthor, N., Grabowski, U., Höpfner, M., Kellmann, S., Laeng, A., Linden, A., López-Puertas, M., and Stiller, G. P.: Version 8 IMK–IAA MIPAS ozone profiles: nominal observation mode, Atmos. Meas. Tech., 16, 1443–1460, https://doi.org/10.5194/amt-16-1443-2023, 2023. a, b, c, d, e, f, g, h
Kiefer, M., García-Comas, M., Glatthor, N., Funke, B., Grabowski, U., Kellmann, S., Laeng, A., Linden, A., López-Puertas, M., Stiller, G. P., and von Clarmann, T.: Version 8 IMK/IAA MIPAS water vapour profiles, in preparation, 2024. a, b, c, d
Kleinert, A., Birk, M., Perron, G., and Wagner, G.: Level 1b error budget for MIPAS on ENVISAT, Atmos. Meas. Tech., 11, 5657–5672, https://doi.org/10.5194/amt-11-5657-2018, 2018. a, b, c, d, e, f, g, h, i, j, k, l, m, n, o, p, q, r, s, t, u, v, w, x, y, z, aa, ab, ac, ad, ae, af, ag, ah, ai, aj, ak, al, am, an, ao, ap, aq, ar, as, at, au, av, aw, ax
Kolonjari, F., Sheese, P. E., Walker, K. A., Boone, C. D., Plummer, D. A., Engel, A., Montzka, S. A., Oram, D. E., Schuck, T., Stiller, G. P., and Toon, G. C.: Validation of ACE-FTS HCFC-22 concentrations in the upper troposphere – lower stratosphere, EGUsphere [preprint], https://doi.org/10.5194/egusphere-2023-2625, 2023. a
Kunde, V. G., Brasunas, J. C., Conrath, B. J., Hanel, R. A., Herman, J. R., Jennings, D. E., Maguire, W. C., Walser, D. W., Annen, J. N., Silverstein, M. J., Abbas, M. M., Herath, L. W., Buijs, H. L., Berube, H. L., and McKinnon, J.: Infrared spectroscopy of the lower stratosphere with a balloon-borne cryogenic Fourier spectrometer, Appl. Optics, 26, 545–553, 1987. a
Kwabia-Tchana, F., Lafferty, W. J., Flaud, J.-M., Manceron, L., and Ndao, M.: High–resolution analysis of the ν1 and ν5 bands of phosgene 35Cl2CO and 35Cl37ClCO, Mol. Phys., 113, 3241–3246, https://doi.org/10.1080/00268976.2015.1015638, 2015. a
Lickley, M. J., Daniel, J. S., Fleming, E. L., Reimann, S., and Solomon, S.: Bayesian assessment of chlorofluorocarbon (CFC), hydrochlorofluorocarbon (HCFC) and halon banks suggest large reservoirs still present in old equipment, Atmos. Chem. Phys., 22, 11125–11136, https://doi.org/10.5194/acp-22-11125-2022, 2022. a
López-Puertas, M., García-Comas, M., Funke, B., von Clarmann, T., Glatthor, N., Grabowski, U., Kellmann, S., Kiefer, M., Laeng, A., Linden, A., and Stiller, G. P.: MIPAS ozone retrieval version 8: middle-atmosphere measurements, Atmos. Meas. Tech., 16, 5609–5645, https://doi.org/10.5194/amt-16-5609-2023, 2023. a, b, c
Lovelock, J. E.: Atmospheric fluorine compounds as indicators of air movements, Nature, 230, 379, https://doi.org/10.1038/230379a0, 1971. a
Lueb, R. A., Ehhalt, D. H., and Heidt, L. E.: Balloon-borne low temperature air sampler, Rev. Sci. Instrum., 46, 702–705, 1975. a
Mahieu, E., Duchatelet, P., Demoulin, P., Walker, K. A., Dupuy, E., Froidevaux, L., Randall, C., Catoire, V., Strong, K., Boone, C. D., Bernath, P. F., Blavier, J.-F., Blumenstock, T., Coffey, M., De Mazière, M., Griffith, D., Hannigan, J., Hase, F., Jones, N., Jucks, K. W., Kagawa, A., Kasai, Y., Mebarki, Y., Mikuteit, S., Nassar, R., Notholt, J., Rinsland, C. P., Robert, C., Schrems, O., Senten, C., Smale, D., Taylor, J., Tétard, C., Toon, G. C., Warneke, T., Wood, S. W., Zander, R., and Servais, C.: Validation of ACE-FTS v2.2 measurements of HCl, HF, CCl3F and CCl2F2 using space-, balloon- and ground-based instrument observations, Atmos. Chem. Phys., 8, 6199–6221, https://doi.org/10.5194/acp-8-6199-2008, 2008. a
Marsh, D. R.: Chemical-dynamical coupling in the mesosphere and lower thermosphere, in: Aeronomy of the Earth's atmosphere and ionosphere, 1st edn., edited by: Abdu, M. A. and Pancheva, D., vol. 2 of IAGA Special Sopron Book, Springer, Dordrecht, ISBN: 978-94-007-0326-1, https://doi.org/10.1007/978-94-007-0326-1, pp. 3–17, 2011. a
Marsh, D. R., Mills, M. J., Kinnison, D. E., Lamarque, J.-F., Calvo, N., and Polvani, L. M.: Climate change from 1850 to 2005 simulated in CESM1(WACCM), J. Climate, 26, 7372–7391, https://doi.org/10.1175/JCLI-D-12-00558.1, 2013. a
McDaniel, A. H., Cantrell, C. A., Davidson, J. A., Shetter, R. E., and Calvert, J. G.: The temperature dependent, infrared absorption cross-sections for the chlorofluorocarbons: CFC-11, CFC-12, CFC-13, CFC-14, CFC-22, CFC-113, CFC-114, and CFC-115, J. Atmos. Chem., 12, 211–227, 1991. a
Molina, M. J. and Rowland, F. S.: Stratospheric sink for chlorofluoromethanes: Chlorine atom–catalysed destruction of ozone, Nature, 249, 810–812, https://doi.org/10.1038/249810a0, 1974. a
Montzka, S. A., Hall, B. D., and Elkins, J. W.: Accelerated increases observed for Hydrochlorofluorocarbons since 2004 in the global atmosphere, Geophys. Res. Lett., 36, L03804, https://doi.org/10.1029/2008GL036475, 2009. a
Montzka, S. A., Dutton, G. S., Yu, P., Ray, E., Portmann, R. W., Daniel, J. S., Kuijpers, L., Hall, B. D., Mondeel, D., Siso, C., Nance, J. D., Rigby, M., Manning, A. J., Hu, L., Moore, F., Miller, B. R., and Elkins, J. W.: An unexpected and persistent increase in global emissions of ozone-depleting CFC-11, Nature, 557, 413–417, https://doi.org/10.1038/s41586-018-0106-2, 2018. a
Moore, D. P. and Remedios, J. J.: Growth rates of stratospheric HCFC-22, Atmos. Chem. Phys., 8, 73–82, https://doi.org/10.5194/acp-8-73-2008, 2008. a
Morgenstern, O., Braesicke, P., Hurwitz, M. M., O'Connor, F. M., Bushell, A. C., Johnson, C. E., and Pyle, J. A.: The World Avoided by the Montreal Protocol, Geophys. Res. Lett., 35, L16811, https://doi.org/10.1029/2008GL034590, 2008. a
Murcray, D. G., Bonomo, F. S., Brooks, J. N., Goldman, A., Murcray, F. H., and Williams, W. J.: Detection of fluorocarbons in the stratosphere, Geophys. Res. Lett., 2, 109–112, 1975. a
Nassar, R., Bernath, P. F., Boone, C. D., Clerbaux, C., Coheur, P. F., Dufour, G., Froidevaux, L., Mahieu, E., McConnell, J. C., McLeod, S. D., Murtagh, D. P., Rinsland, C. P., Semeniuk, K., Skelton, R., Walker, K. A., and Zander, R.: A global inventory of stratospheric chlorine in 2004, J. Geophys. Res., 111, D22312, https://doi.org/10.1029/2006JD007073, 2006. a
Neely III, R. R., English, J. M., Toon, O. B., Solomon, S., Mills, M., and Thayer, J. P.: Implications of extinction due to meteoritic smoke in the upper stratosphere, Geophys. Res. Lett., 38, L24808, https://doi.org/10.1029/2011GL049865, 2011. a
Oelhaf, H.: MIPAS Mission Plan, ESA, Tech. Rep. ENVI-SPPA-EOPG-TN-07-0073, 2008. a
O'Doherty, S., Cunnold, D. M., Manning, A., Miller, B. R., Wang, R. H. J., Krummel, P. B., Fraser, P. J., Simmonds, P. G., McCulloch, A., Weiss, R. F., Salameh, P., Porter, L. W., Prinn, R. G., Huang, J., Sturrock, G., Ryall, D., Derwent, R. G., and Montzka, S. A.: Rapid growth of hydrofluorocarbon 134a and hydrochlorofluorocarbons 141b, 142b, and 22 from Advanced Global Atmospheric Gases Experiment (AGAGE) observations at Cape Grim, Tasmania, and Mace Head, Ireland, J. Geophys. Res., 109, D06310, https://doi.org/10.1029/2003JD004277, 2004. a
Park, M., Randel, W. J., Kinnison, D. E., Bernath, P. F., Walker, K. A., Boone, C. D., Atlas, E. L., Montzka, S. A., and Wofsy, S. C.: Global Trends of CHClF2 (HCFC-22) and CCl3F (CFC-11) estimated from ACE-FTS, HIPPO and WACCM4, SPARC General Assembly 2014, 12–17 January 2014, Queenstown, NZ, http://n2t.net/ark:/85065/d7bz653k (last access: 24 February 2024), 2014. a
Park, S., Western, L. M., Saito, T., Redington, A. L., Henne, S., Fang, X., Prinn, R. G., Manning, A. J., Montzka, S. A., Fraser, P. J., Ganesan, A. L., Harth, C. M., Kim, J., Krummel, P. B., Liang, Q., Mühle, J., O'Doherty, S., Park, H., Park, M., Reimann, S., Salameh, P. K., Weiss, R. F., and Rigby, M.: A decline in emissions of CFC-11 and related chemicals from eastern China, Nature, 590, 433–437, https://doi.org/10.1038/s41586-021-03277-w, 2021. a
Phillips, D.: A Technique for the numerical solution of certain integral equations of first kind, J. Assoc. Comput. Mach., 9, 84–97, https://doi.org/10.1145/321105.321114, 1962. a
Prignon, M., Chabrillat, S., Minganti, D., O'Doherty, S., Servais, C., Stiller, G., Toon, G. C., Vollmer, M. K., and Mahieu, E.: Improved FTIR retrieval strategy for HCFC-22 (CHClF2), comparisons with in situ and satellite datasets with the support of models, and determination of its long-term trend above Jungfraujoch, Atmos. Chem. Phys., 19, 12309–12324, https://doi.org/10.5194/acp-19-12309-2019, 2019. a, b, c
Ramanathan, V.: Greenhouse Effect Due to Chlorofluorocarbons: Climatic Implications, Science, 190, 50–52, 1975. a
Rasmussen, R. A., Khalil, M. A. K., Penkett, S. A., and Prosser, N. J. D.: CHClF2 (F-22) in the Earth's atmosphere, Geophys. Res. Lett., 7, 809–812, https://doi.org/10.1029/GL007i010p00809, 1980. a
Raspollini, P., Carli, B., Carlotti, M., Ceccherini, S., Dehn, A., Dinelli, B. M., Dudhia, A., Flaud, J.-M., López-Puertas, M., Niro, F., Remedios, J. J., Ridolfi, M., Sembhi, H., Sgheri, L., and von Clarmann, T.: Ten years of MIPAS measurements with ESA Level 2 processor V6 – Part 1: Retrieval algorithm and diagnostics of the products, Atmos. Meas. Tech., 6, 2419–2439, https://doi.org/10.5194/amt-6-2419-2013, 2013. a
Raspollini, P., Arnone, E., Barbara, F., Bianchini, M., Carli, B., Ceccherini, S., Chipperfield, M. P., Dehn, A., Della Fera, S., Dinelli, B. M., Dudhia, A., Flaud, J.-M., Gai, M., Kiefer, M., López-Puertas, M., Moore, D. P., Piro, A., Remedios, J. J., Ridolfi, M., Sembhi, H., Sgheri, L., and Zoppetti, N.: Level 2 processor and auxiliary data for ESA Version 8 final full mission analysis of MIPAS measurements on ENVISAT, Atmos. Meas. Tech., 15, 1871–1901, https://doi.org/10.5194/amt-15-1871-2022, 2022. a
Rigby, M., Park, S., Saito, T., Western, L. M., Redington, A. L., Fang, X., Henne, S., Manning, A. J., Prinn, R. G., Dutton, G. S., Fraser, P. J., Ganesan, A. L., Hall, B. D., Harth, C. M., Kim, J., Kim, K., Krummel, P. B., Lee, T., Li, S., Liang, Q., Lunt, M. F., Montzka, S. A., Mühle, J., O'Doherty, S., Park, M.-K., Reimann, S., Salameh, P. K., Simmonds, P., Tunnicliffe, R. L., Weiss, R. F., Yokouchi, Y., and Young, D.: Increase in CFC-11 emissions from eastern China based on atmospheric observations, Nature, 569, 546–550, https://doi.org/10.1038/s41586-019-1193-4, 2019. a
Rinsland, C. P., Goldman, A., Murcray, F. J., Murcray, F. H., Murcray, D. G., and Levine, J. S.: Infrared measurements of increased CF2Cl2 (CFC-12) absorption above the South Pole, Appl. Optics, 27, 627–630, 1988. a
Rinsland, C. P., Johnson, D. W., Goldman, A., and Levine, J. S.: Evidence for a decline in the atmospheric accumulation rate of OHClF2 (CFC-22), Nature, 337, 535–537, 1989. a
Rinsland, C. P., Chiou, L. S., Goldman, A., and Wood, S. W.: Long-term trend in CHF2Cl (HCFC-22) from high spectral resolution infrared solar absorption measurements and comparison with in situ measurements, J. Quant. Spectrosc. Ra., 90, 367–375, https://doi.org/10.1016/j.jqsrt.2004.04.008, 2005. a
Robinson, E., Rasmussen, R. A., Krasnec, J., Pierotti, D., and Jakubovic, M.: Halocarbon measurements in the Alaskan troposphere and lower stratosphere, Atmos. Environ., 11, 215–223, 1977. a
Roche, A. E., Kumer, J. B., Mergenthaler, J. L., Ely, G. A., Uplinger, W. G., Potter, J. F., James, T. C., and Sterritt, L. W.: The Cryogenic Limb Array Etalon Spectrometer CLAES on UARS: Experiment Description and Performance, J. Geophys. Res., 98, 10763–10775, 1993. a
Rodgers, C. D.: Inverse Methods for Atmospheric Sounding: Theory and Practice, vol. 2 of Series on Atmospheric, Oceanic and Planetary Physics, edited by: Taylor, F. W., World Scientific, Singapore, New Jersey, London, Hong Kong, https://doi.org/10.1142/3171, 2000. a
Romashkin, P. A., Hurst, D. F., Elkins, J. W., Dutton, G. S., Fahey, D. W., Dunn, R. E., Moore, F. L., Myers, R. C., and Hall, B. D.: In Situ Measurements of Long-Lived Trace Gases in the Lower Stratosphere by Gas Chromatography, J. Atmos. Ocean. Tech., 18, 1195–1204, 2001. a
Rothman, L. S., Barbe, A., Benner, D. C., Brown, L. R., Camy-Peyret, C., Carleer, M. R., Chance, K., Clerbaux, C., Dana, V., Devi, V. M., Fayt, A., Flaud, J.-M., Gamche, R. R., Goldman, A., Jacquemart, D., Jucks, K. W., Lafferty, W. J., Mandin, J.-Y., Massie, S. T., Nemtchinov, V., Newnham, D. A., Perrin, A., Rinsland, C. P., Schroeder, J., Smith, K. M., Smith, M. A. H., Tang, K., Toth, R. A., Vander Auwera, J., Varanasi, P., and Yoshino, K.: The HITRAN molecular spectroscopic database: edition of 2000 including updates through 2001, J. Quant. Spectrosc. Ra., 82, 5–44, https://doi.org/10.1016/S0022-4073(03)00146-8, 2003. a
Rothman, L. S., Jacquemart, D., Barbe, A., Benner, D. C., Birk, M., Brown, L. R., Carleer, M. R., Chackerian Jr., C., Chance, K., Coudert, L. H., Dana, V., Devi, V. M., Flaud, J.-M., Gamache, R. R., Goldman, A., Hartmann, J.-M., Jucks, K. W., Maki, A. G., Mandin, J.-Y., Massie, S. T., Orphal, J., Perrin, A., Rinsland, C. P., Smith, M. A. H., Tennyson, J., Tolchenov, R. N., Toth, R. A., Vander Auwera, J., Varanasi, P., and Wagner, G.: The HITRAN 2004 molecular spectroscopic database, J. Quant. Spectrosc. Ra., 96, 139–204, https://doi.org/10.1016/j.jqsrt.2004.10.008, 2005. a
Saikawa, E., Rigby, M., Prinn, R. G., Montzka, S. A., Miller, B. R., Kuijpers, L. J. M., Fraser, P. J. B., Vollmer, M. K., Saito, T., Yokouchi, Y., Harth, C. M., Mühle, J., Weiss, R. F., Salameh, P. K., Kim, J., Li, S., Park, S., Kim, K.-R., Young, D., O'Doherty, S., Simmonds, P. G., McCulloch, A., Krummel, P. B., Steele, L. P., Lunder, C., Hermansen, O., Maione, M., Arduini, J., Yao, B., Zhou, L. X., Wang, H. J., Elkins, J. W., and Hall, B.: Global and regional emission estimates for HCFC-22, Atmos. Chem. Phys., 12, 10033–10050, https://doi.org/10.5194/acp-12-10033-2012, 2012. a
Schmidt, U., Bauer, R., Khedim, A., Klein, E., Kulessa, G., and Schiller, C.: Profile observations of long-lived trace gases in the Arctic Vortex, Geophys. Res. Lett., 18, 767–770, 1991. a
Spang, R., Riese, M., and Offermann, D.: CFC11 Measurements by CRISTA, Adv. Space Res., 19, 575–578, 1997. a
Steck, T. and von Clarmann, T.: Constrained profile retrieval applied to the obervation mode of the Michelson Interferometer for Passive Atmospheric Sounding, Appl. Optics, 40, 3559–3571, https://doi.org/10.1364/AO.40.003559, 2001. a
Stiller, G. P. (Ed.): The Karlsruhe Optimized and Precise Radiative Transfer Algorithm (KOPRA), 22.02.11, LK 01, Wissenschaftliche Berichte, FZKA-6487 (Dezember 2000), Forschungszentrum Karlsruhe, Karlsruhe, https://doi.org/10.5445/IR/270048971, 2000. a
Stiller, G. P., von Clarmann, T., Funke, B., Glatthor, N., Hase, F., Höpfner, M., and Linden, A.: Sensitivity of trace gas abundances retrievals from infrared limb emission spectra to simplifying approximations in radiative transfer modelling, J. Quant. Spectrosc. Ra., 72, 249–280, https://doi.org/10.1016/s0022-4073(01)00123-6, 2002. a
Stiller, G. P., von Clarmann, T., Brühl, C., Fischer, H., Funke, B., Glatthor, N., Grabowski, U., Höpfner, M., Jöckel, P., Kellmann, S., Kiefer, M., Linden, A., López-Puertas, M., Mengistu Tsidu, G., Milz, M., Steck, T., and Steil, B.: Global distributions of HO2NO2 as observed by the Michelson Interferometer for Passive Atmospheric Sounding (MIPAS), J. Geophys. Res., 112, D09314, https://doi.org/10.1029/2006JD007212, 2007. a
Stiller, G. P., von Clarmann, T., Glatthor, N., Grabowski, U., Kellmann, S., Kiefer, M., Laeng, A., Linden, A., Funke, B., García-Comas, M., and López-Puertas, M.: Version 8 IMK/IAA MIPAS measurements of CFC-11: the data set, KITopen repository [data set], https://doi.org/10.35097/1835, 2023a. a
Stiller, G. P., von Clarmann, T., Glatthor, N., Grabowski, U., Kellmann, S., Kiefer, M., Laeng, A., Linden, A., Funke, B., García-Comas, M., and López-Puertas, M.: Version 8 IMK/IAA MIPAS measurements of CFC-12: the data set, KITopen repository [data set], https://doi.org/10.35097/1834, 2023b. a
Stiller, G. P., von Clarmann, T., Glatthor, N., Grabowski, U., Kellmann, S., Kiefer, M., Laeng, A., Linden, A., Funke, B., García-Comas, M., and López-Puertas, M.: Version 8 IMK/IAA MIPAS measurements of CFC-12: the data set, KITopen repository [data set], https://doi.org/10.35097/1833, 2023c. a
Stiller, G. P., von Clarmann, T., Funke, B., García-Comas, M., Glatthor, N., Grabowski, U., Kellmann, S., Kiefer, M., Laeng, A., Linden, A., and López-Puertas, M.: Version 8 IMK/IAA MIPAS reactive nitrogen, in preparation, 2024. a, b, c, d, e, f, g, h, i, j, k, l, m, n
Tegtmeier, S., Hegglin, M. I., Anderson, J., Funke, B., Gille, J., Jones, A., Smith, L., von Clarmann, T., and Walker, K. A.: The SPARC Data Initiative: comparisons of CFC-11, CFC-12, HF and SF6 climatologies from international satellite limb sounders, Earth Syst. Sci. Data, 8, 61–78, https://doi.org/10.5194/essd-8-61-2016, 2016. a
Tikhonov, A.: On the solution of incorrectly stated problems and method of regularization, Dokl. Akad. Nauk. SSSR, 151, 501–504, 1963. a
Toon, G. C., Farmer, C. B., Shaper, P. W., Lowes, L. L., Norton, R. H., Schoeberl, M. R., Lait, L. R., and Newman, P. A.: Evidence for Subsidence in the 1989 Arctic Winter Stratosphere from Airborne Infrared Composition Measurements, J. Geophys. Res., 97, 7963–7970, https://doi.org/10.1029/91JD03115, 1992. a
Toon, G. C., Blavier, J.-F., Sen, B., and Drouin, B. J.: Atmospheric COCl2 measured by solar occultation spectrometry, Geophys. Res. Lett., 28, 2835–2838, 2001. a
Twomey, S.: On the Numerical Solution of Fredholm Integral Equations of the First Kind by the Inversion of the Linear System Produced by Quadrature, J. Assoc. ComputMach., 10, 97–101, https://doi.org/10.1145/321150.321157, 1963. a
United Nations Environment Programme: Handbook for the Montreal Protocol on Substances that Deplete the Ozone Layer, Ninth edition, UN, Nairobi, Kenya, 2012. a
Varanasi, P.: Absorption Coefficients of CFC-11 and CFC-12 needed for Atmospheric Remote Sensing and Global Warming Studies, J. Quant. Spectrosc. Ra., 48, 205–219, https://doi.org/10.1016/0022-4073(92)90089-M, 1992a. a, b
Varanasi, P.: Absorption Spectra of HCFC-22 around 829 cm−1 at Atmospheric Conditions, J. Quant. Spectrosc. Ra., 47, 251–255, https://doi.org/10.1016/0022-4073(92)90143-R, 1992b. a, b
Varanasi, P. and Nemtchinov, V.: Thermal Infrared Absorption Coefficients of CFC-12 at Atmospheric Conditions, J. Quant. Spectrosc. Ra., 51, 679–687, https://doi.org/10.1016/0022-4073(94)90124-4, 1994. a, b, c
Varanasi, P., Li, Z., Nemtchinov, V., and Cherukuri, A.: Spectral absorption-coefficient data on HCFC-22 and SF6 for remote-sensing applications, J. Quant. Spectrosc. Ra., 52, 323–332, https://doi.org/10.1016/0022-4073(94)90162-7, 1994. a, b, c
Vogel, B., Günther, G., Müller, R., Grooß, J.-U., Afchine, A., Bozem, H., Hoor, P., Krämer, M., Müller, S., Riese, M., Rolf, C., Spelten, N., Stiller, G. P., Ungermann, J., and Zahn, A.: Long-range transport pathways of tropospheric source gases originating in Asia into the northern lower stratosphere during the Asian monsoon season 2012, Atmos. Chem. Phys., 16, 15301–15325, https://doi.org/10.5194/acp-16-15301-2016, 2016. a, b, c, d
Vogel, B., Müller, R., Günther, G., Spang, R., Hanumanthu, S., Li, D., Riese, M., and Stiller, G. P.: Lagrangian simulations of the transport of young air masses to the top of the Asian monsoon anticyclone and into the tropical pipe, Atmos. Chem. Phys., 19, 6007–6034, https://doi.org/10.5194/acp-19-6007-2019, 2019. a, b, c, d
von Clarmann, T.: Chlorine in the stratosphere, Atmósfera, 26, 415–458, 2013. a
von Clarmann, T. and Grabowski, U.: Elimination of hidden a priori information from remotely sensed profile data, Atmos. Chem. Phys., 7, 397–408, https://doi.org/10.5194/acp-7-397-2007, 2007. a
von Clarmann, T. and Grabowski, U.: Direct inversion of circulation and mixing from tracer measurements – Part 1: Method, Atmos. Chem. Phys., 16, 14563–14584, https://doi.org/10.5194/acp-16-14563-2016, 2016. a
von Clarmann, T. and Grabowski, U.: Direct inversion of circulation from tracer measurements – Part 2: Sensitivity studies and model recovery tests, Atmos. Chem. Phys., 21, 2509–2526, https://doi.org/10.5194/acp-21-2509-2021, 2021. a
von Clarmann, T., Linden, A., Oelhaf, H., Fischer, H., Friedl-Vallon, F., Piesch, C., Seefeldner, M., Völker, W., Bauer, R., Engel, A., and Schmidt, U.: Determination of the stratospheric organic chlorine budget in the spring arctic vortex from MIPAS B limb emission spectra and air sampling experiments, J. Geophys. Res., 100, 13,979–13,997, 1995. a
von Clarmann, T., Glatthor, N., Grabowski, U., Höpfner, M., Kellmann, S., Kiefer, M., Linden, A., Mengistu Tsidu, G., Milz, M., Steck, T., Stiller, G. P., Wang, D. Y., Fischer, H., Funke, B., Gil-López, S., and López-Puertas, M.: Retrieval of temperature and tangent altitude pointing from limb emission spectra recorded from space by the Michelson Interferometer for Passive Atmospheric Sounding (MIPAS), J. Geophys. Res., 108, 4736, https://doi.org/10.1029/2003JD003602, 2003. a, b
von Clarmann, T., De Clercq, C., Ridolfi, M., Höpfner, M., and Lambert, J.-C.: The horizontal resolution of MIPAS, Atmos. Meas. Tech., 2, 47–54, https://doi.org/10.5194/amt-2-47-2009, 2009a. a
von Clarmann, T., Höpfner, M., Kellmann, S., Linden, A., Chauhan, S., Funke, B., Grabowski, U., Glatthor, N., Kiefer, M., Schieferdecker, T., Stiller, G. P., and Versick, S.: Retrieval of temperature, H2O, O3, HNO3, CH4, N2O, ClONO2 and ClO from MIPAS reduced resolution nominal mode limb emission measurements, Atmos. Meas. Tech., 2, 159–175, https://doi.org/10.5194/amt-2-159-2009, 2009b. a
von Clarmann, T., Funke, B., López-Puertas, M., Kellmann, S., Linden, A., Stiller, G. P., Jackman, C. H., and Harvey, V. L.: The solar proton events in 2012 as observed by MIPAS, Geophys. Res. Lett., 40, 1–5, https://doi.org/10.1002/grl.50119, 2013. a, b
von Clarmann, T., Glatthor, N., and Plieninger, J.: Maximum likelihood representation of MIPAS profiles, Atmos. Meas. Tech., 8, 2749–2757, https://doi.org/10.5194/amt-8-2749-2015, 2015. a
von Clarmann, T., Degenstein, D. A., Livesey, N. J., Bender, S., Braverman, A., Butz, A., Compernolle, S., Damadeo, R., Dueck, S., Eriksson, P., Funke, B., Johnson, M. C., Kasai, Y., Keppens, A., Kleinert, A., Kramarova, N. A., Laeng, A., Langerock, B., Payne, V. H., Rozanov, A., Sato, T. O., Schneider, M., Sheese, P., Sofieva, V., Stiller, G. P., von Savigny, C., and Zawada, D.: Overview: Estimating and reporting uncertainties in remotely sensed atmospheric composition and temperature, Atmos. Meas. Tech., 13, 4393–4436, https://doi.org/10.5194/amt-13-4393-2020, 2020. a
von Clarmann, T., Grabowski, U., Stiller, G. P., Monge-Sanz, B. M., Glatthor, N., and Kellmann, S.: The middle atmospheric meridional circulation for 2002–2012 derived from MIPAS observations, Atmos. Chem. Phys., 21, 8823–8843, https://doi.org/10.5194/acp-21-8823-2021, 2021. a
von Clarmann, T., Glatthor, N., Grabowski, U., Funke, B., Kiefer, M., Kleinert, A., Stiller, G. P., Linden, A., and Kellmann, S.: TUNER-compliant error estimation for MIPAS: methodology, Atmos. Meas. Tech., 15, 6991–7018, https://doi.org/10.5194/amt-15-6991-2022, 2022. a, b
Wiegele, A., Glatthor, N., Höpfner, M., Grabowski, U., Kellmann, S., Linden, A., Stiller, G., and von Clarmann, T.: Global distributions of C2H6, C2H2, HCN, and PAN retrieved from MIPAS reduced spectral resolution measurements, Atmos. Meas. Tech., 5, 723–734, https://doi.org/10.5194/amt-5-723-2012, 2012. a, b, c, d, e, f, g, h, i, j
Williams, W. J., Kosters, J. J., Goldman, A., and Murcray, D. G.: Measurements of stratospheric halocarbon distributions using infrared techniques, Geophys. Res. Lett., 3, 379–382, https://doi.org/10.1029/GL003i007p00379, 1976. a
World Meteorological Organization (WMO): Scientific Assessment of Ozone Depletion: 2022, Global Ozone Research and Monitoring – GAW Report No. 278, 509 pp., WMO, Geneva, Switzerland, ISBN 978-9914-733-97-6, 2022. a
Yokouchi, Y., Taguchi, S., Saito, T., Tohjima, Y., Tanimoto, H., and Mukai, H.: High frequency measurements of HFCs at a remote site in east Asia and their implications for Chinese emissions, Geophys. Res. Lett., 33, L21814, https://doi.org/10.1029/2006GL026403, 2006. a
Zander, R., Rinsland, C. P., Farmer, C. B., and Norton, R. H.: Infrared spectroscopic measurements of halogenated source gases in the stratosphere with the ATMOS instrument, J. Geophys. Res., 92, 9836–9850, 1987. a
Zhou, M., Vigouroux, C., Langerock, B., Wang, P., Dutton, G., Hermans, C., Kumps, N., Metzger, J.-M., Toon, G., and De Mazière, M.: CFC-11, CFC-12 and HCFC-22 ground-based remote sensing FTIR measurements at Réunion Island and comparisons with MIPAS/ENVISAT data, Atmos. Meas. Tech., 9, 5621–5636, https://doi.org/10.5194/amt-9-5621-2016, 2016. a, b, c