
Articles | Volume 19, issue 17
https://doi.org/10.5194/amt-19-5659-2026
© Author(s) 2026. This work is distributed under
the Creative Commons Attribution 4.0 License.
the Creative Commons Attribution 4.0 License.
https://doi.org/10.5194/amt-19-5659-2026
© Author(s) 2026. This work is distributed under
the Creative Commons Attribution 4.0 License.
the Creative Commons Attribution 4.0 License.
Research article
| 
08 Sep 2026
Research article |
| 08 Sep 2026
| 08 Sep 2026
Machine learning-based emission rate estimates of global methane super-emissions

SRON Space Research Organisation Netherlands, Leiden, the Netherlands
Joannes D. Maasakkers
SRON Space Research Organisation Netherlands, Leiden, the Netherlands
Tobias A. de Jong
SRON Space Research Organisation Netherlands, Leiden, the Netherlands
Berend J. Schuit
SRON Space Research Organisation Netherlands, Leiden, the Netherlands
GHGSat Inc., Montreal, Canada
Shubham Sharma
SRON Space Research Organisation Netherlands, Leiden, the Netherlands
Theo Huegens
SRON Space Research Organisation Netherlands, Leiden, the Netherlands
Anne-Wil van den Berg
Meteorology and Air Quality group, Wageningen University & Research, Wageningen, the Netherlands
Sander Houweling
SRON Space Research Organisation Netherlands, Leiden, the Netherlands
Department of Earth Sciences, Vrije Universiteit Amsterdam, Amsterdam, the Netherlands
Ilse Aben
SRON Space Research Organisation Netherlands, Leiden, the Netherlands
Department of Earth Sciences, Vrije Universiteit Amsterdam, Amsterdam, the Netherlands
Related authors
No articles found.
Daniel Cusworth, Daniel Varon, Dylan Jervis, Jason McKeever, Alexander Turner, Christian Frankenberg, John Worden, Andrew Thorpe, Jay Fahlen, Sudhanshu Pandey, Joannes Maasakkers, Ilse Aben, Annmarie Eldering, Riley Duren, Bradley Conrad, Tia Scarpelli, Daniel Bon, Mackenzie Huffman, Itziar Irakulis-Loitxate, Luis Guanter, Jason Schroeder, Benjamin Hmiel, Evan Sherwin, Sean Crowell, Eric Kort, Adam Brandt, Frances Reuland, Maryann Sargent, James East, and Daniel Jacob
EGUsphere, https://doi.org/10.5194/egusphere-2026-6060, https://doi.org/10.5194/egusphere-2026-6060, 2026
This preprint is open for discussion and under review for Atmospheric Chemistry and Physics (ACP).
Short summary
Short summary
In this review, we summarize the current and anticipated state of satellite remote sensing for point sources. In particular, we are provide and update to the fleet of point source imaging satellites, summarize the nuance around data availability and revisit, detail data processing pipelines and validation procedures, describe how to benchmark detection performance, and finally, describe demonstrated use-cases for satellite point source observations.
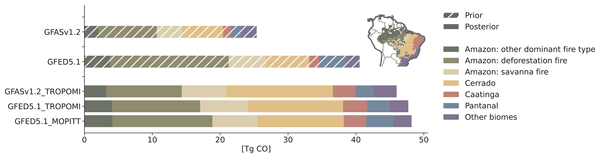
Anne-Wil van den Berg, Joram J. D. Hooghiem, Auke M. van der Woude, Pieter Rijsdijk, Roland Vernooij, Santiago Botía, Guido R. van der Werf, John B. Miller, Ingrid T. Luijkx, Maarten C. Krol, and Wouter Peters
Atmos. Chem. Phys., 26, 13929–13958, https://doi.org/10.5194/acp-26-13929-2026, https://doi.org/10.5194/acp-26-13929-2026, 2026
Short summary
Short summary
We estimate 2019 Brazilian fire carbon monoxide (CO) emissions using CO retrievals from multiple satellites in a new top-down inversion framework. The retrievals strongly constrain fire emissions and complement existing inventories. National-scale posterior emissions align well with the new Global Fire Emissions Database v5.1, supporting progress in fire emission models. Yet, posterior emissions in the Cerrado and Caatinga are systematically higher than inventories; we discuss potential drivers.
Daniel A. Potts, Harjinder Sembhi, Matthieu Dogniaux, Joannes D. Maasakkers, Berend J. Schuit, Dirk Schuettemeyer, Timon Hummel, Rocio Barrio Guillo, Oliver Schneising, Luis Guanter, and Ilse Aben
EGUsphere, https://doi.org/10.5194/egusphere-2026-3797, https://doi.org/10.5194/egusphere-2026-3797, 2026
This preprint is open for discussion and under review for Atmospheric Chemistry and Physics (ACP).
Short summary
Short summary
Routine monitoring of industrial emissions is vital to understand the location, frequency, and intensity of methane emissions. We used satellite and aircraft measurements to understand methane emissions from Madrid across various scales and sectors. Using a range of methods, we identify a clear gap between top-down and bottom-up approaches, discuss challenges associated with satellite interpretation, connect emissions to on-site practices, and make recommendations towards operational use.
Mengrong Lu, Huilin Chen, Xun Zhang, Xuguang Chi, Chong Wei, Shuangxi Fang, Fenjuan Wang, Eleftherios Ioannidis, Friedemann Reum, Xinlu Wang, Prajal Pradhan, Wouter Peters, Klaus Hubacek, and Sander Houweling
EGUsphere, https://doi.org/10.5194/egusphere-2026-3879, https://doi.org/10.5194/egusphere-2026-3879, 2026
Short summary
Short summary
Effective methane mitigation requires accurate knowledge of the spatial and temporal distribution of sources and sinks. Using high-resolution atmospheric modeling and ground-based observations, we estimated methane emissions in East Asia, focusing on the Yangtze River Delta. Emissions are lower than most inventories suggest, but show a clear seasonal cycle, with summer peaks driven by rice cultivation and natural sources. This seasonality is critical for emission tracking and mitigation design.
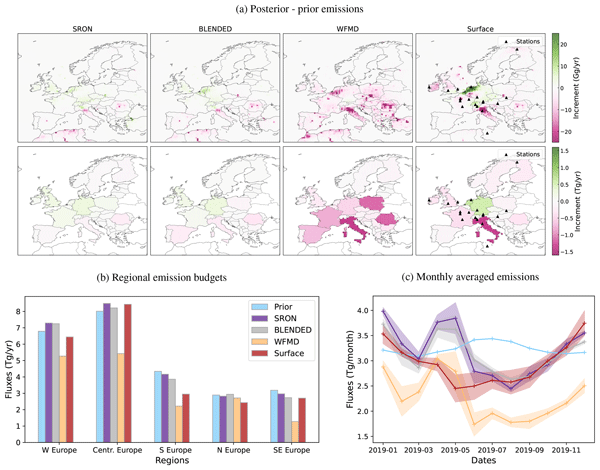
Aurélien Sicsik-Paré, Audrey Fortems-Cheiney, Isabelle Pison, Grégoire Broquet, Alvin Opler, Elise Potier, Adrien Martinez, Oliver Schneising, Michael Buchwitz, Joannes D. Maasakkers, Tobias Borsdorff, and Antoine Berchet
Atmos. Chem. Phys., 26, 10423–10454, https://doi.org/10.5194/acp-26-10423-2026, https://doi.org/10.5194/acp-26-10423-2026, 2026
Short summary
Short summary
Assimilating satellite methane observations provides top-down quantification of regional methane emissions. This study compares European emissions in 2019 estimated from the inversion of three satellite datasets. We find inconsistencies in national budgets and spatial patterns, with no product clearly superior. We disentangle drivers of the differences in emissions, highlighting the impact of differences in coverage, observations and errors on the consistency of methane emission estimates.

Xin Zhang, Joannes D. Maasakkers, Tobias A. de Jong, Paul Tol, Frances Reuland, Adam R. Brandt, Eric A. Kort, Taylor J. Adams, and Ilse Aben
Geosci. Model Dev., 19, 5979–6000, https://doi.org/10.5194/gmd-19-5979-2026, https://doi.org/10.5194/gmd-19-5979-2026, 2026
Short summary
Short summary
Reducing emissions of greenhouse gases such as methane and carbon dioxide is essential for addressing climate change. We developed HyperGas, an open tool that uses hyperspectral satellite images to retrieve and detect greenhouse gas plumes. It helps scientists locate emission sources, estimate their strength, and examine uncertainties through an easy workflow and visual app. Our goal is to make tracking human-made emissions more accurate and accessible, supporting better climate monitoring.
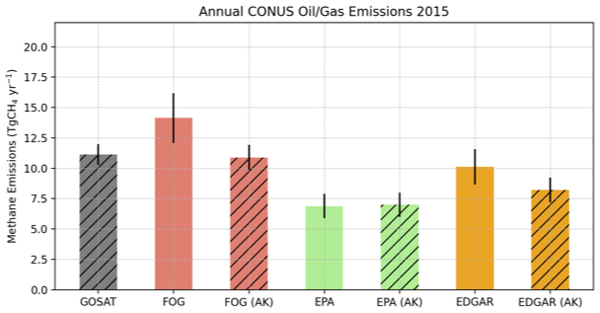
John Worden, Sudhanshu Pandey, Hannah Nesser, Kevin Bowman, Colin Harkins, Congmeng Lyu, Joannes D. Maasakkers, Deborah Gordon, Daniel Jacob, Lucas Estrada, Daniel J. Varon, James D. East, Lauren Schmeisser, and Zhen Qu
Atmos. Chem. Phys., 26, 8855–8873, https://doi.org/10.5194/acp-26-8855-2026, https://doi.org/10.5194/acp-26-8855-2026, 2026
Short summary
Short summary
To support methane reduction, we compared three widely used maps of methane emissions in the United States with estimates derived from a methane-measuring satellite from 2012 to 2020. The satellite indicates higher emissions from oil and gas production and from livestock in several regions, while other sources were harder to pin down. Neither approach shows a clear change over time. The results point to where better measurements can most improve emissions reporting and guide mitigation.
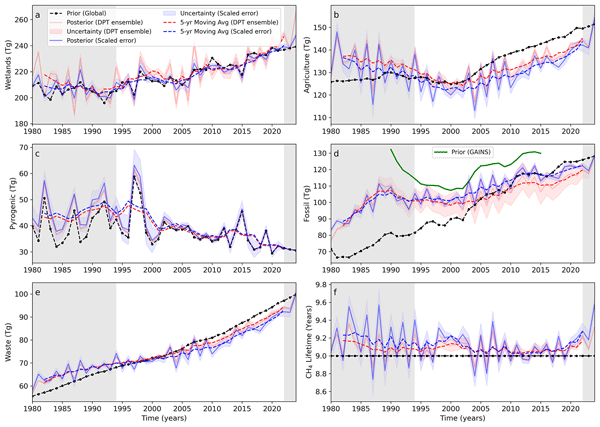
Bibhasvata Dasgupta, Sudhanshu Pandey, Sander Houweling, Malika Menoud, Carina van der Veen, John Miller, Ben Riddell-Young, Sylvia Englund Michel, Peter Sperlich, Shinji Morimoto, Ryo Fujita, Stephen Platt, Christine Groot Zwaaftink, Ingeborg Levin, Cordelia Veidt, Cathrine Lund Myhre, Ceres Woolley Maisch, Rebecca Fisher, Euan G. Nisbet, James France, Rowena Moss, Nicola Warwick, and Thomas Röckmann
Atmos. Chem. Phys., 26, 8601–8616, https://doi.org/10.5194/acp-26-8601-2026, https://doi.org/10.5194/acp-26-8601-2026, 2026
Short summary
Short summary
Methane is a strong greenhouse gas, and its rise since the mid-2000s is debated in terms of sources and sinks. Using top-down and bottom-up data, along with inversion models and methane isotopes (δ13C-CH4 and δD-CH4), we find that wetlands are the primary driver of post-2006 increases, followed by agriculture and fossil fuels. Methane's lifetime has decreased by about 0.1 years. We also assess how isotope signatures and sink processes influence uncertainties.
Shuai Sun, Yuzhong Zhang, Wei Chen, Shaomin Pan, Dongchuan Pu, Xin Tong, Huilin Chen, and Sander Houweling
EGUsphere, https://doi.org/10.5194/egusphere-2026-2165, https://doi.org/10.5194/egusphere-2026-2165, 2026
Short summary
Short summary
This study estimates methane emissions across Europe from 2019 to 2023 using atmospheric methane measurements from satellites and ground stations to improve understanding of emission sources. We find that total emissions are slightly higher than official reports, mainly due to livestock and waste, while emissions from fossil fuel production are lower in some regions. These results show that atmospheric measurements can improve independent verification of emissions and support climate policy.
Srijana Lama, Joannes D. Maasakkers, Xin Zhang, Marianne Girard, Swarna Dutt, Suyash Nandgaonkar, Daniel J. Varon, Melissa P. Sulprizio, Lucas A. Estrada, Nicholas Balasus, Robert J. Parker, Yukio Terao, and Ilse Aben
EGUsphere, https://doi.org/10.5194/egusphere-2025-6528, https://doi.org/10.5194/egusphere-2025-6528, 2026
Short summary
Short summary
Methane is the second most important anthropogenic greenhouse gas in terms of radiative forcing, with a global warming potential 27–30 times that of CO2 over a 100-year timescale. Effective mitigation requires a detailed understanding of the spatial distribution and magnitude of emissions. Here, we quantify India’s 2021 methane emissions at a resolution of up to 0.25° × 0.3125° using TROPOMI observations within the Bayesian Integrated Methane Inversion framework.
Eleftherios Ioannidis, Antoon Meesters, Michael Steiner, Dominik Brunner, Friedemann Reum, Isabelle Pison, Antoine Berchet, Rona Thompson, Espen Sollum, Frank-Thomas Koch, Christoph Gerbig, Fenjuan Wang, Shamil Maksyutov, Aki Tsuruta, Maria Tenkanen, Tuula Aalto, Guillaume Monteil, Hong Lin, Ge Ren, Marko Scholze, and Sander Houweling
Earth Syst. Sci. Data, 18, 167–198, https://doi.org/10.5194/essd-18-167-2026, https://doi.org/10.5194/essd-18-167-2026, 2026
Short summary
Short summary
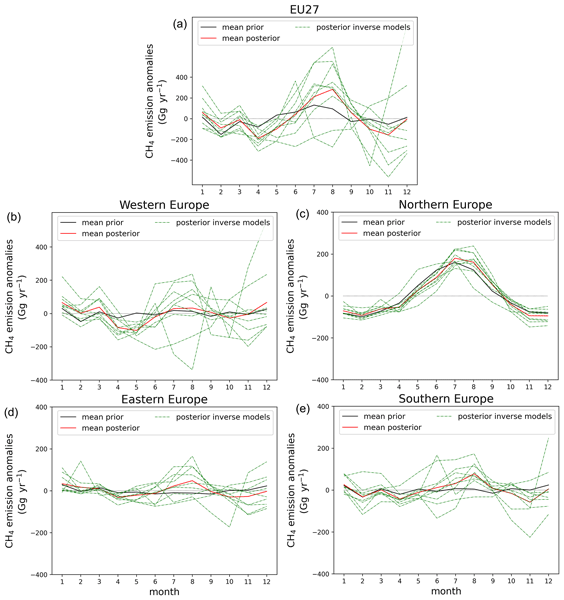
This paper describes a detailed study on CH4 European emissions, using different methodologies (9 total inverse models). The study spans over 15 years and provides detailed information on European CH4 emission trends and seasonality, using in-situ data, including Integrated Carbon Observation System (ICOS) network. Our results highlight the importance of improving details in the inversion setup, such as the treatment of lateral boundary conditions to narrow the uncertainty ranges further.
Hannah Nesser, Kevin W. Bowman, Matthew D. Thill, Daniel J. Varon, Cynthia A. Randles, Ashutosh Tewari, Felipe J. Cardoso-Saldaña, Emily Reidy, Joannes D. Maasakkers, and Daniel J. Jacob
Geosci. Model Dev., 18, 9279–9291, https://doi.org/10.5194/gmd-18-9279-2025, https://doi.org/10.5194/gmd-18-9279-2025, 2025
Short summary
Short summary
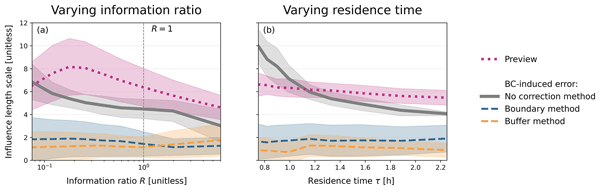
Regional analyses of atmospheric trace gases can improve knowledge of fluxes at high resolution but rely on specified boundary conditions (BCs) at the domain edges. Biases in the often-uncertain BCs propagate to the inferred fluxes. We develop a framework to explain how errors in the BCs influence the optimized fluxes, derive two metrics to estimate this influence, and compare two methods to correct for the biases. We demonstrate correcting BCs directly is more effective at reducing bias.
Bibhasvata Dasgupta, Malika Menoud, Carina van der Veen, Ingeborg Levin, Cordelia Veidt, Heiko Moossen, Sylvia Englund Michel, Peter Sperlich, Shinji Morimoto, Ryo Fujita, Taku Umezawa, Stephen Platt, Christine Groot Zwaaftink, Cathrine Lund Myhre, Rebecca Fisher, David Lowry, Euan G. Nisbet, James France, Ceres Woolley Maisch, Gordon Brailsford, Rowena Moss, Daisuke Goto, Sudhanshu Pandey, Sander Houweling, Nicola Warwick, and Thomas Röckmann
Atmos. Meas. Tech., 18, 6591–6607, https://doi.org/10.5194/amt-18-6591-2025, https://doi.org/10.5194/amt-18-6591-2025, 2025
Short summary
Short summary
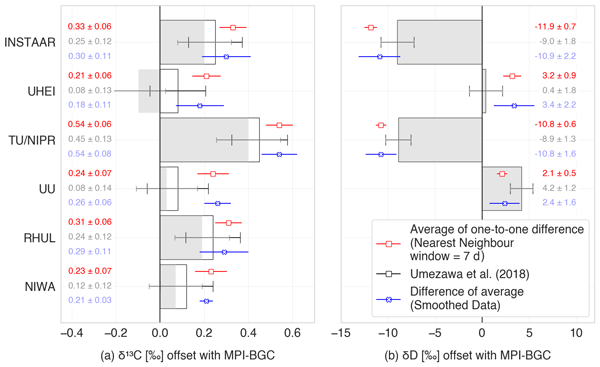
We combined long-term methane mole fraction and isotope measurements from eight laboratories that sample high-latitude stations to compare, offset correct and harmonise the datasets into a hemisphere merged timeseries. Because each laboratory uses slightly different methods, we adjusted the data to make it directly comparable. This allowed us to create a consistent record of atmospheric methane concentration and its isotopes from 1988 to 2023.
Arseniy Karagodin-Doyennel, Fredrik Jansson, Bart J. H. van Stratum, Hugo Denier van der Gon, Jordi Vilà-Guerau de Arellano, and Sander Houweling
Geosci. Model Dev., 18, 4571–4599, https://doi.org/10.5194/gmd-18-4571-2025, https://doi.org/10.5194/gmd-18-4571-2025, 2025
Short summary
Short summary
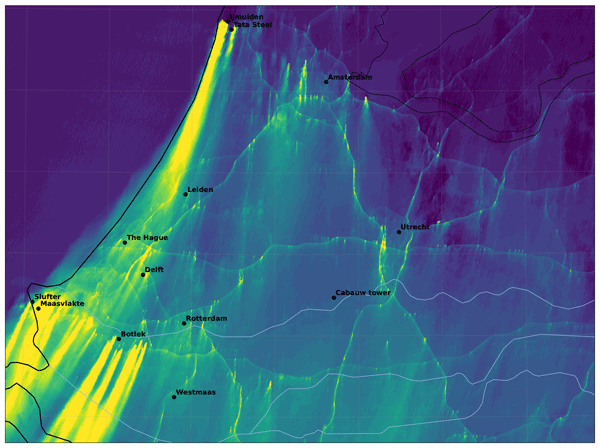
We introduce a new simulation platform based on the Dutch Atmospheric Large-Eddy Simulation (DALES) to simulate carbon dioxide (CO2) emissions and their dispersion in turbulent environments at a hectometer resolution. This model incorporates both anthropogenic emission inventories and online ecosystem fluxes. Simulation results for the main urban area in the Netherlands demonstrate the strong potential of DALES to improve CO2 emission modeling and to support mitigation strategies.
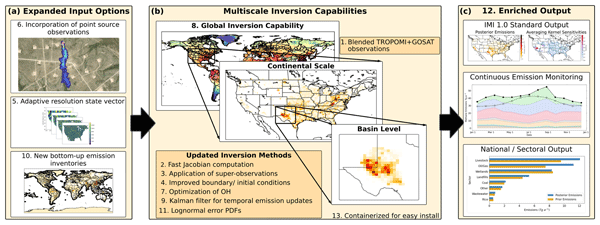
Lucas A. Estrada, Daniel J. Varon, Melissa Sulprizio, Hannah Nesser, Zichong Chen, Nicholas Balasus, Sarah E. Hancock, Megan He, James D. East, Todd A. Mooring, Alexander Oort Alonso, Joannes D. Maasakkers, Ilse Aben, Sabour Baray, Kevin W. Bowman, John R. Worden, Felipe J. Cardoso-Saldaña, Emily Reidy, and Daniel J. Jacob
Geosci. Model Dev., 18, 3311–3330, https://doi.org/10.5194/gmd-18-3311-2025, https://doi.org/10.5194/gmd-18-3311-2025, 2025
Short summary
Short summary
Reducing emissions of methane, a powerful greenhouse gas, is a top policy concern for mitigating anthropogenic climate change. The Integrated Methane Inversion (IMI) is an advanced, cloud-based software that translates satellite observations into actionable emissions data. Here we present IMI version 2.0 with vastly expanded capabilities. These updates enable a wider range of scientific and stakeholder applications from individual basin to global scales with continuous emissions monitoring.
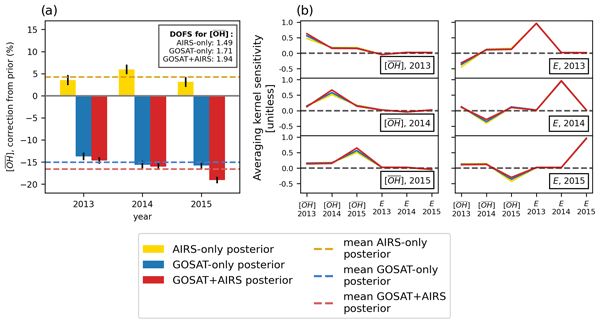
Elise Penn, Daniel J. Jacob, Zichong Chen, James D. East, Melissa P. Sulprizio, Lori Bruhwiler, Joannes D. Maasakkers, Hannah Nesser, Zhen Qu, Yuzhong Zhang, and John Worden
Atmos. Chem. Phys., 25, 2947–2965, https://doi.org/10.5194/acp-25-2947-2025, https://doi.org/10.5194/acp-25-2947-2025, 2025
Short summary
Short summary
The hydroxyl radical (OH) destroys many air pollutants, including methane. Global-mean OH cannot be directly measured, and thus it is inferred with the methyl chloroform (MCF) proxy. MCF is decreasing, and a replacement is needed. We use satellite observations of methane in two spectral ranges as a proxy for OH. We find shortwave infrared observations can characterize yearly OH and its seasonality but not the latitudinal distribution. Thermal infrared observations add little information.
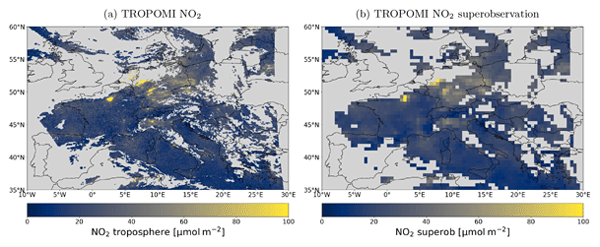
Pieter Rijsdijk, Henk Eskes, Arlene Dingemans, K. Folkert Boersma, Takashi Sekiya, Kazuyuki Miyazaki, and Sander Houweling
Geosci. Model Dev., 18, 483–509, https://doi.org/10.5194/gmd-18-483-2025, https://doi.org/10.5194/gmd-18-483-2025, 2025
Short summary
Short summary
Clustering high-resolution satellite observations into superobservations improves model validation and data assimilation applications. In our paper, we derive quantitative uncertainties for satellite NO2 column observations based on knowledge of the retrievals, including a detailed analysis of spatial error correlations and representativity errors. The superobservations and uncertainty estimates are tested in a global chemical data assimilation system and are found to improve the forecasts.
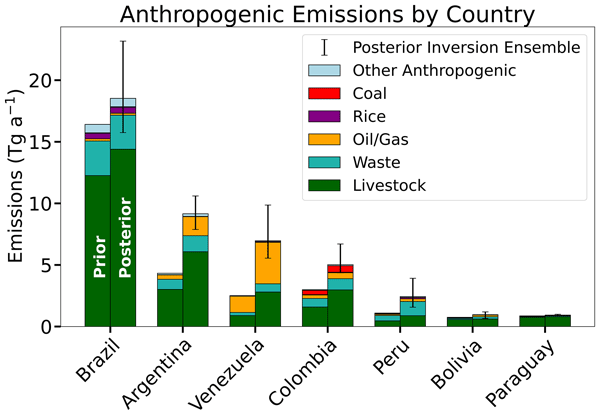
Sarah E. Hancock, Daniel J. Jacob, Zichong Chen, Hannah Nesser, Aaron Davitt, Daniel J. Varon, Melissa P. Sulprizio, Nicholas Balasus, Lucas A. Estrada, María Cazorla, Laura Dawidowski, Sebastián Diez, James D. East, Elise Penn, Cynthia A. Randles, John Worden, Ilse Aben, Robert J. Parker, and Joannes D. Maasakkers
Atmos. Chem. Phys., 25, 797–817, https://doi.org/10.5194/acp-25-797-2025, https://doi.org/10.5194/acp-25-797-2025, 2025
Short summary
Short summary
We quantify 2021 methane emissions in South America at up to 25 km × 25 km resolution using satellite methane observations. We find a 55 % upward adjustment to anthropogenic emission inventories, including those reported to the UN Framework Convention on Climate Change under the Paris Agreement. Our estimates match inventories for Brazil, Bolivia, and Paraguay but are much higher for other countries. Livestock emissions (65 % of anthropogenic emissions) show the largest discrepancies.
Gijs Leguijt, Joannes D. Maasakkers, Hugo A. C. Denier van der Gon, Arjo J. Segers, Tobias Borsdorff, Ivar R. van der Velde, and Ilse Aben
Atmos. Chem. Phys., 25, 555–574, https://doi.org/10.5194/acp-25-555-2025, https://doi.org/10.5194/acp-25-555-2025, 2025
Short summary
Short summary
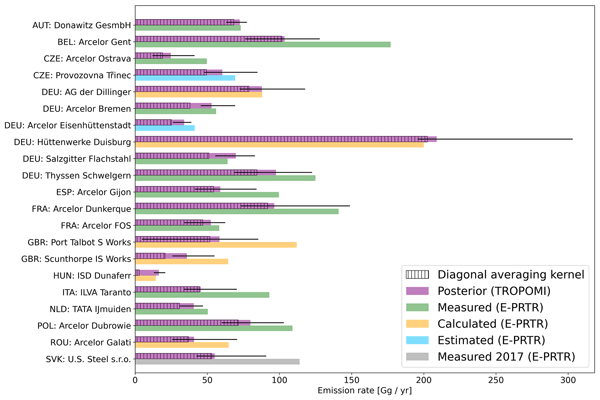
The production of steel coincides with large emissions of greenhouse gases and air pollutants including carbon monoxide. European facilities are required to report their emissions, which are estimated using a variety of methods. We evaluate these estimates using carbon monoxide concentrations measured via satellite. We find generally good agreement between our values and those reported but also identify some uncertainties, showing that satellites can provide insights into these emissions.
Ana Maria Roxana Petrescu, Glen P. Peters, Richard Engelen, Sander Houweling, Dominik Brunner, Aki Tsuruta, Bradley Matthews, Prabir K. Patra, Dmitry Belikov, Rona L. Thompson, Lena Höglund-Isaksson, Wenxin Zhang, Arjo J. Segers, Giuseppe Etiope, Giancarlo Ciotoli, Philippe Peylin, Frédéric Chevallier, Tuula Aalto, Robbie M. Andrew, David Bastviken, Antoine Berchet, Grégoire Broquet, Giulia Conchedda, Stijn N. C. Dellaert, Hugo Denier van der Gon, Johannes Gütschow, Jean-Matthieu Haussaire, Ronny Lauerwald, Tiina Markkanen, Jacob C. A. van Peet, Isabelle Pison, Pierre Regnier, Espen Solum, Marko Scholze, Maria Tenkanen, Francesco N. Tubiello, Guido R. van der Werf, and John R. Worden
Earth Syst. Sci. Data, 16, 4325–4350, https://doi.org/10.5194/essd-16-4325-2024, https://doi.org/10.5194/essd-16-4325-2024, 2024
Short summary
Short summary
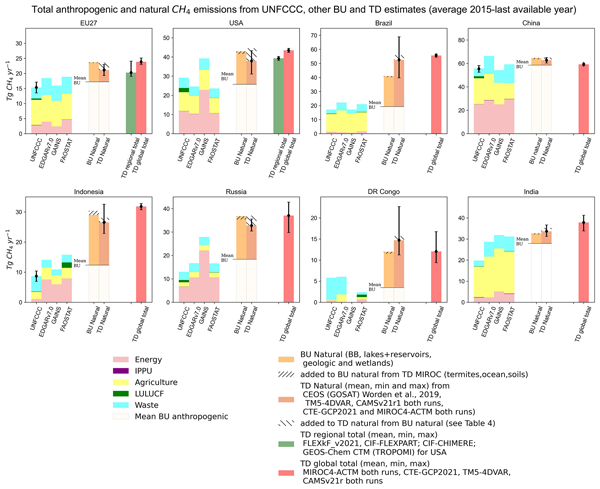
This study provides an overview of data availability from observation- and inventory-based CH4 emission estimates. It systematically compares them and provides recommendations for robust comparisons, aiming to steadily engage more parties in using observational methods to complement their UNFCCC submissions. Anticipating improvements in atmospheric modelling and observations, future developments need to resolve knowledge gaps in both approaches and to better quantify remaining uncertainty.
Brian Nathan, Joannes D. Maasakkers, Stijn Naus, Ritesh Gautam, Mark Omara, Daniel J. Varon, Melissa P. Sulprizio, Lucas A. Estrada, Alba Lorente, Tobias Borsdorff, Robert J. Parker, and Ilse Aben
Atmos. Chem. Phys., 24, 6845–6863, https://doi.org/10.5194/acp-24-6845-2024, https://doi.org/10.5194/acp-24-6845-2024, 2024
Short summary
Short summary
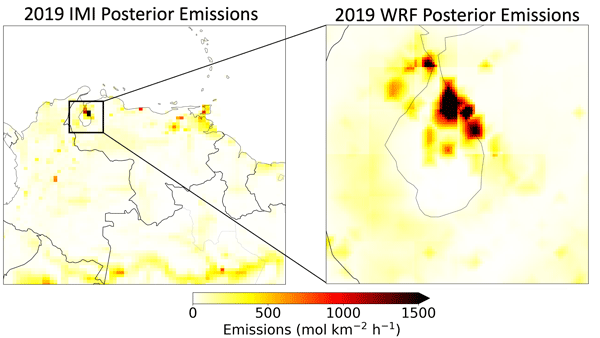
Venezuela's Lake Maracaibo region is notoriously hard to observe from space and features intensive oil exploitation, although production has strongly decreased in recent years. We estimate methane emissions using 2018–2020 TROPOMI satellite observations with national and regional transport models. Despite the production decrease, we find relatively constant emissions from Lake Maracaibo between 2018 and 2020, indicating that there could be large emissions from abandoned infrastructure.
Matthieu Dogniaux, Joannes D. Maasakkers, Daniel J. Varon, and Ilse Aben
Atmos. Meas. Tech., 17, 2777–2787, https://doi.org/10.5194/amt-17-2777-2024, https://doi.org/10.5194/amt-17-2777-2024, 2024
Short summary
Short summary
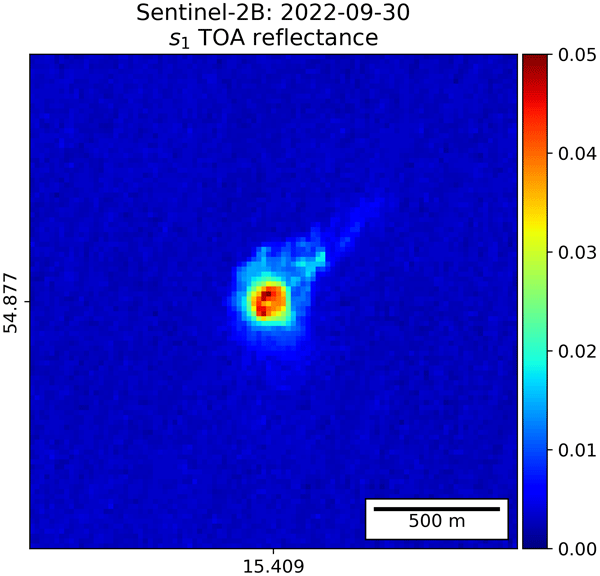
We analyze Landsat 8 (L8) and Sentinel-2B (S-2B) observations of the 2022 Nord Stream 2 methane leak and show how challenging this case is for usual data analysis methods. We provide customized calibrations for this Nord Stream 2 case and assess that no firm conclusion can be drawn from L8 or S-2B single overpasses. However, if we opportunistically assume that L8 and S-2B results are independent, we find an averaged L8 and S-2B combined methane leak rate of 502 ± 464 t h−1.
Hannah Nesser, Daniel J. Jacob, Joannes D. Maasakkers, Alba Lorente, Zichong Chen, Xiao Lu, Lu Shen, Zhen Qu, Melissa P. Sulprizio, Margaux Winter, Shuang Ma, A. Anthony Bloom, John R. Worden, Robert N. Stavins, and Cynthia A. Randles
Atmos. Chem. Phys., 24, 5069–5091, https://doi.org/10.5194/acp-24-5069-2024, https://doi.org/10.5194/acp-24-5069-2024, 2024
Short summary
Short summary
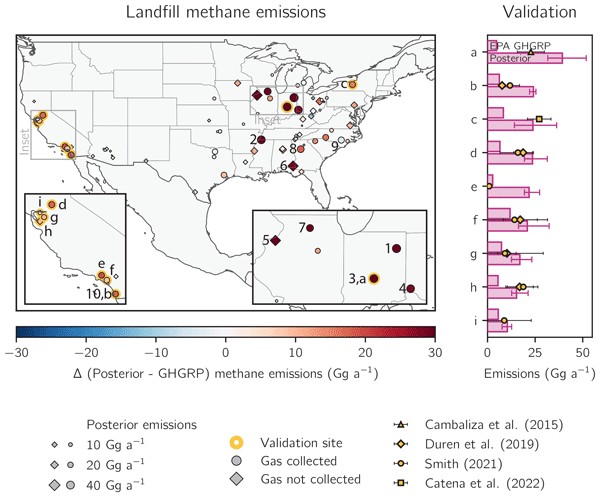
We quantify 2019 methane emissions in the contiguous US (CONUS) at a ≈ 25 km × 25 km resolution using satellite methane observations. We find a 13 % upward correction to the 2023 US Environmental Protection Agency (EPA) Greenhouse Gas Emissions Inventory (GHGI) for 2019, with large corrections to individual states, urban areas, and landfills. This may present a challenge for US climate policies and goals, many of which target significant reductions in methane emissions.
Tim A. van Kempen, Tim J. Rotmans, Richard M. van Hees, Carol Bruegge, Dejian Fu, Ruud Hoogeveen, Thomas J. Pongetti, Robert Rosenberg, and Ilse Aben
Atmos. Meas. Tech., 16, 4507–4527, https://doi.org/10.5194/amt-16-4507-2023, https://doi.org/10.5194/amt-16-4507-2023, 2023
Short summary
Short summary
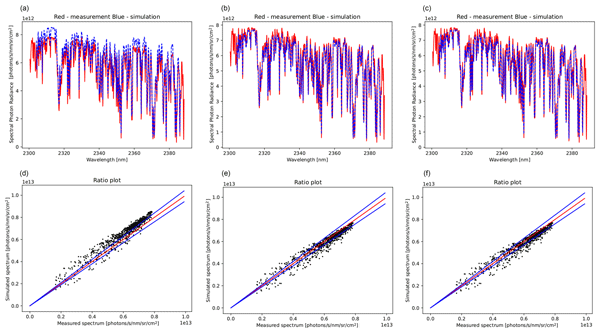
Validation of satellite measurements is essential for providing reliable and consistent products. In this paper, a validation method for TROPOMI-SWIR (Tropospheric Measurement Instrument in the short-wavelength infrared) is explored. TROPOMI-SWIR has been shown to be exceptionally stable, a necessity to explore the methodology. Railroad Valley, Nevada, is a prime location to perform the necessary measurements to validate the satellite measurements of TROPOMI-SWIR.
Berend J. Schuit, Joannes D. Maasakkers, Pieter Bijl, Gourav Mahapatra, Anne-Wil van den Berg, Sudhanshu Pandey, Alba Lorente, Tobias Borsdorff, Sander Houweling, Daniel J. Varon, Jason McKeever, Dylan Jervis, Marianne Girard, Itziar Irakulis-Loitxate, Javier Gorroño, Luis Guanter, Daniel H. Cusworth, and Ilse Aben
Atmos. Chem. Phys., 23, 9071–9098, https://doi.org/10.5194/acp-23-9071-2023, https://doi.org/10.5194/acp-23-9071-2023, 2023
Short summary
Short summary
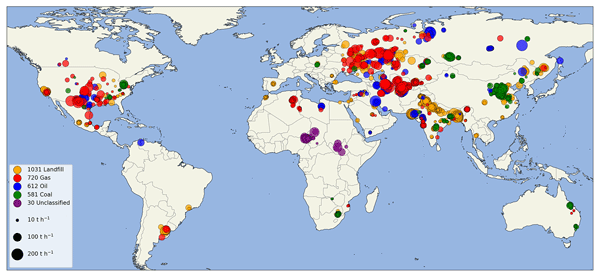
Using two machine learning models, which were trained on TROPOMI methane satellite data, we detect 2974 methane plumes, so-called super-emitters, in 2021. We detect methane emissions globally related to urban areas or landfills, coal mining, and oil and gas production. Using our monitoring system, we identify 94 regions with frequent emissions. For 12 locations, we target high-resolution satellite instruments to enlarge and identify the exact infrastructure responsible for the emissions.
Nicholas Balasus, Daniel J. Jacob, Alba Lorente, Joannes D. Maasakkers, Robert J. Parker, Hartmut Boesch, Zichong Chen, Makoto M. Kelp, Hannah Nesser, and Daniel J. Varon
Atmos. Meas. Tech., 16, 3787–3807, https://doi.org/10.5194/amt-16-3787-2023, https://doi.org/10.5194/amt-16-3787-2023, 2023
Short summary
Short summary
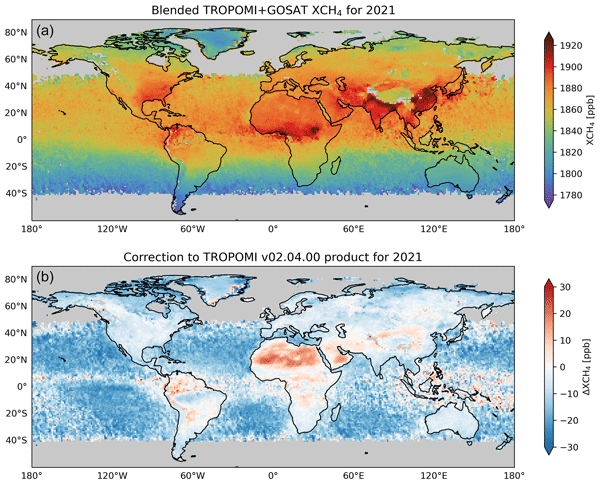
We use machine learning to remove biases in TROPOMI satellite observations of atmospheric methane, with GOSAT observations serving as a reference. We find that the TROPOMI biases relative to GOSAT are related to the presence of aerosols and clouds, the surface brightness, and the specific detector that makes the observation aboard TROPOMI. The resulting blended TROPOMI+GOSAT product is more reliable for quantifying methane emissions.
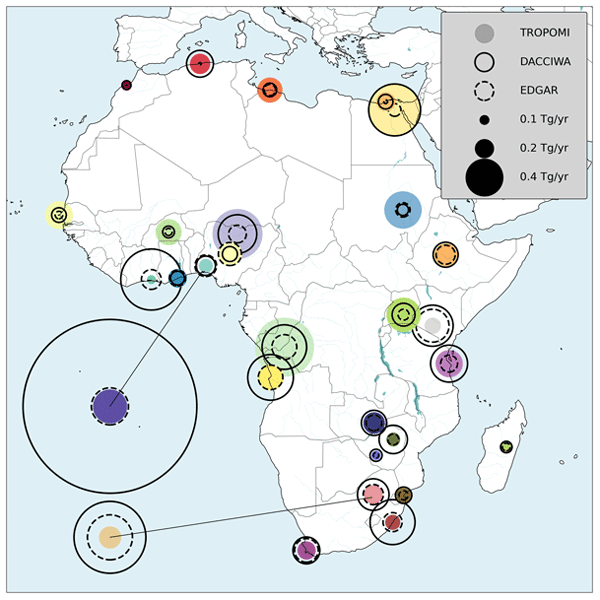
Gijs Leguijt, Joannes D. Maasakkers, Hugo A. C. Denier van der Gon, Arjo J. Segers, Tobias Borsdorff, and Ilse Aben
Atmos. Chem. Phys., 23, 8899–8919, https://doi.org/10.5194/acp-23-8899-2023, https://doi.org/10.5194/acp-23-8899-2023, 2023
Short summary
Short summary
We present a fast method to evaluate carbon monoxide emissions from cities in Africa. Carbon monoxide is important for climate change in an indirect way, as it is linked to ozone, methane, and carbon dioxide. Our measurements are made with a satellite that sees the entire globe every single day. This means that we can check from space whether the current knowledge of emission rates is up to date. We make the comparison and show that the emission rates in northern Africa are underestimated.
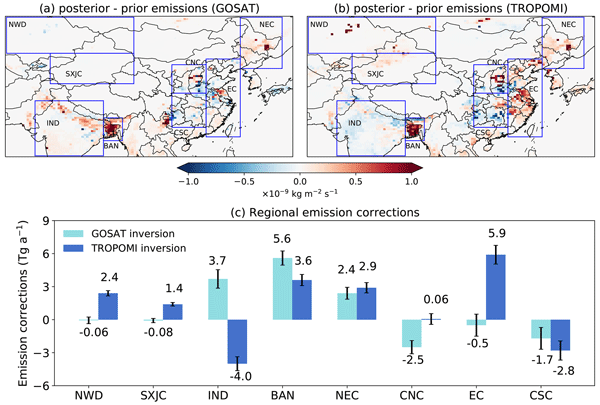
Ruosi Liang, Yuzhong Zhang, Wei Chen, Peixuan Zhang, Jingran Liu, Cuihong Chen, Huiqin Mao, Guofeng Shen, Zhen Qu, Zichong Chen, Minqiang Zhou, Pucai Wang, Robert J. Parker, Hartmut Boesch, Alba Lorente, Joannes D. Maasakkers, and Ilse Aben
Atmos. Chem. Phys., 23, 8039–8057, https://doi.org/10.5194/acp-23-8039-2023, https://doi.org/10.5194/acp-23-8039-2023, 2023
Short summary
Short summary
We compare and evaluate East Asian methane emissions inferred from different satellite observations (GOSAT and TROPOMI). The results show discrepancies over northern India and eastern China. Independent ground-based observations are more consistent with TROPOMI-derived emissions in northern India and GOSAT-derived emissions in eastern China.
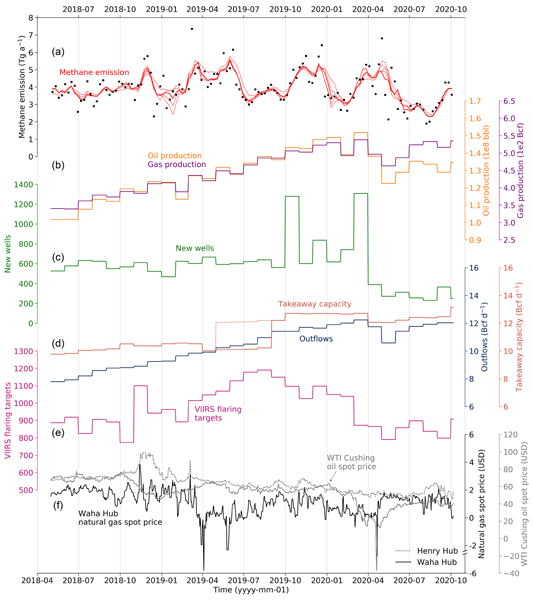
Daniel J. Varon, Daniel J. Jacob, Benjamin Hmiel, Ritesh Gautam, David R. Lyon, Mark Omara, Melissa Sulprizio, Lu Shen, Drew Pendergrass, Hannah Nesser, Zhen Qu, Zachary R. Barkley, Natasha L. Miles, Scott J. Richardson, Kenneth J. Davis, Sudhanshu Pandey, Xiao Lu, Alba Lorente, Tobias Borsdorff, Joannes D. Maasakkers, and Ilse Aben
Atmos. Chem. Phys., 23, 7503–7520, https://doi.org/10.5194/acp-23-7503-2023, https://doi.org/10.5194/acp-23-7503-2023, 2023
Short summary
Short summary
We use TROPOMI satellite observations to quantify weekly methane emissions from the US Permian oil and gas basin from May 2018 to October 2020. We find that Permian emissions are highly variable, with diverse economic and activity drivers. The most important drivers during our study period were new well development and natural gas price. Permian methane intensity averaged 4.6 % and decreased by 1 % per year.
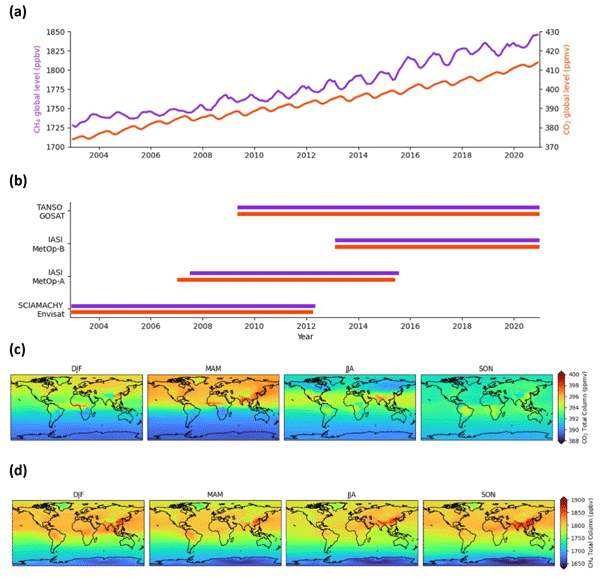
Anna Agustí-Panareda, Jérôme Barré, Sébastien Massart, Antje Inness, Ilse Aben, Melanie Ades, Bianca C. Baier, Gianpaolo Balsamo, Tobias Borsdorff, Nicolas Bousserez, Souhail Boussetta, Michael Buchwitz, Luca Cantarello, Cyril Crevoisier, Richard Engelen, Henk Eskes, Johannes Flemming, Sébastien Garrigues, Otto Hasekamp, Vincent Huijnen, Luke Jones, Zak Kipling, Bavo Langerock, Joe McNorton, Nicolas Meilhac, Stefan Noël, Mark Parrington, Vincent-Henri Peuch, Michel Ramonet, Miha Razinger, Maximilian Reuter, Roberto Ribas, Martin Suttie, Colm Sweeney, Jérôme Tarniewicz, and Lianghai Wu
Atmos. Chem. Phys., 23, 3829–3859, https://doi.org/10.5194/acp-23-3829-2023, https://doi.org/10.5194/acp-23-3829-2023, 2023
Short summary
Short summary
We present a global dataset of atmospheric CO2 and CH4, the two most important human-made greenhouse gases, which covers almost 2 decades (2003–2020). It is produced by combining satellite data of CO2 and CH4 with a weather and air composition prediction model, and it has been carefully evaluated against independent observations to ensure validity and point out deficiencies to the user. This dataset can be used for scientific studies in the field of climate change and the global carbon cycle.
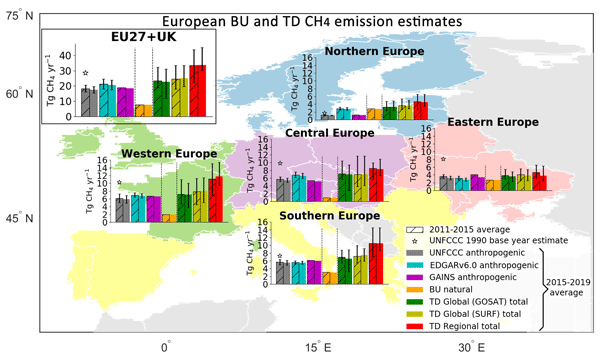
Ana Maria Roxana Petrescu, Chunjing Qiu, Matthew J. McGrath, Philippe Peylin, Glen P. Peters, Philippe Ciais, Rona L. Thompson, Aki Tsuruta, Dominik Brunner, Matthias Kuhnert, Bradley Matthews, Paul I. Palmer, Oksana Tarasova, Pierre Regnier, Ronny Lauerwald, David Bastviken, Lena Höglund-Isaksson, Wilfried Winiwarter, Giuseppe Etiope, Tuula Aalto, Gianpaolo Balsamo, Vladislav Bastrikov, Antoine Berchet, Patrick Brockmann, Giancarlo Ciotoli, Giulia Conchedda, Monica Crippa, Frank Dentener, Christine D. Groot Zwaaftink, Diego Guizzardi, Dirk Günther, Jean-Matthieu Haussaire, Sander Houweling, Greet Janssens-Maenhout, Massaer Kouyate, Adrian Leip, Antti Leppänen, Emanuele Lugato, Manon Maisonnier, Alistair J. Manning, Tiina Markkanen, Joe McNorton, Marilena Muntean, Gabriel D. Oreggioni, Prabir K. Patra, Lucia Perugini, Isabelle Pison, Maarit T. Raivonen, Marielle Saunois, Arjo J. Segers, Pete Smith, Efisio Solazzo, Hanqin Tian, Francesco N. Tubiello, Timo Vesala, Guido R. van der Werf, Chris Wilson, and Sönke Zaehle
Earth Syst. Sci. Data, 15, 1197–1268, https://doi.org/10.5194/essd-15-1197-2023, https://doi.org/10.5194/essd-15-1197-2023, 2023
Short summary
Short summary
This study updates the state-of-the-art scientific overview of CH4 and N2O emissions in the EU27 and UK in Petrescu et al. (2021a). Yearly updates are needed to improve the different respective approaches and to inform on the development of formal verification systems. It integrates the most recent emission inventories, process-based model and regional/global inversions, comparing them with UNFCCC national GHG inventories, in support to policy to facilitate real-time verification procedures.
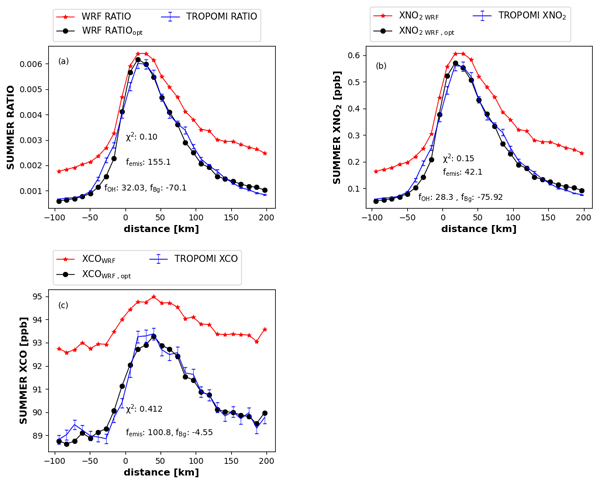
Srijana Lama, Sander Houweling, K. Folkert Boersma, Ilse Aben, Hugo A. C. Denier van der Gon, and Maarten C. Krol
Atmos. Chem. Phys., 22, 16053–16071, https://doi.org/10.5194/acp-22-16053-2022, https://doi.org/10.5194/acp-22-16053-2022, 2022
Short summary
Short summary
Hydroxyl radical (OH) is the important chemical species that determines the lifetime of some greenhouse gases and trace gases. OH plays a vital role in air pollution chemistry. OH has a short lifetime and is extremely difficult to measure directly. OH concentrations derived from the chemistry transport model (CTM) have uncertainties of >50 %. Therefore, in this study, OH is derived indirectly using satellite date in urban plumes.

Antje Inness, Ilse Aben, Melanie Ades, Tobias Borsdorff, Johannes Flemming, Luke Jones, Jochen Landgraf, Bavo Langerock, Philippe Nedelec, Mark Parrington, and Roberto Ribas
Atmos. Chem. Phys., 22, 14355–14376, https://doi.org/10.5194/acp-22-14355-2022, https://doi.org/10.5194/acp-22-14355-2022, 2022
Short summary
Short summary
The Copernicus Atmosphere Monitoring Service (CAMS) provides daily global air quality forecasts to users worldwide. One of the species of interest is carbon monoxide (CO), an important trace gas in the atmosphere with anthropogenic and natural sources, produced by incomplete combustion, for example, by wildfires. This paper looks at how well CAMS can model CO in the atmosphere and shows that the fields can be improved when blending CO data from the TROPOMI instrument with the CAMS model.
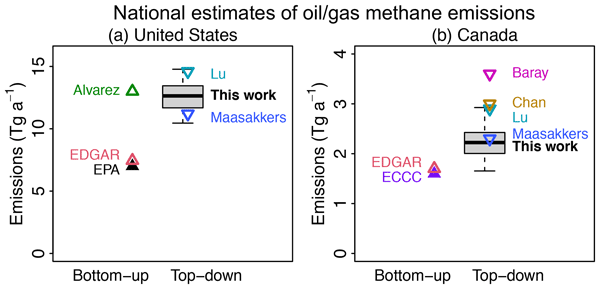
Lu Shen, Ritesh Gautam, Mark Omara, Daniel Zavala-Araiza, Joannes D. Maasakkers, Tia R. Scarpelli, Alba Lorente, David Lyon, Jianxiong Sheng, Daniel J. Varon, Hannah Nesser, Zhen Qu, Xiao Lu, Melissa P. Sulprizio, Steven P. Hamburg, and Daniel J. Jacob
Atmos. Chem. Phys., 22, 11203–11215, https://doi.org/10.5194/acp-22-11203-2022, https://doi.org/10.5194/acp-22-11203-2022, 2022
Short summary
Short summary
We use 22 months of TROPOMI satellite observations to quantity methane emissions from the oil (O) and natural gas (G) sector in the US and Canada at the scale of both individual basins as well as country-wide aggregates. We find that O/G-related methane emissions are underestimated in these inventories by 80 % for the US and 40 % for Canada, and 70 % of the underestimate in the US is from five O/G basins, including Permian, Haynesville, Anadarko, Eagle Ford, and Barnett.
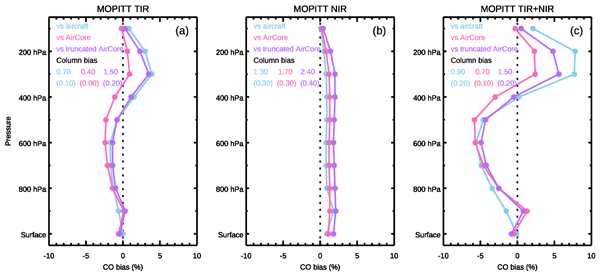
Sara Martínez-Alonso, Merritt N. Deeter, Bianca C. Baier, Kathryn McKain, Helen Worden, Tobias Borsdorff, Colm Sweeney, and Ilse Aben
Atmos. Meas. Tech., 15, 4751–4765, https://doi.org/10.5194/amt-15-4751-2022, https://doi.org/10.5194/amt-15-4751-2022, 2022
Short summary
Short summary
AirCore is a novel balloon sampling system that can measure, among others, vertical profiles of carbon monoxide (CO) from 25–30 km of altitude to near the surface. Our analyses of AirCore and satellite CO data show that AirCore profiles are suited for satellite data validation, the use of shorter aircraft vertical profiles in satellite validation results in small errors (1–3 percent points) mostly at 300 hPa and above, and the error introduced by clouds in TROPOMI land data is small (1–2 %).
Pieternel F. Levelt, Deborah C. Stein Zweers, Ilse Aben, Maite Bauwens, Tobias Borsdorff, Isabelle De Smedt, Henk J. Eskes, Christophe Lerot, Diego G. Loyola, Fabian Romahn, Trissevgeni Stavrakou, Nicolas Theys, Michel Van Roozendael, J. Pepijn Veefkind, and Tijl Verhoelst
Atmos. Chem. Phys., 22, 10319–10351, https://doi.org/10.5194/acp-22-10319-2022, https://doi.org/10.5194/acp-22-10319-2022, 2022
Short summary
Short summary
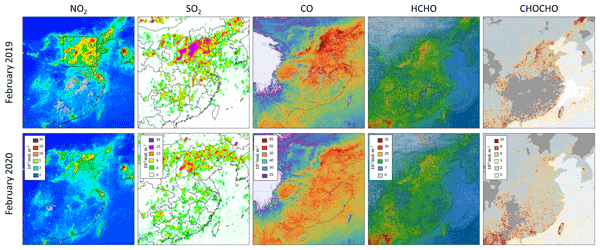
Using the COVID-19 lockdown periods as an example, we show how Sentinel-5P/TROPOMI trace gas data (NO2, SO2, CO, HCHO and CHOCHO) can be used to understand impacts on air quality for regions and cities around the globe. We also provide information for both experienced and inexperienced users about how we created the data using state-of-the-art algorithms, where to get the data, methods taking meteorological and seasonal variability into consideration, and insights for future studies.
Sudhanshu Pandey, Sander Houweling, and Arjo Segers
Geosci. Model Dev., 15, 4555–4567, https://doi.org/10.5194/gmd-15-4555-2022, https://doi.org/10.5194/gmd-15-4555-2022, 2022
Short summary
Short summary
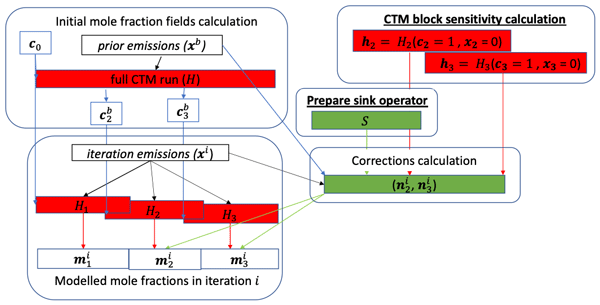
Inversions are used to calculate methane emissions using atmospheric mole-fraction measurements. Multidecadal inversions are needed to extract information from the long measurement records of methane. However, multidecadal inversion computations can take months to finish. Here, we demonstrate an order of magnitude improvement in wall clock time for an iterative multidecadal inversion by physical parallelization of chemical transport model.
John R. Worden, Daniel H. Cusworth, Zhen Qu, Yi Yin, Yuzhong Zhang, A. Anthony Bloom, Shuang Ma, Brendan K. Byrne, Tia Scarpelli, Joannes D. Maasakkers, David Crisp, Riley Duren, and Daniel J. Jacob
Atmos. Chem. Phys., 22, 6811–6841, https://doi.org/10.5194/acp-22-6811-2022, https://doi.org/10.5194/acp-22-6811-2022, 2022
Short summary
Short summary
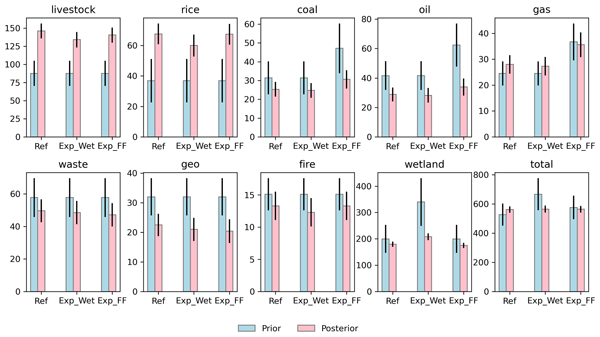
This paper is intended to accomplish two goals: 1) describe a new algorithm by which remotely sensed measurements of methane or other tracers can be used to not just quantify methane fluxes, but also attribute these fluxes to specific sources and regions and characterize their uncertainties, and 2) use this new algorithm to provide methane emissions by sector and country in support of the global stock take.
Carlos Alberti, Frank Hase, Matthias Frey, Darko Dubravica, Thomas Blumenstock, Angelika Dehn, Paolo Castracane, Gregor Surawicz, Roland Harig, Bianca C. Baier, Caroline Bès, Jianrong Bi, Hartmut Boesch, André Butz, Zhaonan Cai, Jia Chen, Sean M. Crowell, Nicholas M. Deutscher, Dragos Ene, Jonathan E. Franklin, Omaira García, David Griffith, Bruno Grouiez, Michel Grutter, Abdelhamid Hamdouni, Sander Houweling, Neil Humpage, Nicole Jacobs, Sujong Jeong, Lilian Joly, Nicholas B. Jones, Denis Jouglet, Rigel Kivi, Ralph Kleinschek, Morgan Lopez, Diogo J. Medeiros, Isamu Morino, Nasrin Mostafavipak, Astrid Müller, Hirofumi Ohyama, Paul I. Palmer, Mahesh Pathakoti, David F. Pollard, Uwe Raffalski, Michel Ramonet, Robbie Ramsay, Mahesh Kumar Sha, Kei Shiomi, William Simpson, Wolfgang Stremme, Youwen Sun, Hiroshi Tanimoto, Yao Té, Gizaw Mengistu Tsidu, Voltaire A. Velazco, Felix Vogel, Masataka Watanabe, Chong Wei, Debra Wunch, Marcia Yamasoe, Lu Zhang, and Johannes Orphal
Atmos. Meas. Tech., 15, 2433–2463, https://doi.org/10.5194/amt-15-2433-2022, https://doi.org/10.5194/amt-15-2433-2022, 2022
Short summary
Short summary
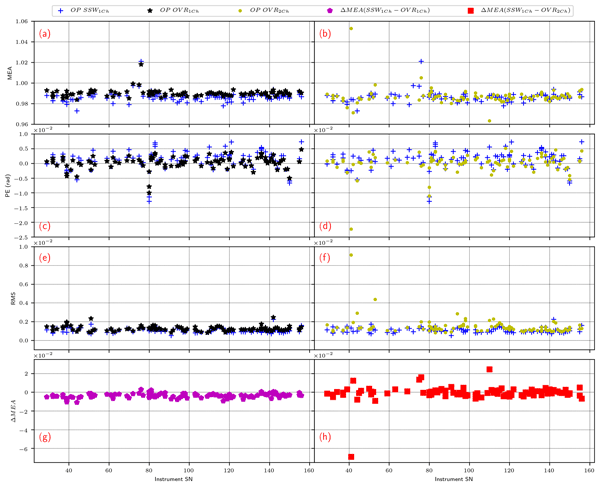
Space-borne greenhouse gas missions require ground-based validation networks capable of providing fiducial reference measurements. Here, considerable refinements of the calibration procedures for the COllaborative Carbon Column Observing Network (COCCON) are presented. Laboratory and solar side-by-side procedures for the characterization of the spectrometers have been refined and extended. Revised calibration factors for XCO2, XCO and XCH4 are provided, incorporating 47 new spectrometers.
Yousef Albuhaisi, Ype van der Velde, and Sander Houweling
Biogeosciences Discuss., https://doi.org/10.5194/bg-2022-55, https://doi.org/10.5194/bg-2022-55, 2022
Manuscript not accepted for further review
Short summary
Short summary
An important uncertainty in the modelling of methane emissions from natural wetlands is the wetland area. It is important to get the spatiotemporal covariance between the variables that drive methane emissions right for accurate quantification. Using high-resolution wetland and soil carbon maps, in combination with a simplified methane emission model that is coarsened in six steps from 0.005° to 1°, we find a strong relation between wetland emissions and the model resolution.

Xiao Lu, Daniel J. Jacob, Haolin Wang, Joannes D. Maasakkers, Yuzhong Zhang, Tia R. Scarpelli, Lu Shen, Zhen Qu, Melissa P. Sulprizio, Hannah Nesser, A. Anthony Bloom, Shuang Ma, John R. Worden, Shaojia Fan, Robert J. Parker, Hartmut Boesch, Ritesh Gautam, Deborah Gordon, Michael D. Moran, Frances Reuland, Claudia A. Octaviano Villasana, and Arlyn Andrews
Atmos. Chem. Phys., 22, 395–418, https://doi.org/10.5194/acp-22-395-2022, https://doi.org/10.5194/acp-22-395-2022, 2022
Short summary
Short summary
We evaluate methane emissions and trends for 2010–2017 in the gridded national emission inventories for the United States, Canada, and Mexico by inversion of in situ and satellite methane observations. We find that anthropogenic methane emissions for all three countries are underestimated in the national inventories, largely driven by oil emissions. Anthropogenic methane emissions in the US peak in 2014, in contrast to the report of a steadily decreasing trend over 2010–2017 from the US EPA.
Sabour Baray, Daniel J. Jacob, Joannes D. Maasakkers, Jian-Xiong Sheng, Melissa P. Sulprizio, Dylan B. A. Jones, A. Anthony Bloom, and Robert McLaren
Atmos. Chem. Phys., 21, 18101–18121, https://doi.org/10.5194/acp-21-18101-2021, https://doi.org/10.5194/acp-21-18101-2021, 2021
Short summary
Short summary
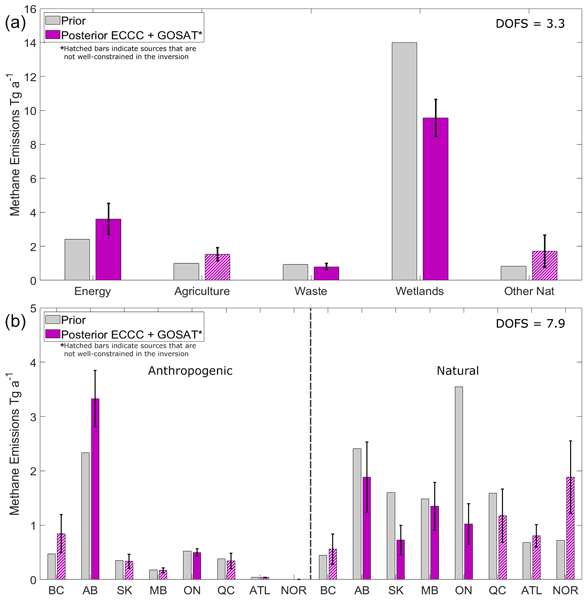
We use 2010–2015 surface and satellite observations to disentangle methane from anthropogenic and natural sources in Canada. Using a chemical transport model (GEOS-Chem), the mismatch between modelled and observed methane concentrations can be used to infer emissions according to Bayesian statistics. Compared to prior knowledge, we show higher anthropogenic emissions attributed to energy and/or agriculture in Western Canada and lower natural emissions from Boreal wetlands.
Luis Guanter, Cédric Bacour, Andreas Schneider, Ilse Aben, Tim A. van Kempen, Fabienne Maignan, Christian Retscher, Philipp Köhler, Christian Frankenberg, Joanna Joiner, and Yongguang Zhang
Earth Syst. Sci. Data, 13, 5423–5440, https://doi.org/10.5194/essd-13-5423-2021, https://doi.org/10.5194/essd-13-5423-2021, 2021
Short summary
Short summary
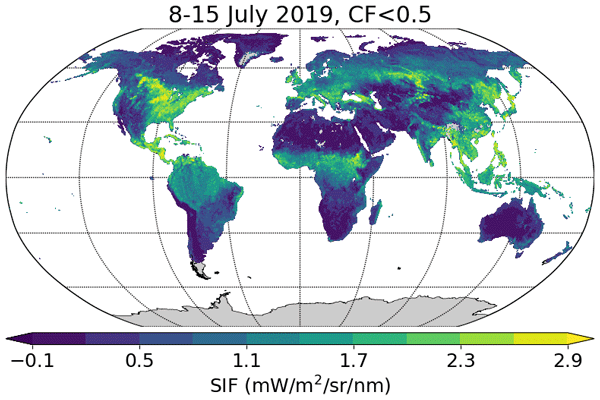
Sun-induced chlorophyll fluorescence (SIF) is an electromagnetic signal emitted by plants in the red and far-red parts of the spectrum. It has a functional link to photosynthesis and can be measured by satellite instruments, which makes it an important variable for the remote monitoring of the photosynthetic activity of vegetation ecosystems around the world. In this contribution we present a SIF dataset derived from the new Sentinel-5P TROPOMI missions.
Vilma Kangasaho, Aki Tsuruta, Leif Backman, Pyry Mäkinen, Sander Houweling, Arjo Segers, Maarten Krol, Ed Dlugokencky, Sylvia Michel, James White, and Tuula Aalto
Atmos. Chem. Phys. Discuss., https://doi.org/10.5194/acp-2021-843, https://doi.org/10.5194/acp-2021-843, 2021
Revised manuscript not accepted
Short summary
Short summary
Understanding the composition of carbon isotopes can help to better understand the changes in methane budgets. This study investigates how methane sources affect the seasonal cycle of the methane carbon-13 isotope during 2000–2012 using an atmospheric transport model. We found that emissions from both anthropogenic and natural sources contribute. The findings raise a need to revise the magnitudes, proportion, and seasonal cycles of anthropogenic sources and northern wetland emissions.
Cited articles
Abadi, M., Agarwal, A., Barham, P., Brevdo, E., Chen, Z., Citro, C., Corrado, G. S., Davis, A., Dean, J., Devin, M., Ghemawat, S., Goodfellow, I., Harp, A., Irving, G., Isard, M., Jia, Y., Jozefowicz, R., Kaiser, L., Kudlur, M., Levenberg, J., Mané, D., Monga, R., Moore, S., Murray, D., Olah, C., Schuster, M., Shlens, J., Steiner, B., Sutskever, I., Talwar, K., Tucker, P., Vanhoucke, V., Vasudevan, V., Viégas, F., Vinyals, O., Warden, P., Wattenberg, M., Wicke, M., Yu, Y., and Zheng, X.: TensorFlow: Large-Scale Machine Learning on Heterogeneous Systems, https://www.tensorflow.org/ (last access: 14 August 2026), 2015. a
Copernicus Atmospheric Monitoring Service: CAMS Methane Hotspot Explorer, https://atmosphere.copernicus.eu/ghg-services/cams-methane-hotspot-explorer (last access: 14 August 2026), 2025. a
David, F. N. and Johnson, N. L.: The probability integral transformation when parameters are estimated from the sample, Biometrika, 35, 182, https://doi.org/10.2307/2332638, 1948. a
De Jong, T. A., Maasakkers, J. D., Irakulis Loitxate, I., Randles, C. A., Tol, P., and Aben, I.: Daily global methane super emitter detection and source identification with sub daily tracking, Geophys. Res. Lett., 52, e2024GL111824, https://doi.org/10.1029/2024GL111824, 2025. a
De Myttenaere, A., Golden, B., Le Grand, B., and Rossi, F.: Mean absolute percentage error for regression models, Neurocomputing, 192, 38–48, https://doi.org/10.1016/j.neucom.2015.12.114, 2016. a
European Union: Harmonized Sentinel-2 MSI: MultiSpectral Instrument, Level-2A (SR), accessed via Google Earth Engine: COPERNICUS/S2_SR_HARMONIZED, https://doi.org/10.5270/S2_-znk9xsj, 2026. a, b
Frankenberg, C., Thorpe, A. K., Thompson, D. R., Hulley, G., Kort, E. A., Vance, N., Borchardt, J., Krings, T., Gerilowski, K., Sweeney, C., Conley, S., Bue, B. D., Aubrey, A. D., Hook, S., and Green, R. O.: Airborne methane remote measurements reveal heavy-tail flux distribution in Four Corners region, P. Natl. Acad. Sci. USA, 113, 9734–9739, https://doi.org/10.1073/pnas.1605617113, 2016. a
Gal, Y. and Ghahramani, Z.: Dropout as a Bayesian approximation: representing model uncertainty in deep learning, in: International Conference on Machine Learning, 1050–1059, PMLR, https://doi.org/10.48550/arXiv.1506.02142, 2016. a
Gao, S., Liu, X., Chen, Y., Jiang, J., Liu, Y., and Jiang, Y.: Atmospheric turbulence strength estimation using convolution neural network, IEEE Photonics J., 15, 1–7, https://doi.org/10.1109/JPHOT.2023.3314833, 2023. a
Grell, G. A., Peckham, S. E., Schmitz, R., McKeen, S. A., Frost, G., Skamarock, W. C., and Eder, B.: Fully coupled “online” chemistry within the WRF model, Atmos. Environ., 39, 6957–6975, https://doi.org/10.1016/j.atmosenv.2005.04.027, 2005. a
Guanter, L., Irakulis-Loitxate, I., Gorroño, J., Sánchez-García, E., Cusworth, D. H., Varon, D. J., Cogliati, S., and Colombo, R.: Mapping methane point emissions with the PRISMA spaceborne imaging spectrometer, Remote Sens. Environ., 265, 112671, https://doi.org/10.1016/j.rse.2021.112671, 2021. a
Guanter, L., Roger, J., Sharma, S., Valverde, A., Irakulis-Loitxate, I., Gorroño, J., Zhang, X., Schuit, B. J., Maasakkers, J. D., Aben, I., Groshenry, A., Benoit, A., Peyle, Q., and Zavala-Araiza, D.: Multisatellite data depicts a record-breaking methane leak from a well blowout, Environ. Sci. Tech. Let., 11, 825–830, https://doi.org/10.1021/acs.estlett.4c00399, 2024. a, b, c, d, e, f, g, h, i, j
Hakkarainen, J., Ialongo, I., Varon, D. J., Kuhlmann, G., and Krol, M. C.: Linear integrated mass enhancement: a method for estimating hotspot emission rates from space-based plume observations, Remote Sens. Environ., 319, 114623, https://doi.org/10.1016/j.rse.2025.114623, 2025. a
He, K., Zhang, X., Ren, S., and Sun, J.: Deep residual learning for image recognition, in: 2016 IEEE Conference on Computer Vision and Pattern Recognition (CVPR), IEEE, Las Vegas, NV, USA, https://doi.org/10.1109/CVPR.2016.90, 770–778, 2016. a
Hersbach, H., Bell, B., Berrisford, P., Biavati, G., Horányi, A., Muñoz Sabater, J., Nicolas, J., Peubey, C., Radu, R., Rozum, I., Schepers, D., Simmons, A., Soci, C., Dee, D., and Thépaut, J.-N.: ERA5 hourly data on pressure levels from 1940 to present, Copernicus Climate Change Service (C3S) Climate Data Store (CDS) [data set], https://doi.org/10.24381/cds.bd0915c6, 2023a. a, b
Hersbach, H., Bell, B., Berrisford, P., Biavati, G., Horányi, A., Muñoz Sabater, J., Nicolas, J., Peubey, C., Radu, R., Rozum, I., Schepers, D., Simmons, A., Soci, C., Dee, D., and Thépaut, J.-N.: ERA5 hourly data on single levels from 1940 to present, Copernicus Climate Change Service (C3S) Climate Data Store (CDS) [data set], https://doi.org/10.24381/cds.adbb2d47, 2023b. a, b, c
Hu, H., Landgraf, J., Detmers, R., Borsdorff, T., Aan De Brugh, J., Aben, I., Butz, A., and Hasekamp, O.: Toward global mapping of methane with TROPOMI: first results and intersatellite comparison to GOSAT, Geophys. Res. Lett., 45, 3682–3689, https://doi.org/10.1002/2018GL077259, 2018. a
Intergovernmental Panel On Climate Change (IPCC): Climate Change 2021 – The Physical Science Basis: Working Group I Contribution to the Sixth Assessment Report of the Intergovernmental Panel on Climate Change, Cambridge University Press, 1st edn., https://doi.org/10.1017/9781009157896, 2023. a
International Methane Emissions Observatory: Eye on Methane data platform | IMEO Eye on Methane, https://methanedata.unep.org (last access: 14 August 2026), 2026. a
Irakulis-Loitxate, I., Guanter, L., Maasakkers, J. D., Zavala-Araiza, D., and Aben, I.: Satellites detect abatable super-emissions in one of the world's largest methane hotspot regions, Environ. Sci. Technol., 56, 2143–2152, https://doi.org/10.1021/acs.est.1c04873, 2022. a
Jacob, D. J., Varon, D. J., Cusworth, D. H., Dennison, P. E., Frankenberg, C., Gautam, R., Guanter, L., Kelley, J., McKeever, J., Ott, L. E., Poulter, B., Qu, Z., Thorpe, A. K., Worden, J. R., and Duren, R. M.: Quantifying methane emissions from the global scale down to point sources using satellite observations of atmospheric methane, Atmos. Chem. Phys., 22, 9617–9646, https://doi.org/10.5194/acp-22-9617-2022, 2022. a
Jervis, D., McKeever, J., Durak, B. O. A., Sloan, J. J., Gains, D., Varon, D. J., Ramier, A., Strupler, M., and Tarrant, E.: The GHGSat-D imaging spectrometer, Atmos. Meas. Tech., 14, 2127–2140, https://doi.org/10.5194/amt-14-2127-2021, 2021. a
Jongaramrungruang, S., Thorpe, A. K., Matheou, G., and Frankenberg, C.: MethaNet – an AI-driven approach to quantifying methane point-source emission from high-resolution 2-D plume imagery, Remote Sens. Environ., 269, 112809, https://doi.org/10.1016/j.rse.2021.112809, 2022. a, b, c, d, e, f, g, h, i, j
Joyce, P., Ruiz Villena, C., Huang, Y., Webb, A., Gloor, M., Wagner, F. H., Chipperfield, M. P., Barrio Guilló, R., Wilson, C., and Boesch, H.: Using a deep neural network to detect methane point sources and quantify emissions from PRISMA hyperspectral satellite images, Atmos. Meas. Tech., 16, 2627–2640, https://doi.org/10.5194/amt-16-2627-2023, 2023. a, b, c, d, e, f, g
Krings, T., Gerilowski, K., Buchwitz, M., Reuter, M., Tretner, A., Erzinger, J., Heinze, D., Pflüger, U., Burrows, J. P., and Bovensmann, H.: MAMAP – a new spectrometer system for column-averaged methane and carbon dioxide observations from aircraft: retrieval algorithm and first inversions for point source emission rates, Atmos. Meas. Tech., 4, 1735–1758, https://doi.org/10.5194/amt-4-1735-2011, 2011. a
Krings, T., Gerilowski, K., Buchwitz, M., Hartmann, J., Sachs, T., Erzinger, J., Burrows, J. P., and Bovensmann, H.: Quantification of methane emission rates from coal mine ventilation shafts using airborne remote sensing data, Atmos. Meas. Tech., 6, 151–166, https://doi.org/10.5194/amt-6-151-2013, 2013. a
Krizhevsky, A., Sutskever, I., and Hinton, G. E.: ImageNet classification with deep convolutional neural networks, Commun. ACM, 60, 84–90, https://doi.org/10.1145/3065386, 2017. a
Lauvaux, T., Giron, C., Mazzolini, M., d'Aspremont, A., Duren, R., Cusworth, D., Shindell, D., and Ciais, P.: Global assessment of oil and gas methane ultra-emitters, Science, 375, 557–561, https://doi.org/10.1126/science.abj4351, 2022. a, b
LeCun, Y., Boser, B., Denker, J., Henderson, D., Howard, R., Hubbard, W., and Jackel, L.: Handwritten digit recognition with a back-propagation network, in: Advances in Neural Information Processing Systems, Vol. 2, Morgan-Kaufmann, https://papers.nips.cc/paper/1989/hash/53c3bce66e43be4f209556518c2fcb54-Abstract.html (last access: 14 August 2026), 1989. a
LeCun, Y., Kavukcuoglu, K., and Farabet, C.: Convolutional networks and applications in vision, in: Proceedings of 2010 IEEE International Symposium on Circuits and Systems, https://doi.org/10.1109/ISCAS.2010.5537907, 253–256, 2010. a
Lorente, A., Borsdorff, T., Butz, A., Hasekamp, O., aan de Brugh, J., Schneider, A., Wu, L., Hase, F., Kivi, R., Wunch, D., Pollard, D. F., Shiomi, K., Deutscher, N. M., Velazco, V. A., Roehl, C. M., Wennberg, P. O., Warneke, T., and Landgraf, J.: Methane retrieved from TROPOMI: improvement of the data product and validation of the first 2 years of measurements, Atmos. Meas. Tech., 14, 665–684, https://doi.org/10.5194/amt-14-665-2021, 2021. a
Lorente, A., Borsdorff, T., Martinez-Velarte, M. C., and Landgraf, J.: Accounting for surface reflectance spectral features in TROPOMI methane retrievals, Atmos. Meas. Tech., 16, 1597–1608, https://doi.org/10.5194/amt-16-1597-2023, 2023. a
Maasakkers, J. D., Omara, M., Gautam, R., Lorente, A., Pandey, S., Tol, P., Borsdorff, T., Houweling, S., and Aben, I.: Reconstructing and quantifying methane emissions from the full duration of a 38-day natural gas well blowout using space-based observations, Remote Sens. Environ., 270, 112755, https://doi.org/10.1016/j.rse.2021.112755, 2022a. a
Maasakkers, J. D., Varon, D. J., Elfarsdóttir, A., McKeever, J., Jervis, D., Mahapatra, G., Pandey, S., Lorente, A., Borsdorff, T., Foorthuis, L. R., Schuit, B. J., Tol, P., Van Kempen, T. A., Van Hees, R., and Aben, I.: Using satellites to uncover large methane emissions from landfills, Science Advances, 8, eabn9683, https://doi.org/10.1126/sciadv.abn9683, 2022b. a
Molod, A., Takacs, L., Suarez, M., Bacmeister, J., Song, I.-S., and Eichmann, A.: The GEOS-5 atmospheric general circulation model: Mean climate and development from MERRA to Fortuna, Tech. rep., Vol. 28, NASA/TM-2012-104606, 2012. a
NCEP: NCEP FNL Operational Model Global Tropospheric Analyses, continuing from July 1999, NOAA National Centers for Environmental Prediction [data set], https://doi.org/10.5065/D6M043C6, 2000. a, b
Ocko, I. B., Sun, T., Shindell, D., Oppenheimer, M., Hristov, A. N., Pacala, S. W., Mauzerall, D. L., Xu, Y., and Hamburg, S. P.: Acting rapidly to deploy readily available methane mitigation measures by sector can immediately slow global warming, Environ. Res. Lett., 16, 054042, https://doi.org/10.1088/1748-9326/abf9c8, 2021. a
O'Malley, T., Bursztein, E., Long, J., Chollet, F., Jin, H., Invernizzi, L., and others: KerasTuner, GitHub [code], https://github.com/keras-team/keras-tuner (last access: 14 August 2026), 2019. a
Pandey, S., Gautam, R., Houweling, S., Van Der Gon, H. D., Sadavarte, P., Borsdorff, T., Hasekamp, O., Landgraf, J., Tol, P., Van Kempen, T., Hoogeveen, R., Van Hees, R., Hamburg, S. P., Maasakkers, J. D., and Aben, I.: Satellite observations reveal extreme methane leakage from a natural gas well blowout, P. Natl. Acad. Sci. USA, 116, 26376–26381, https://doi.org/10.1073/pnas.1908712116, 2019. a
Pandey, S., van Nistelrooij, M., Maasakkers, J. D., Sutar, P., Houweling, S., Varon, D. J., Tol, P., Gains, D., Worden, J., and Aben, I.: Daily detection and quantification of methane leaks using Sentinel-3: a tiered satellite observation approach with Sentinel-2 and Sentinel-5p, Remote Sens. Environ., 296, 113716, https://doi.org/10.1016/j.rse.2023.113716, 2023. a
Plewa, T., Butz, A., Frankenberg, C., Thorpe, A. K., and Marshall, J.: Improvements of AI-driven emission estimation for point sources applied to high resolution 2-D methane-plume imagery, Remote Sens. Environ., 331, 115002, https://doi.org/10.1016/j.rse.2025.115002, 2025. a, b
Radman, A., Mahdianpari, M., Varon, D. J., and Mohammadimanesh, F.: S2MetNet: A novel dataset and deep learning benchmark for methane point source quantification using Sentinel-2 satellite imagery, Remote Sens. Environ., 295, 113708, https://doi.org/10.1016/j.rse.2023.113708, 2023. a
Roberts, C.: ML-SPERE Codebase for TROPOMI Methane Plume Emission Rate Estimation (v1.0.4, Publication Release, for use within SRON), Zenodo [software], https://doi.org/10.5281/zenodo.21934190, 2026. a
Roberts, C., de Jong, T., Maasakkers, J., and Huegens, T.: Simulated HYSPLIT Plume Output Resampled to TROPOMI Pixel Footprints, Zenodo [data set], https://doi.org/10.5281/zenodo.21792154, 2026a. a
Roberts, C., Maasakkers, J., and Schuit, B.: ML-SPERE Trained CNN Model File and Channel-Wise Standardisation Parameters for TROPOMI Methane Super-Emitter Emission Estimation, Zenodo [code], https://doi.org/10.5281/zenodo.21786440, 2026b. a
Roberts, C., van den Berg, A.-W., de Jong, T., Houweling, S., and Maasakkers, J. D.: Simulated WRF-Chem Plume Output Resampled to TROPOMI Pixel Footprints, Zenodo [data set], https://doi.org/10.5281/zenodo.21808941, 2026c. a
Roger, J., Irakulis-Loitxate, I., Valverde, A., Gorroño, J., Chabrillat, S., Brell, M., and Guanter, L.: High-resolution methane mapping with the EnMAP satellite imaging spectroscopy mission, IEEE T. Geosci. Remote, 62, 1–12, https://doi.org/10.1109/TGRS.2024.3352403, 2024. a
Schuit, B. J., Maasakkers, J. D., Bijl, P., Mahapatra, G., van den Berg, A.-W., Pandey, S., Lorente, A., Borsdorff, T., Houweling, S., Varon, D. J., McKeever, J., Jervis, D., Girard, M., Irakulis-Loitxate, I., Gorroño, J., Guanter, L., Cusworth, D. H., and Aben, I.: Automated detection and monitoring of methane super-emitters using satellite data, Atmos. Chem. Phys., 23, 9071–9098, https://doi.org/10.5194/acp-23-9071-2023, 2023a. a, b, c, d, e, f, g, h, i, j, k, l, m, n, o, p, q, r, s, t, u, v
Schuit, B. J., Maasakkers, J. D., Bijl, P., Mahapatra, G., Van den Berg, A.-W., Pandey, S., Lorente, A., Borsdorff, T., Houweling, S., Varon, D. J., McKeever, J., Jervis, D., Girard, M., Irakulis-Loitxate, I., Gorroño, J., Guanter, L., Cusworth, D. H., and Aben, I.: Dataset: all TROPOMI detected plumes for 2021. [Schuit et al. 2023: Automated detection and monitoring of methane super-emitters using satellite data], Zenodo [data set], https://doi.org/10.5281/zenodo.8087133, 2023b. a, b, c, d, e, f, g, h, i
Shorten, C. and Khoshgoftaar, T. M.: A survey on image data augmentation for deep learning, Journal of Big Data, 6, 60, https://doi.org/10.1186/s40537-019-0197-0, 2019. a
Skamarock, W. C., Klemp, J., Dudhia, J., Gill, D., Liu, Z., Berner, J., Wang, W., Powers, J., Duda, M., Barker, D., and others: A description of the advanced research WRF model version 4 (Vol. 145), National Center for Atmospheric Research, https://doi.org/10.5065/1dfh-6p97, 2019. a, b
Stein, A. F., Draxler, R. R., Rolph, G. D., Stunder, B. J. B., Cohen, M. D., and Ngan, F.: NOAA's HYSPLIT atmospheric transport and dispersion modeling system, B. Am. Meteorol. Soc., 96, 2059–2077, https://doi.org/10.1175/BAMS-D-14-00110.1, 2015. a, b
Thorpe, A. K., Green, R. O., Thompson, D. R., Brodrick, P. G., Chapman, J. W., Elder, C. D., Irakulis-Loitxate, I., Cusworth, D. H., Ayasse, A. K., Duren, R. M., Frankenberg, C., Guanter, L., Worden, J. R., Dennison, P. E., Roberts, D. A., Chadwick, K. D., Eastwood, M. L., Fahlen, J. E., and Miller, C. E.: Attribution of individual methane and carbon dioxide emission sources using EMIT observations from space, Science Advances, 9, eadh2391, https://doi.org/10.1126/sciadv.adh2391, 2023. a
Toshev, A. and Szegedy, C.: DeepPose: human pose estimation via deep neural networks, in: 2014 IEEE Conference on Computer Vision and Pattern Recognition, IEEE, Columbus, OH, USA, https://doi.org/10.1109/CVPR.2014.214, 1653–1660, 2014. a
United Nations Environment Programme: An Eye on Methane 2025: From Measurement to Momentum, United Nations Environment Programme, https://doi.org/10.59117/20.500.11822/48664, 2025. a
Varon, D. J., Jacob, D. J., McKeever, J., Jervis, D., Durak, B. O. A., Xia, Y., and Huang, Y.: Quantifying methane point sources from fine-scale satellite observations of atmospheric methane plumes, Atmos. Meas. Tech., 11, 5673–5686, https://doi.org/10.5194/amt-11-5673-2018, 2018. a, b, c, d, e, f, g
Varon, D. J., McKeever, J., Jervis, D., Maasakkers, J. D., Pandey, S., Houweling, S., Aben, I., Scarpelli, T., and Jacob, D. J.: Satellite discovery of anomalously large methane point sources from oil/gas production, Geophys. Res. Lett., 46, 13507–13516, https://doi.org/10.1029/2019GL083798, 2019. a, b
Veefkind, J., Aben, I., McMullan, K., Förster, H., De Vries, J., Otter, G., Claas, J., Eskes, H., De Haan, J., Kleipool, Q., Van Weele, M., Hasekamp, O., Hoogeveen, R., Landgraf, J., Snel, R., Tol, P., Ingmann, P., Voors, R., Kruizinga, B., Vink, R., Visser, H., and Levelt, P.: TROPOMI on the ESA Sentinel-5 precursor: a GMES mission for global observations of the atmospheric composition for climate, air quality and ozone layer applications, Remote Sens. Environ., 120, 70–83, https://doi.org/10.1016/j.rse.2011.09.027, 2012. a, b
Zavala-Araiza, D., Alvarez, R. A., Lyon, D. R., Allen, D. T., Marchese, A. J., Zimmerle, D. J., and Hamburg, S. P.: Super-emitters in natural gas infrastructure are caused by abnormal process conditions, Nat. Commun., 8, 14012, https://doi.org/10.1038/ncomms14012, 2017. a
Short summary
Methane is a powerful greenhouse gas, and cutting its emissions can slow climate change in the near term. We have created ML-SPERE, a new machine-learning based method that uses TROPOMI observations and weather data to better estimate emission rates for large methane plumes. It has proved more accurate than the Integrated Mass Enhancement (IME) method when tested on simulated satellite observations. When applied to real TROPOMI plumes, ML-SPERE produces estimates that agree with other methods.
Methane is a powerful greenhouse gas, and cutting its emissions can slow climate change in the...


